Spatial variations in sedimentary N-transformation rates in the North Sea (German Bight) - Biogeosciences
←
→
Page content transcription
If your browser does not render page correctly, please read the page content below
Biogeosciences, 17, 2839–2851, 2020
https://doi.org/10.5194/bg-17-2839-2020
© Author(s) 2020. This work is distributed under
the Creative Commons Attribution 4.0 License.

Spatial variations in sedimentary N-transformation rates in the
North Sea (German Bight)
Alexander Bratek1,2 , Justus E. E. van Beusekom1 , Andreas Neumann1 , Tina Sanders1 , Jana Friedrich1 ,
Kay-Christian Emeis1,2 , and Kirstin Dähnke1
1 Institute  of Coastal Research, Helmholtz-Zentrum Geesthacht, Geesthacht, Germany
2 Center   for Earth System Research and Sustainability, Institute for Geology, University of Hamburg, Hamburg, Germany

Correspondence: Kirstin Dähnke (kirstin.daehnke@hzg.de)

Received: 27 July 2019 – Discussion started: 7 August 2019
Revised: 20 February 2020 – Accepted: 7 April 2020 – Published: 28 May 2020

Abstract. In this study, we investigate the role of sedimen-      1   Introduction
tary N cycling in the southern North Sea. We present a budget
of ammonification, nitrification and sedimentary NO−   3 con-
sumption and denitrification in contrasting sediment types        The continental shelves and coastal margins make up for
of the German Bight (southern North Sea), including novel         < 9 % of the total area of ocean surface but are responsible
net ammonification rates. We incubated sediment cores from        for vast majority of the biogeochemical cycling both in the
four representative locations in the German Bight (perme-         water column and in the sediments (Jorgensen, 1983). For
able, semi-permeable and impermeable sediments) with la-          instance, 30 % of global marine primary production occurs
beled nitrate and ammonium to calculate benthic fluxes of         in coastal, estuarine and shelf systems (LOICZ, 1995), and
nitrate and ammonium and gross rates of ammonification            nutrient regulation in shelf sediments is a particularly valu-
and nitrification. Ammonium fluxes generally suggest oxic         able ecosystem service (Costanza et al., 1997).
degradation of organic matter, but elevated fluxes at one            The German Bight is part of the southern North Sea, is
sampling site point towards the importance of bioirriga-          bordered by densely populated and industrialized countries,
tion or short-term accumulation of organic matter. Sedimen-       and receives large amounts of nutrients via river discharge
tary fluxes of dissolved inorganic nitrogen are an important      (e.g., Rhine, Maas, Elbe, Weser, Ems) (Los et al., 2014). This
source for primary producers in the water column, support-        caused clear eutrophication symptoms such as phytoplank-
ing ∼ 7 % to 59 % of the average annual primary production,       ton blooms, oxygen deficiencies and macrobenthos kills es-
depending on water depth.                                         pecially during the 1980s (Hickel et al., 1993; von Western-
   We find that ammonification and oxygen penetration depth       hagen et al., 1986) in the North Sea. In the adjacent Wad-
are the main drivers of sedimentary nitrification, but this ni-   den Sea intense phytoplankton blooms, a possible decrease
trification is closely linked to denitrification. One-third of    in seagrass and massive blooms of opportunistic macroal-
freshly produced nitrate in impermeable sediment and two-         gae were attributed to eutrophication (e.g., Cadée and Hege-
thirds in permeable sediment were reduced to N2 . The semi-       mann, 2002). Since the mid-1980s, the nitrogen (N) loads
permeable and permeable sediments are responsible for ∼           into the German Bight have been decreasing, but the entire
68 % of the total benthic N2 production rates, which, based       SE North Sea is still flagged as an eutrophication problem
solely on our data, amounts to ∼ 1030 t N d−1 in the south-       area (OSPAR, 2010).
ern North Sea. Thus, we conclude that semi-permeable and             Nitrogen availability increases primary production on a
permeable sediments are the main sinks of reactive N, coun-       variety of spatial and temporal scales. At present, major ni-
teracting eutrophication in the southern North Sea (German        trogen sources for the southern North Sea are agricultural and
Bight).                                                           urban waste water and, to a lesser extent, a variety of reac-
                                                                  tive N emissions (e.g., nitrogen oxides from burning fossil)
                                                                  (Emeis et al., 2015).

Published by Copernicus Publications on behalf of the European Geosciences Union.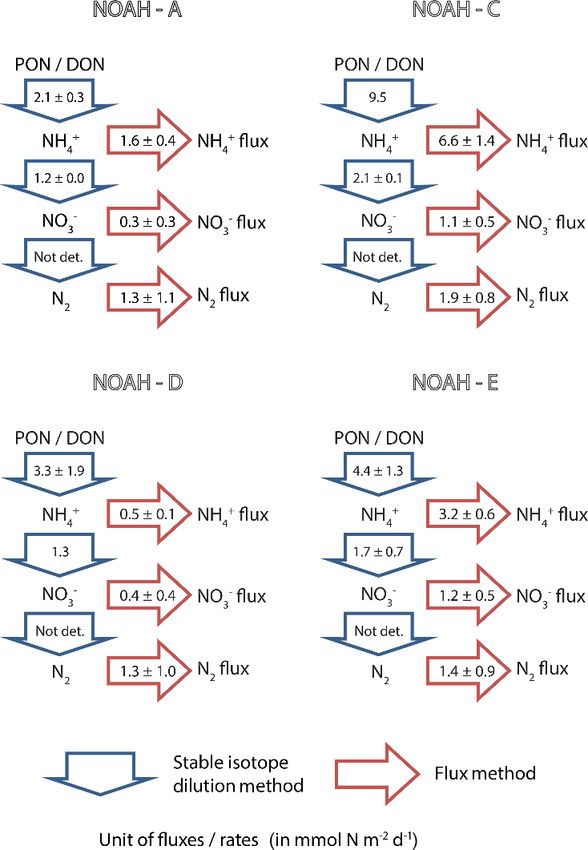
2840                                                  A. Bratek et al.: Sedimentary N-transformation rates in the North Sea

   Internal N cycling in sediments (e.g., assimilation, am-        (Koike and Hattori, 1978; Nishio et al., 2001) can be used to
monification and nitrification) changes the distribution and       estimate gross N-transformation rates by measuring the iso-
speciation of fixed N but not the overall amount of N avail-       topic dilution of the substrate and product pools (e.g., Burger
able for primary production (Casciotti, 2016). Reduction of        and Jackson, 2003). In this study, we used the isotope dilu-
reactive nitrogen through denitrification and anammox in           tion method with labeled NH+                  −
                                                                                                     4 and NO3 in separate sedi-
anoxic conditions back to unreactive N2 , however, does re-        ment cores to measure gross ammonification and gross nitri-
move N from the biogeochemical cycle (Neumann et al.,              fication. The net rates are determined by the sediment nutri-
2017).                                                             ent fluxes. To measure denitrification, we determined the pro-
   Because these eliminating processes are confined to sub-        duced N2 independently of the labeling in the core. The sed-
oxic and anoxic conditions, they only occur in sediments in        iment core incubation experiment setup can never reproduce
the generally oxygenated North Sea. Due to its putative rele-      the identical conditions related to the advective processes in
vance as an ecosystem service, denitrification has been sub-       permeable sediments. Nevertheless this method has advan-
ject to many studies, but ammonification as a source of N          tages over just balancing sediment–water exchanges: (1) the
to primary production has so far received much less atten-         appearance of 15 N in the NH+   4 pool during the incubation al-
tion. This is in part due to the complexity created by coupled     lows an estimate of ammonification rates, and (2) the isotopic
ammonification–nitrification in which different N processes,       dilution of NO−  3 tracks nitrification rates.
such as assimilation and denitrification, interact and affect         This study is conducted within the project North Sea Ob-
the NH+              −
         4 and NO3 concentrations in pore waters. To our           servation and Assessment of Habitats (NOAH). One im-
knowledge, no ammonification rates in the North Sea have           portant aspect of the project is to investigate the biogeo-
been quantified, whereas nitrification rates in permeable sed-     chemical status and functions of the sea floor, especially ni-
iments were found to be on the same order of magnitude as          trogen cycling, to gauge the eutrophication mitigation po-
denitrification rates (< 0.1 to ∼ 3.0 mmol m−2 d−1 ; Table 1)      tential in light of continuing high human pressures (https:
(Marchant et al., 2016). N loss in the German Bight has been       //www.noah-project.de, last access: 17 May 2020).
studied by several authors (e.g., Deek et al., 2013), showing         In this paper, we investigate internal N rates of ammonifi-
high spatial, temporal and seasonal variability.                   cation, nitrification and denitrification at four stations across
   The main N loss process in the North Sea is denitrifica-        sediment types (clay–silt, fine sand, coarse sand) in the
tion, whereas anammox plays a minor role (Bale et al., 2014;       German Bight (North Sea) during late summer (August–
Marchant et al., 2016). The main drivers of denitrification        September) 2016. To assess the internal sediment N pro-
are organic matter content and permeability of the sediment        cesses and the rates of reactive N release to the water col-
(Neumann, 2012), and recent studies suggest that permeable         umn, we incubated sediment cores amended with 15 NH+           4
sediments account for about 90 % of the total benthic NO−      3   and 15 NO− 3 . We quantify the benthic gross and net nitrifica-
consumption in the German Bight (Neumann et al., 2017).            tion and ammonification rates and evaluate the environmental
   Quantifying N dynamics based solely on changes in N             controls underlying spatial variabilities. We further discuss
concentrations provides limited insight into underlying re-        the role of ammonification as a source of reactive nitrogen
actions, as only net changes can be observed. Previous au-         for primary producers, of nitrification and of denitrification
thors used different methods for determination of specific N       in the southern North Sea.
rates. Lohse et al. (1993) used the acetylene block method,
core flux incubations and isotope pairing in types of the early
1990s to determine denitrification rates in a variety of sedi-     2     Material and methods
ment types (Table 1). Deek et al. (2013, 2011) investigated N
turnover in the Wadden Sea and in the extended Elbe estuary        2.1    Study site and sampling strategy
using core flux incubations and isotope pairing. Marchant et
al. (2016) measured denitrification rates in permeable sedi-       The study site is in the German Bight (southern North Sea),
ments obtained from slurry incubations and percolated sed-         an area that is strongly influenced by nutrient inputs from
iment cores. More recently, Neumann et al. (2017) used             large continental rivers. The salinity in the coastal zone of
pore-water NO−   3 concentration gradient profiles to determine    the North Sea ranges between ∼ 30 and 35, and the aver-
NO− 3  consumption    rates in the German Bight.                   age flushing time is 33 d (Lenhart and Pohlmann, 1997). The
   Stable isotope techniques offer several approaches to           sampling was performed in August and September 2016 dur-
quantify N turnover processes, and 15 N tracer studies             ing R/V Heincke cruise HE 471 in the German Bight (Fig. 1).
have been widely used to determine N-transformation rates             The sampling sites are part of the NOAH assessment
(e.g., nitrification and denitrification) (Brase et al., 2018;     scheme (Fig. 1). Samples were taken from four sites (NOAH-
Sanders et al., 2018). The isotope dilution method can be          A, NOAH-C, NOAH-D and NOAH-E) with different wa-
used to distinguish between net and gross rates and so help        ter depth and sediment characteristics (Table 2). The sites
to unravel several N processes, such as ammonification and         represent typical sediment types based on statistics of gran-
assimilation or nitrification and denitrification. 15 N dilution   ulometric properties, organic matter content, permeability

Biogeosciences, 17, 2839–2851, 2020                                                   https://doi.org/10.5194/bg-17-2839-2020
A. Bratek et al.: Sedimentary N-transformation rates in the North Sea 2841
Table 1. Rates of nitrification, dissimilatory nitrogen reduction to ammonia (DNRA), anaerobic ammonia oxidation (anammox) and denitri-
fication (DNIT) (in µmol N m−2 d−1 ) in the North Sea of other published data.
Location Nitrification DNRA Anammox DNIT rate/ Sediment Corg C:N Sampling Method Reference
NO−
3 uptake type time
(µmol m−2 d−1 ) (−) (% dry wt) (atom) (−)
1233 ± 12 N.D. N.D. 1314 ± 1087 0.03 < 0.01
Medium sand
German Bight 1739 ± 695 N.D. N.D. 1355 ± 876 0.04 0.01 August/
SIDM This study
(North Sea) 1271 N.D. N.D. 1306 ± 1042 Fine sand 0.21 0.03 September 2016
2069 ± 63 N.D. N.D. 1915 ± 831 Clay/silt 0.73 0.10
0.0 November 2010
0.2 February 2011
Dutch coast N.D. N.D. N.D. Fine sand 0.03 N.D.
1.3 May 2011
0.6 August 2011
0.0 Muddy November 2010
2.3 sand/ February 2011 SSI Bale et al. (2014)
Oyster Ground N.D. N.D. N.D. 0.30 N.D.
10.4 clay/ May 2011
12.8 silt August 2011
0.0 November 2010
0.8 February 2011
North Dogger N.D. N.D. N.D. Fine sand 0.03 N.D.
0.0 May 2011
1.1 August 2011
771a 0.6 6.0
March 2009
1215a 0.1
N.D.
Elbe estuary 3200a 0.1
N.D. N.D. N.D. Coarse sand IPT Deek et al. (2013)
coastal zones 864a 0.6 6.0
1425a 0.2 September 2009
47a 0.1 N.D.
140a 0.2
288 ± 144 12.0a August 1991
Oyster Ground 0.12 6.0
192 ± 96 19.2a February 1992
Muddy sand
216 21.6a August 1991
Weiss Bank 0.16 8.0
120 ± 120 16.8a February 1992
432 ± 168 2.4a August 1991
Tail End 0.16 5.3
264 ± 120 0a February 1992
N.D. N.D. Fine sand MABT Lohse et al. (1993)
408 ± 216 9.6a August 1991
Esbjerg 0.06 6.0
168 ± 168 91.2a February 1992
0 45.6a August 1991
Helgoland Silt 1.28 8.5
216 ± 1220 196.8a February 1992
264 ± 72 4.8a August 1991
Elbe Rinne 0.46 9.2
288 ± 96 31.2a February 1992
Muddy sand
624 ± 288 16.8a August 1991
Frisian Front 0.46 9.2
192 ± 72 24.0a February 1992
81.6 ± 64.8 372 ± 132a June 1993
Coarse sand
11 ± 2 44.5 ± 13.5a April 1994
Sylt N.D. N.D. N.D. N.D. IPT, SIDM Jensen et al. (1996)
3.8 ± 1.6 17 ± 4a Fine sand April 1994
1116 ± 924 75 ± 39a March 1993
Muddy sand
19.5 ± 9.5 103.5 ± 17.5a April 1994
1150 ± 700 20 ± 5 870 ± 100a Fine sand
Helgoland N.D. N.D. N.D. May 2012 SIDM Marchant et al. (2016)
210 ± 50 250 ± 50 2280 ± 300a Medium sand
2980 ± 420 110 ± 60 520 ± 30a Coarse sand
24.0 48a 0.05 8.1 April 2007
24.0 72a 0.06 7.4 May 2007
Sean Gras 0 120a Medium sand 0.10 8.5 September 2007
48.0 144a 0.05 6.6 October 2007
0 24a N.D. N.D. April 2008
24 288a 0.28 10.2 February 2007
24 120a 0.22 9.0 April 2007
N.D. N.D. 24 120a 0.20 8.4 May 2007 IPT Neubacher et al. (2011)
Oyster Ground Muddy sand
120 408a 0.22 9.2 September 2007
144 504a 0.23 9.4 October 2007
48 144a 0.27 8.7 April 2008
0 24a 0.45 10.2 February 2007
0 96a 0.45 9.4 April 2007
North Dogger 24 168a Muddy sand 0.42 9.7 May 2007
48 288a 0.46 9.7 September 2007
48 264a 0.38 9.6 October 2007
20.5 ± 4.5b 0.37 ± 0.02 May 2009
Mud
German 28.5 ± 23.5b 0.16 ± 0.12 February 2010
Bight/ N.D. N.D. N.D. 8 ± 8b 0.13 ± 0.10 N.D. May 2009 PWMF Neumann et al. (2017)
Muddy sand
Dogger 12.5 ± 12.5b 0.10 ± 0.08 February 2010
Bank 59.5 ± 25.5b 0.16 ± 0.13 May 2009
Sand
99 ± 35.0b 0.02 February 2010
N.D. – not determined. a Denitrification. b NO−3 uptake. Abbreviation of methods: SIDM – sediment isotope dilution method, MABT – modified acetylene block technique, SSI – sediment slurry incubations, PWMF – pore-water
mean fitting – and IPT – isotope-pairing technique.
https://doi.org/10.5194/bg-17-2839-2020 Biogeosciences, 17, 2839–2851, 20202842 A. Bratek et al.: Sedimentary N-transformation rates in the North Sea
Table 2. Characteristics of bottom water and sediment characteristics of the sampled stations in the North Sea (https://doi.org/10.1594/
PANGAEA.846041, last access: 17 May 2020). Corg means organic carbon content, TN means total nitrogen content of the surface sediment
and OPD means oxygen penetration depth in the sediment.
Location Depth Sediment Incubation Sediment Corg TN Porosity Permeability Temp. Salinity OPD
(−) (m) core (−) time (h) type (−) (%) (−) (m2 ) (◦ C) (−) (mm)
NOAH-A 31.0 1 24 Medium 0.03∗ ≤ 0.01∗ 0.37 1.7 × 10⁻¹⁰ 19.1 33.7 > 15
2 24 sand
3 18
4 24
NOAH-C 25.4 1 24 Clay/ 0.73 0.10 0.56 1 × 10⁻¹⁵ 19.1 32.5 3.6
2 24 silt
3 24
NOAH-D 38.0 1 18 Fine 0.21 0.03 0.43 1.4 × 10⁻¹³ 18.9 33.0 2.4
2 24 sand
3 24
NOAH-E 28.4 1 18 Medium 0.04 0.01 0.41 8.8 × 10⁻¹² 18.7 32.4 4.2
2 18 sand
3 24
4 24
∗ estimated.
Figure 2. Schematic illustration of the experimental setup. Four
sediment cores were incubated to measure benthic fluxes of oxygen,
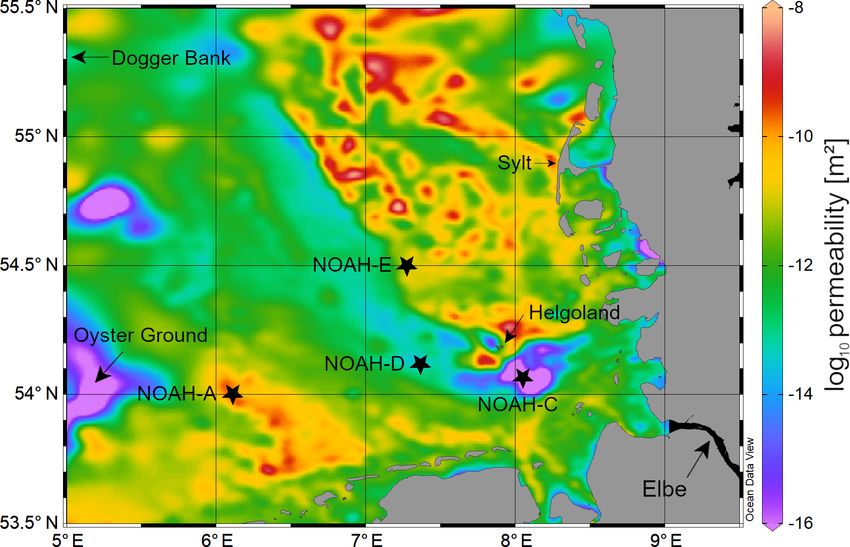
Figure 1. Map showing the sampling stations NOAH-A, NOAH- ammonium, nitrate and N2 . Two of these flux cores were amended
C, NOAH-D and NOAH-E in the German Bight in the North Sea. with either 15 NH+ 15 −
Colored areas show the spatial variability in surface sediment per- 4 or NO3 for the measurement of gross rates of
ammonification and nitrification, respectively.
meability (https://doi.org/10.1594/PANGAEA.872712, last access:
17 May 2020).
ment multicores equipped with acrylic tubes (PMA) with an
and water depth assessed during former cruises (https://doi. inner diameter of 10 cm and a length of 60 cm were used.
org/10.1594/PANGAEA.846041, last access: 17 May 2020). Four intact sediment cores from each station (exception: at
Organic matter and C/N ratio data from cruises HE 383 station NOAH-D, only three cores could successfully be re-
(July 2012) and HE 447 (June 2015) were used. trieved) were incubated in a gas-tight batch-incubation setup
for 24 h (Fig. 2) in the ship’s laboratory at an in situ temper-
2.2 Core sampling and incubation ature (∼ 19 ◦ C) directly after sampling. Cores were handled
carefully to avoid disturbance that could alter benthic fluxes.
At each station (NOAH-A, NOAH-C, NOAH-D and NOAH- Cores were incubated in the dark, and the overlying site water
E) both water samples and sediment samples were taken. was gently stirred with a magnetic stirrer, avoiding sediment
Water samples were taken with Niskin bottles attached to resuspension. The overlying water column was adjusted to a
a CTD with additional chlorophyll and O2 sensors. Sedi- height of 20 cm. Water temperature and oxygen concentra-
Biogeosciences, 17, 2839–2851, 2020 https://doi.org/10.5194/bg-17-2839-2020A. Bratek et al.: Sedimentary N-transformation rates in the North Sea 2843
tion of the overlying water of sediment cores were measured elemental analyzer (Carlo Erba, NA 1500) The total organic
continuously with optodes (PyroScience, Germany). carbon content was analyzed after removal of inorganic car-
To measure gross ammonification, two sediment cores bon using 1 mol L−1 hydrochloric acid. The standard devia-
(station NOAH-D: one core only) were enriched with 15 NH+ 4 tion of sediment samples was better than 0.6 % for Corg and
(50 at. %; the other two cores were amended with 15 NO− 3 0.08 % for N determination.
(50 at. %) for an assessment of gross nitrification (Fig. 2). Permeability and porosity of the sediments were con-
NH+ −
4 and NO3 concentrations of the added tracer solution ducted with sediments from the cruise HE 471, and the meth-
were adjusted to bottom water concentrations based on nu- ods were described in detail elsewhere (Neumann, 2016).
trient data of previous cruises of the same location and time
(later confirmed by nutrient analyses of site water). For label 2.3.4 Dissolved inorganic nitrogen concentrations
addition, site water was replaced with the respective label so-
lution. Due to the careful adjustment of concentrations, incu- NOx , NO− +
2 and NH4 concentrations of the water-column
bations were done at a tracer level, and benthic fluxes should samples were determined in replicate with a continuous
not be altered. The label addition was calculated, aiming for flow analyzer (AA3, Seal Analytical, Germany) according
a maximum enrichment of 5000 ‰ in substrates. to standard colorimetric techniques (NOx , NO2 : Grasshoff
Samples were taken every 6 h. Upon sampling, incubation et al., 1999; NH+ −
4 : Kérouel and Aminot, 1997). NO3 con-
water was filtered with a syringe filter (cellulose acetate, Sar- centration was calculated by difference between NOx and
torius, 0.45 µm pore size) and frozen in Exetainers (11.8 mL, NO− 2 . Based on replicate analyses, measurement precision
Labco, High Wycombe, UK) at −20 ◦ C for later analyses of for NOx and NO− 2 was better than 0.1 µmol L
−1 and better
nutrients and stable isotope signatures (δ 15 NH+ 15 −
4 , δ NO3 ).
−1
than 0.2 µmol L for NH4 . +
Additional samples for the analyses of dissolved nitrogen Water samples from core incubations were analyzed in du-
(N2 ) were taken without filtration and were preserved in Exe- plicate for concentrations of NH+ − −
4 , NO2 and NO3 using a
tainers (5.9 mL, Labco, High Wycombe, UK) containing 2 % multimode microplate reader, Infinite F200 Pro, and stan-
of a ZnCl2 solution (1 mol L−1 ). Samples were stored at 4 ◦ C dard colorimetric techniques (Grasshoff et al., 1999) at the
underwater until analysis. ZMT, Bremen. The standard deviations were < 1 µmol L−1
for NO− 3 , < 0.2 µmol L
−1 for NO− and < 0.5 µmol L−1 for
2
2.3 Analyses +
NH4 .
2.3.1 N2 measurements by MIMS 2.3.5 Nitrogen isotope analyses
N2 production was measured by a membrane inlet mass
The nitrogen isotope ratios of NO− 3 were determined via
spectrometer (MIMS; InProcess Instruments), which quanti-
the denitrifier method (Casciotti et al., 2002; Sigman et al.,
fies changes in dissolved N2 : Ar ratios (Kana et al., 1994)
2001). This method is based on the mass spectrometric mea-
from all four cores. During the measurements, the water
surement of isotopic ratios of N2 O produced by the bac-
samples were maintained in a temperature-controlled water
terium Pseudomonas aureofaciens. Briefly, 20 nmol of sam-
bath (16 ◦ C). For calibration, we measured equilibrated wa-
ple NO− 3 was injected in a 20 mL vial containing Milli-Q wa-
ter samples at four salinities, from 0 to 35 after each 10th wa-
ter. Two international standards were used (IAEA NO− 15
3 δ N
ter sample. We measured the production of 28 N. The internal 15
= +4.7 ‰, USGS34 δ N = −1.8 ‰) for a regression-based
precision of the samples was < 0.05 % for N2 /Ar analyses.
correction of isotope values. For further quality assurance, an
internal standard was measured with each batch of samples.
2.3.2 Oxygen penetration depth
The standard deviation for δ 15 N was better than 0.2 ‰.
The oxygen penetration depth in the sediment of each station For ammonium isotope measurements, nitrite was re-
was measured using microoptodes (50 µm tip size; PreSens, moved by reduction with sulfamic acid (Granger and Sig-
Germany). The optodes were moved vertically into the sed- man, 2009) before NH+ 4 was chemically oxidized to NO2
−
iment with a micromanipulator (PyroScience, Germany), in by hypobromite at pH ∼ 12 and then reduced to N2 O using
steps of 100–200 µm, depending on the oxygen concentra- sodium azide (Zhang et al., 2007); 10 nmol of NH+ 4 was in-
tion. Three O2 profiles were measured in one sediment core jected, and all samples with [NH+ 4 ] < 1 µmol L −1 were ana-
of each station. The O2 profiles were measured directly after lyzed. For the calibration of the ammonium isotopes, we used
core retrieval, i.e., within 10–15 min. three international standards (IAEA N1 δ 15 N = +0.4 ‰,
USGS25 δ 15 N = −30.4 ‰, USGS26 δ 15 N = +53.7 ‰). The
2.3.3 Sediment samples standard deviations were better than 1 ‰.
N2 O produced either by the denitrifier method or by the
The surface sediment samples (first 1 cm) of the cruises chemical conversion of ammonium was analyzed with a Gas-
HE 383 (June–July 2012) and HE 447 (June 2015) were an- Bench II, coupled to an isotope ratio mass spectrometer
alyzed for total carbon and total nitrogen contents with an (Delta Plus XP, Thermo Fisher Scientific).
https://doi.org/10.5194/bg-17-2839-2020 Biogeosciences, 17, 2839–2851, 20202844 A. Bratek et al.: Sedimentary N-transformation rates in the North Sea
Figure 3. Correlation of gross nitrification rates and actual nitrate Figure 4. Benthic O2 fluxes and gross ammonification rates of the
fluxes. The solid line indicates the 1 : 1 ratio, and the dashed line sampled stations. The dashed line indicates the Redfield ratio of
indicates the linear regression. The error bars indicate the regression oxygen to nitrogen (N : O2 1 : 8625) (Redfield, 1958), and the solid
error of individual rates at the 0.95 confidence level. lines indicate the ratio of oxygen to nitrogen determined by the C/N
ratio in the North Sea (N : O2 – 1 : 7.1). The error bars indicate the
regression error of individual rates at the 0.95 confidence level.
2.4 Rates and fluxes calculation for respiration,
ammonification, nitrification and denitrification
rates in core incubations 15 N at. % excess (Brase et al., 2018), V is the volume of the
overlying water, and A is the surface area of the sediment.
2.4.1 Benthic fluxes (All rates are given in mmol N m−2 d−1 .)
Oxygen consumption, net ammonification, net nitrification
and denitrification were calculated based on concentration 3 Results
changes in the sediment incubations. The respective benthic
fluxes were calculated as follows: 3.1 Ammonification
rnet = d(C) × V /d(t) × A[mmol N m−2 d−1 ], (1) We measured gross ammonification rates with the isotope
dilution method using 15 NH+ 4 as tracer and measured net
where d(C) is the oxygen, nutrient or nitrogen (N2 ) concen- ammonium fluxes with the flux method. The highest net
tration at the start and at the end of the experiment; V is the ammonium flux and gross ammonification rates were mea-
volume of the overlying water; d(t) is the incubation time; sured in the impermeable, organic-rich sediment at the sta-
and A is the surface area of the sediment. Positive fluxes tion NOAH-C (6.6 ± 1.4 and 9.5 mmol N m2 d−1 for net flux
(outflow concentrations above inflow concentrations) imply and gross ammonification, respectively).
net production in the sediment. The lowest net ammonium fluxes were measured in the
semi-impermeable sediment at the station NOAH-D (0.5 ±
2.4.2 Gross rates of ammonification and nitrification 0.1 mmol N m−2 d−1 ). The lowest gross ammonification rate
was measured at the permeable sediment station NOAH-
Gross rates of ammonification and nitrification (rgross ) were A (2.1 ± 0.3 mmol N m−2 d−1 ). The impermeable sediment
calculated based on 15 N isotope dilution (Koike and Hattori, station NOAH-C had the highest net ammonium fluxes
1978; Nishio et al., 2001). For example, ammonification rates (6.6 ± 1.4 mmol N m−2 d−1 ) and gross ammonification rates
are calculated based on 15 NH+ 4 additions, and nitrification (9.5 mmol m−2 d−1 ). Net and gross ammonification rates are
rates are based on 15 NO−3 additions (Fig. 2): significantly correlated (r 2 = 0.55; see Supplement).
h i
rgross = ln f 15 Nend f 15 Nstart
(ln (Cend /Cstart )
× Cstart − Cend t × (V /A × 1t) , (2)
where Cstart is the initial NH+ −
4 or NO3 concentration, Cend is
the concentration at time t, f Nstart and f 15 Nend represent
15
Biogeosciences, 17, 2839–2851, 2020 https://doi.org/10.5194/bg-17-2839-2020A. Bratek et al.: Sedimentary N-transformation rates in the North Sea 2845
3.3 Denitrification
Unlike ammonification and nitrification, we were not able to
make use of the stable isotope tracers to evaluate N2 produc-
tion rates with a stable isotope technique because the require-
ments for the isotope-pairing method (Rysgaard-Petersen et
al., 1996) were not met due to the labeled 15 NO−3 in the over-
lying water being too low to measure any 15 N–N2 species.
Our N2 production estimates are thus limited to the flux
method. The observed average denitrification rates ranged
from 1.3 ± 1.1 to 1.9 ± 0.8 mmol N m−2 d−1 (Fig. 5) and did
not vary significantly between stations.
3.4 Sedimentary organic matter descriptions
The data show a clear correlation between sediment type and
organic carbon and nitrogen content. Clay and silty sediment
(NOAH-C) had the highest organic carbon (0.73 %) and ni-
trogen (0.10 %) concentrations (Table 2). The medium sand
station (NOAH-A) had the lowest Corg (0.03 % to 0.04 %)
and total nitrogen (< 0.01 % to 0.01 %) concentrations. This
trend does probably not apply to NOAH-E, since the sam-
ples for C/N analyses were retrieved prior to the abrupt
emergence of a large pockmark field at this station (Krämer
et al. 2017), while the sediment cores for the incubations
were retrieved after the emergence of the pockmarks. The
large-scale sediment resuspension event resulted in numer-
Figure 5. Benthic N-transformation rates (in mmol N m−2 d−1 ) of ous newly formed depressions with increased sedimentation
ammonification (NH+ −
4 ) and nitrification (NO3 ) as measured by
of organic material.
means of stable isotope methods (blue arrows). Simultaneously
measured fluxes of ammonium (NH+ −
4 flux), nitrate (NO3 flux) and
−2 −1
N2 (in mmol N m d ) as measured by the flux method (red ar- 4 Discussion
rows).
4.1 Magnitude and relevance of ammonification
3.2 Nitrification A principal goal of this study was to assess the role of am-
monification in the nitrogen cycle of the German Bight. Am-
As for the ammonification, we measured gross nitrification monification releases NH+ 4 during the decomposition of or-
rates by means of the stable isotope dilution method, with ganic matter and resupplies the water-column inventory of
15 NO− as tracer and net nitrate fluxes employing the flux reactive nitrogen. The quantification of ammonification rates
3
method. Net fluxes and gross nitrification rates varied signif- is challenging because ammonium is readily assimilated by
icantly between stations. Net nitrate fluxes were the high- primary producers or is rapidly nitrified, causing low ammo-
est at the station NOAH-C and at the station NOAH-E, nium concentrations and necessitating the use of the isotope
with 1.1 ± 0.5 and 1.2 ± 0.5 mmol N m−2 d−1 , respectively dilution method.
(Figs. 3, 5). Gross nitrification rates were the highest at This study represents direct measured gross ammonifica-
NOAH-C (2.1 ± 0.1 mmol N m−2 d−1 ). The lowest rates of tion rates across typical sediment types of the North Sea, cov-
net nitrate flux (0.3 ± 0.3 mmol N m−2 d−1 ) and gross nitrifi- ering a large range, from 1.9 to 9.5 mmol N m−2 d−1 : am-
cation (1.2 ± 0.0 mmol N m−2 d−1 ) were observed in the per- monification rates were mainly governed by sediment tex-
meable sediment at the station NOAH-A. Net and gross nitri- ture and organic matter content. The impermeable muddy
fication rates are closely correlated (r 2 = 0.87; Fig. 3), with sediment at the station NOAH-C with high Corg and TN
net nitrate fluxes being systematically lower than gross nitri- content (0.73 % and 0.10 %, respectively; Table 2) had the
fication rates. highest gross and net ammonification rates. This is line
with other studies showing enhanced ammonium release in
muddy coastal sediments (e.g., Caffrey, 1995).
The sandy sediments at sites NOAH-A, NOAH-D and
NOAH-E exhibited significantly lower gross ammonification
https://doi.org/10.5194/bg-17-2839-2020 Biogeosciences, 17, 2839–2851, 20202846 A. Bratek et al.: Sedimentary N-transformation rates in the North Sea
rates. This reflects the lower sediment organic matter content 4.2 Ammonification coupled to denitrification by
in these sandy sediments, expressed in Corg (0.03 %–0.04 %) nitrification
and N (0.01 %–< 0.01 %) concentrations (Caffrey, 1995; Ta-
ble 2).
It is striking, though, that net and gross ammonification in Based on the interpolation of gross rates of ammonification,
the sandy sediment at the station NOAH-E was clearly el- it is evident that ammonification contributes significantly to
evated compared to the other sandy stations NOAH-A and nutrient regeneration in the German Bight. However, there
NOAH-D. There are two possible explanations for this en- is a clear difference between gross and net ammonification
hanced ammonium production: (1) enhanced supply of or- rates, suggesting that ammonium is taken up, either by as-
ganic matter to the sediment surface or (2) effects of bioirri- similation or by nitrification. In dark sediments, where pho-
gation and bioturbation. totrophic organisms are light limited, we presume that nitri-
Station NOAH-E is located inside a pockmark field that fication is likely the more important process (Dähnke et al.,
had developed relatively recently, between July and Novem- 2012).
ber 2015 (Krämer et al., 2017). Our assessment of C and Nitrification produces NO− 3 , which represents the largest
N content is based on samples that were taken prior to the DIN pool in the water column of the North Sea and is the
pockmark formation in 2012 and 2015 (https://doi.org/10. substrate for denitrification and thus the link to an ultimate
1594/PANGAEA.883199, last access: 17 May 2020). The removal of fixed nitrogen from the water column.
sediment samples during the cruise (HE 471) in 2016 were We observed gross nitrification rates at all four stations,
taken from the depression inside an individual pockmark, ranging from 1.2 ± 0.0 mmol N m−2 d−1 at the sandy station
which was about ∼ 0.2 deeper than the surrounding sediment NOAH-A to 1.3 mmol N m−2 d−1 in the moderately perme-
(Krämer et al., 2017). We assume that organic matter from able sediment at NOAH-D and to 2.1 ± 0.1 mmol N m−2 d−1
the water column accumulated in these transient structures in the impermeable sediment at the station NOAH-C
and that the organic carbon and nitrogen content was thus el- (Figs. 3, 5). Gross nitrification accounted for around 22.2 %
evated. A transient change in surface sediment composition, (±0.7 %) at the impermeable sediment station NOAH-C,
which is not captured by our compositional data, may thus around 38.5 % at the semi-permeable station (NOAH-D) and
have caused the enhanced ammonification rate. around 50.6 % (±15.8 %) at the permeable sediment stations
An alternative explanation is an elevation of ammonium of total DIN flux to the bottom water. Overall, nitrification is
fluxes from the sediment due to sediment reworking. In the in the same range as reported by Marchant et al. (2016) in
sediment incubations, we found high benthic activity of Spio- sandy sediment near Helgoland (0.2 to 3.0 mmol m−2 d−1 ;
phanes bombyx and Phoronis sp. Both benthic organisms can Table 1). The highest nitrate fluxes from the sediment and
increase the nutrient fluxes from the sediment to the bottom gross nitrification rates were observed at the impermeable
water, the oxygen penetration depth and, in turn, organic mat- station NOAH-C and at the station NOAH-E, where pock-
ter degradation in the oxic zone (Aller, 1988). mark structure and organic matter accumulation might have
Under completely oxic conditions, the ratio of NH+ 4 re- affected benthic nutrient fluxes (see Sect. 4.1).
lease to O2 consumption in the entire study area should ap- The lowest gross nitrification rates and nitrate fluxes are
proximate Redfield ratios of about 1 : 8.6 (Thibodeau et al., found at the permeable station NOAH-A, but apart from this,
2010). Such ratios were observed at the semi-permeable sta- we do not see a clear correlation of nitrification and perme-
tion NOAH-D, at the permeable station NOAH-A (Fig. 2) ability in our study. Nonetheless, nitrification rates are the
and at the station NOAH-E, suggesting that in these cores lowest at the station NOAH-A, where oxygen penetration
most of the organic matter was degraded under oxic con- depth is the highest, and the sediment has low organic mat-
ditions. At station NOAH-C, however, the N:O2 ratio was ter content (Table 2). A high oxygen penetration depth can
clearly elevated above the Redfield ratio. While this finding support nitrification, but it is in this case obviously substrate
is based on an individual assessment, it appears plausible: limited due to low organic matter content, which limits am-
we presume that the enhanced production of ammonium rel- monification. Oxygen penetration can enhance nitrification
ative to O2 consumption reflects the importance of anoxic at greater depth but can, on the other hand, also increase dif-
ammonium generation, i.e., during methanogenesis or sulfate fusion limitation (Alkhatib et al., 2012).
reduction (e.g., Jorgensen, 1982). This is quite likely at the Due to this dual control of nitrification by OPD on the one
station NOAH-C, where oxygen penetration depth in the im- hand and substrate availability on the other hand, the indi-
permeable, organic-rich sediment is the lowest and where in- vidual correlations between Corg or TN and nitrification are
creasing NH+ 4 concentrations with depth indicate decompo- relatively weak. Generally, organic matter deposition in the
sition or organic matter in the absence of free oxygen (Hart- sediment supports higher ammonification rates, which in turn
mann et al., 1973). enhance nitrification under oxic conditions (Henriksen and
Kemp, 1988; Rysgaard et al., 1996). Consequently, nitrifica-
tion is affected by the NH+ 4 pool in the sediment, tempera-
ture, salinity and O2 (e.g., Sanders, 2018).
Biogeosciences, 17, 2839–2851, 2020 https://doi.org/10.5194/bg-17-2839-2020A. Bratek et al.: Sedimentary N-transformation rates in the North Sea 2847
This interplay of factors is mirrored in a clear and sta- NOAH-D. At stations NOAH-C and NOAH-E, where we as-
tistically significant (a = 0.05) correlation of gross nitrifi- sume an (possibly transient in case of NOAH-E) accumula-
cation and gross ammonification rates (r 2 = 0.92). Over- tion of organic matter, nitrification rates are enhanced, and a
all, the gross NO− 3 production (1.2 to 2.1 mmol m
−2 d−1 ) substantial amount of freshly produced nitrate is released to
was small relative to ammonification rates (1.9 to the water column.
9.5 mmol N m−2 d−1 ). We find that nitrification is governed In comparison to the supply of mineralized N (i.e.,
by a complex interplay of variables, such as ammonifica- gross ammonification), denitrification accounts for
tion rate, permeability, organic matter availability and oxy- ∼ 20 % (1.9 mmol N m−2 d−1 / 9.5 mmol N m−2 d−1 ) at
gen penetration depth, and is likely difficult to predict based the impermeable sediment station NOAH-C, ∼ 39 %
on one of these factors alone. Generally, organic matter depo- (1.3 mmol N m−2 d−1 / 3.3 mmol N m−2 d−1 ) at the
sition in the sediment supports higher ammonification rates, semi-permeable sediment station NOAH-D and ∼ 62 %
which in turn enhance nitrification under oxic conditions (1.3 mmol N m−2 d−1 / 2.1 mmol N m−2 d−1 ) at permeable
(Henriksen and Kemp, 1988; Rysgaard et al., 1996). In our sediment stations (NOAH-A). As discussed above, this trend
setting, this is reflected in a clear correlation of gross rates of does not hold for the less representative station NOAH-E
ammonification and nitrification. due to the transient formation of numerous pockmarks.
4.3 Denitrification 4.4 Significance of benthic N recycling
Denitrification, the reduction of NO− 3 to gaseous N2 , reduces Our study covers the most sediment types across the Ger-
the pool of bioavailable N and is therefore very relevant man Bight but is based on core incubations and therefore
in eutrophic coastal areas such as the southern North Sea. potentially underestimates advective processes. In a recent
In our study, the measured denitrification rates ranged from study by Neumann et al. (2017), the authors used NO− 3
1.3 to 1.9 mmol N m−2 d−1 (Fig. 5). This estimate is on the pore-water profiles to calculate the NO− 3 consumption rates
higher end of previous measurements from sites in the Ger- across a similar range of North Sea sediments. They extrap-
man Bight (Deek et al., 2013; Marchant et al., 2016) (Ta- olated their nitrate consumption rates to the entire area of
ble 1) but generally fits with previous observations. We as- the German Bight based on a permeability classification of
sume that the rates in our study are elevated because sam- sediments. They propose that ∼ 24 % of sediments in the
pling took place after the spring phytoplankton bloom, and southern North Sea (German Bight) are impermeable sedi-
not all organic matter that had been deposited at the sed- ments (12 200 km−2 ), ∼ 39 % are moderately permeable sed-
iment surface had been remineralized. Such a decoupling iments (19 600 km−2 ) and ∼ 37 % (18 800 km−2 ) are per-
of water-column production and sedimentary denitrification meable sediments. They estimated that permeable sediments
has been observed before in stratified water masses of the were the most efficient NO− 3 sink, accounting for up to 90 %
Baltic Sea (Hellemann et al., 2017). Even though our study of the total benthic NO− 3 consumption. In our assessment,
was designed to cover diverse sediment types, and thus allow which better represents the role of nitrification, we arrive
for an improved extrapolation of rates to the total German at a somewhat lower contribution of ∼ 68 % of total den-
Bight area, this highlights the heterogeneity of sediments and itrification occurring in moderately permeable and perme-
points out that the sampling season can have a marked effect able sediments. Based solely on our data, we estimate a to-
on measured rates. Therefore, follow-up experiments should tal nitrogen removal of ∼ 1030 t N d−1 in our study area,
try to cover the seasonality as much as possible to improve which corresponds to an average N2 flux of approximately
estimates of denitrification in the German Bight area. 1.5 mmol N m−2 d−1 . This daily N2 production during late
Important seasonal effects on denitrification can be at- summer equals the total N discharge (∼ 1000 t N d−1 ) by the
tributed to variations in oxygen supply, changing bottom wa- main rivers, the Maas, Rhine, Ems, Weser and Elbe rivers,
ter NO− 3 concentration and organic carbon content in the sed- and the North Sea Canal (Pätsch and Lenhart, 2004) and, as
iment (Deek et al., 2013). In our study, the bottom water such, underscores the role of coastal sediments to counteract
nitrate concentration is too low (< 0.5 to 4.5 µmol L−1 ) to the eutrophication in the North Sea.
sustain the observed denitrification rates, and thus the ma- Our assessment, however, does reflect the impact of only
jor nitrate source fueling the observed denitrification must diffusive transport and faunal activity while not accounting
be coupled nitrification–denitrification fueled by mineraliza- for advective fluxes. Based on the same dataset of perme-
tion of sedimentary organic material. This is reflected in a ability for classification of different sediment types that Neu-
strong correlation between gross nitrification and denitrifica- mann et al. (2017) used, we merge our dataset with the results
tion rates (r 2 = 0.85). of Neumann et al. (in preparation) to arrive at an improved
In our study, we find that this coupled nitrification– estimate of sediment denitrification that includes benthic ni-
denitrification determines the total N flux. Denitrification es- trification as a nitrate source.
sentially removes, within the given uncertainties (Fig. 5), all In the following, we aim to put our estimates of N-
nitrate produced by nitrification at study sites NOAH-A and transformation rates into perspective by setting an upper
https://doi.org/10.5194/bg-17-2839-2020 Biogeosciences, 17, 2839–2851, 20202848 A. Bratek et al.: Sedimentary N-transformation rates in the North Sea
Table 3. Rates of benthic net NO− +
3 and benthic net NH4 fluxes per area, water depth below thermocline (average value of all sediment
cores per station) and concentration of dissolved inorganic nitrogen (DIN) in the thermocline. Bottom water (c NO− −
3 ), nitrite (c NO2 ) and
+
ammonium (c NH4 ). The concentration of DIN per area was calculated by the multiplication of the water depth below the thermocline with
the concentration of DIN. Turnover rates of nitrogen were calculated by the division of DIN per area by the rates of NH+ −
4 net and NO3 net
and the effect of sedimentary N release on the reactive nitrogen available for primary production in the water column.
Station rNH+ −
4 net + rNO3 net Water depth below −
c NO3
−
c NO2
+
c NH4 DIN per N Sedimentary N support
thermocline area turnover for primary production
(−) (mmol m−2 d−1 ) (m) (µmol L−1 ) (mmol m−2 ) (days) (%)
NOAH-A 1.6 ± 0.4 29.5 0.1 < 0.1 0.6 ± 0.2 20.7 10.8 ± 0.3 14.1 ± 4.7
NOAH-C 6.6 ± 1.4 10.0 < 0.1 0.7 2.0 ± 0.2 30.0 3.4 ± 0.1 58.7 ± 10.6
NOAH-D 0.5 ± 0.1 38.0 0.1 ± 0.1 0.1 0.8 ± 0.6 26.6 28.5 ± 0.6 7.1 ± 2.6
NOAH-E 3.2 ± 0.6 10.0 < 0.1 < 0.1 0.3 ± 0.1 3.0 0.9 ± 0.1 26.5 ± 14.3
limit of N turnover based on primary production, since N 2020), we are confident that our denitrification estimates of
cycling is linked to organic carbon availability, which is up to 2.9 mmol N m−2 d−1 are reasonable.
ultimately provided by pelagic primary production. For the However, with the multitude of our approaches yielding
freshwater-influenced regions of the German Bight, Capuzzo quite a span of plausible denitrification estimates, the ques-
et al. (2018) assume a C fixation of 1.05 g C m−2 d−1 . For an tion emerges as to which of the figures in the range of 0.5 to
estimate of the maximum N-transformation rate we assume 3.3 mmol N m−1 d−1 is actually the true value for the average
that 10 % of the fixed C is processed in the sediment (Heip et denitrification rate. One major reason for this level of uncer-
al., 1995) and that all carbon is remineralized in the sediment tainty is the fact that the local sediment properties with re-
in pace with N turnover. Based on Redfield stoichiometry gard to macrofauna composition and organic matter content
(12 g mol−1 C, ∼ 14 g mol−1 C), average C fixation translates varied considerably within each station, which is reflected,
to [1.05 g × 10 % / 12 C × 14 N =] 0.123 mg N m−2 d−1 that for example, in the variability in oxygen consumption rates
is removed, or 9 mmol N m−2 d−1 , respectively. This sets (see Supplement). Since we were restricted to four cores per
an upper limit to the N turnover rate and compares well station in total, and just two cores for labeling with 15 NH+4
with the observed ammonification rate in impermeable and 15 NO− 3 the inevitable spatial heterogeneity introduced a
sediment at NOAH-C (9.5 mmol NH+ 4 m
−2 d−1 ; Fig. 5). The substantial degree of random error. Additionally, the preced-
ammonification rates at the sandy stations are substantially ing results we used above to evaluate our observations are
lower, which certainly reflects that sandy sediments are certainly likewise based on imperfect data, which results in
frequently resuspended and organic particles are resus- uncertainty on that side. In summary, our limited set of new
pended and degraded in the water column. For a second observations is not sufficiently large to favor one of the pre-
line of argument, we consider the annual nitrate budget of ceding denitrification estimates. At least, the average of all
the southern North Sea (Hydes et al. 1999; van Beusekom our N2 measurements of 1.5±0.9 mmol N m−2 d−1 (N = 13)
et al. 1999), with an annual average denitrification rate falls right in the center of the interval of 0.5 to 3.3 mm and
of 0.7 mmol N m−2 d−1 . This value agrees well with the might represent our best estimate for an average denitrifica-
average gap of 0.5 mmol N m−2 d−1 between gross nitrifi- tion rate in late summer. The remaining fraction of the ini-
cation and actual nitrate flux (Fig. 4), which we attribute to tial ammonification is recycled back into the water column
denitrification. Both rates, the budget-based estimate and as DIN, which accounts for 69 ± 18 % (N = 12) of the total
the nitrification gap, are in the lower range of our measured benthic N flux (N2 + DIN).
N2 fluxes of 0.3 to 2.9 mmol N m−1 d−1 (Table 1; Fig. 5). Since benthic N recycling substantially restocks the
For a third line of argument, we employ the approach of pelagic N inventory, we further assessed the contribution
Seitzinger and Giblin (1996) to link benthic respiration and of benthic N recycling by comparing the benthic DIN (am-
denitrification directly to the pelagic primary production. By monium + nitrite + nitrate) fluxes with the inventory of DIN
employing their formulas and using the primary production below the thermocline. Assuming steady state, we find a
rates by Capuzzo et al. (2018), the annual average of the sed- rapid turnover of sediment-derived DIN at NOAH-C and
iment oxygen demand would be 14.3 mmol O2 m−2 d−1 NOAH-E, in the range of 1–3 d (Table 3). This implies that
(1.05 g C d−1 m−2 = 87.5 mmol C d−1 m−2 ), which even below the thermocline, DIN derived by the sediment is
corresponds to a benthic denitrification rate of rapidly assimilated by phytoplankton. Previous publications
3.3 mmol N m−2 d−1 . Since the annual average of ac- showed that primary production below the thermocline con-
tually measured oxygen fluxes is close to this estimate tributes ∼ 37 % to total primary production in the North Sea
(15.4 ± 12.9 mmol O2 m−2 d−1 , N = 175) (Neumann et al., (van Leeuwen et al., 2013). Assuming Redfield stoichiome-
Biogeosciences, 17, 2839–2851, 2020 https://doi.org/10.5194/bg-17-2839-2020A. Bratek et al.: Sedimentary N-transformation rates in the North Sea 2849
try and an average primary production of 1.05 g C m−2 d−1 , Supplement. The supplement related to this article is available on-
benthic DIN fluxes in our measurements can support a pri- line at: https://doi.org/10.5194/bg-17-2839-2020-supplement.
mary production of about 6.2 to 51.4 mmol C m−2 d−1 or 74–
617 mg C m−2 d−1 . This is within the range of previously ob-
served and modeled primary production rates in the North Author contributions. AB, AN, TS and KD designed the research.
Sea during summer (e.g., van Leeuwen et al., 2013). We fur- AB carried out the fieldwork and performed the analyses. All au-
ther estimate that depending on the thickness of the bottom thors interpreted the data. AB, AN, JvB, TS and KD wrote the pa-
per, with comments provided by KCE and JF.
water layer below the thermocline, benthic N fluxes during
the sampling time supported between 7.1 ± 2.6 % (38 m bot-
tom water layer) and 58.7±10.6 % (10 m bottom water layer)
Competing interests. The authors declare that they have no conflict
of the annual average of primary production (Table 3). This of interest.
dependence of relative sediment contribution on water depth
has been observed previously for respiration processes (Heip
et al., 1995). Our data also match the calculation of Black- Acknowledgements. We thank the captain and the crew of R/V
burn and Henriksen (1983) for Danish sediments, where N Heincke for their support during the sampling campaigns. Matthias
fluxes could support 30 % to 83 % of the nitrogen require- Birkicht from the Leibniz Centre for Tropical Marine Research
ment of the planktonic primary producers (Blackburn and (ZMT) in Bremen is gratefully acknowledged for his assistance with
Henriksen, 1983). nutrient measurements. We further thank Ella Logemann for the
analysis of macrobenthos. We also gratefully thank the two anony-
mous reviewers for comments that helped to greatly improve this
5 Summary and concluding remarks paper.
We evaluated a range of sedimentary nitrogen turnover path-
ways and found that ammonification in sediments is an im- Financial support. The article processing charges for this open-
portant N source for primary production in the water column access publication were covered by a Research
of the southeastern North Sea during summer. Depending on Centre of the Helmholtz Association.
water depth, 7.1 % to 58.7 % of the estimated water-column
primary production is fueled by sedimentary N release. Ni-
trification acts as the main sinks of NH+ 4 mineralized from
Review statement. This paper was edited by Perran Cook and re-
sedimentary organic matter. Ultimately, the main factors gov- viewed by two anonymous referees.
erning nitrification are organic matter content and ammoni-
fication and oxygen penetration depth in the sediment. The
share of newly produced NO− 3 reduced to N2 amounts to two- References
thirds of NO− 3 in permeable sediments, to nearly one-half in
moderately permeable sediment and to one-third in imper- Alkhatib, M., Lehmann, M. F., and del Giorgio, P. A.: The ni-
meable sediments. We further showed that moderately per- trogen isotope effect of benthic remineralization-nitrification-
meable and permeable sediments account for up to ∼ 80 % of denitrification coupling in an estuarine environment, Bio-
the total benthic N2 production (∼ 1030 t N d−1 ) in the south- geosciences, 9, 1633–1646, https://doi.org/10.5194/bg-9-1633-
ern North Sea (German Bight) during the peak of benthic 2012, 2012.
activity in late summer. Only then can benthic N2 produc- Aller, R. C.: Benthic Fauna and Biogeochemical Processes in Ma-
rine Sediments: The Role of Burrows Structures, in: Nitrogen
tion compensate the annually averaged daily N input by the
cycling in Coastal Marine Environments, edited by: Blackburn,
main rivers (e.g., Elbe, Ems, Rhine, Weser) discharging into
T. H. and Sørensen, J., Scope, Chichester, 301–338, 1988.
the southern North Sea (∼ 1000 t N d−1 ). Thus impermeable Bale, N. J., Villanueva, L., Fan, H., Stal, L. J., Hopmans, E. C.,
sediments act as an important N source for primary produc- Schouten, S., and Sinninghe Damste, J. S.: Occurrence and ac-
ers, whereas moderately permeable and permeable sediments tivity of anammox bacteria in surface sediments of the southern
comprise a main reactive N sink counteracting eutrophica- North Sea, FEMS Microbiol. Ecol., 89, 99–110, 2014.
tion in the North Sea. Seasonal and spatial variabilities, es- Blackburn, T. H. and Henriksen, K.: Nitrogen cycling in different
pecially from nearshore to offshore, should be evaluated in types of sediments from Danish waters, Limnol. Oceanogr., 28,
future studies. 477–493, 1983.
Brase, L., Sanders, T., and Daehnke, K.: Anthropogenic changes
of nitrogen loads in a small river: external nutrient sources vs.
Data availability. The data used in the present study are available internal turnover processes, Isot. Environ. Healt. S., 54, 168–184,
in the Supplement. 2018.
https://doi.org/10.5194/bg-17-2839-2020 Biogeosciences, 17, 2839–2851, 20202850 A. Bratek et al.: Sedimentary N-transformation rates in the North Sea
Burger, M. and Jackson, L. E.: Microbial immobilization of ammo- Hickel, W., Mangelsdorf, P., and Berg, J.: The human impact in
nium and nitrate in relation to ammonification and nitrification the German Bight: Eutrophication during three decades (1962–
rates in organic and conventional cropping systems, Soil Biol. 1991), Helgoländer Meeresun, 47, 243–263, 1993.
Biochem., 35, 29–36, 2003. Hydes, D. J., Kelly-Gerreyn, B. A., Le Gall, A. C., and Proctor,
Cadée, G. C. and Hegemann, J.: Phytoplankton in the Marsdiep at R.: The balance of supply of nutrients and demands of biological
the end of the 20th century; 30 years monitoring biomass, pri- production and denitrification in a temperate latitude shelf sea – a
mary production, and Phaeocystis blooms, J. Sea Res., 48, 97– treatment of the southern North Sea as an extended estuary, Mar.
110, 2002. Chem., 68, 117–131, 1999.
Caffrey, J. M.: Spatial and Seasonal Patterns in Sediment Nitrogen Jensen, K. M., Jensen, M. H., and Kristensen, E.: Nitrification and
Remineralization and Ammonium Concentrations in San Fran- denitrification in Wadden Sea sediments (Konigshafen, Island of
cisco Ba,y California, Estuar. Coast. Shelf S., 18, 219–233, 1995. Sylt, Germany) as measured by nitrogen isotope pairing and iso-
Capuzzo, E., Lynam, C. P., Barry, J., Stephens, D., Forster, R. M., tope dilution, Aquat. Microb. Ecol., 11, 181–191, 1996.
Greenwood, N., McQuatters-Gollop, A., Silva, T., van Leeuwen, Jorgensen, B. B.: Mineralization of organic matter in the sea bed-the
S. M., and Engelhard, G. H.: A decline in primary production in role of sulphate reduction, Nature, 296, 643–645, 1982.
the North Sea over 25 years, associated with reductions in zoo- Jorgensen, B. B.: Processes at the sediment-water interface, in: The
plankton abundance and fish stock recruitment, Global Change Major Biogeochemical Cycles and Their Interactions, edited by:
Biol., 24, 352–364, 2018. Bolin, B. and Cook, R. B., John Wiley, New York, 477–515,
Casciotti, K. L.: Nitrogen and Oxygen Isotopic Studies of the Ma- 1983.
rine Nitrogen Cycle, Ann. Rev. Mar. Sci., 8, 379–407, 2016. Kana, T. M., Darkangelo, C., Hunt, M. D., Oldham, J. B., Bennett,
Casciotti, K. L., Sigman, D. M., Hastings, M. G., Böhlke, J. K., and G. E., and Cornwell, J. C.: Membrane Inlet Mass Spectrometer
Hilkert, A.: Measurement of the oxygen isotopic composition of for Rapid High-Precision Determination of N2 , O2 , and Ar in
nitrate in seawater and freshwater using the denitrifier method, Environmental Water Samples.pdf, Anal. Chem., 66, 4166–4170,
Anal. Chem., 74, 4905–4912, 2002. 1994.
Dähnke, K., Moneta, A., Veuger, B., Soetaert, K., and Middelburg, Kérouel, R. and Aminot, A.: Fluorimethic determination of ammo-
J. J.: Balance of assimilative and dissimilative nitrogen processes nia in sea and estuarine water by direct segmented flow analysis,
in a diatom-rich tidal flat sediment, Biogeosciences, 9, 4059– Mar. Chem., 57, 265–275, 1997.
4070, https://doi.org/10.5194/bg-9-4059-2012, 2012. Koike, I. and Hattori, A.: Simultaneous determinations of nitrifica-
Deek, A., Dähnke, K., van Beusekom, J., Meyer, S., Voss, M., and tion and nitrate reduction in coastal sediments by a 15 N dilution
Emeis, K.: N2 fluxes in sediments of the Elbe Estuary and adja- technique, Appl. Environ. Microb., 35, 853–857, 1978.
cent coastal zones, Mar. Ecol. Prog. Ser., 493, 9–21, 2013. Krämer, K., Holler, P., Herbst, G., Bratek, A., Ahmerkamp, S., Neu-
Deek, A., Emeis, K., and van Beusekom, J.: Nitrogen removal in mann, A., Bartholoma, A., van Beusekom, J. E. E., Holtappels,
coastal sediments of the German Wadden Sea, Biogeochemistry, M., and Winter, C.: Abrupt emergence of a large pockmark field
108, 467–483, 2011. in the German Bight, southeastern North Sea, Sci. Rep., 7, 5150,
Emeis, K.-C., van Beusekom, J., Callies, U., Ebinghaus, R., Kan- https://doi.org/10.1038/s41598-017-05536-1, 2017.
nen, A., Kraus, G., Kröncke, I., Lenhart, H., Lorkowski, I., Lenhart, H. J. and Pohlmann, T.: The ICES-boxes approach in re-
Matthias, V., Möllmann, C., Pätsch, J., Scharfe, M., Thomas, H., lation to results of a North Sea circulation model, Tellus A, 49,
Weisse, R., and Zorita, E.: The North Sea – A shelf sea in the 139–160, 1997.
Anthropocene, J. Mar. Syst., 141, 18–33, 2015. Lohse, L., Malschaert, J. F. P., Slomp, C. P., Helder, W., and van
Granger, J. and Sigman, D. M.: Removal of nitrite with sulfamic Raaphorst, W.: Nitrogen cycling in the North Sea sediments:
acid for nitrate N and O isotope analysis with the denitrifier interaction of denitrification and nitrification of offshore and
method, Rapid Commun. Mass Sp., 23, 3753–3762, 2009. coastal areas, Mar. Ecol. Prog. Ser., 101, 283–296, 1993.
Grasshoff, K., Kremling, K., and Ehrhardt, M.: Methods of Seawa- LOICZ: Land-Ocean Interactions in the Coastal Zone, 1–215, 1995.
ter Analysis, Wiley-VCH, Weinheim, 1–600, 1999. Los, F. J., Troost, T. A., and Van Beek, J. K. L.: Finding the opti-
Hartmann, M., Müller, P., Suess, E., and Van der Weijden, C. H.: mal reduction to meet all targets – Applying Linear Programming
Oxidation of organic matter in recent marine sediments, Meteor. with a nutrient tracer model of the North Sea, J. Mar. Syst., 131,
Forschungs-Ergebnisse, Reihe C, 74–86, 1973. 91–101, 2014.
Heip, C. H. R., Goosen, N. K., Herman, P. M. J., Kromkamp, J., Marchant, H. K., Holtappels, M., Lavik, G., Ahmerkamp, S.,
Middelburg, J. J., and Soetaert, K.: Production and consumption Winter, C., and Kuypers, M. M. M.: Coupled nitrification-
of biological particles in temperate tidal etuaries, Oceanogr. Mar. denitrification leads to extensive N loss in subtidal permeable
Biol., 33, 1–149, 1995. sediments, Limnol. Oceanogr., 61, 1033–1048, 2016.
Hellemann, D., Tallberg, P., and Hietanen, S.: Benthic N2 produc- Neubacher, E. C., Parker, R. E., and Trimmer, M.: Short-term hy-
tion rates, Si cycling and environmental characteristics from the poxia alters the balance of the nitrogen cycle in coastal sedi-
Öre estuary on the Swedish coast, Mar. Ecol. Prog. Ser., 583, ments, Limnol. Oceanogr., 56, 651–665, 2011.
63–80, 2017. Neumann, A.: Elimination of reactive nitrogen in continental shelf
Henriksen, K. and Kemp, W. M.: Nitrification in Estuarine and sediments measured by membrane inlet mass spectrometry, PhD,
Coastal Marine Sediments, in: Nitrogen Cycling in Coastal Ma- Department Geowissenschaften, Universität Hamburg, Ham-
rine Environments, edited by: Blackburn, T. H. and Sorensen, J., burg, 1–152, 2012.
John Wiley & Sons Ltd, SCOPE, 207–249, 1988. Neumann, A., van Beusekom, J. E. E., Eisele, A., Emeis, K.-
C., Friedrich, J., Kröncke, I., Logemann, E. L., Meyer, J.,
Biogeosciences, 17, 2839–2851, 2020 https://doi.org/10.5194/bg-17-2839-2020You can also read