Biodiesel Use in Fargo-Moorhead MAT Buses - Del Peterson Associate Research Fellow Jeremy Mattson Associate Research Fellow Small Urban & Rural ...
←
→
Page content transcription
If your browser does not render page correctly, please read the page content below
Biodiesel Use in Fargo-Moorhead MAT Buses

                         Del Peterson
                   Associate Research Fellow

                       Jeremy Mattson
                   Associate Research Fellow

             Small Urban & Rural Transit Center
           Upper Great Plains Transportation Institute
                North Dakota State University

                           May 2008
Acknowledgements

The authors would like to thank Harold Pedersen, City of Fargo Fleet Services Manager, for his time
spent organizing the distributing data to SURTC for this study. Thank you also to Julie Bommelman,
Fargo Transit Manager, for the time she took out of her busy schedule to answer questions and provide
data.

Disclaimer

The contents presented in this report are the sole responsibility of the Small Urban & Rural Transit Center
and the authors.

North Dakota State University does not discriminate on the basis of race, color, national origin, religion, sex, disability, age, Vietnam Era
Veterans status, sexual orientation, marital status or public assistance status. Direct inquiries to the Executive Director and Chief Diversity
Officer, 202 Old Main, (701) 231-7708.
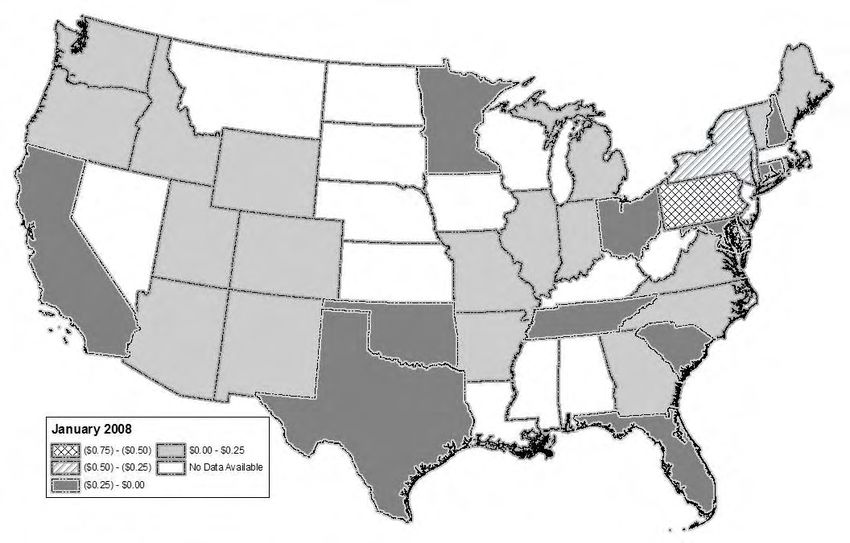
TABLE OF CONTENTS

1. Introduction .......................................................................................................................................... 1

2. Review of Previous Research on Biodiesel Usage .............................................................................. 3
   2.1 Emissions ......................................................................................................................................... 4
   2.2 Fuel Economy .................................................................................................................................. 5
   2.3 Cold Weather Performance.............................................................................................................. 6
   2.4 Lubricity and Cetane Number.......................................................................................................... 8
   2.5 Maintenance Costs ........................................................................................................................... 9

3. U.S. Biodiesel Overview ..................................................................................................................... 11
   3.1 Biodiesel Advantages..................................................................................................................... 11
   3.2 Biodiesel Disadvantages ................................................................................................................ 11
   3.3 Production...................................................................................................................................... 12
   3.4 Cost Information ............................................................................................................................ 13
   3.5 Incentives ....................................................................................................................................... 14

4. Fargo-Moorhead Metro Area Transit Overview and Biodiesel Usage.......................................... 15
   4.1 Biodiesel Experience ..................................................................................................................... 16

5. Metro Area Transit Biodiesel Findings ............................................................................................ 19
   5.1 Total Fleet ...................................................................................................................................... 19
   5.2 Cutaway Buses............................................................................................................................... 20
   5.3 Standard Transit Buses .................................................................................................................. 21
   5.4 Total Cost....................................................................................................................................... 21
   5.5 Fuel Efficiency............................................................................................................................... 22

6. Summary and Conclusions ................................................................................................................ 29

Bibliography ............................................................................................................................................ 31

Appendix. Biodiesel Plant Maps .............................................................................................................. 35
LIST OF FIGURES

Figure 3.1 U.S. biodiesel production .......................................................................................................... 12

Figure 3.2 Cost differentials between B20 and conventional diesel ........................................................... 14

Figure 4.1 2000-2007 MAT fixed-route ridership ...................................................................................... 15

Figure 4.2 2000-2007 Fargo fixed-route ridership...................................................................................... 16

Figure 4.3 2000-2007 Moorhead fixed-route ridership............................................................................... 16

Figure 5.1 2007 total monthly CPM ........................................................................................................... 20

Figure 5.2 2007 cutaway M&R monthly CPM........................................................................................... 21

Figure 5.3 2007 and 2004 cost estimates .................................................................................................... 22

Figure 5.4 MPG 2004 vs. 2007 ................................................................................................................... 23

Figure 5.5 MPG May – September 2004 vs. 2007...................................................................................... 23

Figure 5.6 MPG cutaway buses 2004 vs. 2007........................................................................................... 24

Figure 5.7 MPG cutaway buses 2004 ......................................................................................................... 25

Figure 5.8 MPG cutaway buses 2007 ......................................................................................................... 25

Figure 5.9 MPG standard transit buses 2004 vs. 2007................................................................................ 26

Figure 5.10 MPG standard transit buses 2004 ............................................................................................ 26

Figure 5.11 MPG standard transit buses 2007 ............................................................................................ 27

Figure 5.12 MPG variability ....................................................................................................................... 27
LIST OF TABLES

Table 2.1 Cold flow properties of biodiesel as a function of feedstock and comparison
     to petroleum diesel ............................................................................................................................... 6

Table 2.2 Cold flow properties for diesel and biodiesel blends estimated by Kinast (ºF) ............................ 7

Table 3.1 Biodiesel (B20) average prices by region ................................................................................... 13

Table 5.1 Yearly averages for buses and cutaways..................................................................................... 19

Table 5.2 Yearly averages for cutaway buses............................................................................................. 20

Table 5.3 Yearly averages for standard transit buses.................................................................................. 21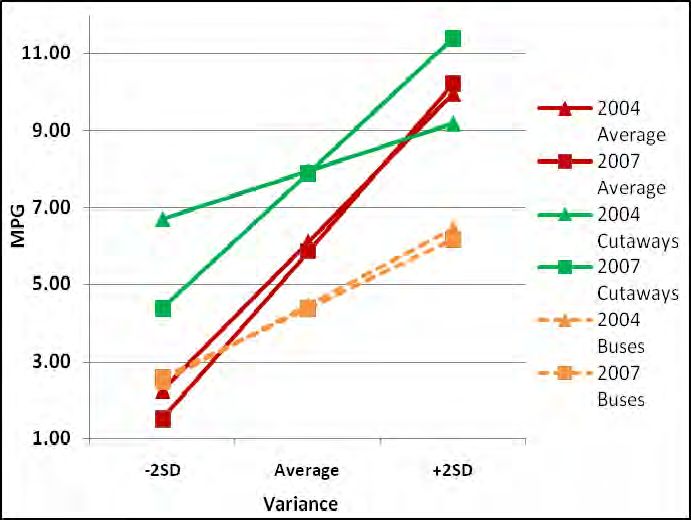
1.      INTRODUCTION

Biodiesel is a naturally grown, alternative fuel source. It’s a cleaner burning fuel than traditional fossil
fuels and, therefore, substantially reduces emissions of pollutants, such as air toxics and hydrocarbons. It
also provides significant reductions in greenhouse gases that cause global warming. The technical
definition of biodiesel is a fuel comprised of mono-alkyl esters of long chain fatty acids derived from
vegetable oils or animal fats and meeting the requirements of American Society for Testing and Materials
(ASTM) D 6751 (National Biodiesel Board 2007).

Biodiesel is most often blended with petroleum-based diesel fuel, at varying concentrations, for use in
existing diesel engines, with little or no modifications required. Because it is homegrown, it reduces
America’s dependence on foreign oil, and it is renewable. Studies have also shown that it can reduce
wear on the life of an automotive engine by up to half (National Biodiesel Board, 2007).

The Fargo-Moorhead Metropolitan Area Transit (MAT) has been using biodiesel mixed fuels in its buses
since 2005. The Small Urban & Rural Transit Center (SURTC) examined the direct effect on the bus
fleet of switching to biodiesel. Attributes such as fuel economy, ridership, and service records were
analyzed. MAT and city officials were also interviewed to identify changes they have seen since the
switch to biodiesel from both a bus fleet and public relations perspective.

The study begins by reviewing the current state of biodiesel and its usage in public transportation. This
serves as a premise for MAT’s experience as well as a means of comparison. Next, a synopsis of
biodiesel in the United States is presented followed by an overview of MAT and its biodiesel experience.
Data analysis follows with comparisons drawn from similar transit providers located in other regions of
the country. Finally, conclusions highlight the major findings of the research. The objective of this
research is to determine the overall effect biodiesel blended fuel has had on MAT’s bus fleet as well as
the auxiliary effect on the F-M community.

                                                     1
2
2.      REVIEW OF PREVIOUS RESEARCH ON BIODIESEL
        USAGE
Previous studies have analyzed the effects of biodiesel use on emissions, fuel economy, cold weather
performance, and maintenance. The studies tend to show similar results. Biodiesel has been found to
significantly reduce emissions of three pollutants: carbon monoxide (CO), hydrocarbons (HC), and
particulate matter (PM). Carbon monoxide is a poison; hydrocarbons cause formation of ozone, a serious
air pollutant; and particulate matter refers to aerosols or fine particles that can be detrimental to human
health. The presence of oxygen in biodiesel causes the reduction of these pollutants (McCormick et al.
2006). Biodiesel has also been found to significantly reduce emissions of carbon dioxide (CO2), a
greenhouse gas, on a net lifecycle basis. Some studies, however, have found increases in emissions of
nitrogen oxides (NOx) from biodiesel usage, but these estimates vary. NOx, along with CO and HC, leads
to the formation of ground level ozone and smog in urban areas.

A few studies have found that fuel economy decreases slightly with biodiesel, while others have found no
measurable change. The studies generally show that maintenance costs and general performance are not
significantly affected by the use of biodiesel blends. A few studies have documented problems with fuel
filters plugging, but it is generally not considered to be a major problem. Increased lubricity and cetane
numbers are well documented benefits of biodiesel. Concern about the cold weather performance of
biodiesel, on the other hand, is one of the main deterrents, along with cost, for the adoption of the fuel.
Previous research has shown that biodiesel blends can be used successfully in colder climates of the
northern United States and Canada.

A few of these studies have specifically researched the use of biodiesel in transit buses. Proc et al. (2006)
studied the use of biodiesel in transit buses in Boulder, CO. In this study, nine identical transit buses
were operated on the same route for two years, logging about 100,000 miles each. Five of these buses
operated exclusively on B20 (a blend containing 20% biodiesel and 80% regular diesel) and four on
regular diesel. Comparisons were made between the B20 and regular diesel buses for fuel economy,
maintenance costs, road calls, and emissions. They found that emissions were reduced, including NOx
emissions, with B20, and that there were no significant differences in on-road average fuel economy,
engine and fuel system maintenance costs, or miles between road calls.

The BIOBUS Project (2003) tested the use of B5 and B20 in buses for a year in Montreal from March
2002 to March 2003. A total of 155 buses were involved in the project, and they did not encounter any
major maintenance or customer service problems.

One of the first mass transit providers to adopt biodiesel was the Bi-State Development Agency, a transit
provider for the St. Louis, Missouri, area. The agency began using B20 in 2001. The results were found
to be favorable. They reported a significant reduction in vehicle emissions with no impact on fuel
economy or performance (Clean Cities 2002).

The National Renewable Energy Laboratory (NREL), part of the U.S. Department of Energy, conducted
extensive research comparing life cycle emissions from using biodiesel with those from using petroleum
diesel (Sheehan et al. 1998). This study estimated the life cycle emissions from the use of petroleum
diesel, B20, and B100 in an urban bus. They found that biodiesel usage significantly reduces life cycle
emissions of CO, total PM, and CO2, but emissions of NOx and total HC increase. McCormick et al.
(2006) tested eight heavy duty diesel vehicles, including three transit buses, to measure the impact of B20
on regulated pollutant emissions. They found significant reductions in CO, total HC, and PM emissions,
and even a small decrease in NOx emissions. This differs from the NREL study, which measured just

                                                      3
tailpipe emissions rather than total lifecycle emissions. The results from these studies will be discussed in
more detail in the following section.
2.1 Emissions
One of the main benefits from biodiesel usage is a reduction in emissions. A number of previous studies
have measured these changes. The U.S. Environmental Protection Agency (EPA) (2002) conducted a
comprehensive analysis of the emission impacts of biodiesel using publicly available data, mostly for
heavy-duty highway engines. They estimated that the use of soybean-based B20 in place of regular diesel
results in a 10.1% reduction in PM, a 21.1% reduction in HC, an 11.0% reduction in CO, and a 2.0%
increase in NOx emissions. Their study also found that the impacts of biodiesel on emissions varied
depending on the feedstock used to produce the biodiesel - whether it is soybean oil, rapeseed oil, or
animal fat - and the type of conventional diesel to which the biodiesel is added. They found that NOx
emissions increase the most with soybean-based biodiesel and the least with animal-based biodiesel; the
reductions in PM and CO emissions are the greatest with animal-based biodiesel; canola-based biodiesel
reduces CO emissions at a greater rate and PM emissions at about the same rate as soybean-based
biodiesel; and HC emissions decrease at about the same rate for all three sources.
McCormick et al. (2006) argued that the small apparent increase in NOx emissions in the EPA study
occurred because the dataset was not adequately representative of on-highway engines. In their study,
McCormick et al. tested entire vehicles rather than just the engine as in other studies, to measure the
impact of B20 on regulated pollutant emissions. They tested eight heavy-duty diesel vehicles, including
three transit buses, two school buses, two Class 8 trucks, and one motor coach, with engine model years
ranging from 2000 to 2006. On average, they found that soy-based B20 caused PM and CO emissions to
decrease by 16% to 17% and HC emissions to decrease by 12% relative to petroleum diesel. They also
found that NOx emissions from use of B20 varied with engine/vehicle technology and test cycle, ranging
from a 5.8% reduction to a 6.2% increase. In the three transit buses, PM emissions were reduced 15%-
20%, CO emissions were reduced 12%-27%, and total HC emissions were reduced 20%-28% with the use
of B20. These reductions were all statistically significant. NOx emissions were reduced by 5.8% for the
first bus and 3.9% for the second bus. These two buses used biodiesel containing a proprietary
multifunctional diesel additive. A third bus was tested to determine if the additive was responsible for the
NOx reduction, but NOx emissions also decreased on this bus by nearly as much without the additive.
This suggested that the NOx reduction occurs generally for biodiesel for this engine-transmission
combination on this drive cycle. All changes in NOx were significant at 95% confidence or better. NOx
emissions, on the other hand, for the Class 8 trucks, the motor coach, and the school buses were found to
increase by a range of 2% to 6%.
Other studies have also specifically analyzed changes in emissions in transit buses. In the Proc et al.
(2006) study, chassis emissions were tested for two transit buses both for #2 petroleum diesel and B20.
In the first bus, total HC decreased 28.2%, CO decreased 26.8%, and PM decreased 17.3% when B20 was
used. When B20 was used in the second bus, total HC, CO, and PM decreased 28.0%, 20.3%, and 19.9%,
respectively. The two buses also showed reductions of NOx emissions of 5.8% and 3.9% when B20 was
used, similar to the McCormick et al. (2006) study. The authors of this study remarked that the oxygen
content of the biodiesel is responsible for the reductions of total HC, CO, and PM, but that the situation
for NOx emissions is less clear.
In the BIOBUS Project (2003), they found that the use of B20 in transit buses led to a 25%-30%
reduction in PM; a 20%-30% reduction in CO emissions; a 10%-30% reduction in total HC emissions,
depending on the engine and type of feedstock used to produce the biodiesel; a 15% reduction in SO4
emissions in an engine with electronic fuel injection; and a 10%-30% reduction in polycyclic aromatic
4hydrocarbons (PAHs) in an engine with electronic fuel injection. They found that the effect of B20 on
NOx emissions was generally neutral.
These studies have all measured tailpipe emissions, as opposed to life cycle emissions. Life cycle
emissions include the emissions from the entire process of producing and burning the fuel. Sheehan et al.
(1998) argued that understanding the benefits of biodiesel means understanding how its life cycle
emissions compare to those of petroleum diesel. Their life cycle analysis for biodiesel included
producing the soybeans through using the fuel in a diesel bus engine, and that for petroleum diesel
included extracting the crude oil from the ground through its use in a diesel bus engine.
When life cycle emissions are analyzed, the reduction in emissions of CO2 becomes apparent. Biodiesel
is generally found to have a negligible effect on tailpipe emissions of CO2 (BIOBUS 2003, EPA 2002) or
to even have a small increase on such emissions (Sheehan et al. 1998), but life cycle emissions decrease
due to carbon recycling in soybean plants. The soybean or canola plants used to produce biodiesel absorb
carbon dioxide from the atmosphere while they are growing, thereby recycling previously emitted carbon
dioxide and reducing life cycle emissions. Use of petroleum diesel, on the other hand, simply results in
an increase in carbon dioxide emitted into the atmosphere, all of it coming from carbon which had been
sequestered beneath the earth’s surface and none of it being recycled. Sheehan et al. (1998) estimated
that pure biodiesel reduces net life cycle emissions of CO2 from urban buses by 78.5%, and that such
emissions drop by 15.7% when using B20.
Sheehan et al. (1998) also estimated that when using B20, life cycle emissions decreased 6.9% and 6.5%
for CO and total PM, respectively, but that emissions increased 2.7% and 7.2% for NOx and total HC,
respectively. They also found small reductions in SOx and methane emissions. As other studies have
shown, they found that tailpipe emissions of hydrocarbons decrease, but they estimated that lifecycle HC
emissions would increase due to the release of hexane in the processing of soybeans and the volatilization
of agrochemicals applied at the farm. Reductions in tailpipe HC emissions still can be beneficial by
reducing urban area pollution.
These studies all show that the use of biodiesel significantly reduces both tailpipe and life cycle emissions
of CO and PM as well as tailpipe emissions of HC, three important pollutants, while the effects on NOx
emissions are mixed. Other studies which have analyzed different types of diesel engines have reached
similar conclusions (Clark and Lyons 1999, Schumacher et al. 2001, Peterson et al. 2000). Turrio-
Baldassarri et al. (2003), on the other hand, found that the decrease in emissions was not statistically
significant, and that the use of biodiesel blends caused a statistically significant increase in emissions of
formaldehyde. Most studies contradict these findings, however, including the EPA study which found a
statistically significant reduction in formaldehyde emissions with the use of biodiesel. A number of
studies have shown a small increase in NOx emissions from biodiesel, and this is an important concern. A
few states have cited this as a deterrent for adoption where air quality is a primary consideration for the
selection of fuels (Humburg et al. 2006). NOx emissions have been shown to vary depending on the
vehicle and drive cycle, and some studies which have specifically analyzed transit buses have shown a
reduction in NOx emissions. McCormick et al. (2006) concluded that when considering all data available,
B20 has no net impact on NOx. Finally, the reduction in net life cycle emissions of CO2, a major
greenhouse gas, is a significant benefit from the adoption of biodiesel.
2.2 Fuel Economy
One concern about the use of biodiesel is a potential decrease in fuel economy. The EPA (2002)
estimated that the energy content of conventional diesel is 129,500 BTUs per gallon, and that for 100%
canola- or soybean-based biodiesel it is about 119,200 BTUs per gallon. Plant-based pure biodiesel,
5therefore, has 7.9% less energy content per gallon than does conventional diesel. Based on this reduced
energy content, B20 would be expected to produce a 1.6% reduction in fuel economy. Some studies have
shown reductions in fuel economy in this range, while others have found no measurable difference. Proc
et al. (2006) reported that laboratory testing revealed a 2% reduction in fuel economy for the B20 transit
buses, but they found no difference in on-road miles per gallon between the B20 and regular diesel
groups. The BIOBUS Project (2003) found that the energy efficiency of biodiesel is comparable to that
of petroleum diesel. There was also no impact on fuel economy found for transit buses operating on B20
in St. Louis (Clean Cities 2002).
Bickel and Strebig (2000) studied the use of B20 in four road maintenance trucks and found that the
average miles per gallon for these trucks was no different than that for the two trucks running on regular
diesel. Humburg et al. (2006) surveyed state transportation agencies regarding their experience with
biodiesel. They reported that of the 12 states that measured changes in fuel efficiency, half of them
indicated there was no change in fuel economy when using biodiesel blends, and the other half reported
some declines.
2.3 Cold Weather Performance
According to the Humburg et al. (2006) survey of state departments of transportation (DOTs), the most
common deterrent for biodiesel adoption among these agencies, besides cost, was concern about cold
weather performance. The cold flow properties of biodiesel are a significant limiting factor for use of the
fuel, but blending it with regular diesel minimizes the disadvantage. Many studies have shown that
biodiesel blends can be used successfully even in colder climates, although a few problems have been
reported. Cold weather behavior was not found to be a widespread problem for those state transportation
agencies that had adopted the fuel (Humburg et al. 2006).
Cold flow properties of biodiesel can be measured by its cloud point, pour point, and cold filter plugging
point. Cloud point is the temperature at which a clear distillate fuel becomes hazy or cloudy because of
the appearance of wax crystals; pour point is the lowest temperature at which a fuel will pour or flow
when tested under standard conditions; and cold filter plugging point is the temperature at which fuel
crystals cause a fuel filter to plug.
Table 2.1 Cold flow properties of biodiesel as a function of feedstock and comparison to
petroleum diesel
Cloud Pour
point point Cold Filter Plugging Point
Feedstock (ºF) (ºF) (ºF)
Soybean oil 31.1 25.2 24.1
Canola oil 24.8 12.6 38.5
Tallow 57.0 48.2 51.8
Sunflower oil 19.4
Cottonseed oil 37.4
Palm oil 60.8
Petroleum Diesel
Diesel #1 -40 -40
Diesel #2 5 -27 -4 to 14
Source: Graboski and McCormick 1998
6Graboski and McCormick (1998) reviewed a number of studies which estimated the cold flow properties
of biodiesel with different feedstocks used. The average values which they reported are shown in Table 1
and are compared to the cold flow properties of #1 and #2 diesel. Feedstocks that have a higher
percentage of unsaturated fat, such as canola oil and soybean oil, produce biodiesel with superior cold
weather performance, while those high in saturated fat such as animal fats or palm oil produce biodiesel
with poor cold flow properties. Canola oil has the lowest level of saturated fat and has been shown to be
the best feedstock for cold weather performance, as shown by the lower cloud points and pour points in
Table 1. Graboski and McCormick reported a higher cold filter plugging point for canola biodiesel, but
the value reported for canola biodiesel was highly unreliable. They reported just two studies which
estimated the cold filter plugging point for canola biodiesel, and the results of the two studies varied
widely, ranging from 9ºF to 68ºF. In a later study, Kinast (2003) estimated the cold filter plugging point
at 25ºF.
Regardless of the feedstock used, the cold flow properties of biodiesel are markedly worse than those for
either #1 or #2 diesel. The cold flow properties shown in Table 1 are for neat, or 100%, biodiesel.
However, biodiesel is normally blended with petroleum diesel, reducing the negative impacts on cold
weather performance. Biodiesel can be blended at lower percentages in colder weather to prevent gelling
or wax formation, and additives can also be used to improve the cold flow properties. Kinast (2003)
estimated the cloud point, pour point, and cold filter plugging point of biodiesel from various feedstocks
at different blends. The results for B5, B20, and B100 soy, canola biodiesel and 100% diesel are shown
in Table 2. The biodiesel blends perform much better than neat biodiesel, although it is still not as good
as pure biodiesel.
Table 2.1 Cold flow properties for diesel and biodiesel blends estimated by Kinast (ºF)
Cold Filter Plugging
Pour Point Cloud Point Point
Soy Canola Soy Canola Soy Canola
B5 -6 -6 3 1 -2 0
B10 0 -6 5 1 0 0
B20 0 0 7 5 1 0
B100 30 25 36 27 28 25
Diesel -17 0 -4
Source: Kinast 2003
The Agricultural Utilization Research Institute and the University of Minnesota (2002) estimated cold
flow properties for soy biodiesel blends with the use of cold flow improving additives. They found that
B2 with additives had cloud, pour, and cold filter plugging points that were actually better than those for
regular diesel, and B20 with additives had pour and cold filter plugging points that were as good as those
for regular diesel but a cloud point that was higher. By blending 20% biodiesel with a winter blend diesel
(50% #1 and 50% #2) and including an additive, they reduced cloud, pour, and cold filter plugging points
to -3ºF, -50ºF, and -34ºF, respectively.
The BIOBUS Project (2003) concluded that, under actual operating conditions, biodiesel blends of B5
and B20 can be viable in a region like Montreal where winter temperatures can drop to -30ºC (-22ºF).
During their demonstration, cold weather caused no problems for buses on the road despite three cold
spells (three to five days long) when daytime temperatures remained below -20ºC (-4ºF). The blended
biodiesel was stored underground, and when necessary, the pure biodiesel was heated prior to delivery to
a temperature high enough for the final blend to be above 0ºC (32ºF). Their buses were parked in garages
7heated to 15ºC (59ºF) when not running, and they recommended that transit authorities with vehicles that
are not parked in heated garages should use a lower concentration of biodiesel such as B5 or B2. Proc et
al. (2006) mentioned no cold weather problems with the use of B20 in Boulder, Colorado.
Bickel and Strebig (2000) studied the performance of biodiesel in road maintenance trucks in the cold
weather of Minnesota. Their 17-month study (December 1998-April 2000) spanned two winters in
Hennepin County, Minnesota, and they concluded that B20 with a fuel additive had cold flow properties
comparable to those of a winter blend diesel fuel. With the additive, the pour point and cold filter
plugging point for B20 were comparable to those for the baseline diesel fuel, and they remarked that these
measures are more accurate than the cloud point in determining how a fuel will perform in cold weather.
During this test period, the trucks were always parked inside in a heated area, and they were equipped
with fuel line heaters. The pure biodiesel was stored in a heated, insulated, above-ground fuel tank before
being mixed with petroleum diesel.
Humburg et al. (2006) reported that there were few cold weather problems for state DOTs that adopted
the fuel. Ohio and Iowa, however, reported filters plugging exclusively under cold conditions, and the
North Dakota DOT decided not to use biodiesel during the winter months. The city of Fargo
experimented with the use of B20 in city-owned landfill equipment in 2001 (Grubb and Pedersen 2007),
and they experienced problems in the cold weather. Fuel filters were frequently plugged due to the
gelling of the fuel. After the experiment, they decided to continue the use of B20 on a seasonal basis
(April-October) and to investigate alternatives for cold weather use.
2.4 Lubricity and Cetane Number
There are other benefits from using biodiesel besides reduced emissions. One benefit is that biodiesel has
greater lubricity than conventional diesel (Strong et al. 2004). Lubricity is a measure of the extent to
which liquid diminishes friction. One test of lubricity is the Ball on Cylinder Lubricity Evaluator
(BOCLE). Fuels with a good lubricity give BOCLE results in the 4500-5000 g range (Graboski and
McCormick 1998). The BOCLE results reported by Graboski and McCormick are 4200-4250 for
conventional diesel, 6100 for soybean biodiesel, and 7000 for canola biodiesel. Kinast (2003) performed
scuffing load BOCLE tests on different blends of biodiesel, and their results show that blending even a
small percentage of biodiesel can significantly improve the lubricity. Kinast’s SLBOCLE results were
3600 for diesel, 5400 for soy B5, 5950 for canola B5, 6150 for soy B20, and over 7000 for canola B20.
Knothe and Steidley (2005) reached the same conclusion.
The benefit from increased lubricity is even more important as EPA regulations are requiring changes in
diesel fuel. The EPA is mandating a substantial reduction in the sulfur content of diesel from 500 ppm
(parts per million) to 15 ppm. New regulations for sulfur content began in 2006, and by June 1, 2010, all
highway diesel in the United States must be ultra-low sulfur diesel (ULSD) fuel. ULSD is being
mandated because it will significantly reduce emissions of particulate matter and nitrogen oxides. ULSD,
however, has a lower level of lubricity (Knothe and Steidley 2005), so biodiesel blends could become an
attractive alternative to improve lubricity.
Biodiesel also has a higher cetane number than conventional diesel. The cetane number is a measure of
the self-ignition quality of fuel. Higher cetane numbers indicate that vehicles are easier to start and
quieter to operate when fueled with biodiesel compared to conventional diesel. No. 2 diesel fuel in the
United States usually has a cetane number between 40 and 45, while the values for biodiesel have been
shown to be from 45 to 67 (Van Gerpen 1996). Graboski and McCormick (1998) found that the average
reported cetane number is 50.9 for soy biodiesel and 52.9 for canola biodiesel, while Kinast (2003)
estimated cetane numbers of 59 and 54 for 100% soy and canola biodiesel, respectively. Kinast found
8that B20 has a cetane number of about 49 and 47 for regular diesel, and Proc et al. (2006) estimated a
cetane number of 47 for B20 and 40 for diesel.
2.5 Maintenance Costs
An objective of many of the studies that have analyzed biodiesel use is to determine if there are any
significant maintenance issues with the adoption of the fuel. Proc et al. (2006) estimated that total
maintenance costs per mile were 5.2% lower for transit buses operating on B20 (54 cents per mile for
diesel and 51 cents per mile for B20), but the difference was not statistically significant. The lower cost
for the B20 buses was due to transmission repairs in the diesel group, which was unrelated to fuel use.
The engine and fuel system maintenance costs per mile were actually 39% higher for the B20 group, but,
again, this was not statistically significant. Engine and fuel system costs for the two groups were very
similar for most of the test period, but average B20 maintenance costs increased during the last three
months of the study due to component replacements in one of the buses. Maintenance costs can vary
significantly among vehicles, so it can be difficult when using a small sample size to determine the
impacts of biodiesel use on these costs. Proc et al. (2006) wrote that future studies will need to be
conducted on a larger fleet or over a longer period of time to mitigate the impact of high variability in
maintenance costs among vehicles.
The plugging of filters may be expected during the introduction of a biodiesel blend due to the cleansing
properties of the fuel. Of the 19 state DOTs that reported use of biodiesel in the Humburg et al. (2006)
survey, eight reported fuel filtering problems in excess of what they experienced during petroleum diesel
use, but all eight reported that the problems ultimately resolved themselves.
Proc et al. (2006) noted that B20 buses had a few fuel filter plugging events, necessitating extra fuel
filters. This did not add significantly to the operating cost, but it created disruptions in service. The
BIOBUS Project (2003), on the other hand, found that using biodiesel did not result in any incidents
causing a disruption in service. Further, they concluded that mechanical maintenance was unproblematic
during and after the transition to biodiesel for most buses, including both older and newer models.
Brooklyn Park, Minnesota, began using B5 and B20 in its equipment in 1999, and they have experienced
very few problems. According to Lawrence (2007), the only problem they had was replacing a small
number of fuel filters on older equipment. The Humburg et al. (2006) survey of state DOTs reported that
no state had any fuel pump problems or fuel system/fuel line leaks; no state reported any change in
viscosity, oil acidity, engine wear, or other oil-related activities; and no state attributed any other vehicle
maintenance issue specifically to the usage of biodiesel blended fuel. Bickel and Strebig (2000) reported
that no unusual engine wear occurred in any of the trucks running on B20. They experienced no instances
of filter clogging, and all fuel system components on the trucks were in good condition at the conclusion
of the testing period. The consensus of the drivers was that there was no observable difference between
B20 and regular diesel fuel.
Fraer et al. (2005) studied the wear characteristics of eight engines from U.S. Postal Service trucks, four
of which had been operating on B20 for four years, accumulating more than 600,000 miles on the fuel.
The results indicated that there was little difference in operational and maintenance costs between the B20
and diesel groups that could be attributed to the fuel. They found no difference in wear. They noted,
however, that two Mack tractors operating on B20 experienced a greater frequency of fuel filter and
injector nozzle replacement, but that they essentially had the same maintenance costs as the petroleum
diesel tractors. The vans operating on B20 did not have any of these problems.
9The BIOBUS Project (2003) recommended that a consistent multi-step filtering process be followed to
ensure consistent blend quality, and they stated that it is essential that suppliers use filters whose
performance has been proven by documented test procedures. They also recommended that adequate
training be provided for technical workers to make them aware of the importance of identifying the source
of a problem in order to achieve the correct diagnosis. Lawrence (2007), on the other hand, indicated that
in his experience, no training was needed to prepare mechanics for the use of biodiesel blends.
103. U.S. BIODIESEL OVERVIEW
The use of biodiesel as an alternative fuel for diesel engines has grown significantly in recent years. Its
popularity stems from the fact that it is a domestically produced, renewable fuel with certain
environmental benefits. The federal government, along with many local and state governments, are
providing subsidies, incentives, and, in some cases, mandates for the production and use of biodiesel
(Mattson et al. 2007). The following chapter is divided into five sections discussing the U.S. biodiesel
industry. These include biodiesel advantages, disadvantages, U.S. production, cost information, and
incentives to provide a better understanding of biodiesel production and its usability in the United States.
3.1 Biodiesel Advantages
The motivation for supporting biodiesel is its perceived environmental, economic, and energy security
benefits. In the United States, biodiesel is mostly produced from domestically grown soybeans, or in
some cases, canola or other vegetable oils, recycled vegetable oils, or animal fats. Since it is domestically
produced, it could lessen dependence on foreign oil imports. According to the Energy Information
Association, the United States currently spends almost $250 billion annually on foreign oil, which is
equal to more than $475,000 every minute (EIA 2007). The United States consumes approximately 20
million barrels of oil each day. By 2025, the demand is forecasted at 26 million barrels per day, of which
60% is projected to be imported.
Use of biodiesel benefits U.S. soybean producers, and it has positive environmental attributes. It reduces
emissions of pollutants and greenhouse gases. According to the EPA, B20 reduces carbon monoxide (CO)
and particulate matter (PM) by 12% each and unburned hydrocarbons (HC) by 20% (EPA 2002). A study
by the U.S. Department of Energy found that biodiesel production and use, when compared to petroleum
diesel, produces 78% less carbon dioxide (CO2) emissions because soybeans actually consume CO2
during the growing process (U.S. DOE 2008).
Biodiesel also exhibits a positive energy balance, whereas many alternative fuels do not. Based on the
national average, for every BTU (British Thermal Unit) of energy used in the production of soybean-
based biodiesel, an average of 3.4 BTUs of energy output is realized – a 240% energy gain (USDA 2008).
According to the National Biodiesel Board (NBB), this represents the highest energy balance of any fuel.
The calculations take into account all of the energy consumed during the production of biodiesel,
including energy used for transportation, production of fertilizers and pesticides to grow the crop, fuels
used to produce the final product, and the methanol used in the manufacturing process. The comparable
efficiency factor for ethanol is about 1.6 BTUs of output for every BTU of input, while the production of
petroleum yields an efficiency factor of less than one. Advocates of biodiesel highlight its positive
energy balance as a major factor in ensuring its viability as an alternative fuel option.
3.2 Biodiesel Disadvantages
A main drawback of biodiesel use is the cost. Biodiesel traditionally costs more than petroleum diesel.
This cost disadvantage decreases, however, as petroleum prices rise, and subsidies from the government
also make biodiesel more affordable. Biodiesel also has a lower energy content when compared to
conventional diesel fuel. Although the difference is more pronounced with B100 (100% biodiesel), a
typical B20 blend (20% biodiesel and 80% conventional diesel) will reduce power, torque, and fuel
economy by approximately 2%, which may be difficult to detect within day-to-day operations (Schiavone
2007).
11Biodiesel can also act as a solvent in storage tanks and fuel lines. As a result, sediments may dislodge
and plug lines, which may require biodiesel storage tanks to be cleaned in advance of biodiesel delivery.
Failure to clean tanks in advance has led to time consuming fuel line cleaning processes that could have
been avoided if tanks were cleaned prior to biodiesel use.
Cold weather operations with biodiesel are also a concern. Biodiesel begins to gel at higher temperatures
than conventional diesel. TCRP Synthesis 72, (Schiavone 2007) questioned 18 transit agencies regarding
cold weather-related problems with respect to biodiesel use. Ten of the 18 agencies reported having some
type of problem. Seven agencies reported cold weather delivery problems; six agencies reported cold
weather storage problems; and ten agencies reported cold weather vehicle problems. Problems were
separated into three temperature categories: below 0ºF, 0ºF to 19ºF, and above 19ºF. The majority of the
delivery problems occurred when temperatures were below 0ºF, while storage problems and vehicle
issues were evenly distributed among the three temperature categories.
3.3 Production
As a result of the increased demand and government support, U.S. biodiesel production tripled from 25
million gallons in 2004 to 75 million gallons in 2005, and then more than tripled again to 250 million
gallons in 2006. In 2007, an estimated 450 million gallons of biodiesel was produced (Figure 1).
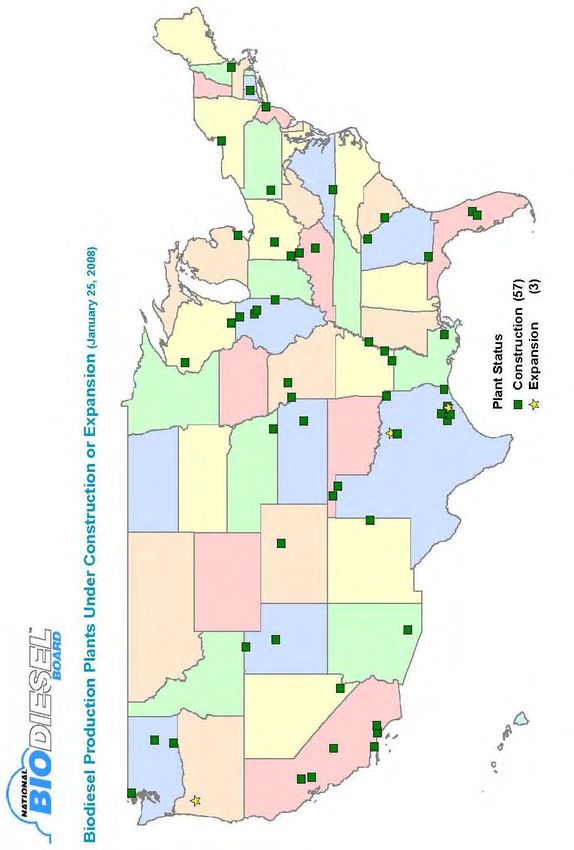
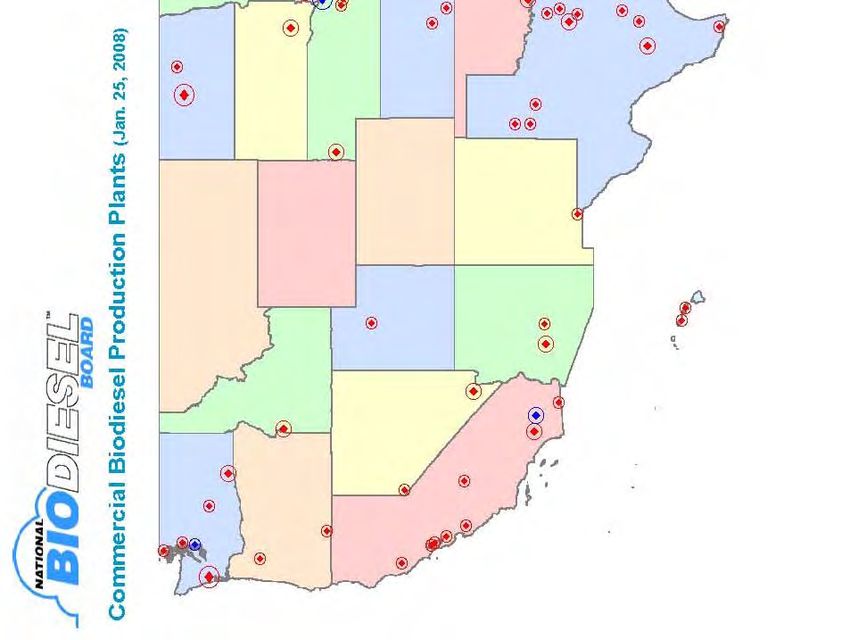
Currently, there are 171 biodiesel plants in the United States (See Appendix for biodiesel plant maps).
The potential for further expansion is significant as 57 new plants are being built along with the
expansion of three existing plants, and many plants are currently operating below full capacity (National
Biodiesel Board 2008).
Figure 3.1 U.S. biodiesel production
Three plants, two of which are located in North Dakota and one in central Minnesota, are each unique and
of interest to current and potential Fargo-Moorhead biodiesel users. Ironton, Minnesota, is home to Green
Range Renewable Energy. Recycled cooking oil is used at this facility to produce biodiesel. They have
an annual production capacity of 150,000 gallons and have been in operation since July 2006. Green
Range Renewable Energy currently has 70 regular customers and is 10 cents cheaper than their nearest
competitor. Their retail pump is powered by two small wind turbines (Central Region 2006). The two
other potential plants are located in Velva, North Dakota, and York, North Dakota. The Velva plant is
12projected to produce 85 million gallons of biodiesel annually from canola, and the York plant is
scheduled to produce 2 million gallons annually from soybeans, (National Biodiesel Board 2008).
3.4 Cost Information
Table 3.1 shows the cost of biodiesel (B20) compared to conventional diesel throughout the United States
along with the number of stations surveyed by the U.S. Department of Energy (U.S. DOE 2008) in
January 2008. The cost of B20 is very comparable to that of conventional diesel. B20 ranges from an
average of $3.31/gallon in the Midwest to $3.49/gallon in the New England states with a standard
deviation of $0.25/gallon. Conventional diesel ranges from $3.30/gallon in the Gulf Coast region to
$3.60/gallon in the New England states with a standard deviation of $0.24 cents per gallon. The average
cost of both B20 and conventional biodiesel in the Midwest is slightly below the national average.
Table 3.1 Biodiesel (B20) average prices by region
Biodiesel (B20) Information Diesel Information
Average Average
Price/Stan.Dev. of Price/Stan.Dev. of
Region Price Stations Price Stations
New England $3.49 / 0.30 20 $3.60 / 0.12 30
Central Atlantic $3.31 / 0.24 13 $3.53 / 0.15 38
Lower Atlantic $3.36 / 0.14 20 $3.36 / 0.12 60
Midwest $3.31 / 0.28 24 $3.37 / 0.32 109
Gulf Coast $3.37 / 0.12 5 $3.30 / 0.07 38
Rocky Mountain $3.32 / 0.23 30 $3.26 / 0.23 43
West Coast $3.45 / 0.24 22 $3.47 / 0.18 67
National
Average $3.37 / 0.25 134 $3.40 / 0.24 385
Figure 3.2 illustrates the cost difference between B20 and conventional diesel by state. The unshaded
states had no data available for the month of January 2008 (U.S. DOE 2008). The light gray shaded states
reported higher B20 prices compared to conventional diesel, while the dark shaded states reported B20
prices between 0 and 25 cents cheaper per gallon than conventional diesel. Both Pennsylvania and New
York reported B20 prices 25 to 75 cents cheaper than conventional diesel prices, respectively. Viewing
prices from a state perspective rather than a regional perspective (Table 3.1) gives a more precise
indicator as to which states offer B20 at a discount (Pennsylvania, New York, Minnesota, Ohio, Texas,
etc.) versus the states that charge a premium (Washington, Maine, Alaska, Illinois, etc.) compared to
conventional diesel.
13Figure 3.2 Cost differentials between B20 and conventional diesel
3.5 Incentives
Many states and cities are now requiring or encouraging use of biodiesel blends in state- or city-owned,
diesel-powered vehicles. For example, Illinois requires all government, school, university, and mass
transit diesel vehicles to use a biodiesel blend that contains at least 2% biodiesel (B2). Indiana, Kansas,
and New York have similar requirements for state-owned vehicles. Missouri requires at least 75% of the
DOT vehicles be fueled with a blend of 20% biodiesel (B20). Many other states have also enacted or
considered some form of policy requiring or encouraging use of the alternative fuel. Minnesota was the
first state to enact a statewide biodiesel requirement, mandating that all diesel fuel sold in the state
contains at least 2% biodiesel. Some cities such as Portland, Oregon, San Francisco, California, and
Albuquerque, New Mexico, have enacted policies requiring use of B20 in city-owned vehicles.
With or without a mandate, many publicly-owned vehicles, including transit buses, are now using, or
being considered for the use of, biodiesel. Some organizations may be hesitant to adopt the fuel due to
concerns about cost or performance. Due to the growing use of this fuel and concerns that may exist, it is
important to study the effects of biodiesel use on vehicle performance. The advantages and disadvantages
need to be measured and documented. A number of previous studies have researched the effects of
biodiesel usage. These studies were reviewed in the previous section.
144. FARGO-MOORHEAD METRO AREA TRANSIT
OVERVIEW AND BIODIESEL USAGE
The Fargo-Moorhead Metro Area Transit (MAT) is the public bus system serving the communities of
Fargo, Moorhead and West Fargo. The system is operated jointly by the cities of Fargo, North Dakota,
and Moorhead, Minnesota, to ensure comprehensive service within the communities. Approximately
150,000 residents are served by MAT, which includes 19 fixed routes in Fargo, Moorhead, and West
Fargo. In 2007 alone, MAT provided more than 1.3 million rides on its fixed-route service (Figure 4.1),
and the paratransit service in Fargo gave 300,000 rides. In 2007, MAT fixed-route drove 603,419 miles in
Fargo and 319,997 in Moorhead, while the Fargo paratransit drove 311,160 miles, respectively.
Figure 4.1 illustrates the fixed-route ridership on MAT between 2000 and 2007. Total ridership for the
entire system is shown along with segmented ridership in both Fargo and Moorhead. Fargo ridership has
steadily increased throughout the past seven years with a large single year increase occurring from 2003
to 2004 (Figure 4.2) This was in large part due to the implementation of two circulator routes at the
North Dakota State University campus. The circulators operate during fall and spring semesters
providing transportation from near-campus apartments and student parking lots to the heart of campus.
They have been heavily utilized throughout the past four school years. A downtown NDSU circulator was
also added a couple of years ago and has contributed to Fargo’s fixed-route ridership growth.
Moorhead fixed-route ridership declined from 2000 to 2004, but has grown during each of the past three
years (Figure 4.3). An increase in fuel prices is believed to have played a role in the recent ridership
growth in both Fargo and Moorhead. Overall, the entire MAT fixed-route system has seen ridership
growth compared to the previous year in every year since 2000. A one-year exception occurred from 2000
to 2001 when ridership remained relatively constant.
Figure 4.1 2000-2007 MAT fixed-route ridership
15Figure 4.2 2000-2007 Fargo fixed-route ridership
Figure 4.3 2000-2007 Moorhead fixed-route ridership
4.1 Biodiesel Experience
Fargo-Moorhead MAT began using biodiesel in its buses in 2005 largely because the city of Fargo’s
Renewable Energy Committee felt it needed to be proactive in utilizing and promoting renewable energy
resources. The first step was to use biodiesel in all city fleet vehicles. The switch at MAT has been a
success, and the bus fleet has had very few mechanical problems that can be attributed to biodiesel use.
The city of Fargo also has the ability to blend biodiesel with conventional diesel at varying levels
throughout the year in its fueling tanks. This is especially important in North Dakota and Minnesota
where temperatures range from 90ºF during the summer to -30ºF during winter months. Common blends
that have been used include B5 during the months of April and October, B2 during November and
December, and B20 in May through September. Conventional diesel is used, without blending biodiesel,
throughout much of the coldest weather months of January, February, and March.
16The ability to market the use of alternative fuels in transit vehicles is worth mentioning as well. Transit
service in a small urban community such as Fargo-Moorhead is often thought to be of secondary
importance compared to transit in a large metropolitan area. However, advertising the use of biodiesel
allows the public to identify transit in a different way. Potential riders, who do not currently ride transit
may consider utilizing the service because they feel they are contributing to a “greener” community and
are supporting local farmers. MAT has marketed its use of biodiesel very effectively throughout the
Fargo-Moorhead community. Their advertising has focused on biodiesel, and they also involved local
citizens by sponsoring a bus naming competition for a transit vehicle with a soybean bus wrap. While
difficult to quantify, the relationship between alternative fuel use and ridership should be considered
when analyzing ridership trends and developing transit marketing campaigns in small urban and rural
areas.
1718
5. METRO AREA TRANSIT BIODIESEL FINDINGS
All MAT biodiesel results are based on data collected from 2004 and 2007. These two years were chosen
to provide a before and after analysis with respect to the use of biodiesel. In 2004, MAT did not use
biodiesel in its bus fleet. Therefore, 2004 served as the before analysis and 2007 as the after. In using
both biodiesel and non-biodiesel data, analysis was performed to compare the effect biodiesel has had on
the fleet as a whole as well as its effect on each individual vehicle. There were 13 of the same standard
transit buses and 10 of the same cutaway buses in use during both 2004 and 2007. These vehicles were
analyzed throughout the study to gain an understanding of the effect biodiesel has on vehicle
performance. Comparing biodiesel’s effect using different vehicles from 2004 and 2007 would not
provide as accurate of a comparison because the nuances of the different vehicles would also need to be
considered in the analysis. Any change in performance could be attributed to the fact that different
vehicles were compared, rendering the biodiesel effect insignificant.
Monthly data was analyzed from both 2004 and 2007. Miles per gallon (MPG) was a performance
characteristic given particular attention since various research findings have found that biodiesel use
decreases fuel efficiency (EPA 2002, University of Houston 2006, Proc et al. 2006). With the recent large
increase in fuel prices, decreased fuel efficiency is of particular interest. Cents per mile (CPM) fuel data
as well as maintenance and repair (M&R) costs were also collected in 2004 and 2007.
5.1 Total Fleet
Table 5.1 shows the averages of all data from 2004 and 2007, including standard deviations. Fuel cost,
M&R cost, and total costs were all measured in CPM. Total costs are the sum of fuel and M&R costs.
This total cost does not take into account other miscellaneous expenses, such as accidents, traffic tickets,
etc. MPG decreased 4% in 2007 compared to 2004. This is quite insignificant compared to fuel costs and
M&R costs, which rose by 88% and 47%, respectively, over the same period. Diesel fuel prices rose more
than 80% per gallon over this same period, which accounts for nearly all of the CPM increase in fuel cost.
The M&R cost increase is attributable to both a rise in the price of parts and labor, along with an aging
bus fleet in 2007 that required more repair work compared to the same, newer fleet in 2004. The increase
in both fuel and M&R costs contributed to the 64% increase in total cost. The Standard Deviations (SD)
show the variability of the data over each one year period. Variability increased slightly for fuel mileage
(MPG) in 2007 compared to 2004, while the variability of M&R actually decreased over the same period.
The SD for fuel cost more than doubled in 2007 compared to 2004, showing a major volatility increase
with respect to fuel prices over this period. Total cost variability increased slightly, also due to the
increase in fuel volatility, which outweighed the decreased variability of M&R costs.
Table 5.1 Yearly averages for buses and cutaways
MPG SD Fuel SD M&R SD Total SD
2004 Average 6.10 1.93 0.268 0.093 0.395 0.581 0.663 0.634
2007 Average 5.85 2.18 0.505 0.219 0.582 0.550 1.087 0.670
% Change -4.0% 88.3% 47.3% 63.9%
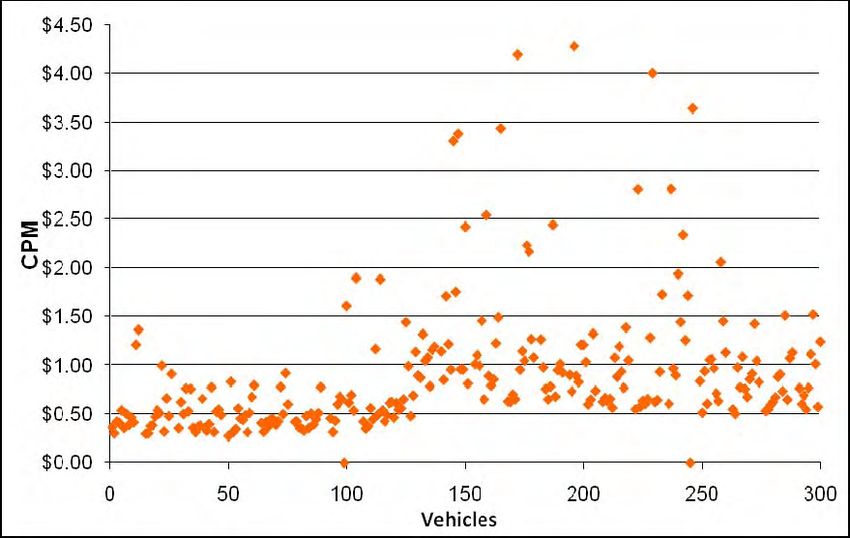
Figure 5.1 illustrates the total CPM for all transit vehicles by month in 2007. Plotting each data point
makes the the increased variability of the data easier to visualize. The largest outliers shown toward the
top of the figure within the $2.00 to $4.50 CPM range include large item maintenance costs (new tires,
major engine repairs, etc.), which increased the monthly CPM and added to the variability of the data.
19Cutaway buses are represented by vehicle numbers 0-120 on the vehicles axis with the remaining points
(121-300) representing standard transit buses. It is visually obvious that the larger transit buses account
for much more variability in the CPM data than the cutaway buses. This variability will be discussed in
greater detail throughout the following discussion.
Figure 5.1 2007 Total Monthly CPM
5.2 Cutaway Buses
Table 5.2 shows the yearly averages for cutaway buses in 2004 and 2007. MPG decreased by less than
1% between the two years, while fuel CPM increased by 78%. The variability of fuel was also more than
four times higher in 2007 compared to 2004. Both of these large increases are due to the inflated price
and variability of fuel cost in 2007. The M&R CPM also increased by more than 78%. This shows that
as cutaway buses age, maintenance costs increase at a faster rate than those of standard transit buses. The
variability of M&R costs also more than doubled in 2007. The M&R monthly CPM costs are plotted in
Figure 5.2, showing a large number of outliers signifying major maintenance costs (brake repacements,
engine repairs, etc.). These outliers are largely responsible for the huge increase in overall M&R cost and
the doubling of M&R cost variability in 2007 compared to 2004.
Table 5.2 Yearly averages for cutaway buses
MPG SD Fuel SD M&R SD Total SD
2004 Cutaways 7.94 0.62 0.185 0.020 0.125 0.126 0.309 0.129
2007 Cutaways 7.88 1.76 0.329 0.084 0.222 0.266 0.551 0.318
% Change -0.7% 78.0% 78.2% 78.1%
20You can also read