From the Diesel Powertrain - Automotive News
←
→
Page content transcription
If your browser does not render page correctly, please read the page content below
-1-

         Dr.-Ing. Andreas Kufferath, Dr.-Ing. Michael Krüger, Dipl.-Ing. Dirk Naber,
                      Dipl.-Ing. Ellen Mailänder, Dr.-Ing. Rudolf Maier

               Robert Bosch GmbH, Division Powertrain Solutions, Stuttgart

             The Path to a Negligible NO2 Immission Contribution
                              from the Diesel Powertrain

Abstract

Euro 6d temp, the first stage of the regulatory package on real driving emissions (RDE), has
become effective within the EU in September 2017; for the first time nitrogen oxide and
particulate emissions of new car types have to be measured under real driving conditions.
The second stage, Euro 6d final, will enter into effect on 1 January 2020. The resulting
requirements in terms of vehicle weight, increased vehicle dynamics, a wide range of differ-
ent ambient temperatures as well as uphill driving sections will contribute significantly to
further reducing urban air pollution caused by car emissions. Due to the broad-based use of
particulate filters in diesel vehicles, the development efforts will no longer focus on particu-
lates but rather on a further reduction of nitrogen oxide emissions and the robust validation
of a low level of emissions even under critical driving and ambient conditions. To achieve
this aim, the optimum interaction between the combustion engine and the exhaust-gas after-
treatment system as well as an efficient temperature management will be indispensable.
The systematic implementation of these measures definitely does not conflict with the CO2
benefit a diesel powertrain offers. In-depth testing on a demonstrator vehicle has proven
that these initially conflicting targets can be reconciled. The emission results of these studies
were used as input parameters for a simulation of immissions at the "Neckartor", a critical
hot spot in Stuttgart. This paper will show that the thesis of a negligible contribution of the
diesel powertrain to the NO2 immissions can become reality even at critical hot spots.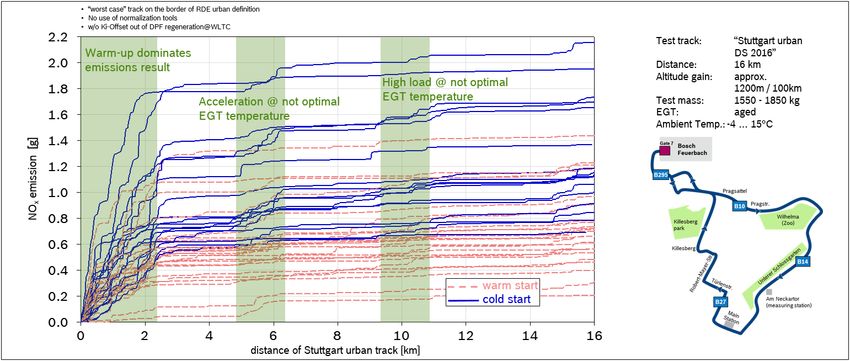
-2-

1     Introduction
As a result of technical advancements on passenger car diesel engines the pollutant emis-
sions have been reduced significantly over the last few decades. With the introduction of the
particulate filter it was possible to reduce particulate emissions to such an extent that today
they account for only a very small share of the particulate air pollution in cities. The imple-
mentation of the RDE requirements (Real Driving Emissions) will lead to a further reduction
of real-driving nitrogen oxide emissions (NOx), resulting in a noticeable decline of the diesel
engines' contribution to inner-city NO2 immissions. The air pollutants 'carbon monoxide'
(CO) and '(unburnt) hydrocarbons' (HC) produced have been reduced to such an extent
within the EU that their monitoring is no longer part of the standard measuring program.

Against the background of the fierce discussions on air quality and air pollution that recently
have taken place in the public – in some cases without sufficient knowledge of the facts –
one must not forget that without the diesel engine Germany will hardly be able to reach its
climate protection goals in terms of CO2 and harmful-gas emissions. Recent vehicle regis-
tration statistics of the German Federal Motor Transport Authority (Kraftfahrt-Bundesamt)
reveal that the decreasing share of diesel cars among newly registered vehicles has already
resulted in an increase of the average CO2 emissions. This trend is hardly surprising be-
cause most of the diesel cars that were decommissioned have been replaced by gasoline
powered models and various studies performed under real driving conditions (such as the
one by the 'auto motor und sport' magazine from the middle of the year 2017 [1]) have
demonstrated that on an average the latters' CO2 emissions are about 15 - 20 % higher than
those of comparable diesel models. Hence the development activities must aim for a further
reduction of the emissions of diesel cars, especially nitrogen oxides, while retaining their
CO2 advantage at costs that are acceptable for end customers. This paper demonstrates
how this can be achieved.

2     The Situation of Local Immissions in Cities – Focus on Stuttgart
The efforts geared towards improving the air quality in cities center around the immissions
of particulates (PM10) and nitrogen oxide (NO2). In general this is a local issue present in a
small area. Both air pollutants are subject to legal immission limits. Particulate mass immis-
sions (PM10) have to comply with an annual mean value of 40 µg/m³ while a limit of 50
µg/m³ must not be exceeded on more than 35 days per year.

At the relevant measuring stations in Stuttgart particulate immissions remain below the per-
missible annual mean value; however, in 2016 the daily limit was exceeded on more than
35 days. This latter exceedance was mainly caused by brake and tire abrasion and the
resuspension of such particles [2]. The direct emissions produced by combustion engines
have played only a minor role since the broad-based introduction of particulate filters as part
of the exhaust-gas after-treatment for diesel vehicles [2]. For this reason particulate emis-
sions will not be considered in the further course of this paper.

Governmental agencies have determined that, in contrast to particulate immissions, a sig-
nificant share of the NO2 immissions is caused by diesel cars. For NO2 immissions a maxi-
mum annual mean value of 40 µg/m³ applies. In addition, an hourly limit of 200 µg/m³ must
not be exceeded during more than 18 hours per year. It is noteworthy that the limit for the
annual mean value applicable in the United States is significantly higher; at 53 ppb (~ 108
-3-

µg/m3) it is more than twice as high as the European annual mean value. On the other hand,
the hourly limit of 100 ppb (~ 205 µg/m3) for the US is similar to the respective European
NO2 limit [3].

As the NOx emissions produced by diesel engines play a prominent role in the total NO2
immissions at so-called hot spots, i. e. locations which are considered particularly critical in
terms of immissions, the situation at the "Neckartor" measuring station in Stuttgart has al-
ready been described in last year's presentation [4]. This hot spot is characterized by a high
traffic volume, the particular position of the measuring station and the specific topography
of Stuttgart which is located in a basin surrounded by hills. In 2015 the emissions from diesel
engines accounted for approx. 50 % of the total immissions measured at this location. Ac-
cording to the competent governmental agencies the resulting violations of the NO2 limits
occur only very locally in areas that represent only a few percent of the total Stuttgart road
network.

Currently Stuttgart and the "Neckartor" measuring station are holding a leading position
among German cities in terms of particulate and nitrogen oxide immissions. For this reason
this paper will focus on that critical measuring station because a solution for that location
might also be transferred to other cities suffering from high immissions. In that context this
paper will also demonstrate why it is important to link the emission and the immission be-
haviors.

A comparison of the immissions measured at this station during the last few years shows
that the 2017 annual mean value for NO2 of 73 µg/m3 still fails to meet the permissible limit
of 40 µg/m³ but nevertheless represents a noticeable reduction from 2016. Furthermore, in
2017 the limit for permissible excess hours is met for the first time (figure 1).

      Figure 1: Comparison of NO2 immission measurements at Stuttgart "Neckartor"

The figure also shows a positive trend in 2017 for the nitrogen oxide mean value (figure 1,
upper right-hand chart). To what extent this has been influenced by a fleet renewal, by soft-
ware updates or by favorable weather conditions is currently being assessed.

The following sections will show how further technological improvements on diesel engines
will reduce these engines' contributions to the overall nitrogen oxide immissions discussed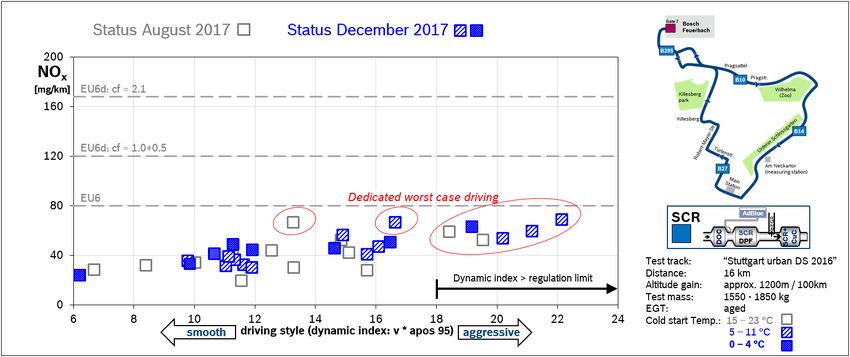
-4-

above. An extreme scenario to be examined will reveal under which premises the engine-
related contributions to total immissions might become negligible when compared to the
existing urban background pollution that is included in the above charts.

3       Real Driving Emissions, Legal Constraints and Test Cases Applied

With the introduction of the RDE legislation (Real Driving Emissions) a wider range of road-
side conditions has to be taken into account. These include not only the driving conditions
in an urban environment, but also driving maneuvers during interurban and high-load high-
way operation. For the entire real driving cycle further requirements in terms of driving dy-
namics, vehicle weight, ambient temperature and uphill as well as downhill sections must
be validated robustly. A comprehensive description of the legal constraints and boundary
conditions can be found in the respective regulation.

The test cases that were applied are shown in figure 2. The dynamometer test NEDC has
been replaced by the WLTC. The test cycle representing highly dynamic driving maneuvers,
RTS 95, is considered only occasionally and for comparative purposes as its typical operat-
ing conditions with the parameters described above have been integrated into a new cycle,
the so-called "Challenge Cycle", that has been definded Bosch internally.

                                 Figure 2: Bosch Test Cases
Real driving testing in Stuttgart deliberately focused on a purely urban route and the altitude
gain as well as the test distance lie at the demanding end of the RDE ranges. The short
overall distance offers relatively few possibilities to evenly distribute the starting emissions;
the downhill sections bear the potential for cooling off the catalysts while the uphill sections
represent rather demanding driving conditions.

Implementing the emission test after a cold start on the chassis dynamometer requires two
cases to be distinguished:

    -   Cold start followed by a slow ride and stop & go traffic, i.e. difficult conditions for
        warming up the catalyst system.
-5-
- Cold start followed by acceleration at low engine speed and high torque. Although
the exhaust system receives a relatively high energy input, the engine-out emissions
will also be significantly higher than in the first case.
To model the first case the so-called TfL cycle (Transport for London) was applied [5]. With
its distance of 8.9 km and an average speed of 13.9 km/h (8.9 km/h in the first phase) this
cycle is slightly outside the RDE constraints. The second case was covered by the internal
Bosch driving cycle, the so-called "Challenge Cycle", which consists of three phases.
- In the first phase the start is immediately followed by several full-load acceleration
maneuvers within the smoke limit; some of these maneuvers even take place on an
uphill section. Although this scenario barely lies within the constraints of the regula-
tion it can be deemed rather unrealistic in regular daily operation. However, this
phase was deliberately modelled in this fashion in order to be able to evaluate poten-
tial measures in depth. Considered on its own this first phase with a distance of 3.6
km and a positive altitude gain of almost 3000 m / 100 km is far outside the scope of
the regulation; however, it might be turned in to a compliant urban route if comple-
mented by another section with moderate requirements.
- Phase 2 models the downhill section of the urban route in Stuttgart from the Pragsat-
tel elevation into the Neckar valley in stop & go traffic. To ensure that there is a suffi-
cient potential for cooling off, the difference in altitude has been increased consider-
ably compared to the actual Stuttgart topography. In this section the travelling speed
is below 11 km/h.
- The third phase of the cycle represents another demanding driving condition which
is not part of the urban route, an uphill highway section under acceleration. This
phase models part of the A8 highway between Pforzheim and Heimsheim with an
unusually steep maximum gradient of almost 7 %. In this section which immediately
follows the cooling-off phase the car is accelerated to approx. 160 km/h. This phase
is slightly outside the RDE specifications regarding the maximum speed and even
clearly beyond RDE in terms of its share of speeds above 145 km/h; it was selected
deliberately, nevertheless, in order to produce a robustness test.
We currently consider the TfL and the Challenge Cycle together to cover all essential critical
driving modes. If these driving modes were transferred from the dynamometer tests into a
real RDE trip, further test sections with relatively few demanding driving conditions would
have to be added to make this an RDE-compliant test. For this reason we also decided
against modelling the RDE section "interurban road" (except for a negligible part at the start
of phase 3 in the Challenge Cycle). The dynamometer cycles were also modelled as a sim-
ulation on the non-stationary engine test stand (with air conditioning, if required) in order to
be able to quickly optimize application variants.
If these critical driving modes are covered robustly, the constraints for driving within the
urban sections that are critical in terms of immissions often become much more moderate;
this may then have a positive impact onto the emissions produced at the respective locations
as well as the related immission contribution. More details on this aspect will be discussed
in chapter 8.-6-
4 Description of the Test Vehicle and Retrospect
The test vehicle that was used has been described in detail in various publications, e.g. in
[6, 7, 8]. The key features are:
- compact-class car
- displacement approx. 1.7 l
- power / torque 110 kW / 340 Nm
- injection system with a system pressure of 2200 bar (solenoid valves), Digital Rate
Shaping
- RDE-optimized exhaust-gas turbocharger (good transient and low-end torque behav-
ior)
- functions to reduce transient NOx peaks through interventions in the air and fuel sup-
ply pathways [6]
- engine map optimized towards low fuel consumption at moderately low NOx engine-
out emissions
- temperature management of the exhaust-gas after-treatment system
- various layouts of the exhaust-gas after-treatment system; a DOC-SCR system (Die-
sel Oxidation Catalyst - Selective Catalytic Reduction) and a combined NSC-SCR
system (NOx Storage Catalyst)
The following constraints apply to all of the results presented in this paper:
- Following recommendations from the catalyst coaters involved, the components of
the exhaust-gas after-treatment system have been subjected to oven aging or burner
aging in order to achieve a state that is equivalent to a high field mileage. Further-
more, the components have previously been used during testing, in some cases over
more than 10,000 kilometers (or several hundred hours on the engine test stand).
- All measurements are shown as pure mean values, i.e. without application of the
normalization tools currently stipulated by the regulation (total emissions / total dis-
tance covered). Adjustment factors representing the ambient conditions (outside tem-
perature or altitude) were not applied either.
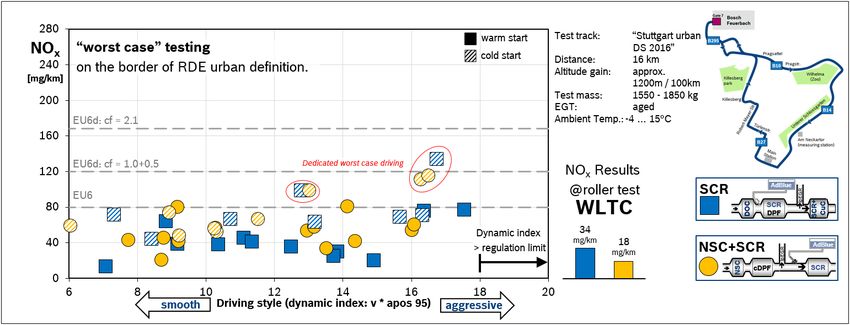
Figure 3 summarizes the results presented in the previous year [4] in order to put the devel-
opment efforts that have been taken in the meantime into context. For the WLTC the com-
bined exhaust-gas after-treatment system comprising a storage catalyst and SCR was at an
advantage. In real driving tests, however, both systems were on the same level and the
impact of the cold start is clearly visible. As expected, the cold start measurements are
somewhat higher but still lie within the range of the cycle's limit of 80 mg/km. Only specific
maneuvers driven by development engineers who were familiar with the details of the sys-
tem's characteristics and its weaknesses at that time resulted in higher measurements get-
ting close to the Euro 6d final limit.-7-
Figure 3: Retrospect 2017 results, real driving test and WLTC [4, 5]
Figure 4 shows the results of the urban real driving measurements presented in figure 3 now
plotted as cumulated NOx emissions over the driving distance. The significance of the cold
start phase is particularly striking. Although the section impacted by the cold start had a
maximum length of only 2.5 km it can account for a very large share of the overall emissions
for the total distance of 16 km.
Generally speaking the expected strong influence of the emissions produced immediately
following the cold start is attributable to the fact that the combustion engine inevitably pro-
duces emissions which cannot be converted because the exhaust-gas after-treatment sys-
tem has not reached its operating temperature yet.
Figure 4: Retrospect 2017 results, analysis of the remaining weaknesses
Another striking detail are the "steps", i.e. periods of increased emissions, to be observed in
particular after a distance of 5 to 6 km and then again after 10 to 11 km has been covered.
An in-depth analysis reveals that this effect is primarily due to a temperature issue in the
exhaust-gas after-treatment system. In the first instance the increased emissions occurred
after an extended downhill section into the Neckar valley when the catalyst system had
cooled off during the overrun and low load operation. As there are several traffic lights on-8-
this section, the car will most probably have come to a standstill at a red traffic light. When
the car then accelerates vigorously as soon as the traffic light turns green, the increased
engine-out emissions produced at this moment coincide with a limited efficiency of the cat-
alyst system that has just cooled off. The second case is similar: with the car having travelled
at a moderate speed on a flat stretch the exhaust-gas after-treatment system will have
cooled off rather strongly; in this state the car then continued onto a longer uphill section
where it was accelerated as the traffic flow permitted. This results in the task to optimize the
emissions during the first phase after the cold start by
- reducing the engine-out emissions as long as the catalyst system has not yet
reached a sufficiently high level of efficiency.
- accelerating the process of heating up the exhaust-gas after-treatment system.
- Once the exhaust-gas after-treatment system has warmed up, to maintain that tem-
perature level as efficiently as possible and/or to prevent it from cooling off again
during phases of overrun or low load.
- If unavoidable, measures to warm up the exhaust-gas after-treatment systems have
to be taken in order to ensure a high degree of efficiency.
5 Further Development Focusing on Temperature Management
Based upon the test vehicle described above the following decisions were taken for the
further development program:
- Initially restriction onto the pure SCR system since the combined system of a storage
catalyst and an SCR catalyst did not yield any advantages on the road but rather
required more application efforts.
- Identification of those operating conditions that are still relevant for emissions in the
current system's state and targeted optimization, possibly on the basis of the existing
hardware.
- Review and adaptation of the RDE test cases for chassis-dynamometer measure-
ments and simulation of the vehicle measurement test on the engine test stand in
order to ensure an efficient and targeted development process.
The task of managing the temperature of the exhaust-gas after-treatment system can be
divided into two sub-tasks:
To warm up the exhaust system after the start:
- Increasing the temperature of the catalysts as quickly as possible through engine-
related measures – which may have an impact on fuel economy.
- As long as the warm-up measures are required (i.e. target catalyst temperature not
reached yet) the engine-out emissions, especially NOx, but also HC and CO, should
be as low as possible.
To maintain the temperature once the exhaust system has warmed up:
- Preventing the catalysts from cooling down or reducing that effect caused by the ex-
haust-gas flow from the engine (which is colder than the current catalyst temperature
during phases of overrun or low load); preferably this is to be achieved by minimizing
the flow rate in the exhaust system. The fuel penalty of all measures taken has to be
kept at a minimum.-9-
- If the temperature in the exhaust system is very high during an overrun or low load
phase, no measures reducing the flow rate are initiated because a certain tempera-
ture reduction is desired in this case.
- Systematic shut-down of the engine during idling as far as possible.
Figure 5 shows an overview of the measures that have been implemented. For the most
part of the operation (engine and exhaust system at operating temperatures) the engine
application is geared towards best fuel economy with moderate NOx emissions. Hence a
high conversion rate has to be achieved in the exhaust system; however, this does not rep-
resent a problem if the application – as required for RDE compliance – also includes very
demanding driving modes. However, fuel consumption has not been optimized to the "last
g/kWh" as this would come at the price of heavily increased NOx emissions.
Figure 5: Overview of temperature management measures for the exhaust system
As physically correct, the warm-up and temperature maintenance functions are triggered by
a diagnosis of the state of the exhaust system. For this purpose the truly relevant tempera-
tures – i.e. the component temperatures in the catalysts – have to be determined as accu-
rately as possible. Modelling the temperatures in the catalysts provides the basis for a sig-
nificant increase of this accuracy compared to a read-out of the temperature sensors of the
engine control unit installed upstream and downstream the catalyst.
As described above the TfL represents a demanding cycle for a diesel powertrain due to the
low loads and the resulting low exhaust-gas temperatures. Figure 6 shows the TfL as a
vehicle test on the chassis dynamometer. The final result is a NOx value of 64 mg/km. Bear-
ing in mind that this test includes the cold start phase and that the average speed for the
entire test is only 13.9 km/h – in the first phase even only 8.9 km/h – we consider this a good
result. Light-off of the oxidation catalyst (DOC) is reached after only 80 seconds; approx. as
of 250 seconds after the start ≥ 85 % of the NOx emissions are converted.
Due to the very good reproducibility (no driver influence, amongst others) a simulation of the
TfL was performed on the engine test bench (see figure 7). The temperatures downstream
the DOC and in the NOx catalyst have been increased by approx. 100 K (downstream DOC
@ 300 s) and by 75 K (in the SCR-on-DPF @ 350 s (Diesel Particle Filter)). This successful- 10 -
outcome is possible only if the temperature-related measures are accompanied by a signif-
icant reduction of the engine-out emissions (measuring point EGT-in = entry into first cata-
lyst).
A comparison with the tailpipe emissions reveals that the after-treatment efficiency has been
increased at the same time which is mainly attributable to the increased temperature level.
However, an increase in fuel consumption is inevitable in this low load cycle, in the current
example by approx. 5.4 %. A comparison with the results reported last year, [4, 7] shows
that the improvement of emissions in the TfL by about 30 % was achieved with a slightly
reduced increase in fuel consumption. This means that the efficiency of the temperature
management measures has been increased significantly.
Figure 6: NOx results for the dyno test "Transport for London" at 23 °C
Figure 7: Impact of temperature management in the dyno test cycle
"Transport for London" at 23 °C- 11 -
It is noteworthy that this fuel penalty only occurs in the situation observed, i.e. during stop &
go traffic immediately after driving off; in the WLTC the fuel penalty amounts to approx. 1.5
%, in the Challenge Cycle or the RTS 95 it is well below 1 %. However, as priority had been
given to those driving modes that are most critical in terms of emissions, no specific optimi-
zation had been performed for the WLTC. Yet the NOx value of 15 mg/km obtained at 23 °C
shows that there still might be some potential for optimizing the fuel economy.
In the Challenge Cycle the situation immediately following a cold start is entirely different.
As the car drives off with a high engine load and thus also a very high energy input into the
exhaust system, the latter's temperature increases quickly; only 80 to 90 seconds after the
engine has been started a very high NOx conversion rate and thus a tailpipe emission curve
close to a flat line are reached. Unfortunately, engine-out emissions of approx. 1.5 g NOx
have already accumulated up to that point since the engine was operated close to full load
and within the smoke limit. These engine-out emissions are roughly equivalent to the total
emissions in the entire first phase of the TfL which lasts 20 minutes. Further improvements
might be achieved by attempting to further limit the engine-out emissions. More details on
the impact of these measures in the Challenge Cycle will not be discussed at this point and
can be found in [8].
In addition to the measurements at 23 °C the studies also focused on lower ambient tem-
peratures. Figure 8 summarizes the influence of various ambient and cold-start tempera-
tures onto the NOx results for the dynamometer test cycles WLTC, TfL and the Challenge
Cycle. The measurements had not been completed when this paper was written; however,
it is clearly recognizable that the NOx increase to be expected at lower temperatures is very
moderate. The HC and CO emissions which were omitted for lack of space show an increase
at lower temperatures, but this is not viewed as critical.
Figure 8: Influence of the cold-start and ambient temperatures onto NOx results
Measurements above the Euro 6-WLTC limit of 80 mg/km can be observed only if the first
phase of the TfL or the Challenge Cycle with its length of 3 km or 3.6 km, respectively, is
considered separately. However, it should be noted that these are extreme use cases which
are not entirely unrealistic but will occur only very rarely. To consider these short sections
as "typical use cases" is certainly not appropriate even for inner-city residents. Since the
engine and the exhaust system have fully warmed up even after the 3 kilometers of the TfL
"jam cycle", a short stop before another trip with the same constraints and emissions begins
is not sufficient. The vehicle rather has to cool down over several hours in order to re-create- 12 -
the same challenges for heating up the exhaust system. In this case, however, no more than
three trips of this kind would be possible per day. If the annual mileage is extrapolated on
the basis of these use cases and is then compared to the average of about 20,000 km for
diesel cars in Germany [9], then it becomes obvious that the real average distances covered
between two cold starts are significantly longer.
In general higher emissions in the early phase of measurements for a test including a cold
start are inevitable; emissions are produced as soon as the engine is started whereas the
after-treatment system reaches an efficient operating state only with a certain delay. The
distance covered during this phase is about one kilometer in the TfL “jam cycle" and even
less in the Challenge Cycle. These considerations will be taken up again in chapter 8 for the
purpose of a proper evaluation of the influence of a cold start onto the immissions.
6 Results of Real Driving Measurements
The functional and application-related optimizations discussed above were accompanied by
real driving measurements using portable measuring equipment. These tests were primarily
performed on the Stuttgart route described above which was deemed a suitably demanding
testing criterion. Those cases that may not be covered sufficiently by this route will be rep-
resented by the dynamometer tests shown in figure 2.
Figure 9 shows an overview of the results obtained at the time when this paper was drafted.
The values presented are the mean values as measured without any weighting functions.
As the outside temperatures prevailing during real driving measurements cannot be influ-
enced, the figure also includes the measuring series conducted prior to the month of August
based upon a previous application version in order to cover a wide range of temperatures.
For the sake of robustness testing the test engineers once again deliberately tried to create
"worst-case" driving conditions which certainly do not meet the regulation's requirements for
"normal driving" but are helpful in validating the robustness.
Figure 9: On-road measurements "Stuttgart – urban"- 13 -
The key findings are as follows:
- All NOx results measured on this test vehicle are below 80 mg/km.
- The deliberate "worst-case" trips represent the upper end of the scatter band.
- The measurements rise with an increasingly dynamic driving style; however, the tests
also confirm that this parameter alone is not sufficient to model all effects of real
driving.
- The impression that there is practically no dependence on the cold start and ambient
temperatures is partially due to the further development of the temperature manage-
ment during the year 2017. If the tests were repeated with the most recent software
calibration settings we would even expect the measurements to be slightly better for
the temperature range around 20 °C. On the other hand, the real driving tests have
confirmed the high level of robustness that was observed during the dynamometer
tests.
- The AdBlue® consumption amounted to 0.6 – 1.0 l / 1000 km.
As mentioned above the interurban sections were under-represented among the test cases
because in general we do not consider these sections as critical and relevant as the test
cases that were actually selected. In our view this approach was confirmed at an event for
motor journalists, the Bosch Mobility Experience, that took place in summer 2017. On that
occasion the journalists were invited to run their own test drives including measurements on
an interurban and urban section [10]. This interurban and urban route included significant
uphill and downhill sections causing potential cooling-off phases to alternate with subse-
quent high-load phases (acceleration while going uphill); this route's altitude gain of 1600 m
/ 1000 km clearly exceeded the respective RDE criterion. During the journalists' test drives
the vehicle mass was close to the permissible total weight (car usually fully occupied plus
measuring equipment). Although the journalists were expressly invited to apply a most de-
manding driving style – while always complying with road traffic regulations – none of the
journalists' drives were outside the RDE requirements; in our view, this confirms that the
requirements of the regulation are reasonable and that driving outside these requirements
cannot be considered "normal driving". At the end of the day all NOx measurements were
well below 80 mg/km. The AdBlue® consumption ranged between 0.5 and 1.8 l / 1000 km –
even for a sometimes aggressive driving style and including the interurban sections.
Hence the results obtained can be summarized as follows:
- Robust compliance with Euro 6d final was demonstrated by the exclusive use of
state-of-the-art technology that has already been implemented in series production
in many applications; all measurements were even below the limit of the cycle.
- An SCR system is required for exhaust-gas after-treatment; for the example pre-
sented here, a combination with a DOC is sufficient.
- Based upon the measurements obtained we expect the AdBlue® consumption during
mixed customer operation to lie within a range of 1.0 l to 1.5 l / 1000 km.
- The progress achieved over the status presented one year ago is owed to the opti-
mization of the application strategy and the control and feedback control functions,
especially regarding the temperature management of the exhaust system. This is
where we see further potential for improvement even going beyond these advances.- 14 -
- It is crucial, that the basic hardware regarding the engine and the vehicle is RDE
capable, e. g. that RDE requirements have been taken into account concerning tur-
bocharger matching, package of the exhaust system, etc.
7 Further Potential for Improvement
In spite of the promising results obtained so far we will persistently continue the latest de-
velopment activities in order to lower the emissions further while increasing the robustness
under various driving conditions.
The measures briefly described in the following have already been implemented in specific
studies pursued by Robert Bosch GmbH. This list is also meant to demonstrate that the
objective of not burdening the diesel powertrain with additional cost increases while main-
taining its CO2 benefit seems to be achievable.
- The overall set of issues related to "temperature management, low load, cold start"
includes the aspects of variable valve timing and the exhaust turbocharger with by-
pass (an additional waste gate to bypass the VTG unit in order to reduce the heat
losses during the heat-up phase).
- Optimization of the exhaust turbocharger with regard to the RDE requirements also
is related to the activities for the phase "immediately after cold start"; more specifi-
cally, driving off at high load is now to be examined.
- One additional measure to deal with the two issues described above is the implemen-
tation of a combined system comprising an NSC and SCR catalyst with an adapted
catalyst chemistry (also see [4]).
- One possibility to improve the impact of an additional underfloor SCR catalyst is to
define a second injection point for the reducing agent. This also opens up the door
for further improvements regarding NOx emissions during DPF regeneration, robust-
ness of the low-pressure EGR and catalyst diagnosis [8].
- As indicated above, we believe that in spite of the progress achieved and demon-
strated there is still a significant potential for further improvement, especially regard-
ing the control and feedback control functions. This may even lead to a model-based
predictive function that coordinates all actions required to robustly comply with the
RDE requirements.
The following paragraphs of this paper will briefly deal with the concept of an additional
energy input into the exhaust system, in this case by an electrically heated catalyst. Bosch
has conducted comprehensive simulations on this issue; figure 10 provides a quick glimpse
at some of these simulations.
The simulation is based upon a TfL cycle because, with its pronounced low-load and low-
speed profile, this seems to be the ideal cycle for an optimization through an additional en-
ergy input. In the example the engine is started without any temperature-management
measures while the emission behavior is to be optimized through an additional input of en-
ergy upstream the DOC. The specific energy input is 2 kW (which is the absolute maximum
that is, in our view, possible in a 12 Volt electrical system); due to the specific characteristics- 15 -
of the cycle this energy input was maintained for 1000 seconds (i.e. for more than 15
minutes, which is questionable with a conventional 12 Volt electrical system.
Figure 10: Simulation of electrical energy input into the exhaust system
The initial (simplified) assumption is to use the battery as the source of this energy. The
simulation shows that the tailpipe emissions are improved significantly; however, starting
from 210 mg/km the improved result of 160 mg/km obtained in the simulation widely misses
the result achieved in testing using engine-related measures (figure 6, 64 mg/km). The key
disadvantage of electric heating compared to engine-related measures is the fact that the
engine-out nitrogen oxide emissions cannot be reduced. An objection that is frequently
raised points out that the engine-related measures come with a fuel penalty whereas the
regenerated electrical energy is basically available free of charge. In this case, however,
one has to admit that it is hardly possible to easily recuperate the energy of more than 0.5
kWh required in the example; this would most probably require a large e-machine. However,
if an e-machine offering such a major recuperation performance is already available, then
the recovered energy can of course also be used for alternative and fuel-saving purposes,
i.e. to supply the electrical system or for proper driving. If this energy is used to heat up the
exhaust system, then it will not be available for purposes directly improving the fuel econ-
omy. Hence it is wrong to assume that the recuperated energy is available for free.
We believe that, in fuel consumption equivalents, a value of at least approx. 200 g/kWh
equivalent to the Willans line would have to be assumed. This means that for our demon-
strator vehicle the measure "heating with 2 kW over 1000 seconds" would result in an in-
crease in fuel consumption by approx. 18 % due to the losses occurring during multiple
electrical conversions – without reaching the emission target. And a load increase which
basically supports the heating-up process is only of limited use because the higher load on
the combustion engine would also result in higher engine-out NOx emissions – which would
be counterproductive. Even an energy input of more than 2 kW would not improve the situ-
ation noticeably since the total energy of approx. 0.5 kWh required to heat up the system
and especially to maintain the temperature level is not so much a matter of performance but
rather of heating capacity.- 16 -
Hence we believe that the following conclusions can be drawn:
- The presented engine-related optimization measures during the warm-up phase
geared towards minimum NOx emissions, a high exhaust-gas enthalpy flow and a
minimal fuel penalty are indispensable if the emission targets are to be achieved.
- An additional electric energy input may make sense as an add-on measure once all
engine-related possibilities have been exhausted and the target has not been
reached yet. However, the design efforts and the operating-energy demand this
measure would entail have to be considered.
- For driving modes with a higher exhaust-gas flow rate the demand for electric energy
and the necessary power are significantly higher than in the example discussed
above; this is exemplified by the Challenge Cycle with its early full-load acceleration
maneuvers. Even an energy input of considerably more than 2 kWh would not result
in a noticeable benefit.
8 Future Contribution of the Diesel Powertrain to the NO2 Immissions
at the Stuttgart "Neckartor"
The low NOx emissions described above have been achieved through the exclusive use of
technologies that are currently available on the market or have already proven their worth in
series production. Against this background we are convinced that the increasing number of
Euro 6d diesel cars will bring about an improvement of the immissions. With an increasing
penetration of this standard the diesel passenger car fleet will no longer contribute to air-
quality degradation in a relevant manner. This matter will be discussed in depth in the current
chapter.
Due to the variety of influencing parameters it is difficult to establish a direct link between
NOx emissions and NO2 immissions. Nevertheless, the paper we presented last year [4]
already marked an attempt to assess the potential reduction of NO2 immissions at the air-
quality hot spot "Neckartor" in Stuttgart by way of an improved NOx emission behavior of
passenger car diesel engines. For this purpose, the specific situation at the "Neckartor"
measuring station has to be examined more closely.
Compared to the distribution of the average nitrogen oxide emissions that were measured
on the entire Stuttgart route (16 km long) during numerous PEMS trips (figure 11, left half)
the emission classes in the direct vicinity of +/- 2 km around the “Neckartor” show an inter-
esting pattern. At this measuring station the mean value for NOx emissions of approx. 10
mg/km (figure 11, right half) is lower than the corresponding value for the entire urban route.
This results from the driving conditions which on this road section are rather moderate in
terms of vehicle speed, acceleration and especially ascending gradients. In addition, the
exhaust system including the catalysts will in most cases already have heated up when the
car passes the measuring station. Analyses of the trip lengths and driving times to the
“Neckartor” spot based upon a transport demand model of the Stuttgart region [12] have
revealed that there is hardly any traffic originating in the area, i. e. the cars passing the
“Neckartor” will in most cases already have covered one or several kilometers. Furthermore,
the extent of the influence of a cold-engine start is illustrated by a comparison of the left-- 17 -
hand and middle charts of figure 11; without a cold start the trip-related nitrogen oxide emis-
sions for the entire urban route drop from 43 mg/km to 23 mg/km.
At this point we would like to repeat our strong belief that the cold-start emissions do not
play a major role on many heavy-traffic road sections; for this reason the local NOx emis-
sions used for immission calculations have to be determined carefully and realistically. For
the present example this means that the right-hand chart would have to be examined thor-
oughly. It would be hardly realistic to assume that during times of high traffic density most
of the road users will start their cars in the direct vicinity of the hot spot; hence the conclu-
sions drawn for the “Neckartor” area will also be valid for many other critical hot spots.
Figure 11: Nitrogen oxide emissions of the entire urban trip (with and without cold-start
emissions) and focus on “Neckartor”
Based upon the insights gained regarding the future NOx emissions of diesel cars and using
a methodologically comprehensive immission calculation approach we will in this year re-
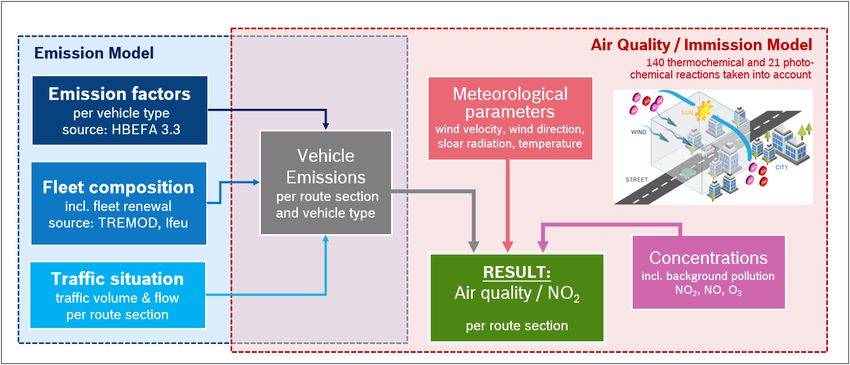
shape the scenarios presented in last year's paper. AVISO GmbH was commissioned to run
simulations on the NO2 immissions at the “Neckartor”; they did so by using a so-called chem-
istry box model which computes the atmospheric dispersion and the chemical conversion of
emissions from different sources as well as the background concentration taking meteoro-
logical parameters (e.g. wind speed, solar radiation) into account. The essential input pa-
rameters for the model are the direct emissions from road traffic (e.g. NOx) as well as the
background pollution (see figure 12). In order to derive the NO2 immissions at a measuring
station such as Stuttgart “Neckartor” the chemical conversion of various substances is sim-
ulated in the chemistry box; in this process approx. 140 thermochemical and another 12
photochemical reactions are considered [13].
The traffic-related NOx emissions used to compute the immissions on the basis of the chem-
istry box model were taken from the Handbook Emission Factors (Handbuch für Emis-
sionsfaktoren, HBEFA), version 3.3 [14]. To this aim the different vehicle segments (pas-
senger cars, light and heavy commercial vehicles and busses) as well as the respective
powertrains / fuel types of these vehicles (mainly gasoline and diesel engines) and their EU
emissions levels according to the respective certificates (Euro 5, Euro 6, etc.) were distin-
guished. Furthermore the distribution of the different vehicles within the overall fleet as well
as the statistical distribution of the traffic situations (smooth traffic flow, heavy traffic or even- 18 -
stop & go traffic) were considered in the model; the latter is important because the underlying
NOx emission assumptions increase with increasing traffic density.
Figure 12: Schematic view of the AVISO simulation model
The time intervals applied by the model are rather short; the results for the individual time
intervals are then added up to obtain the annual mean value. In the current example the
simulation model was calibrated to the actual values of the measuring station "Neckartor" in
Stuttgart. Hence the reference scenario A for the year 2015 (figure 13) shows an annual
mean value for NO2 immissions of 87 µg/m3.
Two scenarios were simulated to provide an outlook onto the future, for both cases a com-
plete market penetration with vehicles according to the below mentioned emissions was
assumed:
- scenario B: NOx emissions of 80 mg/km for Diesel cars & 20 mg/km for gasoline cars
(corresponding to Diesel Euro 6d-final with CF = 1.0 (Conformity Factor))
- scenario C: best-case scenario based upon the assumption of 10 mg/km of NOx emis-
sions for all cars (diesel & gasoline)
The detailed studies and technical measures presented in chapters 5 and 6 have proven
that future diesel engines will be able to achieve these low levels of NOx emissions. Further-
more figure 11 has confirmed these data for the hot spot at the Stuttgart “Neckartor”. As
there are no reliable forecasts available regarding the urban background pollution the level
of 2015 was assumed to remain constant for the purpose of these future scenarios.
Closer analysis of the results of the two future scenarios of figure 13 shows that the contri-
bution to total NO2 immissions coming from a fleet of diesel and gasoline cars that produce
NOx emissions as assumed for the two scenarios would be negligible. If the diesel cars
within that entire fleet emit 80 mg/km, this contribution amounts to approx. 7 µg/m³; that
value drops to approx. 1 µg/m³ if the emissions decrease to the best-case assumption of
scenario C of 10 mg/km NOx for all cars.- 19 -
This shows that the contribution to NO2 immissions produced by road transport will decrease
considerably in the future. Hence the focus will shift towards the reduction of the urban back-
ground pollution that is not caused by road transport but by power plants, industrial facilities
or domestic heating systems; this background pollution already accounts for roughly half of
the permitted annual mean NO2 value of 40 µg/m3.
Figure 13: Scenarios forecasting NO2 immission at Stuttgart “Neckartor”
9 Conclusion
This paper has exemplarily shown for a compact car, that systematic optimization bears a
significant potential to further reduce nitrogen oxide emissions under real driving conditions.
From our perspective these findings could be transferred with necessary system adaptation
also to other vehicle segments. Exploiting these important possibilities does not conflict with
the requirement for diesel powertrains to maintain or even lower the level of CO2 emissions
reached so far. A fuel penalty in the single-digit range (TfL approx. 5 %) is to be expected
only in special low-load cycles and in stop & go traffic because of the active temperature
management required under these conditions. A significant increase of the cost of the diesel
powertrain can be prevented if adequate technologies already available in series production
are used. The authors believe that instead of adding further technological elements, top
priority should be given to the optimum interaction of various NOx-reducing actions.
In our view the new RDE regulation with its broad coverage of potential driving conditions,
topographies and environmental conditions will result in a significant improvement of immis-
sions, especially at the critical hot spots. Our experience has shown that the RDE constraints
and the corresponding emission limits reflect the real driving conditions in a reasonable
manner. To this we would like to add some further explanations.
The aim of the RDE regulation was to represent at least 95 % of the real driving conditions.
This aspect is shown schematically in figure 14. Within the area highlighted in green ("95 %
of real world driving") the emissions must remain within the given limits even during real
road driving. The regulatory framework defines the essential parameters on driving behav-
ior, topography and climatic conditions.- 20 -
At the edges to the left and right of the area covered by RDE, an accumulation of extreme
constraints can produce conditions which will lead to a violation of the emission limit appli-
cable for the RDE range. One extreme case that is also covered by the RDE regulation
would be a traffic jam; under worst traffic-jam conditions the vehicle does not cover any
distance at all, which, mathematically speaking, would result in a division by a distance of
"0 km" – which would then give infinite emissions.
Figure 14: Schematic view of "real driving" and relating emissions
For this reason the emissions would rise sharply in the left-hand low-load range. On the
right-hand side it would also be possible to create a situation where the high load combined
with the other parameters of the list results in a violation of the limit. Considering these two
extreme cases, however, there can be no doubt that such driving conditions represent only
a small share of the total real-driving conditions within a fleet; this small share is represented
by the grey areas in the two border regions underneath the curve.
As the figure shows, the highest nitrogen oxide emissions will occur during real driving under
the conditions listed to the far left and far right. Furthermore, the figure illustrates that the
statistical relevance of these border regions compared to the real-driving situations is signif-
icantly lower. Hence a passenger-car diesel powertrain calibrated in accordance with the
current RDE regulation would produce nitrogen oxide emissions that will stay well below the
limit for most of the day-to-day trips covered. The resulting improvements regarding immis-
sions have been impressively demonstrated in this paper. Figure 11 exemplifies these find-
ings for the Stuttgart route. In other words, a value that gets close to the limit in the middle
of the scatter band would cause a violation of that limit in the border regions.
The diesel-based powertrain has thus proven to be a future-proof solution for the entire
mobility mix of the future.- 21 -
10 Bibliography
[1] NOx, Feinstaub, CO2 im Real-Fahr-Test, Elf Autos im Abgas-Check, Veröffentlichung
auto-motor-sport, AMS Heft 15 06.07.2017, https://www.auto-motor-und-
sport.de/testbericht/nox-partikel-co2-11-autos-im-real-fahr-test-706486.html
[2] Landesanstalt für Umwelt, Messungen und Naturschutz Baden-Württemberg, Luftrein-
haltepläne für Baden-Württemberg, Grundlagenband 2015, https://www4.lubw.baden-
wuerttemberg.de/servlet/is/265221/luftreinhalteplaene_grundlagen_2015.pdf?com-
mand=downloadContent&filename=luftreinhalteplaene_grundlagen_2015.pdf
[3] United States Environmental Protection Agency (EPA), National Ambient Air Quality
Standards, https://www.epa.gov/criteria-air-pollutants/naaqs-table, called up on
15.12.2017
[4] A. Kufferath, M. Krüger, D. Naber, R. Maier, J. Hammer, Robert Bosch GmbH,
Stuttgart: “Fuel consumption in accordance with real driving emissions, the future of
Diesel Passenger Car”, 38. Internationales Wiener Motoren Symposium, Wien 2017
[5] “Developing a test programme and analysis of emissions data from passenger cars in
London”, Transport for London, http://content.tfl.gov.uk/london-exhaust-emissions-
study-developing-a-test-programme.pdf
[6] M. Krüger, R. Maier, D. Naber, S. Scherer, H. Schumacher, M. Strobel, Robert Bosch
GmbH, Stuttgart: „Emission Optimization of Diesel Passenger Cars to Fulfill „Real Driv-
ing Emission (RDE) Requirements“, 24th Aachen Colloquium Automobile and Engine
Technology, Aachen 2015
[7] D. Naber, A. Kufferath, M. Krüger, R. Maier, S. Scherer, H. Schumacher, R. Bosch
GmbH, S.: „Measures to Fulfill „Real Driving Emission (RDE)“ with Diesel Passenger
Cars“, 17. Stuttgarter Symposium Automobil- und Motorentechnik, Stuttgart 2017
[8] D. Naber, S. Bareiss, A. Kufferath, M. Krüger, H. Schumacher, Robert Bosch GmbH,
Stuttgart: „Measures to Fulfill „Real Driving Emission (RDE)“ with Diesel Passenger
Cars“, 18. Stuttgarter Symposium Automobil- und Motorentechnik, Stuttgart 2018
[9] Verkehr in Zahlen 2017/2018, Bundesministerium für Verkehr und digitale Infrastruk-
tur, Seite 308/309
[10] J. M. Gitlin, Automotive Editor, A diesel emissions test you can’t game? We try it out,
Bosch Mobility Experience, https://arstechnica.com/cars/2017/07/a-diesel-emissions-
test-you-cant-game-we-try-it-out/
[11] T. Bayer, Double Injection SCR – Bosch Weiterentwicklung zur Erreichung zukünftiger
Emissionsanforderungen, 18. Stuttgarter Symposium Automobil- und Motorentechnik,
Stuttgart 2018
[12] M. Friedrich, Institut für Straßen- und Verkehrswesen und Verkehrsleittechnik (ISV),
Universität Stuttgart: PKW-Fahrtweiten und Fahrzeiten zum Neckartor (Stuttgart), er-
rechnet auf Basis des Verkehrsnachfragemodells der Region Stuttgart, Juli 2017
[13] Nicola Toenges-Schuller, C. Schneider, A. Niederau, R. Vogt, S. Hausberger: Model-
ling the effect on air quality of Euro 6 emission factor scenarios, Journal of Earth Sci-
ences and Geotechnical Engineering, vol.6, no. 4, 2016
[14] Handbuch für Emissionsfaktoren HBEFA Version 3.3 (inkl. 2017 Aktualisierung der
betriebswarmen NOx-Emissionsfaktoren von Diesel-PKW der Emissionsnormen Euro
4, Euro 5 und Euro 6 unter Berücksichtigung neuer Messungen), http://www.hbefa.
net/e/index.htmlYou can also read