Lawrence Berkeley National Laboratory - Recent Work - eScholarship
←
→
Page content transcription
If your browser does not render page correctly, please read the page content below

Lawrence Berkeley National Laboratory
Recent Work

Title
Accelerating Energy Efficiency Improvements in Room Air Conditioners in India: Potential,
Costs-Benefits, and Policies

Permalink
https://escholarship.org/uc/item/8710154k

Authors
Abhyankar, N
Shah, N
Park, WY
et al.

Publication Date
2017

Peer reviewed

 eScholarship.org                                 Powered by the California Digital Library
                                                                  University of California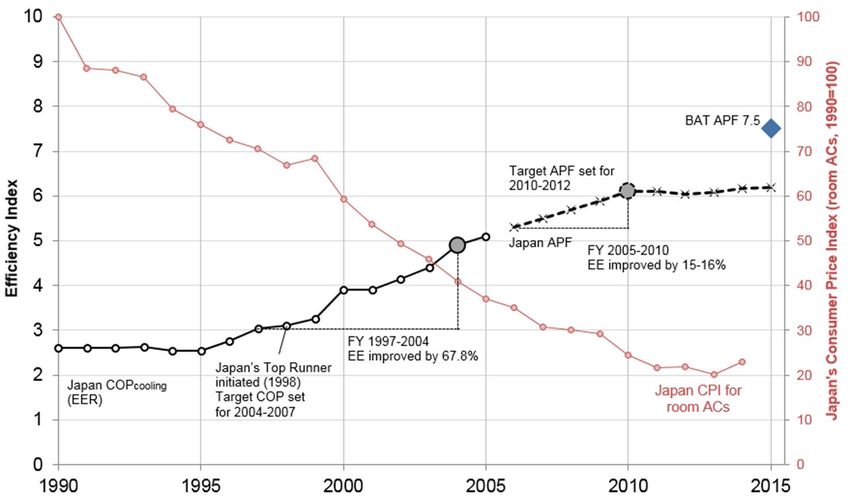
LBNL-1005798

ERNEST ORLANDO LAWRENCE
BERKELEY NATIONAL LABORATORY

Accelerating Energy Efficiency Improvements
in Room Air Conditioners in India:
Potential, Costs-Benefits, and Policies

Nikit Abhyankar
Nihar Shah
Won Young Park
Amol Phadke

Energy Analysis and Environmental Impacts Division

April 2017

This work was funded by the U.S.-India Space Cooling Collaboration through the
U.S. Department of Energy's Office of International Affairs under Lawrence Berkeley
National Laboratory Contract No. DE-AC02-05CH11231.
Disclaimer

This document was prepared as an account of work sponsored by the United States Government.
While this document is believed to contain correct information, neither the United States
Government nor any agency thereof, nor The Regents of the University of California, nor any of
their employees, makes any warranty, express or implied, or assumes any legal responsibility for
the accuracy, completeness, or usefulness of any information, apparatus, product, or process
disclosed, or represents that its use would not infringe privately owned rights. Reference herein
to any specific commercial product, process, or service by its trade name, trademark,
manufacturer, or otherwise, does not necessarily constitute or imply its endorsement,
recommendation, or favoring by the United States Government or any agency thereof, or The
Regents of the University of California. The views and opinions of authors expressed herein do
not necessarily state or reflect those of the United States Government or any agency thereof, or
The Regents of the University of California.

   Ernest Orlando Lawrence Berkeley National Laboratory is an equal opportunity employer.

                                               2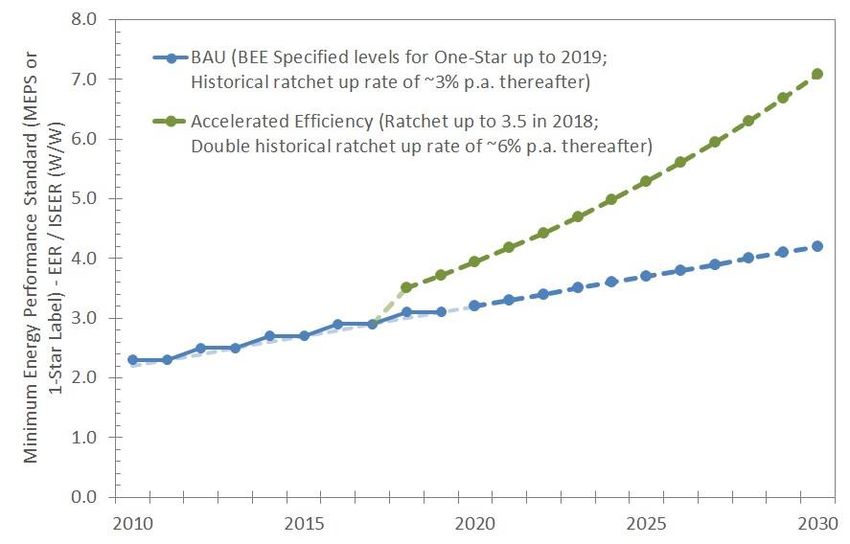
Acknowledgments

We are thankful for the U.S .Department of Energy’s financial support for this analysis. We thank
Charles Goldman, Anna Spurlock, Larry Dale, and Nihan Karali of Lawrence Berkeley National
Laboratory, Gabrielle Dreyfus of the U.S. Department of Energy, Saurabh Diddi of the Bureau
of Energy Efficiency, Ashok Sarkar and Defne Gencer of The World Bank, Aditya Chunekar of
Prayas Energy Group, Radhika Khosla of Center for Policy Research, Balaji Natarajan and Xiaojuan
Wang of the United Nations Multilateral Funds Secretariat, Bhaskar Deol and Sameer Kwatra of
the Natural Resources Defense Council, Mahesh Patankar of MP EnSystems, and P. K. Mukherjee
and Archana Walia of the Collaborative Labeling and Appliance Standards Program for their
helpful reviews of this report. We thank Nan Wishner for careful editing of the report and
Elizabeth Coleman and Heather Thomson for providing the administrative support.

The authors are responsible for any errors or omissions.

This work was funded by the U.S.-India Space Cooling Collaboration through the U.S.
Department of Energy's Office of International Affairs under Lawrence Berkeley National
Laboratory Contract No. DE-AC02-05CH11231.

Table of Contents
Executive Summary ................................................................................................................................................ 5
1      What is at Stake: The Need to Meet Space Cooling Demand Sustainably .................................................... 7
2      Room Air-conditioner Efficiency and Policies in India................................................................................... 9
3      Air-Conditioner Efficiency in Japan and Korea: Examples of Accelerated Efficiency Improvement Driven
       by Policy ....................................................................................................................................................... 12
    3.1        Japan .................................................................................................................................................... 12
    3.2        South Korea .......................................................................................................................................... 14
4      Technical Feasibility, Impact, and Costs-Benefits of Accelerated Air-Conditioner Efficiency Improvement
       in India .......................................................................................................................................................... 17
    4.1        Technical Feasibility of the Accelerated Efficiency-Improvement Scenario .......................................... 18
    4.2        Impact of Accelerated improvement in Air-Conditioner Efficiency ...................................................... 20
       4.2.1           Reduction in Electricity Consumption and Peak Load .............................................................. 20
       4.2.2           Net Consumer Benefit ................................................................................................................ 21
    4.3        Rebound Effect ..................................................................................................................................... 24
    4.4        Sensitivity Analysis ............................................................................................................................... 26
5      Discussion and Conclusion: Policies and Programs to Accelerate Room AC Efficiency Improvement ....... 27
    5.1        Accelerated Ratcheting Up of Bureau of Energy Efficiency Star Rating Levels .................................... 27
    5.2        Providing Policy Direction with Medium- and Long-Term Targets for Star Levels ................................ 28
    5.3        Bulk Procurement and Incentives to Support Accelerated Ratcheting Up of Standards and Labeling
               Levels .................................................................................................................................................... 29
    5.4        Star Rating for Other Types of Space-Cooling Equipment .................................................................... 30
6      Appendix: Assumptions Regarding Air-Conditioner Efficiency Improvement, Prices, Sales, Energy and Peak
       Projections, and Consumer Costs-Benefits.................................................................................................... 31
    6.1        Air-Conditioner Efficiency Trajectory ................................................................................................... 31
    6.2        AC Prices ............................................................................................................................................... 31
    6.3        Net Consumer Benefit .......................................................................................................................... 33
    6.4        Air-Conditioner Sales, Stock, Total Energy Consumption, and Peak Load ............................................ 33
References ............................................................................................................................................................ 35

                                                                                    4
Executive Summary

Rising incomes, increasing urbanization, and large cooling demand prompted by India’s hot,
humid climate are driving increasing uptake of room air conditioners (ACs). Air conditioning
already accounts for 40-60% of summer peak load in large Indian cities such as Delhi and is on
track to contribute 140 gigawatts (GW) (~30%) to peak demand in 2030. India’s standards and
labeling policies improved the market average efficiency of room ACs by about 35% between
2006 and 2016 (3% per year) even as inflation-adjusted room AC prices continued to decline. In
this report, we assess the technical feasibility and costs and benefits of accelerating the efficiency
improvement in room ACs in India and discuss policy enhancements needed to achieve this goal.

We also describe examples of rapid AC efficiency improvement from Japan and Korea. Driven by
appropriate policies and programs, AC efficiency in these countries improved by more than 8%
per year, resulting in near-doubling of energy efficiency over seven to ten years while inflation-
adjusted AC prices declined. We also find that the most efficient room AC sold on the Indian
market is almost twice as efficient as the average AC sold on the market in 2015-16. As a result,
we conclude that the technology needed to accelerate room AC efficiency in India is available.

If, starting in 2018, the market average room AC efficiency improves by 6% per year instead of
the current 3% per year, about 39 GW of peak load (equivalent to about 80 power plants of 500
MW each), and more than 64 TWh per year of energy (equivalent to the current electricity
consumption of the entire state of Gujarat) could be saved by 2030. The net present value (NPV)
of the consumer benefit between 2018 and 2030 would range from rupees (Rs) 4,000 crore or
US$600 million (if room AC prices increase as expected based on estimates of current cost of
efficiency improvement) to Rs 173,000 crore or US$25 billion (if room AC prices do not increase
with efficiency improvement, as has been the case historically). Although the rebound effect
could reduce the financial benefit of efficiency improvements, it would not affect the overall
consumer welfare benefit.

This benefit is achievable by ratcheting up India’s one-star efficiency level (the de-facto minimum
energy performance standard) for room ACs to the level of the current (2016) five-star rating by
2022 and to the level of current best available technology on the market by 2026. Bulk
procurement, similar to that used in UJALA LED Program, and incentive programs would be
crucial for accelerating the market transformation, especially pulling up the top of the market.
Similar programs could be implemented for other types of ACs.

                                                  5
6
Accelerating Energy-Efficiency Improvements in Room Air Conditioners
in India: Potential, Costs-Benefits, and Policies
Nikit Abhyankar, Nihar Shah, Won Young Park, Amol Phadke
1 What is at Stake: The Need to Meet Space Cooling Demand Sustainably
India’s hot, humid climate prompts substantial demand for space cooling, and air conditioner
(AC) use is increasing rapidly with the country’s rising incomes and increasing urbanization
(Phadke, Abhyankar, & Shah, 2013). Room ACs account for 99% of all ACs purchased, and
their sales have grown at a compounded annual growth rate (CAGR) of 12.5% per year
between 2005 (1.3 million) and 2014 (3.7 million) (Phadke et al., 2013; PWC, 2015; Shah,
Waide, & Phadke, 2013). An AC is highly electricity intensive; at full load, a typical room AC
consumes about 150 times the power of a light-emitting diode (LED) bulb or 20 times the power
of a regular ceiling fan.1 Because many parts of India routinely experience extremely hot
temperatures, increasing the availability and affordability of space-cooling technologies
including fans and ACs is (along with improving building design to ensure thermal comfort) an
important opportunity to improve health and economic well-being. A recent study by Davis
and Gertler (2015) shows that India has largest AC market growth potential in the world
because of the country’s large population and large number of cooling degree days2 (Figure 1),
low but increasing incomes, and extreme temperatures that are rising due to climate change.
India’s Bureau of Energy Efficiency (BEE) has highlighted the nation’s concern about the
already large electricity demand from ACs, which BEE estimated at 60-80 terawatt hours
(TWh) in 2014 (Diddi, 2014). In addition, where AC penetration is significant, it has a large
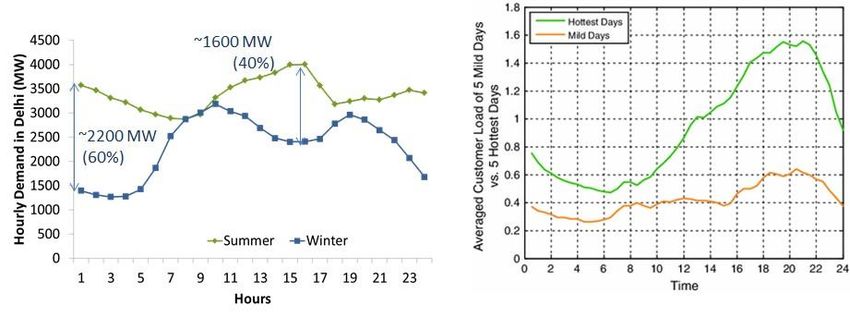
peak load impact. For example, in New Delhi, cooling accounts for 40-60% of the summer peak
load. In parts of the world that have even higher AC penetration (as a percentage of
population), such as Australia, the peak load can triple on hot days (Figure 2).
1
ACs in India commonly have a cooling capacity of 1.5 tons, i.e. roughly 5.25 kilowatts (kW) of cooling. At an
Indian seasonal energy-efficiency ratio (ISEER) of 3.5, this equals roughly 1.5 kW of power consumption, which
is roughly 150 times the power consumption of a 10-watt (W) LED bulb or 20 times that of a regular ceiling fan
consuming about 75W.
2
Cooling Degree Days: A cooling degree day is a unit used to estimate the need for space cooling based on the
daily temperature. Annual cooling degree days are calculated by subtracting 65 from a day's average
temperature in Fahrenheit and adding the results over a year.
7Figure 1: Top 12 countries by air-conditioning potential measured in cooling degree days (CDD); the size of the bubble indicates
the relative population size (Source: Davis and Gertler, 2015)
Figure 2: Space- cooling load in New Delhi is 40-60% of summer peak load (left); AC can triple load in the hottest areas of the
world, e.g., New South Wales, Australia (right)
Data sources: (DSLDC, 2012; Smith, Meng, Dong, & Simpson, 2013)
Room AC penetration was a little more than 5% in urban India in 2011 (NSSO, 2012; Shah et al.,
2013). For comparison, room AC penetration in urban China grew from about 5% in 1995 to
more than 130% in 2012 (IBISWorld, 2013; Zhou et al., 2012). In the absence of additional
policy interventions, i.e., under a business- as- usual (BAU) scenario, room AC penetration is
expected to rapidly increase in India and could add about 140 GW to the peak demand
(equivalent to about 300 power plant units of 500 MW each) by 2030 and between 300-500
GW by 2050 (Phadke et al., 2013; Shah, Wei, Letschert, & Phadke, 2015a); these values are
8equivalent to about 30% of the projected peak loads in 2030 and 2050 (Abhyankar et al., 2013;
NITI Aayog, 2015).
A holistic strategy is needed to sustainably meet the challenge of growing electricity demand
from room ACs. This document presents a vision for efficient air-conditioning equipment in
India, focused mainly on mini-split room ACs. We draw on Indian and international experience
with policies that can drive rapid adoption of efficient air-conditioning equipment. We
underscore that, although our focus is on increasing the AC efficiency, it is only one strategy
f o r meeting cooling demand sustainably. Improving efficiency needs to be
complemented by other strategies that reduce cooling demand (e.g., employing cool roofs,
efficient building design, and energy management systems) and that deliver cooling efficiently
at minimal cost (e.g., using efficient ceiling fans).
The remainder of the report is organized as follows. In Section 2, we review the current status
and trends related to room AC efficiency in India and summarize the policies that India has
used to drive room AC efficiency. In Section 3, we summarize similar experience in Japan
and Korea where room AC efficiency has almost doubled over approximately 10 years and
draw insights relevant to future policies to accelerate room AC efficiency improvement in
India. In Section 4, we assess the technical feasibility and costs-benefits of scenarios for rapidly
improving AC efficiency in India and discuss policies that can be used to achieve this goal. In
Section 5, we discuss the key policy and program options in India for accelerating the room AC
efficiency improvement.
2 Room Air-conditioner Efficiency and Policies in India
India’s Energy Conservation Act of 2001 provides the legal and institutional framework for
the Government of India to promote energy efficiency across all sectors of the economy. BEE
was created under the Ministry of Power to implement the Energy Conservation Act.3 BEE
launched a voluntary standards and labeling (S&L) program in May 2006 with an overarching
agenda to reduce the energy intensity of electrical appliances. The labels use a comparative
five-star rating system based on annual or daily energy consumption. The labeling scheme
combines the comparative star labels with minimum energy performance standards (MEPS);
products that meet the relevant MEPS are awarded o n e star. Products awarded the five-
star level are the most efficient on the market, meeting the most stringent consumption
requirements in the program. In 2012, mandatory labeling was introduced for split and window
fixed speed room ACs (BEE, 2012).
3
The Energy Conservation Act was amended in 2010 to empower BEE to accredit energy auditors and to hire its
own staff, and the Central Government to issue energy savings certificates.
9Historically, BEE has revised its efficiency performance criteria and the energy-efficiency ratio
(EER) of the star levels every two years (see Table 1), giving ap p ro x im a t e l y two years
advance notice of implementation of new performance levels so that the AC industry has time
to adjust its supply.
Table 1: BEE star rating levels for split ACs effective January 2012 through December 2015
Star Levels for Split ACs Star Levels for Split ACs
(1 Jan 2012 - 31 Dec 2013) (1 Jan 2014 - 31 Dec 2015)
Minimum EER Maximum EER Minimum EER Maximum EER
(W/W) (W/W) (W/W) (W/W)
1-Star 2.50 2.69 1-Star 2.70 2.89
2-Star 2.70 2.89 2-Star 2.90 3.09
3-Star 2.90 3.09 3-Star 3.10 3.29
4-Star 3.10 3.29 4-Star 3.30 3.49
5-Star 3.30 5-Star 3.50
Source: BEE (2012, 2014)
In June 2015, BEE adopted a voluntary label for split inverter ACs with a one-star level of 3.1
and a five-star level of 4.5, using the newly adopted Indian seasonal energy-efficiency ratio
(ISEER) metric, which is based on International Standards Organization (ISO) standard 16358
but uses an India-specific temperature distribution.4 Table 2 shows the minimum and
maximum ISEER levels for inverter AC labels.
Table 2: BEE star rating levels for inverter ACs effective June 2015 through December 2019
Star Levels for Inverter ACs
(29 June 2015 - 31 Dec 2019)
Minimum ISEER Maximum ISEER
(Wh/Wh)* (Wh/Wh)
1-Star 3.1 3.29
4
ISO adopted 16358 in 2013 to provide an international standard for rating fixed-speed and inverter (or
variable -speed) ACs under the same metric. This metric (cooling season performance factor [CSPF]/heating
season performance factor [HSPF] or annual performance factor [APF]) allows a weighted average to be
calculated based on a country- or region-specific temperature bin. This framework has the advantage of
using the same test points as the ISO 5151 rating standard for ACs, making for a smoother transition to rating
of inverter and fixed-speed ACs under the same metric while also capturing the benefits of the part-load
savings available under a seasonal metric. For cooling-only operation, this metric is known as CSPF. In 2015,
BEE has adopted ISO 16358 but modified the temperature-bin distribution to account for the hotter weather in
India and to calculate the ISEER metric for fixed-speed and inverter ACs. BEE has adopted the ISEER metric to
measure room AC performance in India in the future (Shah et al., 2016).
102-Star 3.3 3.49
3-Star 3.5 3.99
4-Star 4.0 4.49
5-Star 4.5
*Wh – Watt-hours
Source: (BEE, 2015)
The ISEER metric captures the efficiency benefits of part-load operation of room ACs. Inverter ACs
that employ variable-speed drives, can operate at part-load while fixed speed ACs can operate only at
full load. The ISEER metric and the star labels shown in Table 2 are due to become mandatory for all
ACs (fixed-speed and inverter ACs) in 2018.
4.0
100
Wholesale Price Index for Air Conditioners relative
Room AC Efficiency EER (W/W) or ISEER (Wh/Wh)
to other commodities (2008 = 100)
3.0 80
60
2.0
40
BEE's One-Star label for room ACs (split)
1.0
Market Average (Approximate) 20
WPI for ACs relative to other commodities (2005 = 100)
0.0 0
2008
2005
2006
2007
2009
2010
2011
2012
2013
2014
2015
2016
Figure 3: Trends in room AC efficiency improvement and decline in AC prices in India (2005-2016)
Note: The one-star or MEPS value for 2007 was proposed and was not mandatory. The 2006 value is taken as a
notional minimum value, which was used by BEE to estimate the benefits of the labeling program (BEE, 2008).
Similarly, the market average for 2006 has been taken as the baseline value used by (McNeil & Iyer, 2008).
Data sources: (BEE, 2008, 2009, 2010, 2012, 2014; McNeil & Iyer, 2008; OEA, 2015, 2016, PWC, 2012, 2015)
The MEPS (one-star label) for room ACs increased by about 35% from 2006 to 2016, i.e., at about
3% per year (Figure 3). Market-average room AC efficiency has typically been slightly higher than
the one-star level and has improved similarly. Even with these efficiency improvements, inflation-
adjusted room AC prices, measured by the wholesale price index (WPI) relative to the basket of
all commodities, fell by nearly 35% during the same time period. Although the MEPS and the five-
star level for inverter ACs will be ISEER 3.1 and ISEER 4.5, respectively, until 2019, the most
efficient room AC already commercially available in India has an efficiency of ISEER 5.8 (with
cooling capacity of 1 ton); moreover, several brands have models with efficiency between ISEER
114.5 and 5 (see Figure 8). Going forward, if the historical trend of approximately 3% efficiency
improvement each year continues, the market average efficiency of ACs in 2026 will be ISEER 4.3,
well below the efficiency of the most efficient room AC sold in India in 2016. However, if India
takes an accelerated efficiency-improvement pathway in which today’s most efficient technology
becomes the market average in 10 years, efficiency would improve by nearly 100% by 2026. In
the next section, we describe how such accelerated improvements in room AC efficiency have
been achieved in Japan and Korea.
3 Air-Conditioner Efficiency in Japan and Korea: Examples of Accelerated
Efficiency Improvement Driven by Policy
Japan and Korea have seen rapid improvements in room AC efficiency. We summarize below
the policies aimed at increasing room AC efficiency in those countries and their impact on
efficiency and prices. From this summary, we draw insights about strategies to increase the
rate of improvement in room AC efficiency in India. Japanese and Korean brands have more
than 60% of the market share in the Indian room AC market (see Figure 4), s o the
experience with AC improvement in these countries is particularly relevant for India.
Total room AC sales (2014) = 3.7 million units
Data source: PWC (2015)
Figure 4: Room AC market shares in India in 2014
3.1 Japan
Figure 5 shows trends in room AC efficiency in Japan, reported as coefficient of performance
(COP) and annual performance factor (APF), as well as room AC prices represented by inflation-
adjusted consumer price index (CPI) for room ACs. The figure also shows relevant details of the
timing and targets of efficiency policies.
12Figure 5: Room AC efficiency trends and price indices in Japan
Sources: (Kimura, 2010) for COPs (EERs) for 1970-2005. Japan’s APF for 2006-2015 is a product- weighted
average estimated based on (ECCJ, 2015) . CPI is taken from (SBJ, 2014). Dotted lines are authors’ estimates.
One of the main policies to promote room AC energy efficiency in Japan is the Top Runner
program launched in 1997. The program mandated that, by 2004, all AC manufacturers had
to have a sales-weighted, fleet-average COP of 5.3 (W/W) for small ACs and 4.9 (W/W) for larger
ACs, which was ~60% more efficient than the market average efficiency in 1997 (representing
an improvement of more than 7.5%/year). This target COP was determined by the COP of the
most efficient AC model available on the market at the time. Industry met this target by
producing more efficient ACs and discontinuing the sale of inefficient ACs. Manufacturers
used several technical measures to improve efficiency, including incorporating variable-
speed compressors, micro-channel heat exchangers, and electronic expansion valves.
Significant efficiency improvements were also achieved by increasing the size of heat
exchangers and increasing refrigerant flow. Between 1995 and 2005, room AC efficiency in
Japan improved by nearly 100% (from a COP of 2.55 to 5.10, a rate of 7.2% per year). Prior to
the Top Runner program, room AC efficiency had not improved substantially over time in
Japan.
In 2006, a new target was established for 2010, which required a further improvement of about
20%. The efficiency metric was changed to APF to enable accurate crediting of the savings
13achieved by variable-speed/inverter ACs and their performance in both cooling and heating
mode. Industry also met the 2010 target.
After 2009, AC efficiency improvement in Japan was partially aided by financial incentives
related to the Japanese government’s Eco-Point System. That system awarded “eco-points” for
the purchase of consumer products that rated four or more stars in the national system of
energy-efficiency standards. Starting in 2011, only five-star appliances were eligible for eco-
points. Consumers earned eco-points by buying four kinds of government-designated high-
efficiency products: ACs, refrigerators, televisions, and LEDs. The points, worth ¥1 each, could
be exchanged for three types of goods: coupons and prepaid cards, high-efficiency products, or
products that promoted regional economies. Overall, the program was successful; the share of
four- and five-star products increased from 20% to 96% for ACs, from 30% to 98% for
refrigerators, and from about 84% to 99% for televisions. The total budget amounted to US$8.7
billion (de la Rue du Can et al., Leventis, Phadke, & Gopal, 2014).
Figure 5 also shows the inflation-adjusted CPI for room ACs in Japan. The inflation-adjusted CPI
can be used as a proxy for room AC prices. It appears that the rate of reduction in prices did
not change significantly even as efficiency improved substantially. Since 1996, efficiency
h a s improved by more than 90%, and inflation- adjusted prices declined by more than
80%. There was no clear trend of increasing electricity prices while efficiency was improving,
so it is not likely that changes in electricity prices were a driver for accelerating efficiency
improvement.
3.2 South Korea
In 1992, the Korean government implemented the Energy- Efficiency Label and Standard
Program to improve the energy efficiency of key products, including appliances and vehicles,
that account for a majority of t h e c o u n t r y ’ s energy consumption (Lee, 2010). Mandatory
MEPS were published in 2002 and took effect in 2004 for window and split AC units up to 23-
kW cooling capacity. In September 2011, the government launched the Energy Frontier
Program, which sets energy- efficiency criteria for key appliances at 30-50% more efficient
than grade 1 (which was the most efficient criterion in 2011). The first phase of the program
included four major appliances: TVs, refrigerators, ACs, and clothes washers (Lee, 2010).
14Box 1: Comparing ISEER and Other Efficiency Metrics
The ISEER metric may not be directly comparable to the Japanese APF or Korean SEER
levels presented in this report, primarily because of the differences in AC efficiency test
points used in each country. For example, the ISEER calculation requires testing only
at full- load and half- load operation at 35◦C and at 29◦C (measured capacity and power
input at full- and half- load operation at 35◦C and ISO 16358- determined default
coefficients for capacity and power input at full- and half load operation at 29◦C).
Korea’s and Japan’s CSPF calculations accept test points at full-, half-, and minimum-
load operations at 35◦C and at 29◦C (Phadke et al., 2016). The Korean and Japanese
metrics might be able to capture the savings from variable- speed drives when a unit
operates at less than half load whereas ISEER could not capture these savings. However,
given climate conditions and usage patterns in India, ACs are unlikely to operate
below half load t h e r e for significant amounts of time, so such savings might not be
significant in the Indian context. In general, the efficiency of an AC unit measured using
ISEER would be lower than that measured using the Korean CSPF or Japanese APF. In
addition, the Japanese APF considers efficiency performance in heating mode. Phadke
et al. ( 2016) find that if the Japanese and Korean ACs were tested under ISEER test
conditions, their Japanese APF and Korean CSPF values would lower by 10% and 13%
on average, respectively, when converted to ISEER. For some of the most efficient
models, ISEER values would be as much as 20% lower than the Japanese APF and Korean
CSPF values.
Samsung and LG together make up more than 80% of the Korean AC market. Industry experts
indicate that both brands want most of their models to qualify under the Grade 1 or the
Frontier criteria to be competitive in the market. Therefore, these efficiency requirements,
despite being voluntary, have likely driven overall efficiency improvement in ACs on the Korean
market.
Figure 6 shows that the Grade-1 efficiency criterion has increased efficiency requirements by
more than 100% since 2008, and most new models by LG and Samsung meet either the
Grade 1 or the Frontier criteria, resulting in significant improvement in average AC efficiency
compared to 2008 levels. The share of inverter/variable-speed ACs increased from less than 10%
to more than 90% within a span of eight years, and efficiency improved by more than 100%
(~12% per year). During this period, inflation-adjusted room AC prices (CPI) continued to
decline.
15Figure 6: Trends in room AC efficiency and price indices in Korea
Sources: EERs for 1996-2008 are product-weighted averages (IEA, 2010). Mixed efficiencies with EER and
CSPF for 2009-2010 and CSPF for 2013-2015 are product-weighted averages estimated using Korean Energy
Agency’s (KEA’s) database (KEA, 2015). CPIs are from (KOSIS, 2014). Variable speed drive (inverter) ACs are
estimated to account for more than 85% of the AC sales in the market in 2013 and more than 90% of AC
sales in 2015 (KEA, 2015). The dotted lines are authors’ estimates.
As in Japan, the accelerated improvement in AC efficiency in South Korea was aided by a
downstream financial incentive program. This program, called “Carbon Cashbag,” was
launched in October 2008 and operated by the Ministry of Knowledge Economy and Korean
Energy Management Corporation.5 Consumers who purchase low-carbon products get carbon
credits from manufacturers, retailers, or banks that participate in the Carbon Cashbag
program. Points are then stored on a Carbon Cashbag card and can be used for discounts on
public transportation, basic utilities charges, purchases of other efficient appliances, or tickets
to cultural events. Carbon Cashbag is a voluntary program. Companies (mostly appliance
manufacturers) that register in the program benefit from reductions in advertising fees and
other public incentives (de la Rue du Can et al., 2014). Another type of financial incentive
5
The Ministry of Knowledge Economy and the Korea Energy Management Corporation have now been renamed as
the Ministry of Trade, Industry and Energy, and the Korea Energy Agency, respectively.
16program in South Korea was “feebate,”6 in which revenues from a 5- to 6.5% tax on energy-
consuming home appliances subsidized low-income households’ purchases of highly efficient
products (de la Rue du Can et al., 2014).
The key insights from experiences in Japan and Korea are that aggressive MEPS revisions have
played a critical role in accelerating room-AC efficiency improvement, and innovative incentive
programs played an important but complementary role in the overall market transformation.
In the next section, we assess the technical feasibility, impact, and costs and benefits of
accelerated AC efficiency improvement in India.
4 Technical Feasibility, Impact, and Costs-Benefits of Accelerated Air-
Conditioner Efficiency Improvement in India
We assess the technical feasibility, peak demand, and electricity consumption impacts as well
as the costs and benefits of accelerated room-AC efficiency improvement in India compared
to a BAU scenario. In the BAU scenario, we take the BEE star levels up to 2019 and assume
that the one-star level is ratcheted up at the historical rate of 3% per annum, reaching an ISEER
of 4.2 by 2030. In the accelerated efficiency-improvement scenario, we assume that the room
AC MEPS is revised to ISEER 3.5 in 2018 (compared to 3.1 specified by BEE) and is ratcheted up
thereafter at 6% per annum, which is double the historical rate. Over the next six years, the
five-star AC efficiency level in 2016 (ISEER 4.5) becomes the MEPS (one-star level) by 2022.
Over the next 10 years, i.e., by 2026, the room AC MEPS would nearly double the current level
(from ISEER 2.9 to 5.7); by 2030 the room AC MEPS would reach an ISEER of 7.1, an
improvement in the MEPS of about 140% in 15 years. Figure 7 shows the room AC MEPS (one-
star levels) up to 2030 for the two scenarios, BAU and accelerated efficiency improvement.
6
A feebate is a tax or “fee” on less-efficient equipment that is used to fund a rebate on more efficient equipment. If
designed and monitored carefully, this financing mechanism can be a revenue-neutral policy and can be independent
of government general budgets. However, careful, continuous monitoring is required to make sure the balance is
maintained (de la Rue du Can et al., 2014).
17Figure 7: Alternative trajectories for room AC minimum standard (one-star level) improvement
As discussed in the previous section, Japan and Korea have achieved similarly aggressive
efficiency improvements. In Japan, during a 10-year period between 1995 and 2005, room
AC efficiency improved by nearly 100%. In Korea, between 2007 and 2015, room AC
efficiency improved by more than 80%.
4.1 Technical Feasibility of the Accelerated Efficiency-Improvement Scenario
The accelerated efficiency-improvement scenario implies that the most efficient room AC sold
currently on the Indian market (ISEER of 5.8)7 will become the market average efficiency level
in 2024 whereas one of the most efficient room ACs on the global market today (Korean cooling-
season performance factor [CSPF] of 9.4, which is about 15-20% lower when converted to ISEER)8
will be the market average efficiency in 2030. Figure 8 shows ISEER levels of most inverter AC
models registered with BEE as of April 2017, arranged by cooling capacity. The figure also
shows the BEE-specified one-star and five-star levels for inverter ACs up to 2019.
7
Model # Daikin JTKM35SRV16 with cooling capacity of 1 ton
8
Model # Samsung AF18J9975WWK with 2-ton cooling capacity
186 Hitachi RAU512CWEA
Daikin JTKM35SRV16
ISEER 5.8 ISEER 5.75
Daikin JTKM50SRV16 Hitachi RSA518CAE
ISEER 5.2 ISEER 5.15
5
5-Star Label
ISEER (Wh/Wh)
4
1-Star Label
3
2
0 0.5 1 1.5 2
Room AC Cooling Capacity (Tons)
Daikin Godrej Hitachi Blue Star LG
Whirlpool Voltas Samsung Videocon
Figure 8: Spread of inverter room- AC products offered by manufacturers, by cooling capacity (as of April 2017)
Note: Each point refers to a room AC model on the market. The most efficient model, offered by Daikin (model
#JTKM35SRV16), has an ISEER of 5.8 for a cooling capacity of 1 ton. The most efficient ~1.5-ton-capacity model is
Daikin JTKM50SRV16 with ISEER of 5.2.
Data source: (BEE, 2017)
As shown in Figure 8, most brands in India already have room AC models with ISEER >4.5, which
is the one-star level suggested by 2022 in the accelerated efficiency-improvement scenario.
That is, manufacturers appear to already have the technology to meet the mandatory one-star
requirement in the accelerated efficiency-improvement scenario. Note that the ISEER of 5.8
(as well as Korean CSPF of 9.49) has been achieved for capacities smaller than 1.5 tons, which
is the most commonly used room AC size in India. Anecdotal interviews with industry experts
indicate that there should not be any technical constraints in achieving similar ISEER in 1.5-ton
models as well. Improving efficiency beyond the Korean CSPF of 9.4 for 1.5-ton models will
require additional research and development. Some future directions to improve efficiency
include employing separate sensible and latent cooling (dehumidification); evaporative pre-
cooling; desiccant-based dehumidification; M-cycle-based evaporative cooling; absorption and
adsorption cooling; solar cooling; and thermoelectric, magnetocaloric, and elastocaloric
cooling. Also, the Kigali Amendment adopted in October 2016 regarding the phasedown of the
9
The Korean CSPF of 9.4 is equivalent to approximately ISEER 7.9 based on the differences in test conditions in the
two countries (Phadke et al, 2016). If the Japanese and Korean ACs were tested under ISEER test conditions, their
Japanese APF and Korean CSPF values would decrease by 10% and 13% on average, respectively, when converted to
ISEER; for some of the most efficient models, ISEER values would be as much as 20% lower than Japanese APF and
Korean CSPF values.
19hydrofluorocarbons (synthetic gases used as refrigerants in room ACs) will affect AC efficiency.
Our previous reports have shown the efficiency benefits of switching to alternative refrigerants
(Shah, Wei, Letschert, & Phadke, 2015b).
4.2 Impact of Accelerated improvement in Air-Conditioner Efficiency
In this section, we show the impacts of accelerated AC efficiency improvement on total energy
consumption and national peak load. We also show the net consumer benefit of this efficiency
improvement trajectory.10
4.2.1 Reduction in Electricity Consumption and Peak Load
Figure 9 shows the total energy consumption attributable to room ACs at bus-bar11 for both
scenarios. By 2030, under the accelerated efficiency- improvement scenario, room AC
consumption could be reduced by nearly 64 TWh/yr at bus-bar without compromising any
cooling service provided by room ACs. This is equivalent to the total energy generation from
nearly 40 GW of solar photovoltaic (PV) capacity and is in line with BEE’s estimates (Diddi, 2014).
250
Room AC Energy Consumption at bus-bar
BAU
197
200 Accelerated Efficiency Improvement
(TWh/yr)
150
134
100
50
0
2014 2016 2018 2020 2022 2024 2026 2028 2030
Figure 9: Energy consumption for alternative trajectories for room AC efficiency improvement
Note: These energy consumption projections are preliminary estimates that we believe are conservative.
As mentioned previously, room ACs are already a major contributor to peak load in major
10
Assuming transmission and distribution loss of 15%. See Appendix for a d d i t i o n a l d e t a i l s o n data,
methodology, and assumptions used to estimate the impact of the accelerated efficiency improvement scenario.
11
Consumption at bus-bar implies consumption at the high-voltage transmission substation level. This includes the
(technical) transmission and distribution losses of the grid and is directly comparable to electricity generation
capacity. See Appendix for more details.
20urban areas. In the BAU trajectory, we project that, by 2030, the peak load from room ACs
would be about 134 GW at bus-bar, which is equivalent to nearly 30% of the projected total
peak load in 2030. Peak load is estimated using a peak coincidence factor of 0.7; i.e., at most,
about 70% of the room AC stock operates coincident with each other. Please refer to the
Appendix for more details on this projection. Room AC efficiency improvement would result in
significant peak-load savings, as shown in Figure 10.
160
140 BAU 134
Peak Demand due to ACs at bus-bar (GW)
120 Accelerated Efficiency Improvement
100
95
80
60
40
20
0
2014 2016 2018 2020 2022 2024 2026 2028 2030
Figure 10: Peak load for alternative trajectories for room AC efficiency improvement
By 2030, under the accelerated efficiency-improvement scenario, peak demand could be
reduced by nearly 40 GW. This is equivalent to avoiding the construction of 80 large coal-
fired power plants of 500 MW each.
4.2.2 Net Consumer Benefit
We estimate the net consumer benefit for a given level of cooling service is the net present value
(NPV) of the electricity bill savings from increased efficiency minus the incremental price
paid for the efficiency gain. To determine the incremental price paid by consumers, we first
have to estimate what the price would have been in the absence of the efficiency improvement
(counterfactual price). Examples in Japan and Korea discussed above and examples in several
other countries for other appliances and equipment indicate that efficiency policies and
efficiency improvements do not increase inflation- adjusted prices over time and may in
fact reduce prices compared to the counterfactual prices (Taylor, Spurlock, & Yang, 2015; Van
Buskirk, Kantner, Gerke, & Chu, 2014). However, at any given point in time, prices of efficient
ACs appear to be higher than prices for conventional ACs, and engineering estimates also
indicate that at any given point in time, it costs more to produce efficient ACs. This creates the
possibility that AC prices could increase with efficiency in the absence of technological change,
21economies of scale, or supply-side responses. To represent both of these possibilities, we
consider two scenarios:
(i) In the first scenario, we assume that accelerating efficiency improvements will have no
impact on prices, which is in line with historical experience.
(ii) The second scenario is a highly conservative consumer-benefit scenario, in which we
assume that the prices will increase as a result of efficiency improvements. We estimate
the incremental prices based on engineering estimates of efficiency improvement and
corresponding cost data provided by Indian manufacturers (see (Shah et al., 2016) and
the Appendix for details). This approach is used in the US and EU regulatory process to
set the minimum energy performance standards. Studies have shown that, this
approach will likely underestimate consumer benefits. This is because ex-post empirical
assessments show that prices continue to decline at the historical rates even after the
policy intervention and increase in efficiency (Van Buskirk et al., 2014).12 Also, prices
have systematically been below those projected by MEPS program analyses historically
(Spurlock, 2014).
We find that even in the conservative benefits case accelerated efficiency improvement of
room ACs is cost-effective from the consumer perspective; i.e., the electricity bill savings are
much higher than the incremental price of the efficient AC. Figure 11 shows an example of
estimating the net consumer benefit for an individual consumer in 2018. In the BAU trajectory,
the one-star level in 2018 is expected to be ISEER 3.1 (specified by BEE); the market average ISEER
is expected to be about 3.5. In the accelerated efficiency-improvement scenario, the one-
star level is assumed to be ratcheted up to ISEER 3.5 in 2018; the market average efficiency
would be ISEER 3.9. Figure 11 shows the estimated retail prices of the AC with ISEER 3.9
and AC with ISEER 3.5 (BAU); it also shows the NPV of electricity bill over the life of the AC
assuming a discount rate of 8%, AC life of seven years, electricity tariff of Rs 6/kilowatt hour
(kWh) increasing at 6% per year, and AC usage of 1,200 hours per year.
12
Note that the reduction in prices appears to result in part from reduction in manufacturer markups.
22NPV of Lifecycle cost =
120,000 Rs 118,823
NPV of Lifecycle cost =
Rs 110,977
100,000
Estimated Retail Price and Consumer Benefits (Rs)
NPV of Electricity Bill over NPV of Net Consumer
life Benefit = Rs 7,846 NPV of Electricity Bill over
80,000
Rs 79,535 life
@ Tariff = Rs 6/kWh Payback period < 1 year Rs 70,789
@ Tariff = Rs 6/kWh
60,000
40,000
Estimated Retail Price Estimated Retail Price
(Rs 39,288) (Rs 40,188)
20,000
-
BAU Scenario Accelerated Efficiency Scenario
Market Average AC (ISEER = 3.5) Market Average AC (ISEER = 3.9)
Figure 11: Estimating the net consumer benefit for an individual consumer in 2018
We find that consumers benefit from accelerated AC efficiency even with aggressive ratcheting of
MEPS in 2018 and under the most conservative assumptions about price changes. The incremental
price of an efficient AC (ISEER 3.9) is estimated at Rs 900 (maximum value) over the conventional
AC (ISEER 3.5), and the electricity bill savings would be about Rs 1,400 per year; in other words,
consumers can recover the incremental price in less than one year. NPV of the consumer benefit
is in the range of Rs 4,000-6,000 per consumer. Note that this consumer benefit estimation is
extremely conservative and should be considered a minimum bound. This is because: (a) the
estimated electricity bill savings are based on conservative assumptions about AC usage hours
and electricity prices, and (b) we have estimated the incremental retail price of the efficient AC
based on the current technology costs, assuming no subsequent technology innovation,
economies of scale, or supply-side response.
The net consumer benefit estimate is sensitive to the electricity tariff assumption. If the
marginal electricity tariffs are Rs 8/kWh (increasing at 6%), the net consumer benefits would
increase; in the case presented in Figure 11, the NPV of net consumer benefit would increase to
Rs 10,761, and the payback period would shorten even more.
Figure 12 shows the NPV of the net consumer benefit in the accelerated efficiency-
improvement scenario when the benefits are added over all consumers and discounted up to
2030.
23173
NPV of Net Consumer Benefit in the Accelerated Efficiency
150
Scenario (Rs Thousand Cr)
100
50
4
0
AC Prices increase Efficiency Increase Does Not Impact AC Prices
(Based on 2016 technology cost estimates) (Per historical experience)
Figure 12: NPV of net consumer benefit from accelerated efficiency improvement
Key Assumptions: Hours of room AC use: 1,200 hours/yr; Electricity price: Rs 6/kWh in 2016 increasing at 6% per
year; Discount rate: 8% for estimating NPV; life of AC: 7 years. Note that the net benefits estimates are
merely indicative because the electricity prices and hours of use may change in the future.
The NPV of the net consumer benefit between 2018 (the first year of the proposed
aggressive ratcheting of efficiency levels) and 2030 would range between Rs 4,000 crore (Cr)
or US$ 600 million at the minimum (if AC prices increase with efficiency) to Rs
173,000 Cr or US$ 25 billion in a more realistic case (if efficiency increase does not impact
AC prices, per historical experience). In addition, AC efficiency improvement will have a
significant peak-load-reduction benefits for the utility. Please refer to (Abhyankar et al., 2013;
Newsham, Birt, & Rowlands, 2011) for additional information on the peak-load benefits.
Manufacturers incur costs to produce and sell efficient ACs. We have attempted to capture most
of these costs in the incremental manufacturing cost and retail price assessments (please see
Appendix for more details). However, certain long-term and indirect costs (such as changes in
the supply chain, transaction costs, and financing costs) cannot be captured in standard
manufacturing cost assessments. Moreover, accelerated efficiency improvement may improve
manufacturers’ overall global competitiveness, potentially leading to increasing shares of the
global market. A more comprehensive assessment could estimate the full impact on
manufacturers, which is outside the scope of our study. However, we believe that the results of
that estimate would be unlikely to change the key findings in this report.
4.3 Rebound Effect
One of the common concerns when assessing the validity of cost -benefit estimates
24from any appliance efficiency improvement is the rebound effect. The direct rebound effect
(increase in energy use as a result of effective increase in consumers’ disposable income
because of increased energy efficiency) is found to be 8-12% for most appliance efficiency
improvements in developed countries in the short and medium term (Borenstein, 2013;
Gillingham, Rapson, & Wagner, 2016). In emerging economies, greater direct rebound effects
on electricity consumption are observed than in developed countries; these effects tend to
vary over a wide range between 12 and 46% (Gillingham et al., 2016). However, the
consumption patterns in emerging economics change rapidly; therefore, estimating short-
term demand elasticities and accurately estimating the rebound effect are very hard. Also,
the rebound effect implies an increase in the consumption of cooling services and thus an
overall increase in consumer welfare. The indirect rebound effect (increase in the
consumption of other commodities resulting from the reduction in energy expenditures) is
hard to predict and typically small (Borenstein, 2013; Gillingham et al., 2016). The rebound
effect will likely have no impact on peak-load savings because even if room ACs are used for
more hours, their peak coincidence will likely remain unchanged.
In Figure 13, we show the impact on the net consumer financial benefits from a range of direct
rebound effect values for the developing countries mentioned earlier (10% to 50%). The
benefits are shown for the two scenarios of future room AC prices.
200
Net Consumer Benefit (NCB) - No Rebound
173
NCB with Direct Rebound Effect of 10%
156
150
NPV of Net Consumer Benefit Rs Thousand Crore
NCB with Direct Rebound Effect of 20% 139
NCB with Direct Rebound Effect of 30% 121
100 NCB with Direct Rebound Effect of 50%
87
50
4
0
-14
-31
-50 -48
-83
-100
AC Prices increase Efficiency Increase Does not Impact AC Prices
(Based on 2016 technology cost estimates) (Per historical experience)
Figure 13: Impact of rebound effect on net consumer benefit
With the rebound effect, room AC operating hours might increase, reducing total electricity
bill saving and significantly reducing the net consumer financial benefits. If room AC prices
25increase (based on the 2014 engineering cost estimates), the net consumer benefit might, in
fact, be negative for higher rebound effect values. If room AC efficiency improvement does not
impact AC prices, net consumer benefit would be as high as Rs 87,000 Cr even with a high
direct rebound of 50%.
If the net consumer benefit is very high (especially if the efficiency improvement does not
affect AC prices), AC penetration might increase; i.e., consumers who would not have
purchased an AC in the BAU scenario might now purchase one. This would reduce the overall
energy and peak-load savings. However, it would also substantially increase consumer welfare
because of increased cooling service. For more information on the welfare benefits of cooling
and improved indoor environments, please refer to (Fisk, 2000a, 2000b).
4.4 Sensitivity Analysis
The total energy savings, peak-load reduction, and net consumer benefit estimates are based
on a number of assumptions about room AC sales growth, hours of use, and peak coincidence
factor. To test the sensitivity of our results to these parameters, we re-estimate the benefits in
a range of +/- 25% of the original values of these factors. Table 3 summarizes the results.
Table 3: Sensitivity on key parameters of energy savings, peak-load reduction, and net consumer benefit in the accelerated AC
efficiency-improvement scenario
Sensitivity to
Base Sensitivity to Sensitivity to AC
Peak Coincidence
Case Hours of Use Sales Growth
Factor
Room AC sales growth % per year 12.5% 12.5% 12.5% 9.4% 15.6%
Hours of use/year 1,200 1,200 900 1,500 1,200
Peak coincidence factor 0.7 0.525 0.875 0.7 0.7
Total energy saving at bus-bar in
64 64 64 48 80 48 80
2030 (TWh/yr)
Total peak-load reduction at bus-bar
39 29 49 39 39 29 49
in 2030 (GW)
NPV of net consumer benefit (if AC
4 4 4 -39 47 3 5
prices increase) – Rs thousand Cr
NPV of net consumer benefit (if
efficiency improvement has no 173 173 173 130 217 130 217
impact on AC prices) Rs thousand Cr
A low peak coincidence factor would imply that fewer ACs are used coincidentally, but it would
not change the energy consumption. Conversely, if the hours of use per year are greater than
1,200, this might not affect the overall peak load attributable to ACs. However, it would
26increase the total electricity bill savings for consumer, so the net consumer benefit would
increase substantially. If the AC sales growth is less than 12.5% per year, the energy savings,
peak-load reduction, and net consumer benefit numbers would all decrease (in the same
proportion) because the total number of ACs (stock) would be smaller.
5 Discussion and Conclusion: Policies and Programs to Accelerate Room AC
Efficiency Improvement
In this report, we assess the technical feasibility, costs-benefits to consumers, and required policy
enhancements for accelerating room AC efficiency improvement in India. The efficiency of room
ACs in India increased by about 35% between 2006 and 2016 (3% per year) as a results of S&L
even as inflation-adjusted room AC prices continued to decline. Room AC penetration is expected
to grow rapidly in India so that, by 2030, room ACs would likely contribute nearly 140 GW (about
30%) to total peak load, assuming that efficiency continues to improve at 3% per year. Examples
from Japan and Korea show that energy-efficiency policies play a significant role in accelerating
AC efficiency with no apparent long-term impact on prices. These examples also show that
efficiency can be improved at a rate that is significantly greater than has been achieved
historically in India. In India, the most efficient room AC is almost twice as efficient as the average
AC sold on the market, so there are no technology constraints that would prevent India from
accelerating AC efficiency improvements at a rate comparable to that achieved in Japan and
Korea. Further, our analysis shows that accelerated AC efficiency improvement will have
enormous benefits for India. For example, if the market average efficiency is improved at 6% per
year instead of the historical rate of 3% per year, by 2030, 30-50 additional GW of peak load
(equivalent to 60-100 power plants of 500 MW each) could be avoided, and more than 64 TWh/yr
in electricity use (equivalent to the current electricity consumption of the entire state of Gujarat)
could be saved. The net consumer savings will range from Rs 4,000 Cr ($600 million) to Rs 173,000
Cr ($25 billion). In addition, accelerated efficiency improvement will likely strengthen the
capacity of Indian manufacturers to compete in the global market. In the subsections below, we
discuss key policy and program options for accelerating the room AC efficiency improvement in
India.
5.1 Accelerated Ratcheting Up of Bureau of Energy Efficiency Star Rating Levels
Experience in India and several other countries has shown that efficiency is strongly driven by
MEPS (e.g., the one-star rating level) and related energy-efficiency labeling levels. For example,
in India, two- and three-star-labeled ACs dominate the market; the weighted average market
efficiency approximately equals the two or three-star level even with increasing stringency of
the star labels. Hence, accelerating the ratcheting up of star levels is one strategy to accelerate
efficiency. Note that this does not mean that the revisions would need to be made more
27frequently but only that the stringency of the star-labels would be increased compared to the
historical trajectory.
5.2 Providing Policy Direction with Medium- and Long-Term Targets for Star
Levels
Similar to Japan’s Top Runner program, a long-term target can provide a broad policy direction
that informs the setting and revision of interim targets; i.e., today’s best available technology in
India can be the target for the market average efficiency level (two- to three-star level) by
2022. Given the historical relationship between market average and MEPS levels, this can be
achieved by setting today’s five-star level (4.5 ISEER) as the MEPS ( one-star level) in 2022.
Note that several brands (Bluestar, Godrej, Hitachi, Voltas) already sell models with efficiency
of ISEER 4.5 and higher. A two-star level of ISEER 5 in 2022 will achieve an efficiency
improvement at the rate that Japan and Korea achieved historically. An additional long-term
target could be to make today’s globally available best commercial technology the market
average by 2030; i.e., the market average could be ISEER 7.913 and MEPS (one-star level) would
be ISEER 7.1 by 2030. Once such long-term targets are specified, BEE can ratchet up MEPS in
the interim years. The standard practice so far has been that efficiency for all star levels
increases by one star equivalent every two years; this has resulted in an efficiency
improvement of ~3% per year. One of the options for an accelerated ratcheting up is
widening the spread of the star labels, which incentivizes more efficient products to be sold on
the market; then, the star levels could be ratcheted up every two years by two stars
instead of one.14 For example, within three revisions (up to 2022), the current five-star label
could become the MEPS (one-star label).
Figure 14 shows a potential schedule of ratchets to achieve the accelerated efficiency-
improvement trajectory with two long-term goals in mind: (a) today’s five-star level becomes
the one-star label in 2022 (ISEER 4.5), and (b) today’s globally available best commercial
technology becomes the market average in 2030 (market average of ISEER 7.9 and one-star
label of ISEER 7.1).
13
This is equivalent to the globally best available technology of Korean CSPF 9.4, converted to the ISEER metric.
14
With product unification from 2018 onward, widening the spread of the star labels has already started, e.g. one-
star label of ISEER 3.1 and five-star label of ISEER 4.5.
28You can also read