Analysis of State Budgets 2017-18: Emerging Issues - NIPFP
←
→
Page content transcription
If your browser does not render page correctly, please read the page content below
policy brief
    Analysis of                                                                                               on

    State Budgets                                                                          state finances
                                                                                                 2017
    2017-18:
    Emerging Issues                                                                       Pinaki Chakraborty
                                                                                          Manish Gupta
                                                                                          Lekha Chakraborty
                                                                                          Amandeep Kaur

    Introduction                                               budgets for 28 States.1 The objective is to understand
                                                               emerging issues in State finances based on State Bud-
    While the Union Government finances show a degree gets 2017-18 in a comparative perspective, State-lev-
    of consolidation in the last couple of years, the financ- el fiscal policy stance and key sectoral spending. The
    es of State Governments show signs of increasing fiscal other major objective of this exercise is also to have a
    imbalance reflected in the levels of both revenue and fair understanding of the aggregate fiscal position of
    fiscal deficits in large number of States. If we consid- both Union and States for the current fiscal year.
    er all-State trends in State finances, it appears that all
    States’ fiscal deficit after a sharp reduction has started Finances of the Union and State Governments
    increasing in recent years. The RBI Study on State Fi-
    nances for the year 2016-17 also observed that States Table 1 provides a comparative picture of the finances
    started borrowing more in recent years compared to of the Union and State Governments for the period
    the period from 2005-06 to 2011-12 reflecting rising 2011-12 to 2017-18BE. From the examination of key
    trend in fiscal imbalance at the all States level. Grow- fiscal indicators, it is evident that between 2011-12
    ing fiscal imbalance has the potential to derail fiscal and 2017-18BE, there has been an improvement in
    consolidation at the general government level.             the finances of the Union Government with major fis-
                                                               cal parameters like revenue deficit, fiscal deficit, pri-
    Medium term fiscal challenges at the State level are mary deficit and outstanding liabilities expressed as
    many. The most important being the taking over of percentage of GDP. The revenue deficit of the union
    DISCOM liabilities under the UDAY scheme by the government as percent of GDP declined from 4.51
    State governments resulting in an increase in deficit per cent in 2011-12 to 2.51 per cent in 2015-16 and
    at the State level. Implications of UDAY in-terms of is budget to improve further to 1.91 per cent in 2017-
    higher debt liability and interest outgo requires clear 18BE, while fiscal deficit declined from 5.91 per cent
    understanding, particularly when the impact is asym- to 3.24 per cent during the same period. The primary
    metric across States. It is also argued that potential deficit also showed considerable improvement declin-
    fiscal risk due to farm loan waivers can really put ing from 2.78 per cent in 2011-12 to 0.14 per cent in
    pressure on the level of deficit. Though, the roll out 2017-18BE and outstanding liabilities as percentage of
    of Goods and Services Tax (GST) from 1 July, 2017 is GDP declined from 51.71 per cent in 2011-12 to 47.27
    historic, benefits of GST would only start flowing in per cent in 2017-18BE.
    when the new tax system stabilizes. The medium term
    fiscal challenge would be to maintain fiscal balance, The combined finances of the State governments,
    improve quality of fiscal deficit by reducing revenue however, showed deterioration during this period (ta-
    deficit and make resources available for key priority ble 1). We find a deterioration of the fiscal position
    areas of spending under social and economic services. of States since 2013-14. Surpluses in revenue account
    Keeping these objectives in mind, this analysis on State turned into deficit and we observe re-emergence of
    finances has been prepared based on the 2017-18 State revenue deficit in 2013-14. The number of States hav
    1
        This excludes data relating to 2017-18 budget of Manipur.

1
    National Institute of Public Finance and Policy, New Delhi.     IDRC project on ‘Intergovernmental Fiscal Transfers in India’.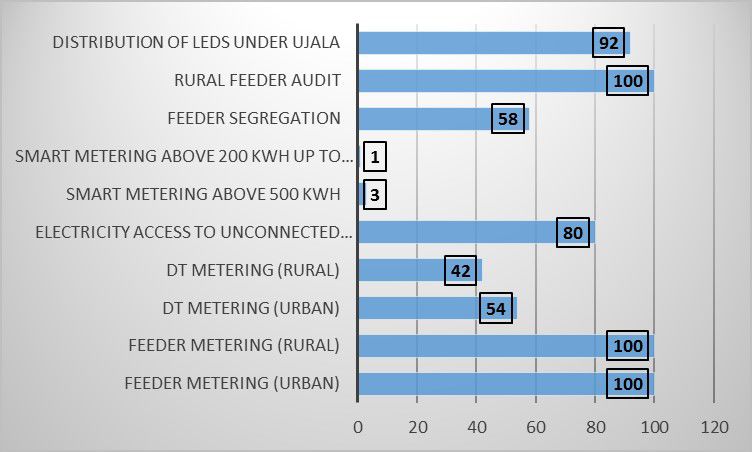
Table 1: Finances of the Union and States
    												 (% of GDP)
                             2011-12 2012-13 2013-14 2014-15 2015-16 2016-17 2017-18
                                                                              RE    BE
     Revenue Deficit
     Union Government           -4.51      -3.66      -3.18    -2.94    -2.51 -2.05  -1.91
     State Governments           0.27       0.20      -0.09    -0.37    -0.04 -0.23   0.03
     Fiscal Deficit
     Union Government           -5.91      -4.93      -4.48    -4.10    -3.89 -3.52  -3.24
     State Governments          -1.93      -1.97      -2.21    -2.63    -3.03 -3.67  -2.69
     Primary Deficit
     Union Government           -2.78      -1.78      -1.14    -0.87    -0.67 -0.34  -0.14
     State Governments          -0.36      -0.45      -0.70    -1.01    -1.48 -1.99  -0.97
     Outstanding Liabilities
     Union Government           51.71      50.99      50.47    50.16    50.45 49.01 47.27
     State Governments          22.34      21.80      21.40    21.49    22.83 23.91 24.10
    Note: Surplus (+) / Deficit (-); GDP is at current prices (2011-12 series); Fiscal Deficit of States in 2015-16 and 2016-17BE includes
    DISCOM debt taken over by the States under UDAY; For 2016-17RE and 2017-18BE the data is for 28 States. As the 2017-18 budget
    of Manipur was not available, it could not be included in the analysis.
    Source: 1) Union Government: Budget Documents (various years); 2) State Government: Finance Accounts (various years) and
    Budget Documents 2017-18; 3) Economic Survey 2016-17, Vol. 2.

                                      Table 2: States with Revenue Deficit/Surplus
                          Revenue       Revenue          Revenue       Revenue       Revenue
                         Deficit in     Deficit in      Deficit in    Deficit in    Deficit in
                          2013-14        2014-15         2015-16     2016-17 RE 2017-18 BE
                         Chh, Goa, AP, Ass, Chh, AP, Har, J&K, AP, Ass, Har, AP, Har, HP,
                        Har, HP, Ker, Har, HP, J&K,     Ker, Mah, HP, Ker, Mah, Ker, Mah,
                         Mah, Miz,      Jha, Ker,      Pun, Raj, TN,  Nag, Pun,    Pun, Raj, TN
                        Pun Raj, TN,    Mah, Miz,        Utt, WB     Raj, TN, Utt,
                            WB        Pun, Raj, TN,                       WB
                                         Utt, WB
                          11 States     15 States        10 States     12 States     8 States
    		 Note: Data for Manipur for the year 2016-17RE and 2017-18BE not available
    		Source: Finance Accounts of State (various years) and Budget Documents 2017-18.

    ing revenue deficit increased from 6 in 2011-12 to 11               Fiscal deficit aggregated across States also deteriorat-
    in 2013-14 and further to 15 in the following year. In              ed during this period. Fiscal deficit as percentage of
    2015-16, 10 states had deficit in their revenue account.            GDP declined from 1.93 per cent in 2011-12 to 3.03
    Although the combined revenue account of all States                 per cent in 2015-16 and is budgeted to further decline
    show a small surplus to the tune of 0.03 per cent of                to 3.67 per cent in 2016-17RE (fig 2). The FD-GDP
    GSDP in 2017-18BE (see fig 1), 8 States have budgeted               ratio in 2015-16 exceeded the 3 per cent FRBM ceil
    for revenue deficit as can be seen from table 2.

    National Institute of Public Finance and Policy, New Delhi.         IDRC project on ‘Intergovernmental Fiscal Transfers in India’.

2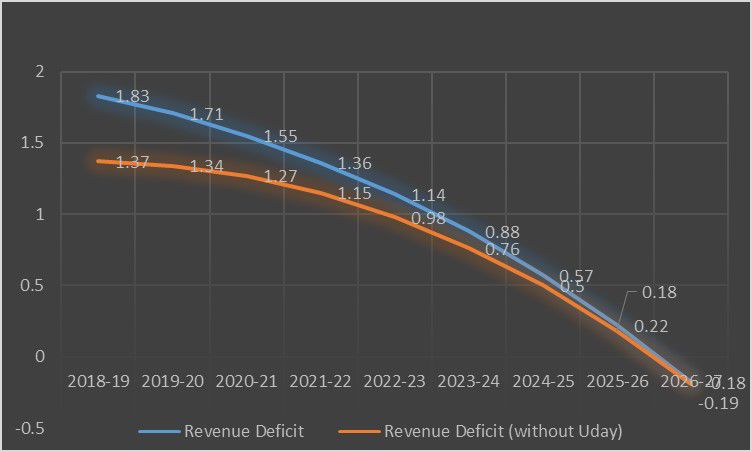
Note: Surplus (+) / Deficit (-)
Source: Finance Accounts of State (various years) and Budget Documents 2017-18; Economic Survey 2016-17, Ministry of Finance,
Government of India.

ing of fiscal prudence for the first time since 2004-05.       The primary deficits of all States taken together also
High fiscal deficit in 2015-16 and 2016-17RE is on ac-         show deterioration with primary deficit as percentage
count of State governments taking over 75 per cent of          of GDP increasing from 0.36 per cent in 2011-12 to
the DISCOM debt under UDAY. If we exclude the                  1.99 per cent in 2016-17RE as evident from table 1. In
UDAY liabilities the FD-GDP ratio would be around              2017-18BE, the primary deficit is budgeted to decline
2.31 per cent in 2015-16 and 3.32 per cent in 2016-            by more than 1 percentage points to 0.97 percent.
17RE. Number of States having fiscal deficit greater
that 3 percent, increased from 9 in 2011-12 to 14 in           Outstanding liabilities aggregated across all States
2014-15 and further to 19 in 2016-17RE as can be               as per cent of GDP from 22.34 per cent in 2011-12
seen from table 3. In 2017-18, fiscal deficit of all States    to 21.40 per cent in 2013-14, thereafter it increased
as percentage of GDP is budgeted to be around 2.69             to 22.83 per cent in 2015-16 and is budgeted to be
per cent (table 1) and 11 States have budgeted for FD-         around 24.10 per cent in 2017-18 (table 1). RBI’s re-
GDP ratio greater than 3 percent.                              cent report on State finances attribute UDAY to result
                                                               in an increase in outstanding liabilities as percentage

                                        Table 3: States with Fiscal Deficit/Surplus
                        2011-12        2012-13 2013-14        2014-15       2015-16    2016-17 RE 2017-18 BE
  FD > 3%                   9              7          7           14           12           19         11
                        ArP, J&K,         HP,       ArP,      AP, Chh,      AP, Goa, AP, Ass, Bih, Chh, Goa,
                        Ker, Man,        J&K, Goa, HP, HP, J&K, Har, J&K, Goa, Har, HP,              HP, J&K,
                        Meg, Miz,         Ker,      J&K,      Jha, Ker,     Jha, Ker, J&K, Ker, MP,  Ker, MP,
                        Nag, Pun,        Miz,     Ker, Miz, Man, Meg, Raj, Sik,         Meg, Miz,    Meg, Odi,
                          WB             Nag,        WB       Miz, Raj,     Tel, Tri, Nag, Odi, Pun, Pun, Tel,
                                         Pun,                Tri, UP, Utt, UP, Utt     Raj, TN, Tel,   Tri
                                          WB                      WB                     Tri, UP
  FD < = 3%                17             19         19           14           14            9         17
  Fiscal Surplus            2              2          2            1            3            0           0
                         Odi, Tri      Odi, Tri Man, Tri          ArP       ArP, Ass,
                                                                              Miz
  Total                      28           28           28         29             29               28                 28
  Note: Data for Manipur for the year 2016-17RE and 2017-18BE not available.
  Source: Finance Accounts of State (various years) and Budget Documents 2017-18.

                                                                                                                                3
National Institute of Public Finance and Policy, New Delhi.    IDRC project on ‘Intergovernmental Fiscal Transfers in India’.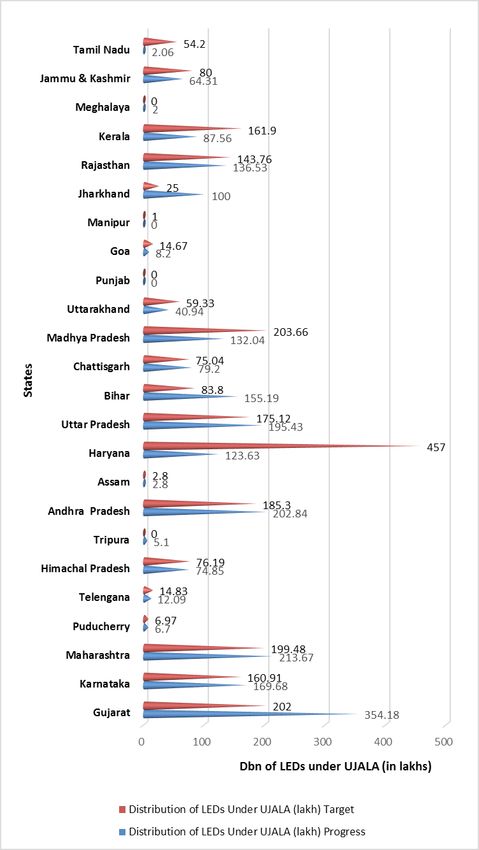
of GDP by about 1.5 per cent in 2016 over 2015 and by                2015-16 (Fig 4). This is not surprising given the re-
    0.7 per cent in 2017 over 2016. The report further cau-              structuring of grants to accommodate enhanced tax
    tions about the increase in future liabilities of States if          devolution. However, total grants to States are budget-
    farm loan waivers become the norm. State-wise anal-                  ed to increase in 2016-17RE.
    ysis show that between 2014-15 and 2015-16 and be-
    tween 2015-16 and 2016-17RE, outstanding liabilities                 However, if we compare transfer to GSDP ratio be-
    as percentage of GSDP increased in 18 and 17 States                  tween 2011-12 and 2017-18BE, it declined sharp-
    respectively.                                                        ly from 6.76 per cent in 2011-12 to 5.74 per cent in
                                                                         2014-15 (Fig 5). Post FFC award there is a significant

    Source: Finance Accounts (various years) and Budget Documents 2017-18 of State Governments.

    Trends in Central Transfers to States                                increase in transfer to GSDP ratio to 6.36 per cent
                                                                         in 2015-16. Total transfers are budgeted to increase
    While tax devolution as percentage of GSDP2 ag-                      further to 7.00 per cent in 2016-17RE and 7.03 per
    gregated across all States increased for all States in               cent in 2017-18BE. Not only has the total transfers to
    2015-16, the first year of the award of the Fourteenth               States increased, its composition has also undergone
    Finance Commission (FFC) as compared to 2014-15-                     a change during this period. Due to the increase in
    the terminal year of the Thirteenth Finance Commis-                  devolution to 42 per cent of shareable taxes, untied
    sion award, grants (through State budgets) as percent-               and formula based transfers (i.e., tax devolution) have
    age of all State GSDP declined (Fig 3). If we add to it,             become the dominant form of transfers accounting
    grants that were going directly to State implementing                for about 56.8 per cent of total central transfers to
    agencies bypassing the State budgets, we find total                  State governments in 2017-18BE.
    grants as a percentage of GSDP have also declined in

    		Source: Finance Accounts (various years) and Budget Documents 2017-18 of State Governments.

    2
        GSDP number used in the analysis is at current prices-2011-12 series.
    National Institute of Public Finance and Policy, New Delhi.         IDRC project on ‘Intergovernmental Fiscal Transfers in India’.

4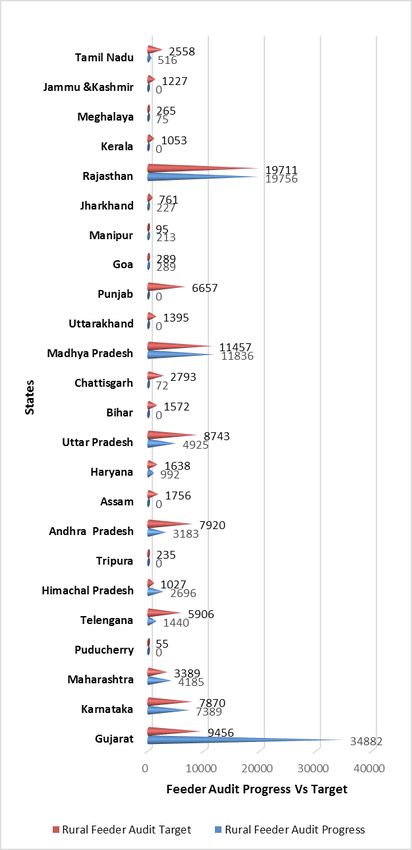
The share of general purpose transfers,3 which are un-            12 and 2017-18BE mainly due to the fall in own tax
conditional in nature, in total transfers increased from          revenues as evident from table 4. Own non-tax reve-
51.41 per cent in 2011-12 to 59.74 per cent in 2017-              nues have largely remained stagnant during this peri-
18BE while that of specific purpose transfers, which              od. Between 2014-15 and 2015-16 own-tax revenues
are conditional in nature, have declined from 48.59               as percentage of GSDP declined in 19 States. States
per cent to 40.26 per cent during this period (fig 6).            showing an increase in own tax revenues during this
                                                                  period are - Assam, Bihar, Goa, Haryana, Himachal
State-wise analysis reveal that, while all States bene-           Pradesh, J&K, Odisha, Mizoram, Rajasthan, and Tel-
fitted from the increase in tax devolution in 2015-16             angana. A total of 14 States show a decline in own tax
as compared to 2014-15, many of them experienced                  revenues in 2016-17 as compared to 2015-16 while
a reduction in central grants during this period. To-             the number of States where own tax revenues as per-
tal central transfers to States (including those going            centage of GSDP have declined in 2017-18BE over
outside the State budgets) as percentage of GSDP                  2016-17RE are 13.
declined for a number of States in 2015-16 vis-à-vis
2014-15 as evident from fig 7.

                 Source: Finance Accounts and Budget documents of States; Ministry of Finance, Government of India

          Source: Finance Accounts (various years) and Budget Documents 2017-18 of State Governments.

Own Tax Revenue of States
                                                                  Analysis of own-tax revenues reveal that the most
There has been a decline in own revenues aggregated               important state tax is the Sales tax/VAT which ac-
across all States as percentage of GSDP between 2011-             count for about 62-64 per cent of own-tax revenues
3
  We have considered tax devolution by Finance Commissions, Normal Central Assistance (or plan grants to State though Gadg-
il-Mukherjee formula) and post-devolution Non-plan Revenue Deficit/Revenue Deficit Grants recommended by Finance Commis-
sions as General Purpose transfers.
    National Institute of Public Finance and Policy, New Delhi.    IDRC project on ‘Intergovernmental Fiscal Transfers in India’.

                                                                                                                                    5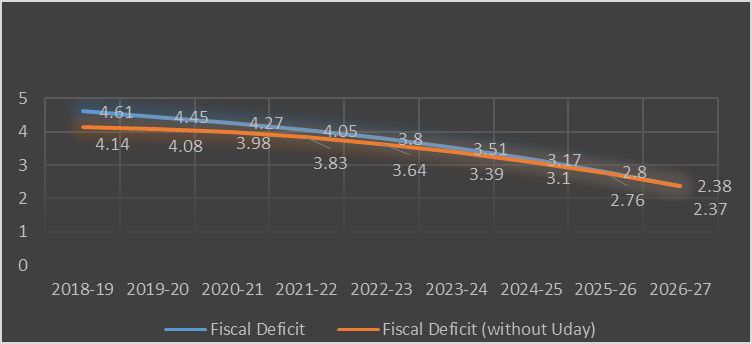
Table 4: Own Revenues of States
    												 (INR In Crores)
                                              2011-12      2012-13       2013-14       2014-15         2015-16         2016-17         2017-18
                                                                                                                         RE              BE
          Own Tax Revenue (OTR)                   557396      654550        712417       780007          848035          955477         1098264
          Own Non-Tax Revenue (ONTR)               99128      117262        132543       143721          153653          184325          195056
          Own Revenue Receipts (ORR)              656523      771811        844960       923728         1001689         1139801         1293320
          OTR as % of GSDP                          6.74          6.95         6.64            6.51            6.33            6.35            6.44
          ONTR as % of GSDP                         1.20          1.24         1.24            1.20            1.15            1.23            1.14
          ORR as % of GSDP                     7.94        8.19                7.88            7.70            7.48            7.58            7.58
         Source: Finance Accounts and Budget documents of States.

    in aggregate. The other important state taxes are State                 entry tax (all forms), entertainment tax (not levied by
    Excise and Stamp and Registration fees. These three                     local governments), tax on advertisements, taxes on
    taxes together account for around 85-86 per cent of                     lotteries, betting and gambling and state surcharg-
    own-tax revenues aggregated across states (see table                    es and cesses so far as they relate to supply of goods
    5). Nine states account for about 69-70 per cent of                     and services. What will be its impact on the own tax
    own tax revenues of all states taken together. These                    revenues of the state governments will depend on the
    are Andhra Pradesh, Gujarat, Karnataka, Maharash-                       revenue buoyancy of the GST. However, for the next
    tra, Rajasthan, Tamil Nadu, Telangana, Uttar Pradesh                    five years the Union government has guaranteed all
    and West Bengal.                                                        states governments a compensation equivalent to 14
                                                                            per cent annual growth in revenues.
    As percentage of all states GSDP, these taxes also show
    a marginal decline between 2011-12 and 2017-18BE.                       Expenditures
    State Sales tax/VAT as per cent of GSDP declined from
    4.17 per cent in 2011-12 to 3.94 per cent in 2015-16    Expenditures aggregated across all States between
    and is budgeted to be around 3.99 per cent in 2017-     2014-15 and 2015-16 show total expenditure as per-
    18BE, state excise declined from 0.87 per cent to 0.75  centage of all State GSDP to be higher in 2015-16 as
    per cent and stamp and registration fee from 0.78 per   evident from table 6. While revenue expenditure in-
    cent to 0.61 per cent during this period.               creased marginally during this period, the increase
                                                            in total expenditures is largely driven by increase in
    With the roll out of GST from 1 July, 2017, a number of capital expenditure which as percentage of GSDP in-
    state taxes have been subsumed under GST. These are creased from 2.27 per cent in 2014-15 to 2.49 per cent
    State VAT, central sales tax, purchase tax, luxury tax, in 2015-16. In 2017-18BE, both Revenue and Capital

                                     Table 5: Composition of Own Tax Revenues of States
    													(percent)
                                          2011-12     2012-13        2013-14          2014-15         2015-16          2016-17        2017-18
                                                                                                                         RE             BE
            State Sales Tax/VAT           61.91       61.70          63.72            63.33           62.36           63.88           64.37
            State Excise                  12.88       12.62          11.42            11.70           11.91           11.73           12.04
            Stamp & Registration Fees     11.55       11.55          10.85            10.96           10.92           9.76            9.78
            Other State Taxes             13.67       14.13          14.01            14.01           14.81           14.63           13.82
            Total                         100.00      100.00         100.00           100.00          100.00          100.00          100.00
            As % of GSDP
            State Sales Tax/VAT           4.17        4.29           4.23             4.05            3.94            4.05            3.99
            State Excise                  0.87        0.88           0.76             0.75            0.75            0.74            0.75
            Stamp & Registration Fees     0.78        0.80           0.72             0.70            0.69            0.62            0.61
            Other State Taxes           0.92      0.98         0.93                   0.90            0.94            0.93            0.86
           Source: Finance Accounts and Budget documents of States.

    National Institute of Public Finance and Policy, New Delhi.             IDRC project on ‘Intergovernmental Fiscal Transfers in India’.

6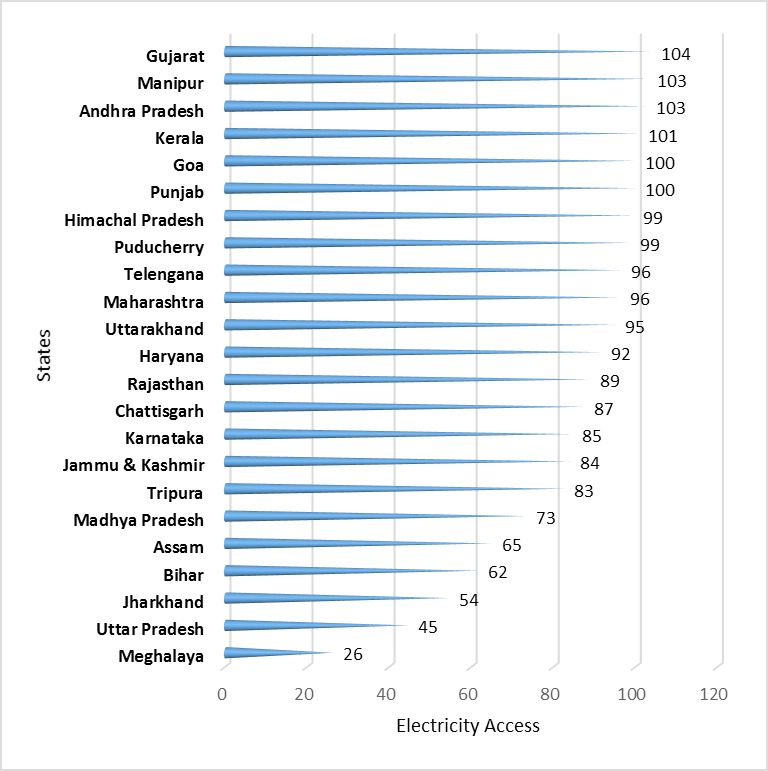
expenditure are budgeted to increase to 14.57 per cent             remain unchanged at around 31.30 percent.
and 2.79 per cent of GSDP respectively. Capital ex-
penditure on general services as percentage of GSDP                The expenditure on social services aggregated across
has largely remained unchanged between 2014-15 and                 all States as per cent of all State GSDP show an increase
2017-18BE. The entire increase in capital expenditures             between 2014-15 and 2017-18BE. Expenditures on
is primarily due to the increase in capital expenditure            education and health,4 which account for about 53-55
on economic and social services. However, there are                per cent of total social sector expenditures, have not
State-wise variations. The capital expenditure on so-              shown a major increase when measured as a percent-
cial services as percentage of GSDP increased from                 age of GSDP. The increase in expenditures in social
0.53 per cent in 2014-15 to 0.70 per cent in 2017-                 services as percentage of GSDP is largely driven by the
18BE while capital expenditure on economic services                increase in expenditures in urban development, wa-
increased by 0.34 percentage points during this peri-              ter supply and sanitation, housing, and welfare of SCs,
od and was budgeted to be around 1.92 per cent in                  STs and backward classes.
2017-18BE. Total expenditure as percentage of GSDP
declined in 2015-16 vis-à-vis 2014-15 in 14 States                 State-wise analysis show that between 2014-15 and
while 3 States have budgeted for an increase in total              2015-16, expenditure as percentage of GSDP -
expenditures in 2016-17RE over 2015-16. Although
capital expenditures as percentage of GSDP is higher               a) on social services declined in 15 States, namely
in 2015-16 as compared to 2014-15, 12 States show a                Andhra Pradesh, Arunachal Pradesh, Assam, Chhat-
decline. These are Assam, Gujarat, Karnataka, Mani-                tisgarh, Gujarat, Maharashtra, Manipur, Meghalaya,
pur, Meghalaya, Mizoram, Nagaland, Punjab, Sikkim,                 Mizoram, Nagaland, Sikkim, Tamil Nadu, Tripura,
Tamil Nadu, Tripura and Uttarakhand. In 2016-17RE,                 Uttarakhand and West Bengal;
9 States budgeted for a decline in capital expenditure
(as per cent of GSDP) over 2015-16.                                b) on education declined in 20 States. These are Andhra
                              Table 6: Trends in Expenditure Aggregated Across States
												(% of GSDP)
                                                   2011-       2012-    2013-     2014-     2015-      2016-     2017-
                                                     12          13       14        15        16       17 RE     18 BE
          Total Expenditure                       15.06       15.12    14.92     15.92     16.21      17.59     17.36
          Revenue Expenditure                     12.99       13.07    12.86     13.66     13.72      14.81     14.57
          Capital Expenditure                     2.07        2.05     2.06      2.27      2.49       2.77      2.79
          Expenditure on General Services         4.66        4.55     4.46      4.46      4.39       4.08      4.11
          Expenditure on Economic Services        4.29        4.40     4.23      4.98      5.11       5.51      5.44
          Expenditure on Social Services          5.58        5.63     5.61      5.81      6.04       6.71      6.45
          Social Services
          Expenditure On Education             2.68     2.67           2.63      2.70      2.68       2.79      2.69
          Expenditure on Health                0.59     0.60           0.60      0.67      0.70       0.78      0.73
         Source: Finance Accounts and Budget documents of States

Between 2014-15 and 2015-16, while total expendi-                  Pradesh, Assam, Chhattisgarh, Gujarat, Haryana, Hi-
ture on general services as percentage of GSDP have                machal Pradesh, Karnataka, Kerala, Madhya Pradesh,
declined from 4.46 per cent to 4.39 percent, expendi-              Maharashtra, Manipur, Meghalaya, Mizoram, Naga-
tures on social services and economic services have                land, Rajasthan, Sikkim, Tamil Nadu, Tripura, Uttara-
increased (table 6). Expenditures on general services              khand and West Bengal; and
are budgeted to decline further in 2017-18BE. Be-
tween 2014-15 and 2017-18BE, the share of expendi-                 c) on health declined in 10 States viz., Andhra Pradesh,
ture on social services in total expenditure is budgeted           Arunachal Pradesh, Himachal Pradesh, Karnataka,
to increase from 36.47 per cent to 37.17 per cent while            Meghalaya, Mizoram, Nagaland, Sikkim, Tripura, and
that of expenditure on economic services have largely              Uttarakhand.
4
  Expenditure on ‘Education’ pertains to expenditure on ‘Education, Sports, Arts and Culture, while expenditure on ‘Health’ con-
sists of expenditure on Medical and Public Health.

National Institute of Public Finance and Policy, New Delhi.        IDRC project on ‘Intergovernmental Fiscal Transfers in India’.

                                                                                                                                    7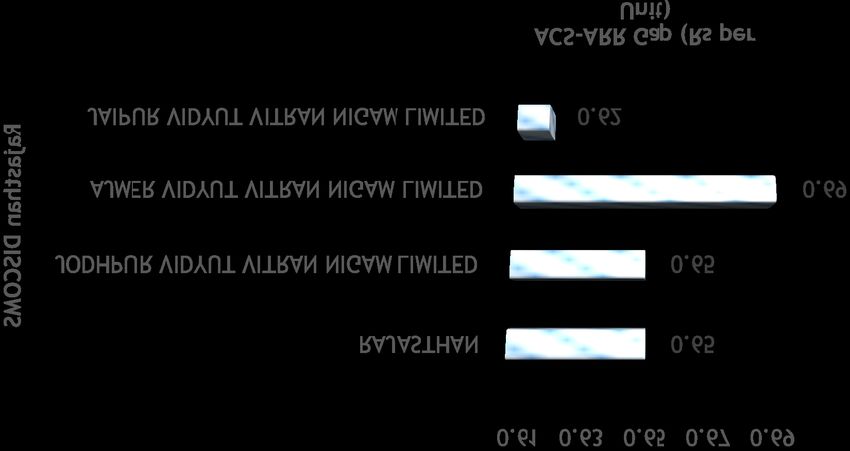
Table 7: States spending lower (in per capita terms) than All State Average Expenditure on Social Sector
                                                 2014-15                             2015-16
                 Social Services   Bihar, Jharkhand, Madhya Pradesh, Assam, Bihar, Jharkhand, Mad-
                                   Odisha, Punjab, Telangana, Uttar     hya Pradesh, Odisha, Punjab,
                                   Pradesh, West Bengal                 Uttar Pradesh, West Bengal
                                                (8 States)                          (8 States)
                 Education         Bihar, Jharkhand, Madhya Pradesh, Bihar, Jharkhand, Madhya
                                   Odisha, Punjab, Telangana, Uttar     Pradesh, Odisha, Punjab, Telan-
                                   Pradesh, West Bengal                 gana, Uttar Pradesh, West Bengal
                                                (8 States)                          (8 States)
                 Health            Assam, Bihar, Haryana, Jharkhand, Bihar, Jharkhand, Madhya
                                   Madhya Pradesh, Rajasthan, Telan- Pradesh, Rajasthan, Uttar
                                   gana, Uttar Pradesh, West Bengal     Pradesh
                                                (9 States)                          (5 States)

                                                                   2015-16 among the general category States and also
    If we examine the trend in per capita expenditures on          among the NE&H States. Among the general catego-
    social sector we find that between 2011-12 and 2015-           ry States we find that per capita expenditures on ed-
    16, per capita expenditures of all States, in real terms,      ucation, health and social services are not converging
    in education, health and social services increased at an       and the gap between the State with the highest and
    annual average rate of 6.39 percent, 10.81 per cent and        lowest per capita expenditure has increased. Howev-
    8.28 per cent respectively. The rate of growth of per          er, among the NE&H States the gap between States
    capita expenditures (in real terms) was much lower             with the highest and lowest per capital expenditure
    for the North-Eastern and Himalayan (NE&H) States.             on health and social services have declined in 2015-16
    However, the per capital social sector expenditures of         vis-à-vis 2014-15, but in case of education we find that
    aggregated across 11 NE&H is on an average higher              the gap have increased.
    than that of the general category States. Eight States
    were spending less than the all States average per             Outstanding Liabilities
    capita expenditure on social services and education
    in 2014-15 and 2015-16. As regards expenditure on              Outstanding liabilities aggregated across all States as
    health, 9 States were spending less than all State per         percentage of GSDP have declined from 23.60 per
    capita expenditure in 2014-15 and 5 States in 2015-16          cent in 2011-12 to 22.31 per cent in 2014-15 and it
    as can be seen from table 7. From the table it is evident      increased by one percentage point to 23.31 per cent in
    that States spending lower than all States average per         the following year. Outstanding liabilities are budget-
    capita expenditures in social sector are mostly States         ed to further increase to 24.13 per cent in 2016-17RE.
    with lowest per capita GSDP in the country, except             In 2015-16, 18 States report an increase in outstanding
    Punjab which is a high income State and West Bengal            liabilities as percentage of GSDP over 2014-15, while
    which is a middle income State. These low per capita           17 States budget for an increase in 2016-17RE. As per
    income States are also the States having some of the           information from RBI, during 2015-16 eight States5
    lowest human development indicators in the country.            borrowed INR 98960 crores under UDAY while in
                                                                   2016-17 thirteen States6 borrowed under UDAY. The
    In order to examine whether State-level equalisation           increase in liabilities of the State governments in 2015-
    is happening or not with respect to social sector ex-          16 and 2016-17 could be due to UDAY liabilities, as
    penditures we compare the ratio of per capita expen-           these liabilities add to the debt of the States. More-
    diture of highest per capita income State and lowest           over, the new framework of borrowing recommended
    per capita expenditure State between 2014-15 and               by the FFC provided additional borrowing to fiscally

    5
     The 8 States are Bihar, Chhattisgarh, Haryana, Jammu & Kashmir, Jharkhand, Punjab, Rajasthan and Uttar Pradesh
    6
     These States are Uttar Pradesh, Maharashtra, Haryana, Punjab, Rajasthan, Bihar, Jammu & Kashmir, Andhra Pradesh, Tamil
    Nadu, Himachal Pradesh, Telangana, Madhya Pradesh and Meghalaya.
    National Institute of Public Finance and Policy, New Delhi.    IDRC project on ‘Intergovernmental Fiscal Transfers in India’.

8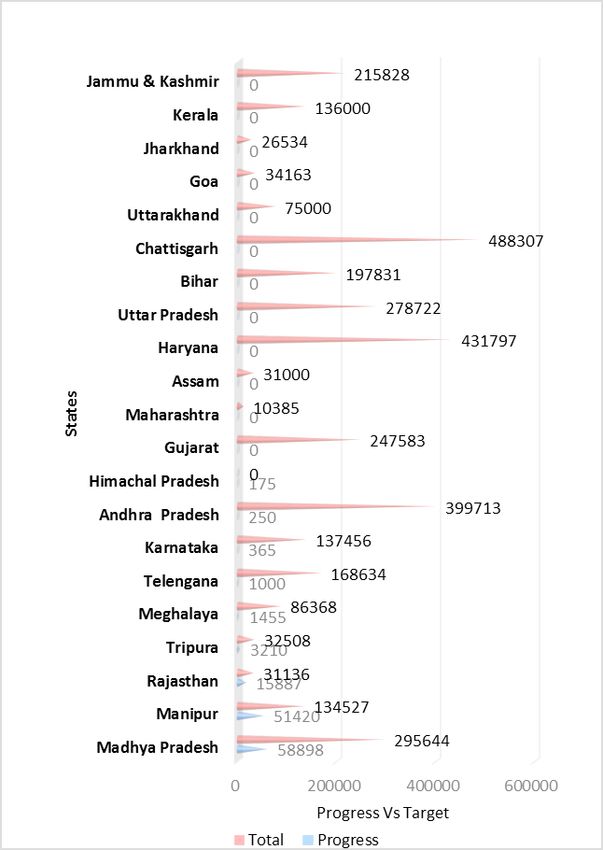
Fig 8: Change in Outstanding Liabilities of states between 2015-16 & 2014-15 and 2016-17RE & 2015-16
                                         (as per cent of GSDP)

Note: Does not include Manipur; States with Red bars are the States that have taken over DISCOM debt in 2015-16 and 2016-17.
State with bold red numbers are eligible to 0.50 per cent additional borrowings in 2016-17 and those with blue red numbers eligible
for additional 0.25 per cent borrowing based on FFC recommendations.

prudent States.7 This facility came into operation in     The reduction in outstanding liabilities during 2011-
2016-17, the second year of the award of the FFC.         12 and 2014-15 was accompanied by a decline in in-
As per estimates by RBI, States eligible for additional   terest payments to GSDP ratio. Between 2011-12 and
borrowings are:                                           2015-16, interest payments aggregated across all States
                                                          as percentage of GSDP declined from 1.65 per cent to
i) Additional borrowing of 0.25 per cent of GSDP: 1.60 percent. However, with the increase in liabilities
Arunachal Pradesh, Gujarat, Jammu & Kashmir, Ma- of State governments from 2015-16, interest payment
nipur, Meghalaya, Mizoram, Nagaland, Tripura, Uttar as percentage of all State GSDP is budgeted to increase
Pradesh and Uttarakhand (9 States);                       to 1.69 per cent in 2016-17RE and further to 1.70 per
                                                          cent in 2017-18BE.
ii) Additional borrowing of 0.50 per cent of GSDP: Ch-
hattisgarh, Jharkhand, Karnataka, Madhya Pradesh, Conclusion
Odisha, Sikkim and Telangana (7 States).
                                                          Based on our analysis of State Budgets 2017-18, it is
In addition to the liabilities on account of UDAY, the observed that all State fiscal deficit has increased in
increase in outstanding liabilities aggregated across recent years. Fiscal deficit to GDP ratio in the year
states in the fiscal year 2016-17 could be due to the ad- 2015-16 was 3.03 per cent. In the year 2016-17 (RE)
ditional borrowing limits recommended by the FFC. and 2017-18 (BE) it is estimated to be 3.67 and 2.69
7
    For more details refer to Chakraborty et al. (2016).
National Institute of Public Finance and Policy, New Delhi.       IDRC project on ‘Intergovernmental Fiscal Transfers in India’.

                                                                                                                                      9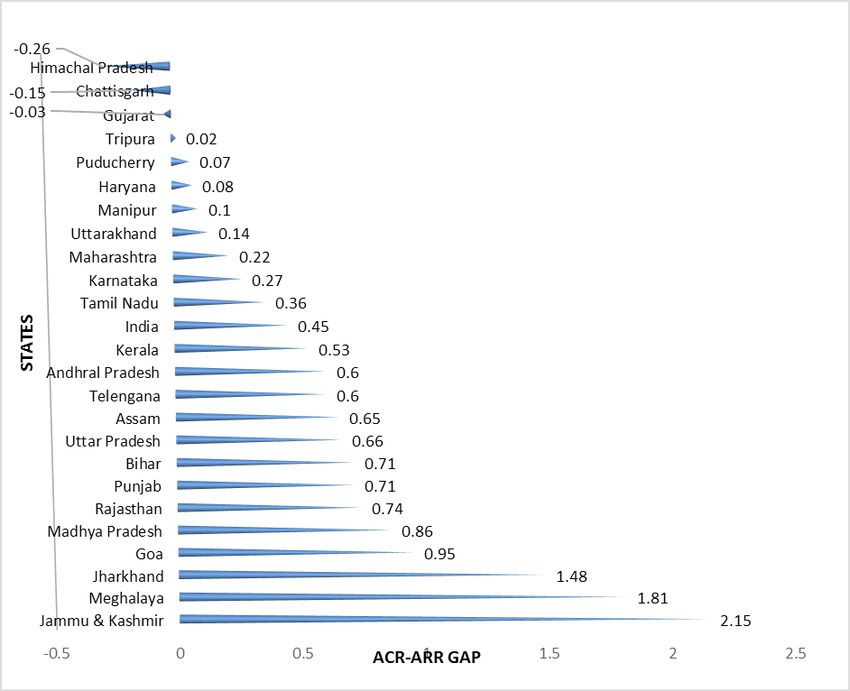
per cent respectively. Without UDAY liabilities, it is        Chakraborty, Pinaki (2017), “GST: Too Late for the
     expected to be 3.32 per cent in 2016-17 (RE). It needs        Battle on Federalism and Fiscal Autonomy” NIP-
                                                                   FP Blog, 26 May 2017. (Url: http://www.nipfp.org.
     to be emphasized that even though the deficit level is        in/blog/2017/05/26/gst-too-late-battle-federal-
     on the rise, without UDAY liability it remained well          ism-and-fiscal-autonomy/)
     below the FRBM targets in 2015-16 and states in ag-           Comptroller and Auditor General of India (CAG), Fi-
     gregate is expected to be revert to below 3 per cent          nance Accounts of State Governments (various years),
                                                                   CAG, New Delhi.
     target of deficit in 2017-18. However, the level of fiscal
     imbalance is asymmetric across States. Some of the            Finance Commission (2009): Report of the Thirteenth
     big States in terms of size of government expendi-            Finance Commission 2010–2015, New Delhi.
     ture have slipped into revenue deficits in recent years,      Finance Commission (2014): Report of the Four-
     which is a cause for concern. Though there has been           teenth Finance Commission, New Delhi.
     an increase in the level of capital expenditure in States,    Government of India (2017), Economic Survey 2016-
     its sustenance would depend on what happens to the            17, Vol. 2, Ministry of Finance, Government of India,
                                                                   New Delhi.
     revenue deficit. Downside fiscal risks are many and
     needs to be tackled in the medium term so that fiscal         Government of India (2017), Union Budget 2017-18,
                                                                   Ministry of Finance, Government of India, New Del-
     space for development spending is enhanced.                   hi.

     References                                                    Reserve Bank of India (2017), State Finance: A Study
                                                                   of Budgets of 2016-17, RBI, Mumbai.
     Budget Documents of State Governments (2017-18).
     Chakraborty, Lekha, Manish Gupta and Pinaki
     Chakraborty (2017), “State Level Debt–Deficit Dy-
     namics Emerging Issues”, Economic and Political
     Weekly, Vol. 52, No. 9, pp. 24-26.

     National Institute of Public Finance and Policy, New Delhi.   IDRC project on ‘Intergovernmental Fiscal Transfers in India’.

10
UDAY and Power DISCUSSION
paper
Sector Debt:
Assessing Efficiency
Parameters and Pinaki Chakraborty
Lekha Chakraborty
Impact on Public Finance Manish Gupta
Amandeep Kaur
1. Introduction States data at sufficient level of disaggregation is not
available. However, our analysis is based on the UDAY
With the introduction of UDAY1 - Ujwal DISCOM Memorandum of Understandings (MoUs) signed as
Assurance Yojana - States’ deficits and debt have in- tripartite agreement between the Government of In-
creased. We examine the progress of UDAY and its dia, DISCOMs and the State Governments, and State-
impact on sub-national public finances.2 The UDAY wise information provided in the UDAY portal of
scheme required State governments to absorb 75% of Government of India. However, detailed analysis of
the DISCOM debt - 50% in 2015-16 and 25% in 2016- the impact of UDAY on State finances has been car-
17. The scheme also issued bonds to take over DIS- ried out for the State of Rajasthan. The paper tries to
COM debt with a mix of equity, grant and loan. Since forecast the trajectory of debt and deficits incorpo-
its launch, 27 States have signed MoU with the Union rating the UDAY power debt to understand the fiscal
government and have joined this scheme. implications on State finances of Rajasthan. It needs
to be noted that the impact of UDAY is asymmetric
This paper analyses the State-wise progress of UDAY across States and this result cannot be generalized for
scheme with a focus on financial and operation- States. The paper is organized as follows. Section 2 and
al efficiency parameters. This paper also examines 3 analyse respectively the financial and operational ef-
the impact of the UDAY scheme on State Finances. ficiency parameters. The aggregate and State-wise pic-
In 2015-16, eight States (Uttar Pradesh, Rajasthan, ture of the performance of UDAY scheme on quarter-
Chhattisgarh, Punjab, Jammu & Kashmir, Bihar, ly basis is also presented here. There are four financial
Jharkhand and Haryana) borrowed under UDAY, parameters and ten operational efficiency parameters
while in 2016-17, twelve States (Uttar Pradesh, Maha- envisaged in UDAY MoUs. Section 4 analyses the im-
rashtra, Punjab, Rajasthan, Bihar, Jammu & Kashmir, pact of UDAY on State finances, with special reference
Andhra Pradesh, Tamil Nadu, Himachal Pradesh, Tel- to the State of Rajasthan and provides the fiscal fore-
angana, Madhya Pradesh and Meghalaya) borrowed casts of UDAY on debt-deficit dynamics of the State.
under UDAY.3 The other eight States (Gujarat, Goa,
Manipur, Tripura, Uttarakhand, Puducherry and Ker- 2. Financial Performance of States under UDAY
ala) have joined UDAY for achieving operational effi-
ciency. The objective of UDAY is to improve operational ef-
ficiency and financial transformation of electricity
The impact of UDAY on State finances of each of these distribution companies (DISCOMs). Also the scheme
individual States is difficult to undertake, as in many objective includes reduction in the cost of genera-
1
The Ujwal DISCOM Assurance Yojana (UDAY) scheme was announced by Minister of State (IC) for Power, Coal & New and
Renewable Energy in November 2015..
2
The RBI in its State Finance Report-2016-17 has given data for fiscal deficit with and without UDAY for the year 2016-17 (RE)
at 3.4 per cent (with UDAY) and 2.7 per cent (without UDAY) of GSDP (RBI 2017, page 13) respectively.
3
Obtained from The Economic Survey, Volume 2 submitted in August 2017 and also from RBI State Finance report 2016-17.
1
National Institute of Public Finance and Policy, New Delhi. IDRC project on ‘Intergovernmental Fiscal Transfers in India’.tion of power and energy conservation. This section ala no information on the issuance of bond is avail-
analyses the UDAY financial performance parameters able. As per the MoUs, there were no debt takeover
across States of India. The financial parameters ana- in most of these States. These States are Gujarat, Goa,
lysed in this section are the progress in the issuance Manipur, Tripura, Uttarakhand and Puducherry and
of UDAY bonds, the reduction in aggregate technical Kerala. As mentioned, in these States, this scheme is
and commercial losses, the reduction in the gap be- targeted only to achieve further operational efficiency
tween average cost of supply (ACS) per unit of power of DISCOMs.
and per unit average revenue realised (ARR) and tariff
revisions by DISCOMs post UDAY.
Figure 1: State-wise Issuance of UDAY Bonds (%)
Source : (Basic data), Government of India , UDAY portal
2.1 State-wise Issuance of UDAY Bonds 2.2 State-wise aggregate technical and commercial
losses (AT&C)
As mentioned, under the UDAY scheme, States agreed
to convert 75% of the DISCOM debt into State gov- The aggregate technical and commercial losses is
ernment non-SLR bonds. These UDAY bonds were termed as AT&C loss. This includes losses which are
priced at not more than 75 basis points above the pre- technical and commercial. The commercial losses also
vailing cut-off yield rate of government security of 10- include the loss of electricity due to theft, illegal me-
year maturity. In aggregate level, so far, around 86% of tering etc. The technical losses are unavoidable losses
UDAY bonds were issued (INR 2.32 lakh crores out in the transmission system. As per the UDAY scheme,
of INR 2.69 Lakh crores) across all UDAY States. Five State governments are required to reduce these losses
States, namely Jammu & Kashmir, Bihar, Chhattis- to 15% by 2018-19.
garh, Madhya Pradesh and Jharkhand issued 100% of
the bonds to the DISCOMs as mandated in the UDAY As shown in Figure 2, only six States (Himachal
scheme. Seven States (Maharashtra, Telangana, Him- Pradesh, Andhra Pradesh, Gujarat, Telangana, Ut-
achal Pradesh, Haryana, Meghalaya, Tamil Nadu and tarakhand and Tamil Nadu) have AT&C losses below
Punjab) issued 75% of the total bonds so far. For eight the 15 % norm. The all States combined average is at
States, namely, Gujarat, Karnataka, Puducherry, Tri- 19.93%. Jammu & Kashmir reports AT&C loss of
pura, Assam, Uttarakhand, Goa, Manipur and Ker- 61.34 % which is the highest while Himachal Pradesh
National Institute of Public Finance and Policy, New Delhi. IDRC project on ‘Intergovernmental Fiscal Transfers in India’.
2Figure 2: State-wise AT&C Loss (Aggregate Technical and Commercial Loss)
Source: (Basic data), Government of India, UDAY portal
has reported 4.15% AT&C loss which is the lowest in for Karnataka, Puducherry, Maharashtra, Tripura,
the scale. Six States report AT &C losses in the range of Haryana, Uttarakhand, Manipur and Tamil Nadu. Ten
20-30%. These States are Assam, Haryana, U.P, Mad- States report gap ratio of above 0.5 but below 1. These
hya Pradesh, Jharkhand and Rajasthan. The highest in are Goa, Madhya Pradesh, Punjab, Rajasthan, Kerala,
the scale are Jammu & Kashmir, Meghalaya, Manipur Bihar, U.P., Andhra Pradesh, Telangana and Assam.
and Bihar that have AT&C losses between 30-60%. Jammu & Kashmir tops the list of having a ratio of
2.15 followed by Meghalaya (1.81) and Jharkhand
2.3 State-wise Commercial Viability: ACS-ARR (1.48). Only Gujarat, Himachal Pradesh and Chhat-
Gap (INR per unit) tisgarh have reported negative ratios for the same. For
the FY 2016-17, out of 27 States tariff orders were is-
Another milestone to be achieved under UDAY is sued by 24 States.5
reduction in the difference between average cost of
Supply (ACS) per unit of power and per unit average 3. Operational Efficiency Parameters under UDAY
revenue realised (ARR) to nil by 2018-19. This tests
the commercial viability by covering the cost throughApart from financial parameters to check perfor-
revenues. The overall gap in India is INR 0.45 per mance of DISCOM across States, there are stipulated
unit.4 10 operational efficiency indicators to be monitored
under UDAY scheme. This section analyses these 10
Eighteen out of the 24 States that reported the data operational efficiency indicators to understand the
have the gap ratio between 0-1. The gap is below 0.5 progress of UDAY across States.
4
UDAY portal reports that this data does not include data of Sikkim, Arunachal Pradesh and Mizoram.
5
Delhi Electricity Regulatory Commission. 2017. “Terms and Conditions for Determination of Tariff, Regulations 2017”
3
National Institute of Public Finance and Policy, New Delhi. IDRC project on ‘Intergovernmental Fiscal Transfers in India’.Figure 3: ACS-ARR Gap (INR/Unit)
Source : (Basic data), Government of India , UDAY portal
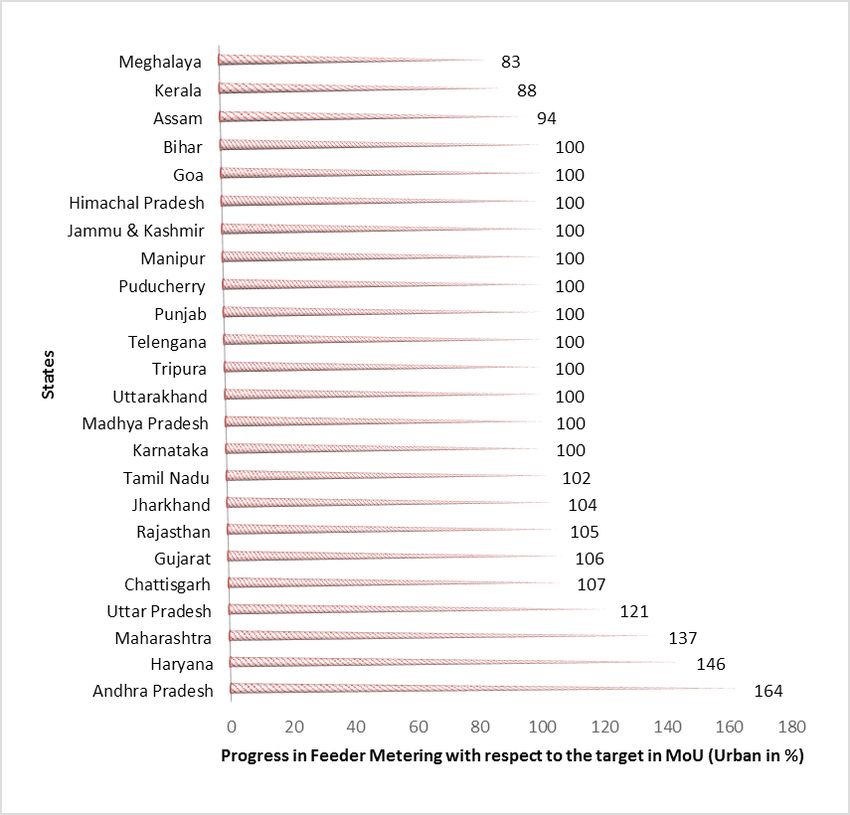
3.1 Power Supply Infrastructure (Feeder Metering) have not been able to achieve the targets in rural areas.
Himachal Pradesh, Tamil Nadu, and Telungana have
Feeder metering is to ensure effective power supply not reported the progress and set targets.
and reduction in Aggregate Technical and Commer-
cial (AT&C) losses. Target for 100% metering is the 3.2 Energy Distribution Infrastructure: DT Meter-
stated goal under UDAY. Figures 4 and 5 depict the ing
progress made by the distribution companies in this
respect. Also, it projects the outcome in absolute terms The Distribution Transformer Metering (DTM) helps
on the basis of the target set by the States at the time in improving the energy distribution system and re-
of joining UDAY. Figure 4 gives the State-wise feed- duces the losses caused by thefts. This helps in load
er metering for urban areas of the States. Out of 24 balancing and monitoring the quality of power. Also,
States, 21 States have achieved their targets while Gu- it provides real time input and output data of the units
jarat, Karnataka, Maharashtra, H.P, Andhra Pradesh consumed for better records. Figures 6 and 7 provide
are much ahead of their set targets. For urban feeders, the DT metering for urban and rural areas respective-
Assam, Meghalaya and Kerala are yet to achieve their ly in absolute term. Out of 22 State utilities that report
targets. The State-wise UDAY health cards of respec- ed data depict that this target has not been achieved
tive States report that even though States have not by 18 States. Gujarat, Assam and Jharkhand lead in
achieved their targets, still there is large improvement reaching their targets while all the other States lag be-
compared to pre –UDAY scenario. Feeder metering hind. On the other hand, DT Metering in the rural
for both urban and rural shows an upward trend. areas seems to be a major challenge as no States out
of 24 have been able to achieve this target by this year.
If we consider Feeder Metering in rural areas, 21 States
have provided data, wherein fourteen States have re- 3.4 Electricity Access to Un-connected Households
ported to have achieved the targets. Meghalaya, Ker-
ala, Jharkhand, Bihar, Chhattisgarh, U.P. and Assam Figure 8 provides the progress of the States on the ba-
National Institute of Public Finance and Policy, New Delhi. IDRC project on ‘Intergovernmental Fiscal Transfers in India’.
4Figure 4: Power Infrastructure: State-wise Feeder Metering (Urban)
Source : (Basic data), Government of India, UDAY portal
Figure 5: Power Infrastructure - State-wise Feeder Metering (Rural)
Source: (Basic data), Government of India, UDAY portal
National Institute of Public Finance and Policy, New Delhi. IDRC project on ‘Intergovernmental Fiscal Transfers in India’.
5Figure 6: DT Metering (Urban)
Source : (Basic data), Government of India , UDAY portal
Figure 7: State-wise DT Metering (Rural)
Source: (Basic data), Government of India, UDAY portal
National Institute of Public Finance and Policy, New Delhi. IDRC project on ‘Intergovernmental Fiscal Transfers in India’.
6sis of their targets for the financial year, in absolute Puducherry, Sikkim, Arunachal Pradesh, Mizoram
terms, for electricity access to unconnected house- have not reported the data on same. Also, none of the
holds. We do not have data for Tamil Nadu, Sikkim, 24 States that have reported seem to reach near the
Arunachal Pradesh and Mizoram. Electricity access target for above 500 kWH (figure 9) as well as above
is low on average for all the States except Gujarat, 200 and upto 500 Kwh (figure 9 and 10).
Puducherry, Punjab and Goa that have achieved their
targets for the year (Figure 8). Even though the States Only six States have reported data on pre and post
have not been able to achieve their targets, a pre and UDAY progress and witness an improvement in their
post UDAY analysis shows improvement in electricity goals after UDAY for above 200 units. This progress
access to households vis-à-vis prior to UDAY. is based on the quarterly performance of the States.
These States are Meghalaya, Madhya Pradesh, Uttar
3.5 Smart Metering above 200 and upto 500 Kwh & Pradesh, Andhra Pradesh, Tripura and Karnataka.
above 500 Kwh
3.6 Feeder Segregation
Installations of Smart Meters help in recording energy
consumption in intervals of an hour or less and com- As per the RBI State Finance report 2016, those States
municate the same to State utilities for effective mon- who adopt UDAY and perform as per operational
itoring and billing.6 The government aims to reach milestones will be given additional / priority funding
this target by December 2017 for greater than 500 through Deendayal Upadhyaya Gram Jyoti Yojana
units and December 2019 for greater than 200 units. (DDUGJY), Integrated Power Development Scheme
Out of the 27 States that have signed MoU, Punjab, (IPDS), Power Sector Development Fund (PSDF) or
Figure 8: State-wise Electricity Access to Unconnected Households
Source: (Basic data), Government of India, UDAY portal
6
Ministry of Power, Coal and New & Renewable Energy, 2015. “Presentation on Towards Ujwal Bharat UDAY: The Story of Re-
forms”, (November).
National Institute of Public Finance and Policy, New Delhi. IDRC project on ‘Intergovernmental Fiscal Transfers in India’.
7Figure 9: State-wise Smart Metering Above 500kWH Figure 10: State-wise Smart Metering
above 200 kWH up to 500kW
Source: (Basic data), Government of India, UDAY portal Source : (Basic data), Government of India , UDAY portal
other such schemes of Ministry of Power and Minis UDAY for 7 States out of 24 States. The remaining
try of New and Renewable Energy.7 States have not reported yet.
Government approved Deen Dayal Upadhyaya Gram 3.7 Rural Feeder Audit
Jyoti Yojana (DDUGJY) that aims at segregation of
agricultural and non-agricultural feeders for unin- Rural feeder audit helps in identifying the utilities/
terrupted supply to non-agricultural consumers in feeders making losses and helps in taking necessary
the rural areas.8 This aims at imparting 24*7 electric- actions to improve their health. Also, the audit locates
ity supply to the rural households. Figure 11 gives us the areas that require immediate attention thereby im-
the State-wise Feeder segregation targets achieved proving efficiency.
(in per cent) so far. This includes the data reported
for 17 States wherein only Gujarat and Haryana have Figure 12 provides the State-wise data for rural–feed-
achieved the targets. A pre and post UDAY trend for er audit. Gujarat, Maharashtra, H.P., Madhya Pradesh,
feeder segregation shows progress after signing for Goa, Manipur and Rajasthan have successfully
7
States not meeting operational milestones, however, will be liable to forfeiture of their claim on IPDS and DDUGJY grants. (Box
IV.1 of RBI State Finance Report, April 2016). https://rbi.org.in/scripts/PublicationsView.aspx?id=16836
8
Ministry of Power. 06-August-2015. “Feeder Segregation Scheme”. Press Information Bureau, Government of India.
National Institute of Public Finance and Policy, New Delhi. IDRC project on ‘Intergovernmental Fiscal Transfers in India’.
8Figure 11: State-wise Feeder Segregation
Source : (Basic data), Government of India, UDAY portal
reached their targets for energy audit. Moreover, out
Taking India as a whole, the aggregate picture is de-
of 24 States, 17 States are yet to attain their objectives.
picted in Figure 14. As evident, aggregate operation-
The pre and post UDAY performance of 14 States (out
al parameters for India show an upward trend in the
of 24) show a positive trend and progress in their tar-
performance if we compare pre and post UDAY. All
gets.
the parameters are analysed from March 2016 to Sep-
tember 2017 (figure 14 ).
3.8 Distribution of LEDs under UJALA
On the basis of operational and financial parameters,
UJALA, an acronym for Unnat Jyoti by Affordable
State-wise performance has been discussed. Gujarat
LEDs for All, is being implemented by Energy Efficien-
takes the lead as the best performer among all the
cy Services Limited (EESL). Under this scheme, supe-
States. It tops for having the lowest ATC losses and
rior quality energy efficient LED bulbs are distributed
the ACS/ARR gap is also negative. It is followed by
to domestic consumers at INR 75 to 95, which is 80%
Karnataka, Maharashtra, Puducherry, Telangana and
less than the market price of INR 350-450. The main
Himachal Pradesh. States that are at the bottom in
idea is promoting energy conservation and creating
terms of performance of these indicators are Tamil
awareness about energy saving technologies.9 Table 13
Nadu, J&K, Meghalaya, Kerala and Rajasthan. In ad-
depicts State-wise distribution of LEDs under UJA-
dition to this, ranking of States have also been done
LA scheme. Out of the 24 States, Gujarat, Karnataka,
on quarterly basis for the DISCOMs. Among the DIS-
Maharashtra, Puducherry, Tripura, Andhra Pradesh,
COMs, Bangalore Electricity Supply Company Ltd.
Assam, U.P., Bihar, Chhattisgarh and Jharkhand have
(BESCOM) tops the scale based on the performance
achieved their target levels while other States report
of parameters on quarterly basis. This is followed by 3
less than the total no. of LEDs targeted. The pre and
out of 4 DISCOMs of Gujarat.
post UDAY trend depicts progress for all the States
from 2016 to June, 2017.
9
Fact Sheet on Unnat Jyoti by Affordable LEDs for All (UJALA) PIB, Government of India.
National Institute of Public Finance and Policy, New Delhi. IDRC project on ‘Intergovernmental Fiscal Transfers in India’.
9Figure 12: State-wise Rural Feeder Audit Figure 13: State-wise Distribution of LEDs under
UJALA
Source: (Basic data), Government of India, UDAY portal Source: (Basic data), Government of India, UDAY portal
has also provided the fiscal deficit number. However,
4. Impact of UDAY on State Public Finance in all likelihood, there will be asymmetric impact of
UDAY across States since power sector debt liabilities
It is pertinent to ask about the likely impact and fu- are different across States. For instance, the Budget
ture implications of the UDAY debt on State financ- 2017-18 of Rajasthan revealed that the fiscal deficit
es. To arrive at an aggregate debt (with and without with UDAY as percent of GSDP was as high as 9.38
UDAY) is a challenge. As all States have not provided per cent in 2015-16 due to the absorption of 50 per-
UDAY-disaggregated debt figures in their recent bud- cent of DISCOM debt in that year (which was INR
gets, we cannot provide an aggregate number. 62,000 crores).
The outstanding liabilities of Rajasthan increased to
The RBI State Finances Study for the year 2016-17 33.79 per cent in 2016-17 (RE) which was much above
National Institute of Public Finance and Policy, New Delhi. IDRC project on ‘Intergovernmental Fiscal Transfers in India’.
10Figure 14: Progress of UDAY Operational Parameters (as of March 31, 2017)
Source: (Basic data), Government of India, UDAY portal
Figure 15: Fiscal deficit of the States - with and without UDAY
Source: (Basic data), RBI State Finances & Economic Survey, Vol 2, 2017.
the FC-XIV suggested debt cap of 25 per cent of GSDP ruptions to State government finances, reflecting their
or the proposed target of 20 per cent recommended absorption of the DISCOM liabilities under the UDAY
by FRBM review committee to be achieved by 2025. programme.
The Economic Survey – Volume 2 submitted in ear- The RBI Study on State Finances points to the wors-
ly August 2017 observed that: The Union Budget for ening of the fiscal deficit to GDP ratio on account of
2017-18 opted for a gradual rather than the sharp con- the increase in capital outlay and loans and advanc-
solidation path recommended by the FRBM Review es to power projects-around $98960 crore was bor-
Committee, prudently balancing the requirements of rowed under UDAY by eight States during 2015-16
a cyclically weakening economy and the imperative of (Economic Survey, Volume 2, 2017). Net of UDAY
maintaining credibility, especially in the wake of dis- bonds, consolidated State fiscal deficit moderates by
11Figure 16: Forecast of Revenue Deficit (with and without UDAY in Rajasthan)
Source: Chakraborty et al., 2017
Figure 17: Forecast of Fiscal Deficit: with and without UDAY in Rajasthan
Source: Chakraborty, et al. 2017
Figure 18: Forecast of Outstanding Liabilities with and without UDAY in Rajasthan
Source: Chakraborty, et al. 2017
120.7 percentage point to 2.9 per cent (Figure 12). Thus Delhi Electricity Regulatory Commission, 2017.
with UDAY, as per the available information, the com- “What are ATC losses?” Public Awareness Bulletin-2.
binedfiscal deficit of States crossed the FRBM bench-
mark of 3.0 per cent. Based on information on 25 Government of India, 2016. Fact Sheet on Unnat Jyo-
States, the combined fiscal deficit of States in 2016-17 ti by Affordable LEDs for All (UJALA) PIB, Govern-
(RE) would be 3.4 per cent, while it would be 2.7 per ment of India.
cent without the UDAY liabilities (Figure 15).
Ministry of Power, 2015. “Year End Review - Compre-
The UDAY-incorporated forecast path of outstanding hensive State-Specific Action Plans for 24x7 “Power
liabilities of States would depend on a host of factors for all”, Energy Shortage reduced to 2.3%; Peak Short-
including the buoyancy of State revenues and perfor- age to 3.2%,‘UDAY’ to ease Financial Crunch of DIS-
mance of DISCOMs. As data is not disaggregated for COMs, National Initiatives to Curb Carbon Emissions
UDAY and non-UDAY in all States, we are unable to & Promote Energy Efficiency”, Press Information Bu-
provide all the State-specific forecasts. However, we reau, Government of India, December.
have the forecast path of debt and deficit of Rajasthan-
with and without UDAY. Ministry of Power, 2015,“Feeder Segregation Scheme”.
Press Information Bureau, Government of India. Au-
4.1 Forecast of Debt-Deficit in Rajasthan (with and gust 6.
without UDAY)
Ministry of Power, Coal and New & Renewable En-
The forecasts of revenue deficit, fiscal deficit and out- ergy, 2015. “Presentation on Towards Ujwal Bharat
standing liabilities of Rajasthan are shown in Figure UDAY: The Story of Reforms”, Accessed at https://
16, 17 and 18 respectively. The projections are carried www.uday.gov.in/, November.
out on the basis of tax buoyancy, expenditure elastic-
ities and assumed the inflation-growth paths (for de- Ministry of Power, 2013. “Minimizing gap between
tails, Chakraborty et al., 2017). ACS & ARR of Power generation is a priority”. Press
Information Bureau, Government of India. December
5. Conclusion 13.
UDAY power debt raises a fundamental question. The Hindu, 2016. BSES relying on DT metering, the
What should be the criteria to judge fiscal prudence Hindu, September.
at the State level? May be it is time to propose that
future reforms on debt and deficit should judge fiscal
prudence based on comparable measures of deficits
and debt across States. The aim should be to have a
comprehensive measure of Public Sector Borrowing
Requirement (PSBR) by encompassing all public sec-
tor liabilities at the State level including power sector
debt, than using a measure which only reflects deficit
arising out of budgetary transactions.
References:
Anupama Airy, 2017. “A big turnaround in India’s
Power Sector”. Press Information Bureau, Govern-
ment of India, Special Service and Features.
CARE Ratings, 2016. “Power: Evaluation of UDAY”,
December 28.
Delhi Electricity Regulatory Commission, 2017.
“Terms and Conditions for Determination of Tariff,
Regulations 2017”.
13Would UDAY Discussion
brighten up Paper
Rajasthan
finances? Pinaki Chakraborty
Manish Gupta
Lekha Chakraborty
Amandeep Kaur
Introduction 2016-17. With this, by the end of the fiscal year 2016-
17, aggregate fiscal deficit of Rajasthan, shows an in-
Rajasthan is the largest State in India (in terms of crease from 3.13 per cent of GSDP in 2014-15 to 9.38
area) with a geographical area of 342.24 thousand sq per cent in 2015-16. It is expected to be 5.76 per cent
km which constitutes 10.41 per cent of the total geo- in 2016-17 (RE). However, in 2017-18 (BE) fiscal defi-
graphical area of the country. It also accounts for 5.66 cit is expected to be 2.99 per cent of GSDP.
per cent of the total population of the country. Rajas-
than is one of the low per capita income States. Per This restructuring of power sector debt has the fol-
capita income as per the latest GSDP data (new series lowing long run fiscal implications:
- 2011-12) for the year 2014-15 is INR 84837.30. De-
spite low per capita income, the State has made signif- (a) An increase in deficits, particularly revenue deficit
icant progress in social sector development and also due to the increase in interest payment as a result of
reduced level of poverty in recent decades. The State the increase in the stock of outstanding debt. A cor-
also managed its fiscal deficit well. But power sector responding reduction in capital expenditure is inevi-
finances continued to be a significant drag on its fis- table if the State has to remain within the fiscal deficit
cal resources. We analyse the aggregate picture of the target specified under the Fiscal Responsibility Act.
finances of Rajasthan taking power sector into con-
sideration. (b) As UDAY scheme has come into force post Four-
teenth Finance Commission’s (FFC’s) recommen-
Importance of Consolidated View of State Finances dations, the fiscal framework for higher borrowing
proposed by FFC for higher capital spending remains
Fiscal prudence in most countries, including India, is
unclear for all the States participating in UDAY
focused on general government deficit. Though, there
scheme.
is a strong merit in targeting total public sector bor-
rowing requirements, paucity of data and its timeliness
always prevented having a consolidated view of public (c) The FRBM framework proposed by the FRBM
sector borrowing. In the multilevel federal system of Review Committee suggests that aggregate State debt
India also, the focus has always been in controlling fis- should be 20 per cent of GDP by 2023. What would
cal deficit reflected in the State and union government that mean for States like Rajasthan needs clarity when
budgets. In case of Rajasthan also, when we consider the debt to GSDP ratio with power sector debt now is
only government deficit, it remained well within the hovering around 34 per cent of GSDP and is likely to
Fiscal Responsibility Act (FRA) target of 3 per cent continue upto 2026-27.
of GSDP in recent years. But the story changed dra-
matically with the introduction of Ujwal DISCOM Overview of State Finances
Assurance Yojana (UDAY). Under this scheme, 21
State governments including Rajasthan have taken An overview of State Finances is presented in Table 1.
over 75 per cent of the outstanding debt of the power As evident from the table, aggregate revenue receipts
sector-DISCOM companies in the year 2015-16 and as a percent of GSDP has increased from 13.06 per
1
National Institute of Public Finance and Policy, New Delhi. IDRC project on ‘Intergovernmental Fiscal Transfers in India’.Table 1: An Overview of State Finances of Rajasthan (2011-12-to 2017-18)
(% of GSDP)
2011-12 2012-13 2013-14 2014-15 2015-16 2016-17 RE 2017-18 BE
Revenue Receipts 13.06 13.55 13.55 15.06 14.91 15.53 15.73
Revenue Expenditure 12.29 12.85 13.74 15.59 15.79 17.91 17.36
Capital Expenditure 1.63 2.16 2.49 2.66 3.27 2.47 3.09
Total Expenditure 13.92 15.01 16.22 18.24 19.06 20.38 20.45
Social Services 5.48 5.69 6.56 7.19 7.34 7.86 7.56
Economic Services 4.05 5.06 5.31 6.37 7.05 7.11 7.47
Revenue Deficit 0.77 0.70 -0.19 -0.53 -0.89 -2.38 -1.63
Fiscal Deficit -0.83 -1.73 -2.76 -3.13 -9.38 -6.36 -2.99
Primary Deficit 0.98 -0.04 -1.11 -1.41 -7.59 -3.99 -0.62
Outstanding Liabilities 24.41 23.85 23.63 24.34 31.13 33.79 33.61
Source: Finance Accounts and 2017-18 Budget Documents of Government of Rajasthan.
cent to 15.73 percent between 2011-12 and 2017-18 from 7.92 percent in 2011-12 to 8.56 percent in 2014-
BE. This increase is due to the increase in own tax to 15. However, in 2015-16 own revenues declined to
GSDP ratio and a notional increase in grants due to 7.97 percent mainly due to the fall in own non-tax
the changes in accounting of the flow of grants.1 For revenues which declined from 2.18 percent of GSDP
the period from 2014-15 to 2017-18 BE, the increase in 2014-15 to 1.62 percent in 2015-16. The fall in own
in revenue to GSDP ratio is from 14.91 to 15.73 per non-tax revenues was due to the reduction in petro-
cent. During the same period, total expenditure as per leum royalties, receipts under police and miscella-
cent of GSDP is expected to increase from 15.59 to neous general services. Own tax revenues also fell
17.36 per cent. during this period, but the decline was marginal. Own
Table 2: Revenue Receipts
(% of GSDP)
2011- 2012- 2013- 2014- 2015- 2016- 2017-
12 13 14 15 16 17 RE 18 BE
A Total Revenue Receipt 13.06 13.55 13.55 15.06 14.91 15.53 15.73
(B+C)
B Own Revenue Receipt 7.92 8.63 8.56 8.56 7.97 7.93 8.34
Own Tax Revenue 5.81 6.17 6.09 6.38 6.35 6.27 6.59
Own Non-Tax Revenue 2.10 2.46 2.47 2.18 1.62 1.66 1.75
C Central Transfers 5.15 4.91 4.99 6.50 6.93 7.60 7.38
Tax Devolution 3.43 3.46 3.40 3.27 4.15 4.48 4.50
Grants-in-aid 1.71 1.45 1.59 3.23 2.78 3.12 2.88
D Grants outside State budget 1.61 1.60 1.56 0.09 -- -- --
All Grants 3.33 3.05 3.15 3.33 2.78 3.12 2.88
E All Central Transfers 6.76 6.51 6.55 6.59 6.93 7.60 7.38
(C+D)
Source: Finance Accounts and 2017-18 Budget Documents of Government of Rajasthan.
Analysis of finances of the State of Rajasthan reveals Revenues (as percentage of GSDP) are expected to be
that own revenues of the State as percentage of GSDP around 7.93 percent in 2016-17 RE and 8.34 percent
has been growing during the period 2011-12 to 2014- in 2017-18 BE as evident from table 2.
15. Own revenues as percentage of GSDP increased Following the recommendations of the FFC, there
1
Grants for various centrally sponsored schemes earlier bypassed State budgets were routed through the State budgets from 2014-
15 onwards (See Table 2). This resulted in an increase in the flow of grants to States in an accounting sense.
2 National Institute of Public Finance and Policy, New Delhi. IDRC project on ‘Intergovernmental Fiscal Transfers in India’.You can also read


