INVESTOR DAY 2018 May 11, 2018 - Cooper Tire Investors
←
→
Page content transcription
If your browser does not render page correctly, please read the page content below

INVESTOR DAY 2018 May 11, 2018

SAFE HARBOR

This presentation contains what the company
believes are forward-looking statements related
to future financial results and business
operations for Cooper Tire & Rubber Company.
Actual results may differ materially from current
management forecasts and projections as a
result of factors over which the company may
have limited or no control. Information on certain
of these risk factors and additional information on
forward-looking statements are included in the
company’s reports on file with the Securities and
Exchange Commission and set forth at the end
of this presentation.

2
AVAILABLE INFORMATION

You can find Cooper Tire on the web at coopertire.com. Our company webcasts earnings calls and
presentations from certain events that we participate in or host on the investor relations portion of our
website (http://coopertire.com/investors.aspx). In addition, we also make available a variety of other
information for investors on the site. Our goal is to maintain the investor relations portion of the website
as a portal through which investors can easily find or navigate to pertinent information about Cooper
Tire, including:
– our annual report on Form 10-K, quarterly reports on Form 10-Q, current reports on Form 8-K, and any amendments to those
  reports, as soon as reasonably practicable after we electronically file that material or furnish it to the Securities and Exchange
  Commission (“SEC”);
– information on our business strategies, financial results and selected key performance indicators;
– announcements of our participation at investor conferences and other events;
– press releases on quarterly earnings, product and service announcements and legal developments;
– corporate governance information; and
– other news and announcements that we may post from time to time that investors may find relevant.

The content of our website is not intended to be incorporated by reference into this presentation or in
any report or document we file with or furnish to the SEC, and any references to our website are
intended to be inactive textual references only.

3
AGENDA

Overview and Outlook - Brad Hughes, President & Chief Executive Officer                        08:30 - 09:25
Driving Global Profitable Growth                                                               09:25 - 10:20
- Consumer Replacement - Chris Ball, SVP & President - North America
- Original Equipment - Glenn Arbaugh, Director, Global LV OE Strategy & Business Development
- Commercial Vehicle - Gary Schroeder, Director, Global Truck and Bus
Break                                                                                          10:20 - 10:35
Developing Capabilities to Win                                                                 10:35 - 11:05
- Product Design and Development - Chuck Yurkovich, SVP Global Research and Development
- Supply and Production Optimization - Jim Keller SVP, Head of Transformation
Financial Outlook and Capital Allocation - Ginger Jones, SVP & CFO                             11:05 - 11:25
Wrap up - Brad Hughes, President & Chief Executive Officer                                     11:25 - 11:30
Q&A                                                                                            11:30 - 12:00

4
OVERVIEW & OUTLOOK
BRAD HUGHES, PRESIDENT & CHIEF EXECUTIVE OFFICER

5

For over 100
years our      We make
                                   Our
               great products                      We provide
DNA has                         Core Value         great value
remained the                    Proposition
same

                                         We offer
                                         great service

6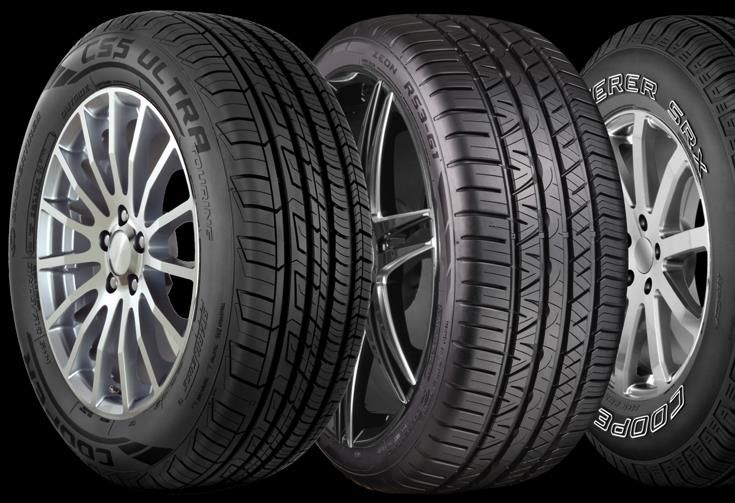
100+                                             4                                     12th
       years in the tire
                                                  business units                                 largest tire   We are a leading
          industry
                                                   (NA, LatAm,
                                                    EU, Asia)
                                                                                                manufacturer
                                                                                                  worldwide
                                                                                                                tire company,
                                                                                                                combining strong
                                                                                                                positions in the US
                                                                                                                aftermarket and
                                                                                                                attractive global
                                9k+                                        5th                                  markets
                               employees                                largest tire
                                across 4                              manufacturer in
                               continents                             North America

7   Source: S&P Capital IQ; Tire Business market data book, August 2017 (based on 2016 sales)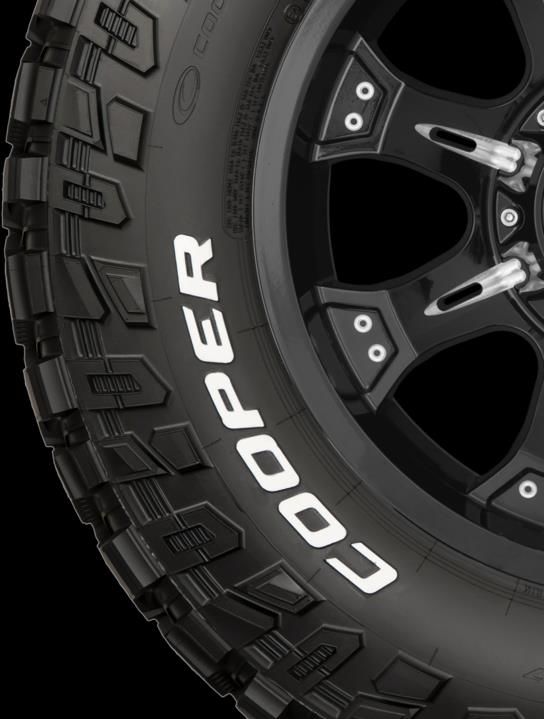
OUR INDUSTRY IS              …WE ARE CONTINUING TO EVOLVE AND
CHANGING                     STRENGTHEN OUR COMPETITIVE ADVANTAGE…

                             We are well positioned to      ...and we continue to invest
                             win today...                   to win the future consumer
       Consumers are
       changing the "rules   • Strong consumer              • Involving consumers to design
       of the game"            recognized brand               next generation of high
                             • Highly-rated, award-           performing tires
                               winning product portfolio    • Winning consumers in the
       Innovation in         • Deep and adaptable             digital domain
       automotive market       distribution footprint       • Providing choice and meeting
                             • Strong technological           consumers where they prefer
                               capabilities                   to shop

                             • Flexible and capable         • Continuously improving our
       Evolving
                               global manufacturing           product quality, production
       distribution
                                                              technology, and value
       environment           • Strategic OE participation     proposition to consumers

8
WE'RE TARGETING ATTRACTIVE FINANCIAL RESULTS IN THE MID-TERM

                                                                                                                             Mid-term
                                                                                                                              targets
                                                                                               Top-line                       (5 year)
                                                                                               growth
                                                                   Cost                      opportunities
                                                                 structure                                            Annual Unit      Low to mid
                                                                                                                      Volume Growth   single digits
                                                               enhancement
                                    Market                                                                            OP Margin         ~10-14%
                                                                                        • Product mix shift to HVA
                                    effects                                             • Faster introduction of
                                                                                          Consumer driven             ROIC              ~14-16%
            2017                                          • Restored operating
                                                                                          products
                                                            leverage via volume
                                                                                        • Replacement channel
                                                            growth
                                                                                          expansion
                            • Steady state sell-out       • Reduction of fixed and
                                                                                        • Strategic engagement
                              demand growth                 variable costs through
                                                                                          with OEMs
                            • Return to normalized          optimization of footprint
                                                                                        • Wider TBR distribution
Volume Growth      (0.5)%     industry promotion levels   • Margin enhancement via
                                                                                          and broader brand
                                                            improved design and
                                                                                          offering
                                                            production capabilities
OP Margin          9.5%                                                                 • Capitalizing on growth in
                                                            while delivering top
                                                                                          fast growing markets and
                                                            performance and quality
                                                                                          advantaged LT/SUV
ROIC               12.2%
 9
                                                                                          profile
     9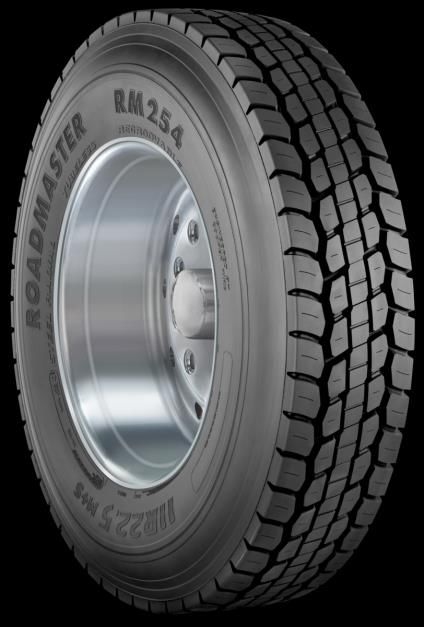
OVER TIME, CTB HAS BECOME A STRUCTURALLY MORE PROFITABLE
COMPANY …

 Operating margin (%)

 15%

 10%

                                                                                                 8-10%
   5%                                                                                           Previous
                                                                                               margin target
                                                                                                  range
      0
      2004          2005        2006   2007   2008   2009   2010   2011   2012   2013   2014     2015      2016   2017

  -5%

-10%

10 Source: CTB financial data
… WHILE EFFICIENTLY MANAGING OUR SHAREHOLDERS' CAPITAL
AND RETURNING OVER $600M IN CASH OVER THE PAST 5 YEARS
Strong cash flow and return on invested Cumulative cash returns to
capital shareholders
>$120M >$500M
~15% dividend payments
over the past
share repurchases
over the last
avg. ROIC over
5 years 5 years
the past 5 years
Over
$100M Paying
dividends
avg. free cash
flow over consecutively
the past 5 years since
1973
11 Note: ROIC and free cash flow defined in appendixSINCE THE FINANCIAL CRISIS, WE HAVE DELIVERED STRONG
RETURNS FOR OUR SHAREHOLDERS
Avg. annual TSR
Value of $100 invested year-end 2008 (YE 2008 —
Apr 2018)
800
700
600
500 CTB: 18%
400 Tire peers: 17%1
S&P 500: 15%
300
200
100
0
Feb Feb Feb Feb Feb Feb Feb Feb Feb April
2009 2010 2011 2012 2013 2014 2015 2016 2017 2018
1. Median return, rebalanced monthly, of the following tire peers: Bridgestone, Cheng Shin, Continental, Giti, Goodyear, Hankook, Kumho, Michelin, Nokian, Sumitomo
Rubber, Toyo Tire, and Yokohama
Note: TSRs are February 28th through February 28th, except current period through April 30th. TSRs use company reporting currency
12 Source: S&P Capital IQ; BCG ValueScience® CenterWE BALANCE A STRONG U.S. MARKET POSITION WITH GLOBAL
GROWTH OPPORTUNITIES
North America EMEA
Strong U.S. aftermarket position Broad product offering in focus
and robust dealer network regions
→ Focus on strategic OE → Strengthen market position
participation with global in Western Europe and
OEMs and expanding in select high-potential Eastern
underpenetrated channels European, Middle Eastern
and African countries
We are constantly building
Latin America and leveraging our Asia
capabilities globally
Main focus on serving light Successful penetration of OE
vehicle segment channel in China with strong
growth in recent years
→ Focus on gaining additional → Leverage penetration of OE
market share by further
to garner replacement pull-
optimizing product and
through and substantial
channel mix
growth
13NORTH AMERICA: STRONG HISTORY IN THE AFTERMARKET WITH A
CLEAR GROWTH PATH AHEAD
We have a significant position in our core …with clear additional growth opportunities
market… we are pursuing
Fifth largest tire manufacturer in North America - Increasing our emphasis on HVA products and
- Responsible for ~5% of $46 billion in tire sales in 20171 consumer needs
Primary focus on the U.S. replacement market - Enhancing presence in fast growing and
- advantaged LT/SUV profile
underrepresented channels
One of two major consumer tire companies
headquartered in the U.S. - Leveraging the strength of our brand through
- ~5,400 U.S. based employees digital
- 3 U.S. tire manufacturing facilities
– Findlay, OH - Strategically expanding our position in global OE
– Texarkana, AR segment
– Tupelo, MS
- Enhancing our TBR business
1. Represents Cooper share to total North America tire sales in 2017.
14 Source: Tire Business Market Data Report, 2018ASIA: IN ADDITION TO STRONG OE AND TRADITIONAL RETAIL, WE
ARE INCREASING OUR FOCUS ON E-COMMERCE AND TBR
Continuation of strong growth in Substantial growth in e- We are focused on growing our
our OE business Commerce TBR business
Our OE business grew at more than e-Commerce on upward trend in China, We have developed and launched the
90% CAGR between '15-'17 enabled by local payment and courier Starfire brand TBR suitable for road
systems conditions in the local Chinese market
We are focused on the fastest growing
OE segment - SUV market projected to Tire sales through e-commerce is
grow at 5.3% CAGR between '17-'23 estimated to account for ~10% of
replacement market
Our fitments are on 5 of the top 10
selling SUVs in China in 2017 We are collaborating with several e-
commerce platforms to enhance
We expect to continue to grow faster participation in e-Commerce
than the China market
Our Asia sales through e-commerce
channels increased by >170% in Q1
2018, driven by replacement pull-
through
15 Source: LMC; December 2016LATIN AMERICA: WE ARE GROWING OUR BUSINESS BY FURTHER
ENHANCING OUR PRODUCT PORTFOLIO AND DISTRIBUTION NETWORK
We have achieved fast growth in LATAM... ..with a pointed plan to continue winning share
- Established key brands in major LatAm countries… - Introducing our Ambassador Program with local
representatives on ground
- Focusing on mass merchants channel in other LatAm
countries
- Focus on key mass merchants (especially in Mexico)
- Further enhancing our product portfolio with localized
products
- Developed organization and talent to cover region
- Adapting current product line for LatAm local needs
- Introduced the right product lines
- Conducting early discussions with Global OEMs on
potential collaboration
>2X volume growth in ~4 years
>9% market share in Mexico
16EMEA: STRONG BUSINESS WITH FUTURE GROWTH EXPECTED IN
FOCUSED SEGMENTS
Our European operations have made several … and are focused on enhancing our products,
notable achievements in recent years… brand and channels
- Strong market share in UK 4x4 replacement - Developing high level label products for premium
segments
- High grades in European labeling
The Cooper Zeon 4XS Sport SUV placed in the - Introducing All-Season products
top two of 15 tires in test of summer tires
(February 2017) - Re-energizing Cooper and Avon brands
- Started supply to VW Portugal and developing - Exploring opportunities with leading online tire
local OE ready production distributors
- Developed relationships with niche OEMs
- Established motorcycle & racing tire business
17OUTLOOK FOR MARKET AND PROFIT DRIVERS APPEAR TO BE
TRANSITIONING TO STABLE OR POSITIVE
• Strong macro environment
Demand for tires • Growth-supporting automotive and consumer
trends
Capacity vs. • Added capacity expected to be offset by growth
demand in demand, shift to HVA, and shifts in imports
Raw • Raw material costs started stabilizing in H2 '17
material costs • Modest sequential growth expected in '18
• Higher costs passed through in '17 list prices,
Pricing
offset by enhanced promotional activity
dynamics • Competitive pricing continues into '18
18 Positive impact Moderate impactChanges in consumer
preferences and behavior
Looking ahead,
we focus on key
long-term Trends in underlying automotive
market factors market
influencing the
tire industry Evolving distribution
environment
19WE ARE STRONGLY POSITIONED TO WIN IN AN EVOLVING ENVIRONMENT
• Well-known and highly regarded brand
Changes in consumer
• Winning value proposition
preferences and
• Mix shift toward house brands
behavior
• Highly rated product portfolio
• Strong technical expertise
Underlying
• OE capabilities and advanced production technology
automotive trends
• Global and regional technology centers
• Well-established, and flexible distribution footprint
Evolving distribution • Deep relationships in U.S. aftermarket
environment • Growing presence in fast-growing retail and ecommerce
channels
205th 3rd highest
Unaided brand
Cooper® awareness
recommendation
rate (net promoter
ranking among
flagship brand is all tire brands
score)
stronger than
ever with a
favorable
reputation
Selected
among most of Highest
close rate
consumers the time among top industry
when head-to-head brands
with competitors
Source: June 2016 Tire Buyer Survey;
21 Traqline Quarterly Report Last 4Q Ending
Q3 2017 The Stevenson CompanyWE HAVE LARGELY COMPLETED OUR STRATEGIC MIX SHIFT TO OUR
HOUSE BRANDS
We conducted a strategic shift towards house … to further strengthen the
brands… awareness and equity of our brands
CTB U.S. Brand Mix Volume
15% 15%
9%
23%
76%
62%
2012 2017
Retail private labels Private brand distributor House brands
22WE ARE CONTINUING TO LEVERAGE OUR GLOBAL FOOTPRINT FOR
SPEED, FLEXIBILITY, AND COST
Findlay Melksham
Invested in our facility in
Tupelo Krusevac
Serbia to make it a
European and global
source of low-cost
production
Expanded our facility in
Kunshan, China to
support our business
Qingdao City
Texarkana
Upgraded and will
continue to upgrade
selected sites to become
OE ready
El Salto (Kunshan since 2012, GRT
Kunshan in 2017, Tupelo in 2018, and
Serbia in 2020)
Distribution centers Production facilities Technical centers
23WE ARE SHIFTING TO A MORE CONSUMER DRIVEN MINDSET TO
POSITION US AHEAD OF CHANGING INDUSTRY
• What consumers want:
Consumer led design
• Where they shop: Growing in
Consumers' needs, mass merchants, auto dealers
preferences and expectations and online
• How they shop: Engaging in
the digital domain
Great
products Commercial
growth in
profitable
segments
Great Great
service value
• Enhancing our product and
• Continuing to optimize our
Optimizing our Capability technology capabilities
production network
production enhancement • Evolving our organization
24Overview and Outlook
Consumers are driving change across the industry - what products they
want, where they shop and how they shop, and distribution landscape is
rapidly evolving
Our 100+ year focus on delivering value to consumers and investments we
have made over the past decade position us to win
We are continuing our drive to embed a consumer driven mindset in
everything we do
− What they want: Integrating consumer led design and enhancing our
product portfolio
− Where they shop: Expanding into growing channels where consumers
want to find our products and capitalizing on our strong distribution
network
− How they shop: Greater e-Commerce and digital engagement
KEY We are aligning our operations and organization to reflect this
TAKEAWAYS − Upgrading our supply / technology capabilities
− Evolving our organization, bringing in new talent in key market facing
positions to facilitate our transformation
Consistent with our strong track record, our plan is designed to deliver
25 superior value for our consumers, our customers, and our shareholdersAGENDA Overview and Outlook - Brad Hughes, President & Chief Executive Officer 08:30 - 09:25 Driving Global Profitable Growth 09:25 - 10:20 - Consumer Replacement - Chris Ball, SVP & President - North America - Original Equipment - Glenn Arbaugh, Director, Global LV OE Strategy & Business Development - Commercial Vehicle - Gary Schroeder, Director, Global Truck and Bus Break 10:20 - 10:35 Developing Capabilities to Win 10:35 - 11:05 - Product Design and Development - Chuck Yurkovich, SVP Global Research and Development - Supply and Production Optimization - Jim Keller SVP, Head of Transformation Financial Outlook and Capital Allocation - Ginger Jones, SVP & CFO 11:05 - 11:25 Wrap up - Brad Hughes, President & Chief Executive Officer 11:25 - 11:30 Q&A 11:30 - 12:00 26
AGENDA

Overview and Outlook - Brad Hughes, President & Chief Executive Officer                        08:30 - 09:25
Driving Global Profitable Growth                                                               09:25 - 10:20
- Consumer Replacement - Chris Ball, SVP & President - North America
- Original Equipment - Glenn Arbaugh, Director, Global LV OE Strategy & Business Development
- Commercial Vehicle - Gary Schroeder, Director, Global Truck and Bus
Break                                                                                          10:20 - 10:35
Developing Capabilities to Win                                                                 10:35 - 11:05
- Product Design and Development - Chuck Yurkovich, SVP Global Research and Development
- Supply and Production Optimization - Jim Keller SVP, Head of Transformation
Financial Outlook and Capital Allocation - Ginger Jones, SVP & CFO                             11:05 - 11:25
Wrap up - Brad Hughes, President & Chief Executive Officer                                     11:25 - 11:30
Q&A                                                                                            11:30 - 12:00

27
CONSUMER
REPLACEMENT
CHRIS BALL, SVP & PRESIDENT - NORTH
AMERICA

28
1                            2                              3

We are driving growth
                               High value-added             Presence where                 Brand and digital
by focusing on                 product growth               consumers buy                  capabilities
consumers' needs,
                                                                                           Enhancing our digital
expanding channels,            Enhancing focus on           Maximizing the core
                                                                                           marketing capabilities
                               fast growing premium         distributor and national
and digital capabilities       product lines                retail channel                 Focusing marketing
                                                            business                       and consumer
                               Accelerating new
to communicate directly        product introduction         Broadening our retail
                                                                                           promotion dollars on
                               cadence                                                     digital
with consumers and to                                       channel penetration
                               Increasing consumer           • Mass merchants              Directing consumers
further reinforce our          involvement in product        • Auto dealers                to retailers where
                               development                   • e-Commerce                  Cooper is available
brand
                                    Increased strategic engagement with global OEMs expected
                                            to contribute across all growth opportunities
29
1 High value-added product growth
CONTINUED CONSUMER …EXHIBITED IN OUR PROACTIVE
TRANSITION TO LARGE RIM SIZES... SHIFT TOWARD HVA PRODUCTS
'17-'22 U.S. market forecast sales by rim size mix '17-'22 CTB U.S. forecast sales by rim size mix
Cooper branded product mix
already reflected 57% HVA
products in 2017
44%
56%
64% +20 64%
+8 ppts
ppts
56%
44%
36% 36%
2017 2022 2017 2022
Source: USTMA, IHS, Equity Research, Internal analysis
≥17"1 High value-added product growth
WE ARE ACCELERATING OUR PRODUCT INTRODUCTION CADENCE
TO INCREASE OUR SPEED TO MARKET
Accelerating our product introduction … creates a competitive advantage by further
cadence… enhancing our speed-to-market
Accelerating our product cadence
− Reducing product lifecycles AT3 development
− Launching 18 new products in next 24
months program was
accelerated,
Introducing a mid-cycle product enabling us to
refreshment come out with our
− Optimizing our compounds
new product line
one year ahead of
plans
Enabling fast and frequent product upgrades to
continue meeting consumers' evolving needs
311 High value-added product growth
WE RECEIVE HIGHLY REGARDED CONSUMER RATINGS
"Cooper tires are just "…Shocked how well these tires
outstanding!" performed, I consider these a best
buy"
"I love Coopers and for good
reason...they never disappoint"
"I am very pleased with this
"Yes, good product and good purchase and would recommend
price" to other owners as well"
"I will buy again for all my fleet" "If you're looking for a tire that
performs great in any conditions,
you cannot do better than the
"…I would buy tires from them Cooper CS5 Ultra Touring (or the
again for sure" CS5 Grand Touring) tires"
322 Presence across channels
U.S. DISTRIBUTION VALUE CHAIN IN REPLACEMENT TIRE MARKET
National Retailer
Manufacturer-Owned
Warehouse
Regional Retailer
National, Regional,
and Local distributors Independent Retailer
Manufacturer Consumer
Emerging
Two-step service model
Manufacturer-
Manufacturer-Owned Owned Retail
Direct service model
Distributor
Direct to Consumer
332 Presence across channels
WE ARE POSITIONING TO WIN IN FAST GROWING CHANNELS
U.S. replacement channel market share 2012 - 2023F (%) Our channel focus
2% 3% 5% Online
6% 8% Expansion
10% Auto Dealership
7% Focus
7%
6% Auto aftermarket
12% 11% Manufacturing
10%
owned retail
19%
23% Expansion
Mass
24% Focus
Merchandiser
18%
18%
19% National retailer
9%
8%
Core
7% Regional retailer
Channels
27%
23% Independent
19%
retailer
2012 2017 2023F
Increasing trend Decreasing trend
34 Source: Traqline, CTB Analysis2 Presence across channels
WE ARE TRANSFORMING OUR ORGANIZATION TO EMPHASIZE CHANNEL
CATEGORY, ACCOUNT MANAGEMENT AND DIGITAL CAPABILITIES
We have taken critical steps to revitalize our …and restructured our organization to
sales and marketing functions… enable deep channel focus
President North America
Adding highly capable talent Supply Chain
Distributor & Field Support
Continuing to add specialized talent
to capitalize on evolving business Direct Sales
needs Business
Pricing and Program mgmt.
• Direct retail Intelligence Group
• Category management Category Management
• Pricing Digital Consumer
• Digital consumer engagement Marketing Engagement
Team
35
New organization units2 Presence across channels
WE ARE FOCUSED ON BROADENING OUR RETAIL CHANNEL
PENETRATION IN THE FASTEST-GROWING CHANNELS
The restructuring
of our dedicated
category
management
Independent retailers Mass Merchants Auto Dealers e-Commerce function will
strengthen our
− Enhance partnership − Pursue partnerships − Leverage partnership − Increase products retail channel
and cooperation with with key retailers with AutoNation to available on leading
independent retailers − Partnered with increase channel e-Commerce
focus
for mutual gain XXXXXXXXXXX presence platforms
− Further enhance
penetration via global
OE participation
363 Brand and digital capabilities
WE HAVE A VERY STRONG BRAND, WITH THE HIGHEST CLOSE RATE
OF TOP BRANDS, WHEN CONSIDERED…
Our Net Promoter Score1 is higher than that Our consumer value proposition wins decisively against
of majority of other leading players our top competitors
35% CTB win rate
vs. competition
27%
21%
69%
1
2
3 66%
Copyright © 2017 by The Boston Consulting Group, Inc. All rights reserved.
65%
4 17% 7 12%
5 15% 8 9% 62%
6 13% 9 4%
56%
10 0%
1. Represents % of respondents currently utilizing the brand who would recommend the brand to a friend or family member (n = 3,353); Calculated as % promoters (>9/10) less %
detractors (3 Brand and digital capabilities
CONSUMERS INCREASINGLY USE WE ARE TURNING DIGITAL INTO
DIGITAL PLATFORMS TO RESEARCH ONE OF OUR CORE ADVANTAGES
AND BUY TIRES
Around 73% of buyers research tires online
before purchasing 1 We are building our internal
digital team
41% Tire store websites
2 We are developing tighter
digital partnerships and the
30% Tire manufacturing websites
right content
29% Online customer reviews
24% Online consumer reports
Establishing direct communication with
Roughly 50% of consumers have chosen a brand consumers to support their purchase
before going to a store journey
Source: Cooper Consumer Research 2017; Compete/Google Auto Tires Purchase Study,
38 September 2013Consumer Replacement
We are implementing strategic initiatives globally to ensure we continue to
win
− Focusing on driving our high-value added product growth and on
consumer needs
− Accelerating our new product introduction cadence
We are focusing on increased presence across key channels, including
attractive, fast-growing channels
− Capitalizing on recent disruption in industry distribution
− Focusing on channels in which consumers increasingly shop for tires
− Emphasis on independent retailer, mass merchant, auto dealer and
e-commerce channels
KEY We are turning digital into a source of competitive advantage and further
TAKEAWAYS strengthening our direct communication channel with consumers and our
brand
39AGENDA Overview and Outlook - Brad Hughes, President & Chief Executive Officer 08:30 - 09:25 Driving Global Profitable Growth 09:25 - 10:20 - Consumer Replacement - Chris Ball, SVP & President - North America - Original Equipment - Glenn Arbaugh, Director, Global LV OE Strategy & Business Development - Commercial Vehicle - Gary Schroeder, Director, Global Truck and Bus Break 10:20 - 10:35 Developing Capabilities to Win 10:35 - 11:05 - Product Design and Development - Chuck Yurkovich, SVP Global Research and Development - Supply and Production Optimization - Jim Keller SVP, Head of Transformation Financial Outlook and Capital Allocation - Ginger Jones, SVP & CFO 11:05 - 11:25 Wrap up - Brad Hughes, President & Chief Executive Officer 11:25 - 11:30 Q&A 11:30 - 12:00 40
ORIGINAL EQUIPMENT
Glenn Arbaugh, Director, Global LV OE Strategy & Business
Development

41
PHASE 1: WIN OE IN CHINA                                 PHASE 2: LEVERAGE CHINA CAPABILITIES
                                                         TO PENETRATE GLOBAL OE

OE-focused strategy to generate                             OE targeted position to enhance our core
replacement pull-through                                    replacement market
• China passenger car market majority OE as car              • 2-3 global OE partners
  parc rapidly grows                                         • Representing no more than 10% of our total capacity
• Consumers newer to vehicle ownership tend to
  buy OE to replace (not as familiar with tire brands)
• OE business currently comprises the majority of
  our business in China

                         China

 42
WE HAVE HAD SIGNIFICANT OE SUCCESS IN CHINA
Partnering with major OEMs … resulting in increasing volumes and vehicle platforms
2015 - 2016 2017
CTB OE volume growth in China
94%
2015 2016 2017
Number of
vehicle 20 38 47
platforms
43OUR KEY SUCCESS FACTORS INCLUDE RESPONSIVENESS, CAPABILITIES,
SUV FOCUS AND THE RIGHT PARTNERS
We have dedicated OE teams in sales, technical and project management,
enabling us to create value and respond quickly
We have improved production capacity, capability and efficiency - we have great
product quality and have an ability to commit to OE volume needs
We are focused on the fastest growing OE segment - SUV projected annual
growth in China at ~5.3%1
We choose the right partners - we had fitments on 5 of the top 10 selling SUVs
in China in 2017
1. 2017-2023 CAGR
44 Source: LMC; December 2016WE EXPECT TO CONTINUE OUR GROWTH IN CHINA, AS
WELL AS TO INCREASE OUR ACCOUNT BASE
Expected CTB OE volume mix growth in China
Expected OE volumes Our brand
include committed volumes
previously secured perception, our
competitive
advantage in
quality, design and
service, and our
technology
leadership position
us to keep winning
in OE in China
2018 2019 2020 2021 2022 2023
Others Premium JV Common JV Domestic Premium
45WE ARE WELL-POSITIONED TO TRANSLATE OUR OE PRESENCE TO
PROFITABLY GROW OUR REPLACEMENT BUSINESS
China tire replacement market projected to grow significantly We are focused on enhancing our
in next 6 years, presenting an opportunity for OE tire business to capture profitable growth in
providers OE and RE
Projected growth of China tire volume (millions of tires/year) '18-'23 CAGR Enhancing our brand
awareness to capture first
501
480 replacement purchase
454
427
378 395 174 OE ~3.0%
358 163 169 Enhancing our channel
161
150 153 capabilities with emphasis on
150 direct sales, key accounts and
e-Commerce
291 311 327 RE ~7.5%
228 242 266
208 Developing the right capabilities
to support our growing
replacement business
2017
2018E
2019E
2020E
2021E
2022E
2023E
46 Source: LMC World Tyre Forecast, Q1 2018 ReportOUR EXPERIENCE AND CAPABILITIES IN CHINA, POSITION US TO
PENETRATE THE GLOBAL OE SEGMENT
We have already
established a
partnership with
Volkswagen and
recently finalized
a collaboration
Global and U.S. Enhanced Ability to Nimble and with a premium
Production Technical focus and agile European OEM
Footprint capabilities collaborate
47WE ARE STRATEGIC IN SELECTING OUR OE
PARTNERS, FOCUSING ON ENHANCING OUR
CORE
Increase our brand
equity and awareness
Provide replacement
pull through
Placing us at the
forefront of innovative
Prioritize partnership Keeping replacement technologies
with 2-3 global OEMs as our core
• Premium brands • Retain focus on Facilitate our
• Growing unit volumes aftermarket
steadily over time • Keeping global OE
expansion in the car
• Scale opportunities business to no more dealership channel
than 10% of our
capacity
48Original Equipment
We have a two phased OE strategy focused on enhancing our core
strengths
− China: Penetrate regional OE and additionally drive replacement
pull-through
− Global: Target select global OEMs to strengthen core aftermarket
position
We have achieved significant success in building our China OE business
− Expect to maintain fast growth trend in OE
− Well positioned to leverage OE position to secure replacement
business in China
We are well positioned to increase our engagement with global OEMs
KEY − Established a partnership with Volkswagen and finalized
collaboration with a premium European OEM
TAKEAWAYS We strategically select OE partners around the globe and remain laser-
focused on strengthening our position in our core aftermarket business
49AGENDA Overview and Outlook - Brad Hughes, President & Chief Executive Officer 08:30 - 09:25 Driving Global Profitable Growth 09:25 - 10:20 - Consumer Replacement - Chris Ball, SVP & President - North America - Original Equipment - Glenn Arbaugh, Director, Global LV OE Strategy & Business Development - Commercial Vehicle - Gary Schroeder, Director, Global Truck and Bus Break 10:20 - 10:35 Developing Capabilities to Win 10:35 - 11:05 - Product Design and Development - Chuck Yurkovich, SVP Global Research and Development - Supply and Production Optimization - Jim Keller SVP, Head of Transformation Financial Outlook and Capital Allocation - Ginger Jones, SVP & CFO 11:05 - 11:25 Wrap up - Brad Hughes, President & Chief Executive Officer 11:25 - 11:30 Q&A 11:30 - 12:00 50
COMMERCIAL VEHICLE
GARY SCHROEDER, DIRECTOR, GLOBAL TRUCK AND BUS

51
OUR AWARD-WINNING TBR BUSINESS IS GROWING RAPIDLY,
OUTPACING MARKET GROWTH SEVENFOLD

                                            CTB U.S. TBR YoY Vol. growth (%)

       Winner of Pinnacle Supplier (2012)                                +21%
       - the most prestigious award given
       to any supplier
       Wabash three-time Platinum
       Supplier (2013, 2016, 2017)

                                               2013       2014       2015      2016   2017   2018E

                                            – Substantial and consistent growth (over 7
       Construction Week Top 100              times market long-term growth rate)
       Product Award Winner (2017) with
       Roadmaster RM332 Launch              – Our TBR margins are higher than those of our
                                              PCR/LT products

52
OUR FOCUS MARKET, THE U.S., IS PREDICTED TO CONTINUE ROBUST
GROWTH
TBR U.S. market volume (millions of tires)
+3% '18E-'23E CAGR
29.5
28.2 28.7
27.4 27.8 28.0
26.1 25.7
27.2
Recent growth in
25.0
6.2 5.8 6.2 6.6 OE ~2.3%
22.9 22.6 22.3 6.4 5.4
5.9 5.9 6.1
OE is straining Tier
20.5 5.8
4.9 5.2 5.0 1 capacity, creating
3.3
strong tailwinds for
launching our
20.4 21.3 21.5 21.7 22.0 22.3 22.6 22.9 RE ~1.3% Cooper brand TBR
19.1 19.7
17.2 18.0 17.4 17.3
2010
2011
2012
2013
2014
2015
2016
2017
2018E
2019E
2020E
2021E
2022E
2023E
53 Source: LMC World Tyre Forecast, Q1 2018 ReportRECENTLY LAUNCHED COOPER® BRAND TBR, WIDENING THE TBR
MARKET SEGMENTS WE SERVE
Roadmaster - High quality with a great Cooper Brand TBR - Lowering overall
®
price point tire program costs for fleets
• Focused mainly on owner-operators and trailer • Focused mainly on truck fleet segments
manufacturers • Focus on commercial "servicing dealer" distribution
• Key wholesalers as distribution channel as key distribution channel
• High value product expected to increase OE share
• PRO Series™ for long-haul, balance between fuel efficiency and long
miles to removal
• WORK Series™ for regional-haul, pick-up and delivery, balance fuel
efficiency and tread life with scrub-resistant properties
• SEVERE Series™ for mixed service, emphasis on withstanding heavy
scrub and cut/chip environments
54STRONG PLAN TO CONTINUE RAPID TBR GROWTH, AND REACH
LARGER SCALE TO DRIVE FURTHER MARGIN ACCRETION
Launching of new high-value Cooper-branded truck and bus tires
aimed at fleet and OE market
Engaging with many of the top 30 commercial servicing
dealerships in North America to distribute our products through We are fully
over 600 locations
committed to further
Creating value via our Fleet Service National Account Program enhancing our TBR
and making sure our consumers are operational around the clock
business to become a
growing contributor
Recently secured additional high-quality supply sources with GRT
JV and Sailun Vietnam offtake, providing sourcing diversification
for Cooper
Anticipating strong reception of TBR products globally
• Currently being sold in North America, Asia and Latin America
55Commercial Vehicle
We have been successful in developing our TBR business
– Consistently outperforming the U.S. TBR market since 2013 (over
7 times market long-term growth rate)
– Higher margins than our PCR/LT margins
Our TBR business is poised for continued success, spearheaded by:
– Stable growth in key U.S. market
– Tier 1 TBR capacity increasingly directed toward OE
– Anticipated strong reception of TBR products globally
KEY We continue to enhance our TBR product portfolio by launching our
Cooper® Brand
TAKEAWAYS TBR is of strategic importance and we have a robust plan for continuing
growth
56AGENDA Overview and Outlook - Brad Hughes, President & Chief Executive Officer 08:30 - 09:25 Driving Global Profitable Growth 09:25 - 10:20 - Consumer Replacement - Chris Ball, SVP & President - North America - Original Equipment - Glenn Arbaugh, Director, Global LV OE Strategy & Business Development - Commercial Vehicle - Gary Schroeder, Director, Global Truck and Bus Break 10:20 - 10:35 Developing Capabilities to Win 10:35 - 11:05 - Product Design and Development - Chuck Yurkovich, SVP Global Research and Development - Supply and Production Optimization - Jim Keller SVP, Head of Transformation Financial Outlook and Capital Allocation - Ginger Jones, SVP & CFO 11:05 - 11:25 Wrap up - Brad Hughes, President & Chief Executive Officer 11:25 - 11:30 Q&A 11:30 - 12:00 57
AGENDA

Overview and Outlook - Brad Hughes, President & Chief Executive Officer                        08:30 - 09:25
Driving Global Profitable Growth                                                               09:25 - 10:20
- Consumer Replacement - Chris Ball, SVP & President - North America
- Original Equipment - Glenn Arbaugh, Director, Global LV OE Strategy & Business Development
- Commercial Vehicle - Gary Schroeder, Director, Global Truck and Bus
Break                                                                                          10:20 - 10:35
Developing Capabilities to Win                                                                 10:35 - 11:05
- Product Design and Development - Chuck Yurkovich, SVP Global Research and Development
- Supply and Production Optimization - Jim Keller SVP, Head of Transformation
Financial Outlook and Capital Allocation - Ginger Jones, SVP & CFO                             11:05 - 11:25
Wrap up - Brad Hughes, President & Chief Executive Officer                                     11:25 - 11:30
Q&A                                                                                            11:30 - 12:00

58
DEVELOPING
CAPABILITIES TO WIN
CHUCK YURKOVICH, SVP GLOBAL RESEARCH AND DEVELOPMENT
JIM KELLER SVP, HEAD OF TRANSFORMATION

59
WE ARE DEVELOPING THE PRODUCTS CONSUMERS AND CUSTOMERS
WANT THROUGH ELEVATED DESIGN AND PRODUCTION CAPABILITIES

                                          • Consumer led development process
      Performance                         • Enhanced global and regional R&D capabilities
                           Product        • Strategic participation in OE to stay on the
      and features                          cutting edge of technology
                           Development    • Continuous leverage of our global platforms
                           and Design     • Optimization of product weight, construction and
                                            materials
       High Quality                       • Future looking product portfolio development
      and reliability

                                          • Best in class Cooper Production System
                           Production
      Competitive                         • Enhancement of our production capabilities
                           Optimization   • Production footprint optimization
        pricing

60
WE ARE FURTHER FOCUSING ON CONSUMER NEEDS AND
INCREASING CONSUMER INVOLVEMENT IN PRODUCT DEVELOPMENT
7 1 • Attribute Importance
• Right Place
• Purchase Criteria
• Right Price
• Value Differentiation
• Right Product
Consumer
Product
Qualitative
Launch
Research
6 2
• Consumer Messaging • Product Attributes
• Emotional connections Consumer Concept • Performance Specs
• Purchase Drivers • Product Positioning
Validation Development
Quantitative
Product concept
• Consumer Preference
Testing testing • Product Positioning
• Validate Performance • Purchase Drivers
• Competitive Set 5 3
• Consumer Drivers
Product Prototyping
• Design options to meet the consumer driven charter
4
• Cost / Position evaluation
61OUR GLOBAL AND REGIONAL TECH CENTERS DELIVER GLOBAL
SCALE WITH CUSTOMIZED LOCAL RESPONSIVENESS
Global Technical Center
Global Technical Center, European Technical
North America Technical Center Centre - Center of Excellence
Tall Timbers Mold Facility Melksham, UK
Findlay, OH
- Tire applications and materials research
- Development of global platforms and
ongoing improvements
- Development of OE technologies
- Knowledge management
- Development of global tools, technologies
Asia Technical Center
Kunshan, China - Focus on future product portfolio and
global innovation
Cooper Tire &
Vehicle Test
Center Regional Technical Centers
Pearsall, Texas
- Development in each region for that region
- Leverage of global platforms for local
requirements
- Leverage market proximity to ensure fit
with regional requirements
62WE ARE CONTINUING TO LEVERAGE OUR GLOBAL PLATFORMS TO
DRIVE OUR SPEED TO MARKET AND PRODUCTIVITY
• Twelve global
platforms form the
core of our products,
driving increased
efficiency, R&D
productivity and
speed to market Reduced time to Increased productivity
• Number of non-global market of our R&D
platforms reduced by
50% in last four years Time to market R&D productivity
reduced by up to 30% increased by up to 17%
63 Source: CTB analysisCONTINUOUSLY OPTIMIZING PRODUCT WEIGHT, CONSTRUCTION AND
MATERIALS TO MAXIMIZE PERFORMANCE AND COST
CASE STUDY: CS5
Since launching our CS5 in 2015, we have
increased performance, while reducing
16% 19%
improvement in increase in
cost and weight rolling resistance mileage
between '15-'18 between '15-'18
Increased performance enabled us to
increase our mileage warranty in 2017
24% 10%
reduction in
improvement in
product cost and
handling between
weight between
'15-'18*
'15-'18
64 * Professional driver rating based on multiple handling parameters
Source: Cooper testing and analysisWE ARE DEVELOPING OUR FUTURE PRODUCT PIPELINE, LEVERAGING
OUR ENHANCED CAPABILITIES TO ADDRESS CHANGING REQUIREMENTS…
An evolving technology focus
Vehicle innovations Today Tomorrow
are increasingly Extended mobility
driving change in
Low rolling resistance
tire requirements Tire
and technology technology RFID technology
OE participation Noise suppression
gives early insight
Electric vehicles
into these
Vehicle Smart (connected) vehicles
requirements technology
Autonomous vehicles
65WE ARE ALSO INVESTING IN NEW CAPABILITIES TO DEVELOP
PRODUCTS FASTER AND WITH BETTER PERFORMANCE
Finite Element FlatTrac Instrumented Test Driver
Analysis Tire Response Measurement Assessment
Force & Objective Subjective
Tire Design
Moment Handling Handling
We are using advanced predictive testing in the earlier tire
design stages, reducing development by up to 6 months
66OUR COOPER PRODUCTION SYSTEM ENABLES US TO MAINTAIN BEST
IN CLASS PRODUCTION STANDARDS ACROSS OUR FOOTPRINT
Improving Enhancing Growing Reducing
safety process capability productivity cost
Reduced global Reduced process Delivered ~9% Improved first-pass
recordable incidents by variability on key improvement in yields and lowered
~48% since 2015 processes by up to manufacturing labor scrap costs ~12%
50% since 2015 productivity since 2015 since 2015
Note: Productivity defined as global improvement in units built per man-hour 2015 Actual vs. 2017 Actual
67 Source: Cooper analysisWE HAVE IMPROVED OUR CAPABILITIES BY INTRODUCING ADVANCED MANUFACTURING TECHNOLOGIES INTO OUR FACILITIES Advanced Mixing & Smart Quad/Quintplex Automated Tire Automated Storage & Controls System Extrusion Lines Building Machines Retrieval System 68
WE ARE CONSTANTLY IMPROVING OUR PRODUCTION CAPABILITIES
EXAMPLE

 We are expanding our global OE-ready footprint to enhance our ability
 to partner with global OEMs and maintain a competitive cost structure
                                                                                                                                   • Enhancing and improving
                                                                                                                                     process capability

                                                                                                                                   • Improving tire
                                                                2020                                                                 uniformity/yield %
                          2018                                                                2017
                                                                                                                                   • Investing in new
                                                                                                          2012                       equipment and technology

                                                                                                                                   • Driving enhanced sub-
                                                                                                                                     supplier management

69
     Note: Our OE-ready facility which came online in 2017 produces TBR tires only, other facilities produce light vehicle tires
WE ARE FOCUSING ON HAVING THE RIGHT PRODUCTION CAPACITY, WITH THE RIGHT CAPABILITIES, IN THE RIGHT PLACES We are focused on optimizing our global production capacity - Required technology/ capabilities... - …with top quality… - ...with a competitive cost structure... - ..delivering speed, market access, and flexibility Asia footprint Review of Europe Americas footprint - … with right capacity review completed footprint well review recently levels in right locations... underway initiated 70
Developing Capabilities to Win
            To continue winning with our products, we are focusing on developing
            our internal capabilities required to develop the right products, while
            maintaining top quality and enhancing our cost structure
              - Increasing consumer input in product development
              - Enhancing our global and regional capabilities
              - Leveraging our global platforms in product design and reducing
                  product weight, while increasing performance
              - Developing our future product portfolio
              - Improving technology capabilities, including by increased OE
                  participation

            We are further investing to enable our manufacturing to produce the right

KEY         products, maintain the highest quality and improve our cost structure
              - Investing in technology and advanced capabilities
              - Optimizing our production footprint to have highly capable capacity
TAKEAWAYS        in the right places

71
AGENDA Overview and Outlook - Brad Hughes, President & Chief Executive Officer 08:30 - 09:25 Driving Global Profitable Growth 09:25 - 10:20 - Consumer Replacement - Chris Ball, SVP & President - North America - Original Equipment - Glenn Arbaugh, Director, Global LV OE Strategy & Business Development - Commercial Vehicle - Gary Schroeder, Director, Global Truck and Bus Break 10:20 - 10:35 Developing Capabilities to Win 10:35 - 11:05 - Product Design and Development - Chuck Yurkovich, SVP Global Research and Development - Supply and Production Optimization - Jim Keller SVP, Head of Transformation Financial Outlook and Capital Allocation - Ginger Jones, SVP & CFO 11:05 - 11:25 Wrap up - Brad Hughes, President & Chief Executive Officer 11:25 - 11:30 Q&A 11:30 - 12:00 72
FINANCIAL OUTLOOK AND
CAPITAL ALLOCATION
Ginger Jones, SVP & CFO

73
NEAR-TERM OUTLOOK REFLECTS RECENT HEADWINDS AND
INVESTMENTS, BUT POSITIVE OUTLOOK IN SECOND HALF OF 2018
                                                             2018
                    2015 - 2016        2017          Rebuilding our business
                    Strong industry    Market
                     performance      headwinds
                                                    H1                    H2

 Unit volume                                          Positive unit
   growth
                        ~5%           ~(0.5%)
                                                     volume growth

                                                  Similar         Approaching
 OP margins
                       ~13%           ~10%                        stated 9-11%
 (annual average)                                  to Q1
                                                                 near-term target

     ROIC
 (annual average)
                       ~18%           ~12%

74
OUR STRATEGY WILL TRANSLATE INTO POSITIVE FINANCIAL OUTLOOK
IN THE MID-TERM
Mid-term
targets
Consumers' needs, preferences and (5 year)
expectations
Annual unit
Low to mid
Great volume
products Commercial
growth in growth single digits
profitable
segments
OP margins 10-14%
Great Great
service value
Optimizing our Capability
production enhancement
ROIC 14-16%
751 Supporting our ongoing commitments
We continue to
2 Supporting high return organic growth and margin
allocate capital improvement projects
according to
3 Allocating capital for strategic acquisition
our clear opportunities and partnerships, as they arise
priority 4 Maintaining strong balance sheet including
guidelines pension funding
5 Returning capital to shareholders
76OUR PRIORITIES ARE REFLECTED IN OUR CAPITAL ALLOCATION
CTB actual capital allocation, 2013-2017 ($M)
393
371 23
26
316 310
24 108
22
200 109 91
207 87
27
180 183 175 197
145
2013 2014 2015 2016 2017
Dividends Share Repurchases M&A1 CapEx
77 1. M&A includes acquisition costs and initial investments in GRTBUILDING ON THE STRONG CAPITAL … AND SHAREHOLDER
ALLOCATION DISCIPLINE… DISTRIBUTIONS
Reinvestment Payouts
~$1B ~15% >$120M >$500M
reinvested in the avg. ROIC over in share
in dividends over
business over the past 5 years repurchases over
the past 5 years
the past the past 5 years
5 years1
Focused on high ROI Continue attractive
projects cash returns
78 1. Includes $880M reinvestments in CapEx and $87M in M&ATHE ROAD AHEAD: SELECTED MILESTONES TO WATCH FOR
Shorter-term milestones (2018/ early 19) Mid-/longer-term milestones (2019+)
New, highly attractive product launches (including Sustainable volume and sales growth in core
AT3) replacement market
– More frequent product refreshes/launches
Performance of Cooper-branded TBR products – Expansion in growing channels
launched May 1 – Consumer driven approach
Initial OE fitments in North America Expansion of growth businesses in Asia, OE, and
TBR segments
Continued improvement of operating margins from − Operating margin from international business
international business growing toward the low end of consolidated
targets
Stringent cost and cash management (including
significant working capital improvements) Focused investments and evolution of our
production footprint
79Financial Outlook and Capital Allocation
We expect 2018 to be a turning point for our performance
− 2017 and H1 2018 affected by significant market headwinds
− Market environment expected to stabilize going forward
Our key strategic initiatives will translate into tangible financial targets
mid-term
− Above-market growth (low-mid single digits) at attractive margins
(between 10-14% operating profit)
− Attractive returns on invested capital (14-16%)
We will continue our tradition of deliberate capital allocation, pursuing
our shareholders' best interests
− Selectively reinvesting in further strengthening our business
KEY − Supporting our dividend and evaluating our payout policy
TAKEAWAYS
80AGENDA Overview and Outlook - Brad Hughes, President & Chief Executive Officer 08:30 - 09:25 Driving Global Profitable Growth 09:25 - 10:20 - Consumer Replacement - Chris Ball, SVP & President - North America - Original Equipment - Glenn Arbaugh, Director, Global LV OE Strategy & Business Development - Commercial Vehicle - Gary Schroeder, Director, Global Truck and Bus Break 10:20 - 10:35 Developing Capabilities to Win 10:35 - 11:05 - Product Design and Development - Chuck Yurkovich, SVP Global Research and Development - Supply and Production Optimization - Jim Keller SVP, Head of Transformation Financial Outlook and Capital Allocation - Ginger Jones, SVP & CFO 11:05 - 11:25 Wrap up - Brad Hughes, President & Chief Executive Officer 11:25 - 11:30 Q&A 11:30 - 12:00 81
WRAP-UP
BRAD HUGHES, PRESIDENT & CHIEF EXECUTIVE OFFICER

82
WE ARE CONFIDENT THAT OUR STRATEGY WILL TRANSLATE INTO
 TANGIBLE FINANCIAL BENEFITS IN THE MID-TERM

                                                                                                                             Mid-term
                                                                                                                              targets
                                                                                               Top-line                       (5 year)
                                                                                               growth
                                                                   Cost                      opportunities
                                                                 structure                                            Annual Unit      Low to mid
                                                                                                                      Volume Growth   single digits
                                                               enhancement
                                    Market                                                                            OP Margin         ~10-14%
                                                                                        • Product mix shift to HVA
                                    effects                                             • Faster introduction of
                                                                                          Consumer driven             ROIC              ~14-16%
            2017                                          • Restored operating
                                                                                          products
                                                            leverage via volume
                                                                                        • Replacement channel
                                                            growth
                                                                                          expansion
                            • Steady state sell-out       • Reduction of fixed and
                                                                                        • Strategic engagement
                              demand growth                 variable costs through
                                                                                          with OEMs
                            • Return to normalized          optimization of footprint
                                                                                        • Wider TBR distribution
Volume Growth      (0.5)%     industry promotion levels   • Margin enhancement via
                                                                                          and broader brand
                                                            improved design and
                                                                                          offering
                                                            production capabilities
OP Margin          9.5%                                                                 • Capitalizing on growth in
                                                            while delivering top
                                                                                          fast growing markets and
                                                            performance and quality
                                                                                          advantaged LT/SUV
ROIC               12.2%
 83
                                                                                          profile
      83
WHY INVEST IN CTB?
Strong company with Attractive Shareholder-
capabilities to win opportunities for friendly capital
profitable growth allocation
Strong foundation and value Uniquely positioned in changing US History of attractive cash
proposition offering great products, distribution landscape returns
great value, and great service • Distributed dividends
Enhancing go-to-market capabilities consecutively since
Strong portfolio with several with new digital capabilities 1973
imminent product launches in
International exposure to fast • Over $600M in
motion
growing markets dividends and share
Technological capabilities at buy-backs over last 5
forefront of industry OE capabilities in China and North years
America to drive new volume growth
A brand that is preferred over Opportunities to invest in
and further enhance brand
competition superior ROI projects as
Globally flexible supply base Continuous improvement of cost we drive next phase of
base through technology integration growth
Cost-effective manufacturing and footprint optimization
84AGENDA Overview and Outlook - Brad Hughes, President & Chief Executive Officer 08:30 - 09:25 Driving Global Profitable Growth 09:25 - 10:20 - Consumer Replacement - Chris Ball, SVP & President - North America - Original Equipment - Glenn Arbaugh, Director, Global LV OE Strategy & Business Development - Commercial Vehicle - Gary Schroeder, Director, Global Truck and Bus Break 10:20 - 10:35 Developing Capabilities to Win 10:35 - 11:05 - Product Design and Development - Chuck Yurkovich, SVP Global Research and Development - Supply and Production Optimization - Jim Keller SVP, Head of Transformation Financial Outlook and Capital Allocation - Ginger Jones, SVP & CFO 11:05 - 11:25 Wrap up - Brad Hughes, President & Chief Executive Officer 11:25 - 11:30 Q&A 11:30 - 12:00 85
NON-GAAP MEASURES

 Non-GAAP financial measures should be considered in addition to, not as a substitute for, other financial
 measures prepared in accordance with generally accepted accounting principles (“GAAP”). The
 company’s methods of determining these non-GAAP financial measures may differ from the methods used
 by other companies for these or similar non-GAAP financial measures. Accordingly, these non-GAAP
 financial measures may not be comparable to measures used by other companies. Investors are advised
 to carefully review and consider this information as well as the GAAP financial results that are disclosed in
 the company’s earnings releases and annual and quarterly SEC filings.

86
RETURN ON INVESTED CAPITAL (ROIC)
      Management is using non-GAAP financial measures in this document because it considers them to be important supplemental measures of the company’s
      performance. Management also believes that these non-GAAP financial measures provide additional insight for analysts and investors in evaluating the company’s
      financial and operating performance.

      The company defines ROIC as the trailing four quarters’ after tax operating profit, utilizing the company's adjusted effective tax rate, excluding discrete Q4 2017 income
      tax items affecting comparability of results from period to period, divided by the total invested capital, which is the average of ending debt and equity for the last five
      quarters. The company believes ROIC is a useful measure of how effectively the company uses capital to generate profits.

     (Amounts in thousands)

     RETURN ON INVESTED CAPITAL (ROIC)

                                    Adjusted
                                    (non-GAAP)                    Adjusted                           Income tax                                   ROIC,
                                    provision for Income before   (non-GAAP)                         expense on   Operating                       including
                                    income taxes income taxes     effective tax                      operating    profit after   Total invested   noncontrolling
                                    (c)           (d)             rate (c)/(d)    Operating profit   profit       taxes (a)      capital (b)      equity (a)/(b)

      December 31, 2017             $ 79,146      $ 243,925       32%             $ 271,724          $ 88,166     $ 183,558      $ 1,508,397 12%                   15% 2013-2017 5 yr Average

      December 31, 2016             115,799      367,093          32%             384,387            121,254      263,133        1,386,514        19%              18% 2015-2016 2 yr Average

      December 31, 2015             118,224      334,028          35%             354,480            125,463      229,017        1,272,227        18%

      December 31, 2014             111,697      348,519          32%             300,458            96,294       204,164        1,421,334        14%

      December 31, 2013             79,406       212,971          37%             240,714            89,750       150,964        1,392,256        11%

      December 31, 2012             116,024      368,450          31%             396,962            125,002      271,960        1,238,007        22%

87
CALCULATION OF INVESTED CAPITAL (FIVE QUARTER AVERAGE)
(Amounts in thousands) Current portion of long-term
Equity Long-term debt debt Notes payable Total invested capital
March 31, 2018 $ 1,204,026 $ 295,221 $ 1,446 $ 41,043 $ 1,541,736
December 31, 2017 1,185,756 295,987 1,413 39,450 1,522,606
September 30, 2017 1,232,225 296,084 1,464 36,056 1,565,829
June 30, 2017 1,192,922 296,179 1,514 38,374 1,528,989
March 31, 2017 1,156,063 296,516 1,370 14,581 1,468,530
December 31, 2016 1,130,236 297,094 2,421 26,286 1,456,037
September 30, 2016 1,096,740 295,874 600 12,222 1,405,436
June 30, 2016 1,085,373 295,853 600 3,716 1,385,542
March 31, 2016 1,054,320 295,837 600 7,737 1,358,494
December 31, 2015 1,017,611 296,412 600 12,437 1,327,060
September 30, 2015 964,724 297,320 600 17,646 1,280,290
June 30, 2015 946,615 297,547 1,791 15,049 1,261,002
March 31, 2015 927,120 297,923 2,064 15,815 1,242,922
December 31, 2014 884,261 298,931 2,115 64,551 1,249,858
September 30, 2014 935,323 325,538 15,559 184,553 1,460,973
June 30, 2014 1,088,476 326,188 15,671 24,478 1,454,813
March 31, 2014 1,050,295 327,755 19,419 25,001 1,422,470
December 31, 2013 1,157,625 320,959 17,868 22,105 1,518,557
September 30, 2013 1,027,472 326,414 17,917 26,526 1,398,329
June 30, 2013 1,015,428 326,877 21,245 47,684 1,411,234
March 31, 2013 967,598 334,798 16,791 34,257 1,353,444
December 31, 2012 908,416 336,142 2,319 32,836 1,279,713
September 30, 2012 877,601 336,631 2,336 47,688 1,264,256
June 30, 2012 786,014 337,081 6,608 118,940 1,248,643
March 31, 2012 730,194 334,810 11,367 140,816 1,217,187
December 31, 2011 697,890 329,496 21,199 131,651 1,180,236
Five quarter average - 2017 1,179,440 296,372 1,636 30,949 1,508,397
Five quarter average - 2016 1,076,856 296,214 964 12,480 1,386,514
Five quarter average - 2015 948,066 297,627 1,434 25,100 1,272,227
Five quarter average - 2014 1,023,196 319,874 14,126 64,138 1,421,334
Five quarter average - 2013 1,015,308 329,038 15,228 32,682 1,392,256
Five quarter average - 2012 800,023 334,832 8,766 94,386 1,238,007
88You can also read