Delineation of Contributing Areas to Selected Public-Supply Wells, Western Cape Cod, Massachusetts
←
→
Page content transcription
If your browser does not render page correctly, please read the page content below
science for a changing world

Prepared in cooperation with the
AIR FORCE CENTER FOR ENVIRONMENTAL EXCELLENCE

Delineation of Contributing Areas
to Selected Public-Supply Wells,
Western Cape Cod, Massachusetts
Water-Resources Investigations Report 98-4237

U.S. Department of the Interior
U.S. Geological Survey
U.S. Department of the Interior
U.S. Geological Survey

Delineation of Contributing Areas to Selected
Public-Supply Wells, Western Cape Cod,
Massachusetts
By JOHN P. MASTERSON, DONALD A. WALTER, and DENIS R. LEBLANC

Water-Resources Investigations Report 98-4237

Prepared in cooperation with the
AIR FORCE CENTER FOR ENVIRONMENTAL EXCELLENCE

Marlborough, Massachusetts
1998
U.S. DEPARTMENT OF THE INTERIOR
BRUCE BABBITT, Secretary

U.S. GEOLOGICAL SURVEY
Charles G. Groat, Director

For additional information write to:         Copies of this report can be purchased from:

Chief, Massachusetts-Rhode Island District   U.S. Geological Survey
U.S. Geological Survey                       Information Services
Water Resources Division                     Box 25286
28 Lord Road, Suite 280                      Denver, CO 80225-0286
Marlborough, MA 01752
CONTENTS
Abstract..............................................................................................................._ 1
Introduction............................................................................._ 1
Hydrogeology....................................................................................................................................................^ 3
Geologic Setting...........................................................................................................^ 3
Hydrologic System...................................................................................................................................................... 4
Simulation of Ground-Water Flow in Western Cape Cod..................................................................................................... 4
Modifications to Original Flow Model........................................................................................................................ 5
Boundary Conditions......................................................................................................................................... 5
Stresses.......................................................................................................................................................^ 5
Hydraulic Conductivity..................................................................................................................................... 9
Model Calibration....................................................................................................................................................... 9
Simulation of Current and Future Pumping and Recharge Conditions....................................................................... 12
Delineation of Contributing Areas to Selected Public-Supply Wells on Western Cape Cod, Massachusetts....................... 16
Method of Analysis ..................................................................................................................................................... 18
Contributing Areas for Current and Proposed Pumping and Recharge Conditions.................................................... 20
Response of Contributing Areas to Selected System Variables................................................................................... 24
Effects of Well Locations.................................................................................................................................. 24
Effects of Pumping Rates.................................................................................................................................. 28
Effects of Surface-Water Bodies ....................................................................................................................... 29
Effects of Simultaneous Changes in Aquifer Recharge and Hydraulic Conductivity....................................... 36
Limitations of Analysis ......................................................................................................................................................... 38
Summary and Conclusions.................................................................................................................................................... 38
References Cited ................................................................................. 39
FIGURES
1-4. Maps showing:
1. Location of Massachusetts Military Reservation and surrounding communities and water-table
configuration on March 23-25, 1993, western Cape Cod, Massachusetts..................................................... 2
2. Model grid and distribution of boundary conditions of flow model of western Cape Cod ........................... 6
3. Location of existing and proposed public-supply well sites and contaminant plumes from the
Massachusetts Military Reservation, western Cape Cod................................................................................ 8
4. Change in model-calculated altitude of the water table from current (1994-96) to future (2020) stress
conditions, western Cape Cod......................................................................................................................... 15
5. Diagram showing the area contributing recharge to a pumping well in a simplified hypothetical
ground-water system............................................................................................................................................... 17
6-12. Maps showing:
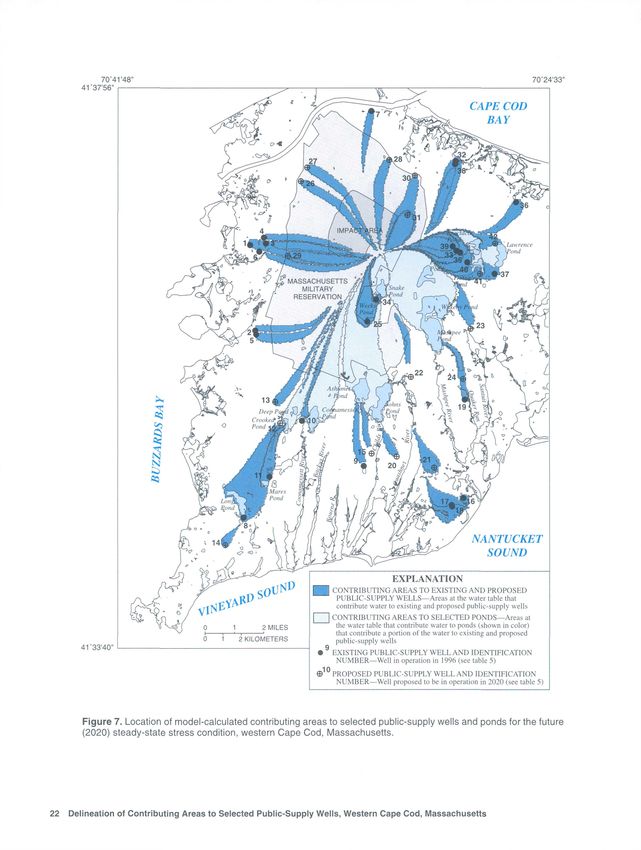
6. Location of model-calculated contributing areas to selected public-supply wells and ponds
for the current (1994-96) steady-state stress condition, western Cape Cod................................................... 21
7. Location of model-calculated contributing areas to selected public-supply wells and ponds
for the future (2020) steady-state stress condition, western Cape Cod........................................................... 22
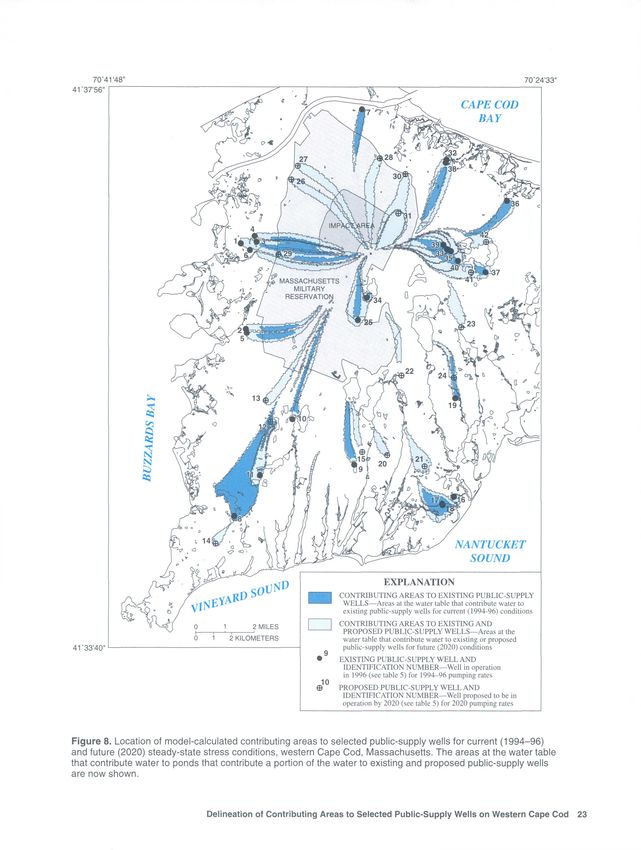
8. Location of model-calculated contributing areas to selected public-supply wells for
current (1994-96) and future (2020) steady-state stress conditions, western Cape Cod................................ 23
9. Classification of model-calculated contributing areas to selected public-supply wells for the
future (2020) steady-state stress condition, western Cape Cod, Massachusetts, based on percentage
of total inflow into model cell represented by pumping rate.......................................................................... 25
Contents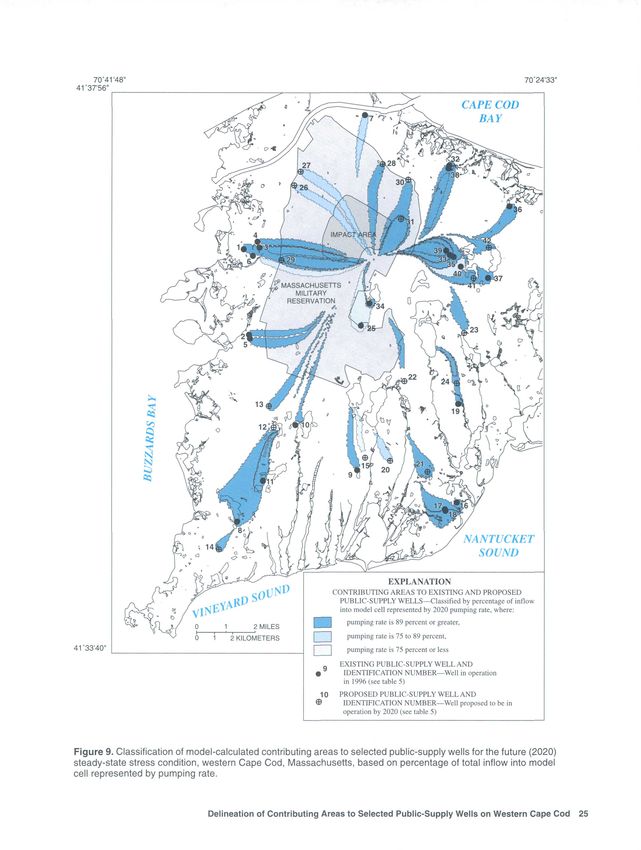
10. Location of model-calculated contributing areas to Massachusetts Military Reservation
            proposed well Site 3 with and without proposed well Site 4 pumping for future (2020) pumping rates
             (0.86 million gallons per day), western Cape Cod..........................................................................................                   26
        11. Location of model-calculated contributing areas to Massachusetts Military Reservation
            proposed well Site 4 with and without proposed well Site 3 pumping for future (2020) pumping rates
            (0.86 million gallons per day), western Cape Cod..........................................................................................                    27
        12. Location of model-calculated contributing areas to proposed well Site P-l 1 for the future (2020)
            pumping rate (0.34 million gallons per day) and for double the future (2020) pumping rate,
            (0.68 million gallons per day) Mashpee, Massachusetts ................................................................................                        30
   13. Model section showing the model-calculated vertical extent of flow from the contributing area to proposed
       well Site P-l 1 for the future (2020) pumping rate (0.34 million gallons per day) and for double the
       future (2020) pumping rate (0.68 million gallons per day), Mashpee, Massachusetts ...........................................                                      31
14-17. Maps showing:
        14. Location of model-calculated contributing areas to Bourne wells B-2G and B-5G for current
            (1994-96) and future (2020) pumping rates, Bourne, Massachusetts............................................................                                  32
        15. Location of model-calculated contributing areas to Mashpee and Wakeby Ponds and proposed well
            Site T-5 for the future (2020) pumping rates, Mashpee, Massachusetts.........................................................                                 33
        16. Location of odel-calculated contributing areas to selected public-supply wells that receive water from
            ponds, and the contributing areas to these ponds, for the future (2020) steady-state stress condition,
            western Cape Cod...........................................................................................................................................   35
        17. Location of model-calculated contributing areas to selected public-supply wells for the future (2020)
            stress condition for the original model and for the updated model, western Cape Cod.................................                                          37

TABLES
     1. Vertical layering, horizontal hydraulic conductivity, and horizontal to vertical anisotropy for the
        updated flow model of western Cape Cod, Massachusetts..................................................................................... 7
     2. Measured pond levels for selected ponds in the modeled area of western Cape Cod, March 1993, and
        model-calculated pond levels for the simulated current steady-state condition for the original flow model,
        and for the simulated current (1994-96) and future (2020) steady-state stress conditions for the updated
        model.......................................................................................................................................................^ 11
     3. Measured discharge for selected streams in the modeled area of western Cape Cod, March 1993, and
        model-calculated streamflows for the simulated current (1994-96) steady-state stress condition for the
        original flow model and for simulated current (1994 96) and future (2020) steady-state stress
        conditions for the updated model............................................................................................................................ 12
     4. Model-calculated hydrologic budget for the modeled area of western Cape Cod, for the simulated current
        steady-state stress condition for the original model, and for simulated current (1994-96) and future (2020)
        steady-state stress conditions for the updated model.............................................................................................. 13
     5. Model locations and pumping rates of selected public-supply wells for simulated current (1994-96)
           and future (2020) steady-state stress conditions, western Cape Cod ..................................................................... 14
     6. Pumping rates for selected public-supply wells, total model-cell inflows, and percentages of model-cell
        inflows removed at the pumping wells for current (1994-96) and future (2020) steady-state stress
        conditions, western Cape Cod................................................................................................................................. 19
     7. Pumping rates and the percentage of pumped water that flows through upgradient ponds for selected
        public-supply wells, ponds that contribute water to specific wells, and total hydrologic budgets for the
        ponds, western Cape Cod........................................................................................................................................ 34
     8. Measured water levels for selected observation wells in the modeled area of western Cape Cod,
        Massachusetts, March 1993, and model-calculated water levels for the simulated current (1994-96)
        steady-state stress condition for the original flow model, and for current (1994-96) and future (2020)
        steady-state stress conditions for the updated model.............................................................................................. 41

IV Contents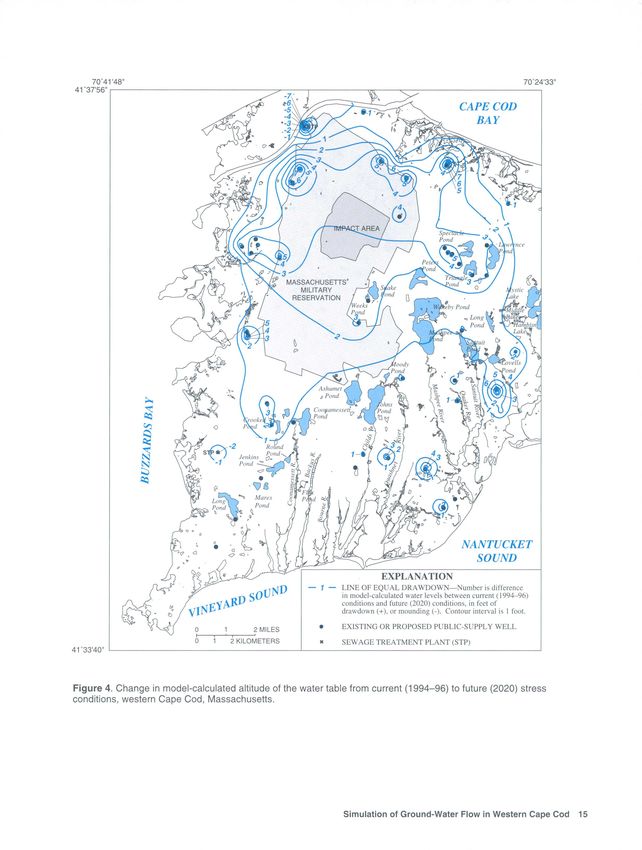
CONVERSION FACTORS AND VERTICAL DATUM

CONVERSION FACTORS

                                  Multiply            By            To Obtain
              cubic foot per second (ft3/s)        0.02832          cubic meter per second
                                  foot (ft)        0.3048           meter
                        foot per day (ft/d)        0.3048           meter per day
                      inch per year (in/yr)       25.4              millimeter per year
                                 mile (mi)         1.609            kilometer
         million gallons per day (Mgal/d)          0.04381          cubic meter per second

In this report, the unit of hydraulic conductivity is foot per day (ft/d), the mathematically reduced form
of cubic foot per day per square foot [(ft3/d)/ft2].

VERTICAL DATUM

Sea Level: In this report, "sea level" refers to the National Geodetic Vertical Datum of 1929 a
geodetic datum derived from a general adjustment of the first-order level nets of the United States and
Canada, formerly called Sea Level Datum of 1929.

                                                                                                             Contents   V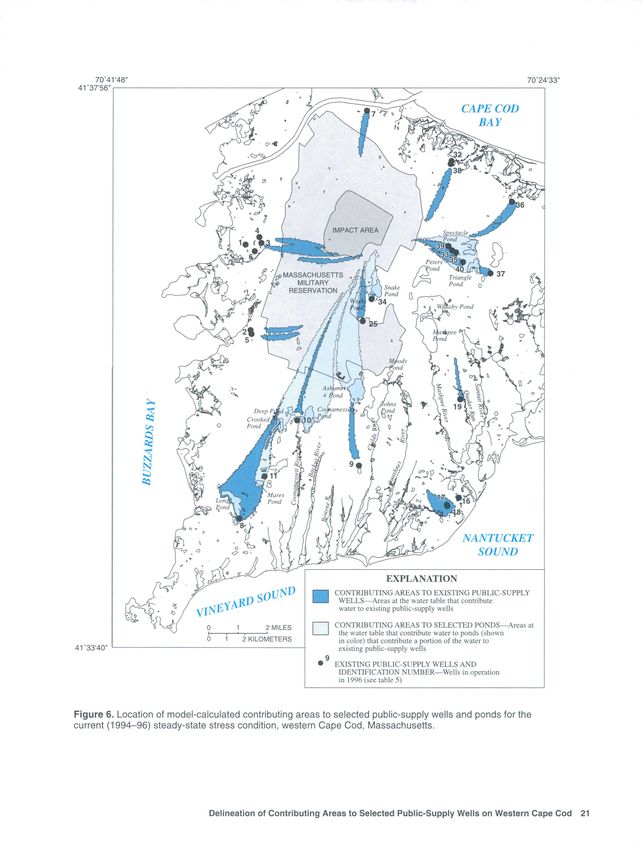
Delineation of Contributing Areas to Selected
Public-Supply Wells, Western Cape Cod,
Massachusetts
By John P. Masterson, Donald A.Walter, and Denis R. LeBlanc
Abstract INTRODUCTION
The shallow, unconfined, sand-and-gravel The shallow, unconfined, sand-and-gravel
aquifer of western Cape Cod is the sole source of aquifer of western Cape Cod is the sole source of
drinking water for the towns of Bourne, Falmouth, drinking water for the towns of Bourne, Falmouth,
Mashpee, and Sandwich, and the Massachusetts Mashpee, and Sandwich, and the Massachusetts
Military Reservation. Contributing areas were Military Reservation (MMR) (fig. 1). Continued land
delineated for 26 existing and 17 proposed public- development and population growth on western Cape
supply wells in these communities for current Cod, as well as activities related to the operation of the
average annual (1994-96) and projected future MMR, have created concerns regarding water quality
(2020) steady-state pumping and recharge and future drinking-water supplies. The areas at the
conditions. Contributing areas were delineated by water table that contribute water to public-supply wells
use of a steady-state, three-dimensional numerical and hydrologic features, such as ponds, streams, and
ground-water-flow model, coupled with a particle- coastal embayments, are in dynamic equilibrium with
tracking program. respect to the current pumping and recharge stresses.
The size and shape of the contributing areas Large changes in ground-water pumping or recharge,
depend on the location and pumping rates of the however, can result in substantial changes to the size
public-supply wells. Changes in pumping rates, and shape of these contributing areas. In the past,
and the addition of new wells or the removal of contributing areas of public-supply wells of Cape Cod
existing wells will require that the contributing commonly were delineated independently of one
areas of all wells be re-evaluated on the basis of another, rather than being determined simultaneously
these changes in aquifer stresses. Contributing by an internally consistent regional ground-water-flow
areas that extend to surface-water bodies, such as model. This well-by-well approach results in
kettle-hole ponds and streams, must include the hydrologically inconsistent and overlapping sources of
areas that contribute water to the surface-water recharge to wells.
bodies because these areas may contribute The U.S. Geological Survey (USGS) previously
recharge to the pumping wells. demonstrated that small shifts in regional hydraulic
The contributing areas were calculated with gradients caused by changes in ground-water pumping
original and updated flow models that assumed or recharge can significantly affect flow directions
natural recharge rates of 21.6 and 25.9 inches per and, consequently, can affect contributing areas to
year, respectively, to illustrate the uncertainty of pumping wells and hydrologic features (Masterson
contributing-area delineations. Because the two and others, 1997a; Barlow, 1997a). Changes to
models were calibrated to the same hydrologic contributing areas of wells and hydrologic features
conditions, the calculated contributing areas to as a result of future water-supply development
wells were nearly identical in shape, but different potentially can affect the quality of drinking-water
in size, due to the difference in simulated recharge supplies and the natural resources of western Cape
rates. Cod.
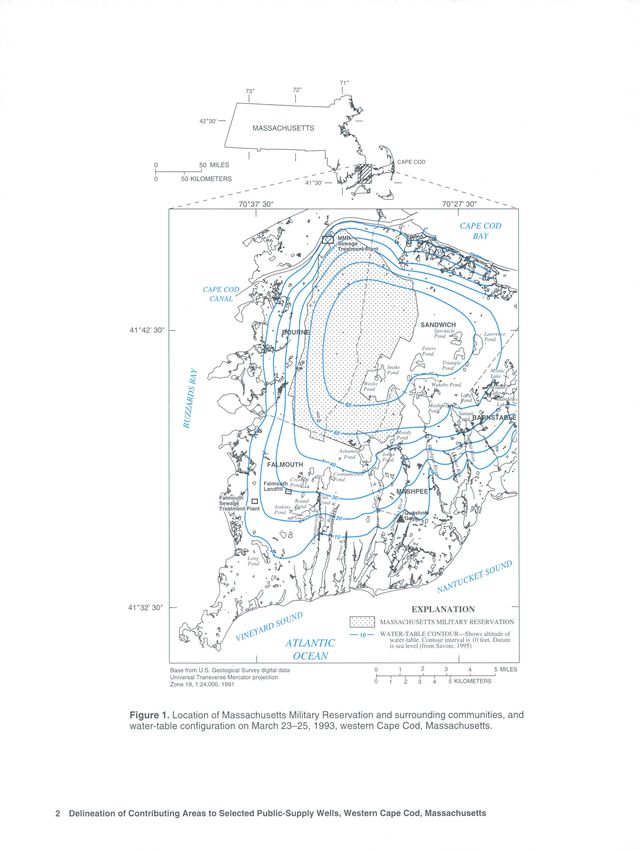
Introduction 1
MASSACHUSETTS

                                         CAPE COD
                                          CANAL

                  41 0 42'30" -

                                               Sewage
                                               Treatment Plant

                 41°32'30"   -
                                                                                               EXPLANATION
                                                                                    MASSACHUSETTS MILITARY RESERVATION
                                                                             ,0 _   WATER-TABLE CONTOUR Shows altitude of
                                                                                      water-table. Contour interval is 10 feet. Datum
                                                                                      is Sea level (from Savoie, 1995)

                             Base from U.S. Geological Survey digital data
                             Universal Transverse Mercator projection
                                                                                                       4     5 KILOMETERS
                             Zone 19, 1:24,000, 1991

                  Figure 1. Location of Massachusetts Military Reservation and surrounding communities, and
                  water-table configuration on March 23-25, 1993, western Cape Cod, Massachusetts.

2   Delineation of Contributing Areas to Selected Public-Supply Wells, Western Cape Cod, Massachusetts
This report presents an analysis of areas that adjacent outwash plain, and to the south by Nantucket
contribute recharge to selected public-supply wells Sound. The sediments that underlie western Cape Cod
on western Cape Cod, Massachusetts, for current consist of glacially derived gravel, sand, silt, and clay
average annual (1994-96) and projected future (2020) that overlie crystalline bedrock. The glacial sediments
pumping rates. The analysis was begun in 1998 by the can be grouped into depositional units based on
USGS, in cooperation with the Air Force Center for depositional environment: glaciofluvial sediments
Environmental Excellence (AFCEE), to support the deposited from meltwater streams, glaciolacustrine
efforts of the Standing Water Supply Group (SWSG), a sediments deposited in proglacial lakes, morainal
coalition of MMR officials, State regulators, and water sediments deposited at or near the ice margin, basal till
superintendents of the communities surrounding the deposited beneath the ice sheets, and kames deposited
MMR who are charged with protecting and developing in small basins formed by holes in the ice sheets
future drinking-water supplies on western Cape Cod. (Masterson and others, 1997b).
The report illustrates how changes in pumping rates,
proposed well locations, and recharge rates affect the Deposits of glaciofluvial sediments dominate
size and shape of these contributing areas. the surficial geology of western Cape Cod. These
The contributing areas were calculated using an sediments were deposited as part of a delta that formed
updated version of the USGS ground-water-flow model in a large proglacial lake. The lake formed as the two
of western Cape Cod that was documented previously lobes of the ice sheet receded from their previous
by Masterson and others (1997a). The model has been terminus in the vicinity of present-day Nantucket and
updated on the basis of new lithologic and hydrologic Martha's Vineyard and meltwater was dammed by
data collected since 1993 as part of the ongoing terminal moraines to the south. The sediment source
remedial investigations of the contamination resulting for the deltaic sediments was the interlobate area of the
from past activities at the MMR. Modifications to the ice sheet in the vicinity of the present-day Cape Cod
model were made by the USGS as part of an ongoing Canal (Masterson and others, 1997b). The outwash
cooperative study with AFCEE to determine the sediments, which generally become finer downward
sources of water to public-supply wells, ponds, and southward, consist of coarse-grained glaciofluvial
streams, and coastal embayments for changing sediments (topset deposits) underlain by fine-grained
pumping and recharge stresses. These modifications glaciolacustrine deposits deposited in near-shore
also are documented in this report. (foreset deposits) and offshore (bottomset deposits)
The authors thank individuals from the following areas within the proglacial lake.
organizations who provided data or assisted in the Coarse-grained deposits may extend nearly to
acquisition of data during this investigation: bedrock at some locations within the outwash deposits.
Massachusetts Military Reservation Installation Three possible locations include areas near the
Restoration Program; Massachusetts Department of sediment source where depositional rates were high,
Environmental Protection; Earth Tech, Inc.; Ogden structures where coarse-grained sediments collapsed
Energy and Environmental Services, Inc.; Cape Cod after the melting of remnant ice blocks, and areas
Commission; and the water superintendents for the
adjacent to moraines, where ice-contact deposits
towns of Bourne, Falmouth, Mashpee, and Sandwich.
formed from meltwater flowing through the moraine
prior to formation of the main glacial delta (Byron
HYDROGEOLOGY Stone, USGS, written commun., 1997).
Moraine deposits generally consist of poorly
Geologic Setting sorted sediments that are characterized by grain sizes
ranging from clay to boulders. The moraine west of the
The surficial geology of western Cape Cod is outwash deposits likely is an ablation moraine that
characterized by a broad, gently sloping glacial formed from rapid deposition at the ice margin during
outwash plain, known as the Mashpee Pitted Plain, recession of the western lobe of ice sheet. The moraine,
which is bounded to the north and west by hummocky which is north of the outwash sediments, likely is a
terrain formed from glacial moraines, to the east by an tectonic moraine that formed when reworked glacial
Hydrogeology 3sediments were thrust southward during a temporary outward from the mound toward the coast. Other
readvance of the northern lobe of the ice sheet (Oldale features include kettle-hole ponds, which are in direct
and O1 Kara, 1984). hydraulic connection to the aquifer and represent a
Basal till underlies the glacial outwash and surface expression of the water table. These ponds
moraine deposits throughout most of western Cape strongly control local ground-water-flow patterns.
Cod. These deposits generally consist of clay and Ground water discharges into upgradient areas of the
angular rock fragments that were formed from erosion ponds, and pond water recharges into the aquifer in
of the underlying bedrock at the base of the advancing downgradient areas of the ponds.
ice-sheet lobes. Localized kame deposits generally Most ground water flows through shallow parts
consist of fine to coarse sand that was deposited in of the aquifer where coarse-grained sediments
small basins within holes in the ice sheet. predominate. The water-transmitting properties of
the glacial sediments, as represented by hydraulic
conductivity, vary according to grain size and the
Hydrologic System degree of sorting. The highest hydraulic conductivities
(240 to 350 ft/d) are in well-sorted sand and gravel
The glacial sediments that underlie western Cape deposits, which predominate in shallow parts of the
Cod compose an aquifer system that is part of the West outwash. Fine-grained glaciolacustrine sediments, such
Cape flow cell (LeBlanc and others, 1986). The aquifer as the fine sand and silt in deeper parts of the outwash
system is bounded to the north, south, and west by deposits, have lower hydraulic conductivities (30 to
saltwater and to the east by a ground-water divide. The 150 ft/d). Hydraulic properties of the glacial-moraine
lower boundary of the ground-water system is bedrock, sediments range greatly; but in general the moraine
which is assumed to be impermeable. The upper sediments have lower hydraulic conductivities than
boundary is the water table. The saturated thickness of the outwash deposits (10 to 150 ft/d). Hydraulic-
the aquifer ranges from about 100 ft near the Cape Cod conductivity values for the basal till deposits are
Canal to more than 500 ft in the southern part of the assumed to be much lower than the overlying deltaic
flow system. The ground-water-flow system generally deposits (1 to 10 ft/d). The hydraulic properties of
is unconfined throughout western Cape Cod. glacial sediments underlying western Cape Cod are
Areal recharge from precipitation is the sole discussed in detail by Masterson and others (1997a,
source of freshwater to the ground-water system. 1997b).
About 26 in/yr of recharge, or about 60 percent of the
average annual precipitation, is estimated to enter the
ground-water system at the water table (Gordon SIMULATION OF GROUND-WATER
Bennett, Papadopoulos and Assoc., Inc., written com- FLOW IN WESTERN CAPE COD
mun., 1998); this recharge corresponds to a total inflow
of about 190 Mgal/d over the area shown in figure 1. A three-dimensional numerical model of ground-
Ground water leaves the system primarily through nat- water flow, developed by Masterson and others (1997a)
ural discharge to streams, saltwater embayments, and to simulate ground-water flow for western Cape Cod,
the ocean, and through withdrawals at public-supply has been updated and used for the delineation of the
wells. Numerical modeling indicates that about 40 per- sources of water to selected public-supply wells.
cent of the total ground-water outflow from the ground- The model is based on the USGS three-dimensional,
water system on western Cape Cod discharges to finite-difference modeling code of McDonald and
streams, about 50 percent discharges to the ocean at the Harbaugh (1988) and Harbaugh and McDonald (1996)
coast, and about 5 percent becomes public-supply (MODFLOW). A USGS particle-tracking model
withdrawals. About 85 percent of water withdrawn for developed by Pollock (1994) (MODPATH) was used to
public supply is estimated to return to the aquifer as calculate the initial locations of water particles that
wastewater return flow (Masterson and others, 1997a). discharged to simulated public-supply wells on western
A major feature of the flow system is the water- Cape Cod for steady-state conditions. The use of a
table mound whose highest point is in the north-central numerical model for the particle-tracking analysis
part of the flow system (fig. 1); the average water-table provides for the delineation of contributing areas for
altitude at the top of the mound is about 70 ft above sea many pumping wells under complex pumping and
level (Savoie, 1995). Ground water flows radially recharge scenarios.
4 Delineation of Contributing Areas to Selected Public-Supply Wells, Western Cape Cod, MassachusettsModifications to Original Flow Model are projected to increase by more than three times the
current rates (Earth Tech, Inc., 1998) and could induce
The numerical model grid and boundary infiltration of streamflow into the aquifer.
conditions of the updated model are virtually the same In the original model, the surface-water
as those used in the original model of western Cape contribution to streams from pond outlets was not
Cod (Masterson and others, 1997a). The finite- simulated because it was assumed that flow from ponds
difference grid consists of 144 rows and 130 columns to streams generally was small during average climatic
of uniformly spaced model cells that are 660 ft on a conditions. Streamflow data reported by Savoie (1995),
side (fig. 2). The model has 11 layers (table 1) that however, suggest that flow from the pond outlets can
extend from the water table to the contact between provide a significant component of streamflow, for
unconsolidated glacial deposits and bedrock. The example, at the Mashpee Pond outlet to the Mashpee
upper two layers of the model are inactive at locations River (fig. 1). Therefore, the flow model has been
in the flow system where the model-calculated heads updated to incorporate the USGS MODFLOW Stream-
are below the layers. The top layer of the model has a Routing module (Prudic, 1989), which allows for the
maximum thickness of about 30 ft at the top of the infiltration of streamflow into the aquifer under high
water-table mound. The upper eight model layers ground-water pumping conditions and the explicit
have a 20-foot vertical discretization to improve the simulation of the surface-water contribution from
accuracy of heads and flowpaths in the most permeable ponds. The streambed altitudes, thicknesses, and
part of the aquifer. The bottom altitude for all model conductances used to simulate streams in the original
cells in a particular layer is uniform (table 1), except model were only slightly modified for the Stream-
where the model cells are truncated by bedrock or the Routing module in the updated model. The simulated
bottom altitudes are adjusted to follow the bottoms of surface-water contributions from ponds to streams
kettle-hole ponds. were based on the March 1993 measurements reported
by Savoie (1995).
The modifications made to the original model
include changes in several boundary conditions, such
as the manner in which streams are simulated. Other Stresses
modifications include changes in model stresses such Changes that were made to simulated model
as natural and wastewater return-flow recharge rates, stresses include the rates for natural recharge and
and ground-water withdrawals from public-supply wastewater return flow, and ground-water withdrawals
wells and pump-and-treat remediation systems on the from public-supply wells and pump-and-treat
MMR. The distribution of simulated hydraulic- remediation systems. The original USGS flow model
conductivity values also was adjusted to reflect the assumed a natural recharge rate from precipitation of
most recent hydrogeologic data. 21.6 in/yr per year based on monthly mean recharge
estimates by Barlow and Hess (1993) for western
Boundary Conditions Cape Cod using the Thornthwaite and Mather (1957)
water-balance method. More recent compilations of
A modification to the boundary conditions of recharge rates by Barlow (1997b) and Gordon Bennett
the original model is the manner in which streams (written commun., 1998) indicate that about 26 in/yr
are simulated. In the original model, the USGS is typical of recharge rates for the stratified drift
MODFLOW Drain module was used because all of aquifers of the Northeast. Recent hydrogeologic
the streams were assumed to be gaining throughout investigations at the MMR, and subsequent revisions
their modeled extent. If the model-calculated head in to the existing conceptual model of the flow system
the aquifer declined below the specified streambed (Jacobs Engineering Group, Inc., 1998), suggest that
altitude, no interaction was simulated between the the recharge rate assumed for western Cape Cod
stream and the aquifer even if water that potentially (21.6 in/yr) may be an underestimate. On the basis of
could have recharged the aquifer remained in the this new information, the simulated natural recharge
stream. This assumption may not be valid for future rate was increased by 20 percent from 21.6 in/yr to
pumping scenarios in which ground-water withdrawals 25.9 in/yr in the updated flow model.
Simulation of Ground-Water Flow in Western Cape Cod 5EXPLANATION
41°42'30" -
FffiSSI MODEL GRID
INACTIVE NODE-Outside modeled area
SPECIFIED HEAD NODE
HEAD-DEPENDENT FLUX NODE-Coastal discharge area, layer 3
HEAD-DEPENDENT FLUX NODE-Streams, layers 1-3
HIGH HYDRAULIC CONDUCTIVITY NODE-Ponds, layers 1-4
Marston Mills
River
Johns Pond
Ashumet
41°32'30" -
Base from U.S. Geological Survey digital data
Universal Transverse Mercator projection
Zone 19, 1:24,000, 1991
Figure 2. Model grid and distribution of boundary conditions of flow model of western Cape Cod, Massachusetts
(Masterson and others, 1997a).
6 Delineation of Contributing Areas to Selected Public-Supply Wells, Western Cape Cod, MassachusettsTable 1 . Vertical layering, horizontal hydraulic conductivity, Cape Cod currently receive public water. The total
and horizontal to vertical anisotropy for the updated flow wastewater return flow represents only about 4 percent
model of western Cape Cod, Massachusetts
of the total recharge to the aquifer for current (1994-
[Horizontal hydraulic conductivity: A horizontal hydraulic conductivity 96) conditions and about 9 percent of the total recharge
of 50,000 ft/d was specified for model cells representing ponds, ft, foot; ft/d,
foot per day]. for future (2020) conditions, so these assumptions are
Maximum depth Horizontal
assumed to have a negligible effect on the analysis.
Horizontal to
Model of layer relative hydraulic
vertical
In areas that are sewered, such as the MMR and
layer to sea level conductivity southwestern Falmouth, 85 percent of the total ground-
anisotropy
(ft) (ft/d)
water withdrawals are treated and returned to the
1 40 350-125 3:1-10:1 ground-water-flow system at the locations of the
2 20 350-125 3:1-10:1 sewage-treatment plants (fig. 1). It is assumed that
3 0 350-125 3:1-10:1
-20
wastewater in the sewered areas is not returned
4 350-100 3:1-10:1
5 -40 230-70 5:1-30:1 anywhere other than at the sewage-treatment plants.
6 -60 230-70 5:1-30:1 Simulated ground-water withdrawals were
7 -80 200-30 5:1-100:1 modified from the original model to represent the most
8 -100 125-10 10:1-100:1 recent available information on ground-water
9 -140 70-10 30:1-100:1
withdrawals for western Cape Cod. In the original
10 -240 70-10 30:1-100:1
11 -550 30-10 100:1
model, the total simulated ground-water withdrawal
rate of 8.7 Mgal/d was based on the average annual
pumping rates from 1986-1990. The simulated total
ground-water withdrawal of 10.3 Mgal/d in the updated
The distribution of recharge from wastewater
return flow was updated from the original model. The model is based on the average annual pumping rates
distribution of wastewater return flow through from 1994-96. The locations of public-supply wells
domestic on-site disposal in the updated model is based that are simulated in the updated model are shown in
on the land-use zoning of residential areas delineated figure 3.
in Harris and Steeves (1994) rather than on the The locations of the known contaminant plumes
distribution of roads, as in the original model emanating from the MMR are shown in figure 3.
(Masterson and others, 1997a). These two methods Currently (1998) three pump-and-treat remediation
assume that 85 percent of the water pumped for public systems operate at the MMR. The only operational
supply is returned to the aquifer as wastewater return pump-and-treat remediation system at the MMR that is
flow. The method based on land use, however, provides simulated in the updated flow model is the Chemical
the flexibility for distributing wastewater return flow
Spill-4 (CS-4) remediation system because the treated
from projected future increases in pumping rates to
water is returned to the aquifer at a location different
areas that are currently undeveloped but have the
greatest potential for future residential development. from where it is pumped. Pump-and-treat systems in
All homes in the communities surrounding the MMR which the pumped water is reinjected within the area of
were assumed to be served by water suppliers. This the same model cells from which it is withdrawn, such
assumption does not account for the location or density as the systems at the Fuel Spill-12 (FS-12) and Fuel
of houses within the residential land-use zones, or for Spill-28 (FS-28) contaminant plumes (fig. 3), are not
the fact that only 70 percent of the residents of western simulated.
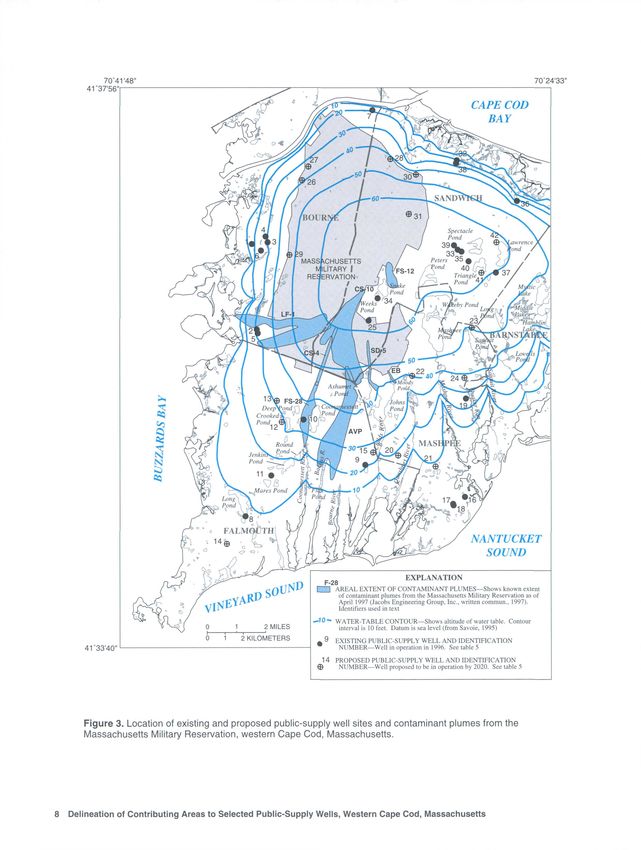
Simulation of Ground-Water Flow in Western Cape Cod 770'41 '48' 70°24'33"
41 "37:56"
CAPE COD
BAY
NANTUCKET
SOUND
EXPLANATION
E5O~AREAL EXTENT OF CONTAMINANT PLUMES Shows known extent
of contaminant plumes from the Massachusetts Military Reservation as of
April 1997 (Jacobs Engineering Group, Inc., written commun., 1997).
Identifiers used in text
-10- WATER-TABLE CONTOUR Shows altitude of water table. Contour
interval is 10 feet. Datum is sea level (from Savoie, 1995)
2 KILOMETERS m 9 EXISTING PUBLIC-SUPPLY WELL AND IDENTIFICATION
41'33'40" NUMBER Well in operation in 1996. See table 5
14 PROPOSED PUBLIC-SUPPLY WELL AND IDENTIFICATION
© NUMBER Well proposed to be in operation by 2020. See table 5
Figure 3. Location of existing and proposed public-supply well sites and contaminant plumes from the
Massachusetts Military Reservation, western Cape Cod, Massachusetts.
8 Delineation of Contributing Areas to Selected Public-Supply Wells, Western Cape Cod, MassachusettsHydraulic Conductivity Recent drilling (since 1993) also provided infor-
mation on lithology and on the depth to bedrock (the
The distribution of hydraulic conductivity
lower model boundary) throughout the study area, par-
was modified to incorporate the most recent (1998)
ticularly near the top of the water-table mound. The
information on the hydrogeologic framework of the
lithologic logs indicated that the depth to bedrock was
aquifer, including the depth to bedrock. Analysis of
greater than previously assumed. The depth to bedrock
new lithologic borings that were collected as part of
generally was increased throughout the modeled area,
the Installation Restoration Program (IRP) (Jacobs thus increasing the simulated saturated thickness in the
Engineering Group, Inc., 1998) at the MMR since flow model.
the development of the original flow model (1993)
indicated that the contact between the upper coarse-
grained and underlying fine-grained sediments gener- Model Calibration
ally is deeper (by about 50 ft on average) than what
was shown by Masterson and others (1997b). As a Once the modifications to the original model
result, hydraulic-conductivity values were increased in were completed, simulations were made to determine
the updated model from values ranging from approxi- how well the updated model matched the calibration
mately 30 to 70 ft/d (silt and fine sand) to values rang- criteria documented in Masterson and others (1997a).
ing from 125 to 230 ft/d (fine to medium sand) where During this calibration process, hydraulic-conductivity
the contact was shifted downward. values were adjusted within the range of values dis-
The hydraulic-conductivity distribution also was cussed in the previous section, "Hydrogeologic Set-
changed at the collapse structures and the bottom sedi- ting," based on the changes discussed in the section,
ments of the kettle-hole ponds. The areas of higher "Modifications to the Original Model," to provide a
hydraulic conductivity that correspond to the collapse better match to the calibration criteria.
structures shown in Masterson and others (1997b) were The measurements used for calibration of the
expanded in accordance with results from additional original and updated models were based on the March
drilling around ponds (Jacobs Engineering Group, Inc., 1993 water levels and streamflows documented in
1998). This expansion includes higher hydraulic-con- Savoie (1995). These measurements are the most
ductivity values in lower layers of the model and at recent comprehensive set of synoptic measurements
greater horizontal distances from the simulated ponds. that are considered to be representative of near-average
The model cells representing the kettle-hole ponds conditions. Seasonal fluctuations in recharge and
themselves still are simulated as zones of high hydrau- pumping result in seasonal fluctuations in water levels,
lic conductivity (50,000 ft/d). and a steady-state hydrologic condition does not truly
The simulated hydraulic conductivity of the exist. However, the median difference between the
moraines in the original model was adjusted on the March 1993 synoptic measurements and the median of
basis of additional lithologic information collected as monthly medians for 17 observation wells with long
part of MMR-related hydrogeologic investigations measurement records (about 35 years) in the modeled
(Jacobs Engineering Group, Inc., 1998; Lauren Foster, area is only 0.8 ft. Hydrographs presented in Savoie
Jacobs Engineering Group, Inc., written commun., (1995) for three of these long-term observation wells
1998; Stone and Webster, Inc., 1997a, 1997b; and illustrate that the synoptic measurements of March
Ogden Environmental and Energy Services, 1998). In 1993 represent near-average water levels for the period
general, the hydraulic-conductivity values used to sim- of record.
ulate the morainal deposits have been increased to The total pumping rate of 8.7 Mgal/d simulated
account for more permeable sediments deeper in the in the original model was based on average annual
vertical section than were simulated in the original pumping from 1986-90. The total pumping rate of
model. The hydraulic-conductivity values in the south- 10.3 Mgal/d simulated in the updated model is based
ern portion of the moraine in western Falmouth also on average annual pumping from 1994-96. For the
were increased where the moraine is bordered by the year in which the hydrologic data were collected for
very coarse-grained stratified-drift deposits (Masterson model calibration (1993), however, the average annual
and others, 1997b). pumping rate was 9.5 Mgal/d. It is assumed that the use
Simulation of Ground-Water Flow in Western Cape Cod 9of head and flow conditions in 1993 to assess the cali- of the Quashnet River gage are 13.9 ft3/s and 16.0 ft3/s,
bration of a model using 1994-96 stresses is acceptable respectively. For other streams there is an insufficient
because the difference in pumping rates between 1993 number of stream discharge measurements to calculate
and 1994-96 is small. Also, because the observations average streamflows properly, and it is not possible to
wells selected for model calibration are not near evaluate which model more accurately simulates aver-
public-supply wells, the small differences in simulated age streamflow conditions. The original and updated
pumping rates should not affect model calibration model-calculated streamflows, however, generally are
(Masterson and others, 1997a). consistent with previous flow measurements for
When the updated model was considered to be western Cape Cod (Masterson and others, 1997a).
calibrated, a comparison was made between the The final calibration criterion used to compare
updated and original models using the calibration crite- the original and updated flow models is the estimated
ria documented in Masterson and others (1997a). In location of the contaminant plumes emanating from the
order for this comparison to be made, the pumping and MMR (fig. 3). A plume-by-plume comparison is
return flow stresses in the original model (Masterson beyond the scope of this report; however, comparing
and others, 1997a) were updated for 1994-96 stress model-calculated flowpaths to known extents of
conditions. contaminant plumes is an effective means of evaluating
The mean absolute errors between measured and the accuracy of model-calculated flow directions.
model-calculated water levels for the 177 observation The comparison between model-calculated
wells measured in 1993 (table 8 at back of report) in flowpaths and the known extent of the contaminant
the original and updated models are 1.2 ft and 1.0 ft, plumes for the updated model is similar to the same
respectively. The median errors between measured and comparison for the original model. The updated model,
model-calculated water levels in the original and however, better represents the thickness and vertical
updated models are 0.9 ft and -0.3 ft, respectively. The positions of the plumes and the travel times of the
mean of the absolute errors between measured and
contaminant migration for the Landfill plume (LF-1),
model-calculated pond levels for the 13 ponds
Ashumet Valley Plume (AVP), and the Chemical Spill-
measured in 1993 (table 2) is 0.8 ft in the original
10 plume (CS-10). This improved representation
model and 0.7 ft in the updated model. The median
mostly likely is due to increases in the simulated depth
error between measured and model-calculated pond
to bedrock and the higher recharge rate. The
levels is 0.9 ft in the original model and 0.3 ft in the
updated model. The locations of the well and pond comparison of model-calculated flow directions to the
observation points are shown in Masterson and others known extent of contaminant plumes is important
(1997a). Because it is assumed that there are negligible because changes in simulated boundary conditions and
differences in pond levels across a particular pond, hydraulic properties may result in only minor changes
only one model cell was selected near the middle of in model-calculated water levels, pond levels, and
each pond to represent pond elevations in table 2. streamflows, yet these changes can substantially alter
model-calculated flow paths. The improved match
A comparison of model-calculated streamflows
between model-calculated and actual flowpaths in the
between the original and updated models shows that
the total model-calculated streamflows increased in the updated model provides some assurance that the
updated model (table 3). This increase is attributed to model-calculated contributing areas to public-supply
the 20-percent increase in the recharge rate in the wells are accurately delineated.
updated model. The only continuous streamgaging sta- The pumping and wastewater-return-flow rates
tion on western Cape Cod is on the Quashnet River were modified for the original model to represent the
(fig. 1). The streamflow measurement at the station on same conditions as the updated model (1994-96) so
March 23, 1993, was 18.8 ft3/s, whereas the average that the hydrologic budgets for the two models could
streamflow for the 9-year period of record (1989-97) is be compared. Components of the model-calculated
15.5 ft3/s (Socolow and others, 1998). This difference hydrologic budgets for the original and updated models
indicates that the stream discharge measurements made for current conditions (1994-96) are shown in table 4.
during March 22-25, 1993, do not appear to be repre- A comparison of the budgets shows that the total
sentative of average conditions. The model-calculated inflow increased by 19 percent from the original to the
streamflows for the original and updated models for updated model. This increase was caused primarily by
current (1994-96) conditions at the simulated location the increase in natural recharge from 21.6 to 25.9 in/yr.
10 Delineation of Contributing Areas to Selected Public-Supply Wells, Western Cape Cod, MassachusettsTable 2. Measured pond levels for selected ponds in the modeled area of western Cape Cod, Massachusetts, March 1993, and model-calculated pond levels for the
simulated current (1994-96) steady-state stress condition for the original flow model, and for simulated current (1994-96) and future (2020) steady-state stress
conditions for the updated model
[ , no data available]
Model cell Pond levels (feet above sea level)
Simulated with Simulated with Difference for
Simulated with
Pond original model Difference updated model Difference updated model
Measured updated model
Layer Row Column assuming (measured- assuming (measured- between 1994-96
(March 1993) assuming 2020
1994-96 simulated) 1994-96 simulated and 2020 pumping
pumping
pumping pumping (current-future)
Flax 3 103 56 12.8 12.1 0.7 12.0 0.8 12.0 0.0
Fresh 3 103 71 19.1 18.1 1.0 17.7 1.4 17.2 .5
Jenkins 3 98 50 19.8 19.6 2 20.4 -.6 20.2 .2
Round 3 97 54 21.0 19.6 A 20.3 -.7 20.1 .2
Crooked 3 86 52 31.4 31.6 -.2 31.3 .1 29.6 1.7
Coonamessett 3 84 61 35.8 35.0 .5 35.5 .3 34.8 .7
Moody 2 79 84 44.1 43.8 .3 43.9 .2 43.2 .7
Ashumet 2 81 75 44.7 43.7 1.0 44.7 .0 44.2 .5
Johns 4 83 81 39.9 39.6 .3 40.2 -.3 39.9 .3
Mashpee 5 12 97 57.1 57.1 .0 57.6 -.5 56.6 1.0
Snake 1 58 83 68.0 65.8 2.2 66.2 1.8 63.8 3.4
Santuit 1 79 108 46.0 46.7 -.7 45.7 .3 44.8 .9
3
c
Q) Long 2 71 115 53.0 51.3 1.7 51.4 1.6 50.3 1.1
5'
Triangle 1 57 113 61.5 62.4 58.7 3.7
I Spectacle 1 49 113 62.9 63.4 59.8 3.6
Ground- Lawrence 1 52 119 ... 59.5 59.9 ... 57.0 2.9
Q)
(0
T1
§5'
ro
»
0
O
Q.Table 3. Measured discharge for selected streams in the modeled area of western Cape Cod, Massachusetts, March 1993, and
model-calculated streamflows for the simulated current (1994-96) steady-state stress condition for the original flow model and
for simulated current (1994-96) and future (2020) steady-state stress conditions for the updated model
[ft3/s, cubic feet per second]
Model cell Model-calculated streamflows (ftVs)
Measured Simulated Simulated
Difference for
discharge with original with updated Simulated with
Stream updated model
(ft3/s) model model updated model
Layer Row Column between 1994-96
(March 1993) assuming assuming assuming 2020
and 2020 pumping
1994-96 1994-96 pumping
(current-future)
pumping pumping
Backus 3 109 57 7.0 2.6 2.9 2.9 0.0
Bourne 3 112 62 4.2 1.1 1.2 1.2 .0
Childs 2 93 78 4.1 4.1 4.4 4.4 .0
2 95 78 4.3 3.4 4.0 3.8 .2
3 102 75 8.4 6.0 6.5 5.8 .7
3 108 73 12.9 7.9 8.6 7.7 .9
Coonamessett 2 87 57 .2 .5 .5 .4 .1
2 89 57 .5 1.9 2.1 1.5 .6
3 99 56 11.7 7.8 8.5 7.3 1.2
3 103 54 14.5 10.4 11.0 9.7 1.3
3 107 53 16.8 13.8 13.9 12.7 1.2
3 109 53 16.6 14.9 15.0 13.9 1.1
Mashpee 1 76 96 11.9 11.7 11.9 11.7 .2
2 80 97 14.6 14.7 16.1 15.4 .7
3 92 95 22.9 22.8 25.4 24.4 1.0
Quashnet 2 82 83 .0 .7 .8 .8 .0
2 89 87 9.2 7.3 8.5 8.1 .4
3 98 85 12.4 10.3 11.7 11.2 .5
3 106 81 18.8 13.9 16.0 15.0 1.0
Santuit 2 81 108 4.2 4.4 4.1 4.0 .1
2 86 108 6.0 5.5 5.4 5.3 .1
3 91 108 8.7 8.8 9.8 8.7 1.1
The wastewater return flow is only 70 percent changes in boundary fluxes are small compared to the
of the total public-supply withdrawals because total hydrologic budget (less than 2 percent of the total
withdrawals from seven wells located in the town of budget).
Barnstable near the eastern model boundary (not
shown in fig. 3) are returned to the aquifer beyond the
modeled area.
Simulation of Current and Future
Pumping and Recharge Conditions
The discharge to streams increased by 11 percent
(7.4 Mgal/d) from the original to the updated model, Ground-water flow on western Cape Cod was
whereas coastal discharge increased by about 29 simulated using the calibrated, updated flow model for
percent (20.9 Mgal/d). Inflow and outflow across the two steady-state stress conditions in which average
eastern specified-head model boundary increased by pumping and recharge rates represent current
2.0 Mgal/d and 2.6 Mgal/d, respectively, but these conditions (1994-96) and a possible future condition
12 Delineation of Contributing Areas to Selected Public-Supply Wells, Western Cape Cod, MassachusettsTable 4. Model-calculated hydrologic budget for the modeled area of western Cape Cod, Massachusetts, for the simulated
current steady-state stress condition for the original model, and for simulated current (1994-96) and future (2020) steady-state
stress conditions for the updated model
[Mgal/d, Million gallons per day]
Volumetric rate
Original flow model Updated flow model Updated flow model
Budget component assuming 1994-96 assuming 1994-96 assuming 2020
pumping rates pumping rates pumping rates
(Mgal/d) (Mgal/d) (Mgal/d)
Inflow
Recharge, precipitation 146.9 175.6 175.6
Recharge, wastewater return flow 7.2 7.2 21.6
Inflow across eastern boundary 3.2 5.2 5.4
Inflow from streams .5 .3 .4
Total inflow 157.8 188.3 203.0
Outflow
Public-supply withdrawals 10.3 10.3 33.3
Streams 65.5 72.9 67.4
Coastal discharge 72.3 93.2 91.9
Subsea discharge .8 .4 .4
Outflow across eastern boundary 8.9 11.5 10.2
Total outflow 157.8 188.3 203.2
Model numerical error .0 .0 -.2
(2020). The year 2020 simulation was designed with Barnstable wells and the CS-4 pump-and-treat wells)
the assistance of the SWSG. Pumping was simulated for current conditions is about 10.3 Mgal/d. The
for 34 wells for current conditions and 51 wells for withdrawal rate for all the existing and potential wells
future conditions. The pumping rates simulated for the increases to about 33.3 Mgal/d for the 2020
26 of the 34 wells pumping for current conditions and simulations.
43 of the 51 wells for 2020 conditions were based on The increases in public-supply withdrawals and
information provided by Earth Tech, Inc., to the SWSG wastewater return flow from current conditions to
(Earth Tech, Inc., 1998) for the towns of Bourne, projected 2020 conditions resulted in a model-
Falmouth, Mashpee, and Sandwich, and the MMR
calculated decrease in ground-water levels, pond
(fig. 3 and table 5). The location of each potential well
levels, and streamflow (fig. 4, tables 2, 3, and 8). On
site and altitude of the well screen also were provided
average, ground-water levels declined by only 0.9 ft
by Earth Tech, Inc. Pumping rates for 2020 were
estimated by assuming that each existing and potential and pond levels by 1.2 ft at the observation sites
well would be pumped at the well-design-capacity rate (tables 2 and 8). The impact of increases in ground-
for an average of 16 hr/day. The well-design-capacity water withdrawals on water levels is lessened because
rates for future wells at each location are approved by most of the water pumped for public supply is returned
the Massachusetts Department of Environmental to the flow system as wastewater return flow. Near the
Protection (MDEP). The remaining 8 wells included in large, multiple-well pumping centers in eastern
both simulations are the Barnstable wells and the Sandwich (figs. 3 and 4), however, pond-level declines
pump-and-treat wells for the CS-4 plume at the MMR of 3.7 ft, 3.6 ft, and 2.9 ft were simulated at Triangle
(not shown in fig. 3 or table 5). The total withdrawal Pond, Spectacle Pond, and Lawrence Pond,
rate from all the pumping wells (including the respectively.
Simulation of Ground-Water Flow in Western Cape Cod 13Table 5. Model locations and pumping rates of selected public-supply wells for simulated current (1994-96) and future (2020)
steady-state stress conditions, western Cape Cod, Massachusetts
[Status: E, existing well; P, proposed well. Map Code: Location of wells shown in figure 3. na, not applicable; Mgal/d, million gallons per day; *, Long Pond
includes multiple layers, rows, and columns]
Model Cell 1994-96 2020
Well name Status Map code pumping rate pumping rate
Layer Row Column (Mgal/d) (Mgal/d)
Town of Bourne
B-1G E 1 5 37 52 0.29 0.96
B-2G E 2 4 60 49 .11 .48
B-3G E 3 4 38 57 .16 .62
B-4G E 4 4 36 56 .19 .58
B-5G E 5 4 62 49 .16 .67
B-6G E 6 6-7 40 54 .19 .67
SS-1G E 7 4 8 92 .12 .34
Town of Falmouth
Long Pond E 8 * * * 2.77 2.77
F-2G E 9 4 102 71 .41 .58
F-3G E 10 3 87 57 .59 .67
F-4G E 11 5 100 45 .30 .34
Crooked Pond P 12 5 86 51 na .98
Ballymeade P 13 4 81 51 na .67
Beebe Woods P 14 4 116 30 na .20
Site 3 P 15 4-5 99 74 na .34
Town of Mashpee
M-1G E 16 4 116 96 0.02 0.12
M-2G E 17 5-6 118 92 .27 .67
M-3G E 18 6 117 92 .30 .67
M-4G E 19 3 90 102 .12 .34
Merganser P 20 5-6 101 80 na .68
Holland Mills P 21 7 106 90 na .70
P-ll P 22 4 81 88 na .34
T-8 P 23 6 71 107 na .67
T-5 P 24 4 84 102 na .34
Massachusetts Military Reservation
MMR-1G E 25 4-6 64 79 0.37 1.24
95-6 P 26 6-7 23 69 na .86
95-15 P 27 5-6 20 72 na .86
Sitel P 28 7 22 94 na .86
Site 2 P 29 5 42 62 na .86
Site 3 P 30 6 28 100 na .86
Site 4 P 31 4 38 96 na .86
Town of Sandwich
S-2G and S-3G E 32 4 26 112 0.15 0.86
S-4G E 33 3 50 107 .07 .67
S-5G E 34 3 59 83 .22 .67
S-6G E 35 2-3 51 108 .14 .67
S-7G E 36 5 40 126 .50 .67
S-8G E 37 3 58 116 .33 .67
S-9G E 38 5 27 111 .22 .67
S-10G E 39 2 49 106 .17 .67
S-11G E 40 2-3 54 109 .18 .67
TW 1-93 P 41 3 57 112 na .53
TW 1-96 P 42 3 50 118 na .67
14 Delineation of Contributing Areas to Selected Public-Supply Wells, Western Cape Cod, Massachusetts70'41'48" 70'24'33"
4r37'56'
CAPE COD
BAY
NANTVCKET
SOUND
EXPLANATION
1 LINE OF EQUAL DRAWDOWN Number is difference
in model-calculated water levels between current (1994-96)
conditions and future (2020) conditions, in feet of
drawdown (+), or mounding (-). Contour interval is 1 foot.
EXISTING OR PROPOSED PUBLIC-SUPPLY WELL
0 1 2 KILOMETERS « SEWAGE TREATMENT PLANT (STP)
41'33'40"
Figure 4. Change in model-calculated altitude of the water table from current (1994-96) to future (2020) stress
conditions, western Cape Cod, Massachusetts.
Simulation of Ground-Water Flow in Western Cape Cod 15Streamflows on western Cape Cod declined by designed to make up for shortages in water supplies to
about 8 percent for the 2020 stress conditions (table 4). the communities surrounding the MMR in the event
The streams most affected by increased pumping are that an operating well becomes contaminated from
the Coonamessett River, Childs River, Quashnet River, sources at the MMR. Because it is not known at this
and Mashpee River (table 3). The largest total decline time where that water actually will be distributed, the
in streamflow, caused by a decrease in ground-water water was uniformly distributed in the model
discharge to the stream, is 1.3 ft3/s in the Coonamessett simulation to cells receiving wastewater return flow
River in Falmouth. When the contribution from the throughout the modeled area.
outlet at Johns Pond is subtracted from the streamflow If the water pumped from the Barnstable wells is
of the Childs River, this stream had the largest subtracted from the total public-supply withdrawals for
percentage decrease (21 percent) in streamflow for the the 2020 simulation, the total wastewater returnflow
2020 stress condition. The change in streamflow along only represents about 74 percent of the total adjusted
the Childs mostly reflects a decrease in ground-water public-supply withdrawals. The difference between 74
discharge to the stream caused by increases in pumping and 85 percent (about 3.2 Mgal/d) is a limitation of the
at Falmouth well No. 2 (F-2G), Falmouth proposed site method used to distribute wastewater returnflow and
No. 3, and the Mashpee proposed Merganser well site, may be caused by the coarse model discretization
rather than a reversal of flow from the stream to the around surface-water bodies and along the coast.
aquifer due to induced infiltration. This change in
Although most of the water pumped for public
streamflow is consistent with the findings of Barlow
supply is returned to the flow system, streamflow and
and Hess (1993) for proposed test sites in Mashpee in
coastal discharge decreased from current to 2020
the vicinity of the Quashnet River.
conditions. Total streamflow depletion in the 2020
The estimated increase in pumping from 1994- simulation was approximately 8 percent, whereas the
96 to 2020 is based on estimates of future water decrease in coastal discharge was less than 2 percent
demand for the towns of Bourne, Falmouth, Sandwich, (table 4). Therefore, increases in public-supply
and Mashpee, and the MMR. The effects of increased withdrawals of the magnitude simulated in this
pumping at the Barnstable public-supply wells were investigation may have a significant effect on
not considered in this investigation because these wells
streamflow on western Cape Cod.
are located along the eastern boundary of the flow
model and are outside of the area of interest near the
MMR. It is assumed that model-calculated effects of DELINEATION OF CONTRIBUTING
increased pumping, as well as model-calculated AREAS TO SELECTED PUBLIC-SUPPLY
contributing areas, for these wells would be affected by WELLS ON WESTERN CAPE COD,
the specified-head boundary condition along the MASSACHUSETTS
eastern boundary of the modeled area and, therefore,
would not be accurate. A contributing area is defined as the area at the
The wastewater-return-flow component of water table through which water entering the ground-
recharge also increased from current conditions to water-flow system as recharge eventually flows to a
2020 conditions due to the increase in public-supply pumping well and is removed from the aquifer (Reilly
withdrawals. The wastewater return flow for 2020 and Pollock, 1993). This concept can be illustrated
conditions was estimated to be 21.6 Mgal/d. This using a simplified flow system (fig. 5) in which the
calculation is based upon the assumption that 85 only source of water being discharged from a well
percent of the water pumped from the future Long pumped at a constant rate is areal recharge at the water
Range Water Supply (LRWS) well sites (MMR sites 1, table. The area delineated at the water table provides a
2, 3, and 4) and the Town of Bourne replacement wells volumetric rate of inflow to satisfy the total rate of
(MMR sites 95-6 and 95-15) is returned to the flow discharge from the pumping well for steady-state
system as wastewater return flow. These wells are conditions.
16 Delineation of Contributing Areas to Selected Public-Supply Wells, Western Cape Cod, MassachusettsYou can also read