SEA ICE IN THE ALASKA REGION: THE REMARKABLE WINTER OF 2017-18 - ACCAP
←
→
Page content transcription
If your browser does not render page correctly, please read the page content below
NOV 2017–
                       APRIL 2018

             BROUGHT TO YOU BY THE ALASKA CENTER FOR CLIMATE ASSESSMENT AND POLICY IN PARTNERSHIP WITH THE ALASKA CLIMATE RESEARCH
                CENTER, SEARCH SEA ICE OUTLOOK, NATIONAL CENTERS FOR ENVIRONMENTAL PREDICTION, AND THE NATIONAL WEATHER SERVICE

SEA ICE IN THE ALASKA REGION:
THE REMARKABLE WINTER OF 2017-18
by John Walsh, Chief Scientist, International Arctic Research Center, UAF
The autumn and winter of 2017-18 will long be remembered for its unprecedented absence of sea ice in the seas surrounding Alaska.

                                                                The September minimum of pan-Arctic sea ice extent was the sixth lowest of the
                                                                39-year satellite record, which was low but not unprecedented. The unusually
                                                                late freeze-up of the Chukchi and Bering seas, however, soon became a focus of
                                                                attention of scientists as well as coastal residents. Historically, the Beaufort and
                                                                Chukchi Seas have undergone freeze-up in October, with essentially complete
                                                                ice coverage by early November. Figure 1 (upper panel) shows the ice conditions
                                                                on November 25 (Thanksgiving weekend) of 2017. While freeze-up had occurred
                                                                in the Beaufort Sea and in narrow strips along the northern and western coasts
                                                                of Alaska, the Chukchi Sea was essentially ice-free. The ice edge at 170°W was
                                                                located at 73°N, more than 400 miles north of Bering Strait. This extent of sea
                                                                ice in late November was far less than the previous late-November minimum,
                                                                which occurred in 2014 (Figure 1, lower panel).
                                                                   The large negative anomalies of sea ice continued into the winter months of
                                                                2018. While the Chukchi Sea eventually developed an ice cover by early January,
                                                                the Bering Sea’s ice cover was astonishingly deficient. As shown in Figure 2,
                                                                ice extent in the Bering Sea developed slowly, remained at record low levels in
                                                                January, and then began to decrease after reaching a maximum of about 400,000
                                                                km2 in early February. By contrast, the ice cover in most past years continued to
                                                                expand until late April when a seasonal maximum was typically reached. From
                                                                mid-February through mid-April of 2018, the Bering Sea’s ice extent averaged
                                                                about 50% of the previous record minimum.

                                                                Figure 2. Evolution of Bering Sea ice extent beginning October 1 from 1978-79 to 2017-18.
                                                                Thin grey lines represent individual years; thick black line is the median for 1981-2012. Red line
                                                                is 2017-18, blue line is 2011-12. Figure produced by Richard Thoman; data source: NSIDC Sea
                                                                ice index,Version 3.

Figure 1. Top panel: Map of sea ice concentration on
November 25, 2017. Red indicates essentially complete ice
(90-100% coverage), orange indicates 70-90% coverage.
Source: Sea Ice Desk, National Weather Service Alaska Region.
Lower panel: Ice extent in the Chukchi/Beaufort region on
November 25 of each year, 1978-2017. Source: Richard
Thoman, NOAA/NWS.

IMPROVING THE ABILITY OF ALASKANS TO RESPOND TO A CHANGING CLIMATE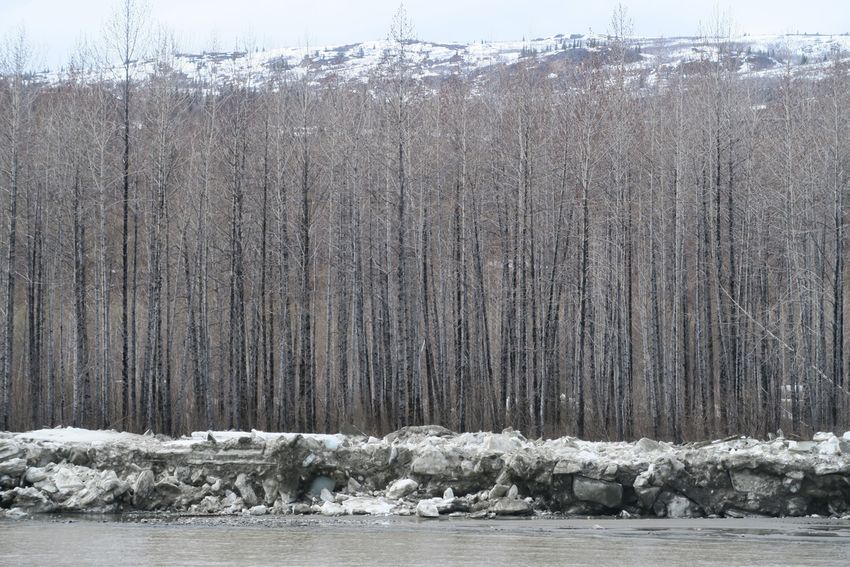
ALASKA CLIMATE DISPATCH • WINTER 2017–2018

   SEA ICE                                                                                                                                               2

 Figure 3. Sea ice coverage on March 31 of 2012 (left) and 2018 (right). Ice concentrations range from zero (dark blue) to 100% (brightest white). Source:
 National Snow and Ice Data Center, ftp://sidads.colorado.edu/DATASETS/NOAA/G02135/north/daily/images/

   Only six years earlier, during the winter of 2011-12 (blue
line in Figure 2), the Bering Sea’s ice extent was 3 to 4 times
greater than in 2018 (Figure 3). Figure 4 places the Bering Sea’s
anomalous ice cover into a pan-Arctic perspective by showing
the ice concentrations relative to the historical (1981-2010)
median position of the ice edge. (By convention, the ice edge is
defined as the 15% contour of ice concentration). It is apparent
from Figure 4 that the vast majority of the normally ice-covered
portion of the Bering Sea was ice free in late February of 2018.
The ice cover was also notably deficient in the Barents Sea and
the region north of Svalbard. The Sea of Okhotsk and the Baffin
Bay/Labrador Sea region, however, had relatively normal sea ice
coverage by historical standards.
   In the longer-term context, the Bering Sea had less sea ice in
early 2018 than in any winter since 1850, which is the start of
the historical record of Bering Sea ice cover (http://seaiceatlas.
snap.uaf.edu). Figure 5 compares the amount of sea ice in
February with the past 168 Februaries based on information
gathered from various sources: satellites (for the past 39 years),
historical ship logs (from whaling ships, marine transport
vessels), and the U.S. Coast Guard. According to Figure 5, the
Bering Sea’s ice “deficit” in February 2018 relative to previous
decades was approximately 170,000 square miles, which is
larger than the area of California.

Figure 4. Sea ice coverage on February 20, 2018. Ice concentrations range
from zero (dark blue) to 100% (brightest white). Source: National Snow and
Ice Data Center, ftp://sidads.colorado.edu/DATASETS/NOAA/G02135/north/
daily/images/
ALASKA CLIMATE DISPATCH • WINTER 2017–2018

   SEA ICE                                                                                                                                                 3
    Impacts of the absence of sea ice were widespread in Alaska’s
coastal communities. Throughout the Bering Sea, there was a
lack of, or extremely late development of, shorefast ice. With
little or no sea ice present, coastal communities had little
protection from the ocean. Flooding, loss of power, damage to
infrastructure, and build-up of ice on-shore occurred during
storms. At Utqiagvik, for example, waves pounded the shoreline
during a high-wind event on December 21 (Figure 6, upper
panel). As recently as the 1990s, Utqiagvik’s shore was “iced in”
by mid-October. At Shishmaref, a stretch of open water around
the community persisted into January. After the ice initially
formed, it repeatedly broke up during storms, allowing the surf
to push large ice chunks onto beaches. On Little Diomede Island
in the Bering Strait, a late-February storm caused power outages
and considerable damage (Figure 6, lower panel). Water and ice
                                                                                Figure 5. Bering Sea ice extent for February of each year, 1850-2018. Figure
rubble covered the beaches and the helipad and damaged the
                                                                                source: Zachary Labe, University of California-Irvine, based on data from Alaska
water treatment plant. Near Gambell, vast stretches of open water
                                                                                Sea Ice Atlas (http://seaiceatlas.snap.uaf.edu).
extended all the way to Russia until mid-March. During this time,
local residents reported an unusual absence of walrus in the area.
                                                                                   What caused the unprecedented sea ice season in Alaskan
                                                                                waters? While precise contributions of different factors have not
                                                                                yet been evaluated, several contributors are known. It appears that
                                                                                a “perfect storm” of these acting together led to the absence of
                                                                                sea ice. First, the waters of the Bering Sea were unusually warm.
                                                                                Some of this warmth is attributable to heat imported from the
                                                                                North Pacific and the Gulf of Alaska, where the “blob” of warm
                                                                                water had been noted from 2014-16. The low-ice year of 2016-17
                                                                                in the Bering Sea also may have allowed more absorption of solar
                                                                                radiation than normal in 2017. In this respect, the ice-albedo
                                                                                feedback may have amplified the gain of heat by the Bering Sea.
                                                                                Second, air temperatures over Alaska and surrounding seas were
                                                                                warmer than normal during the latter half of 2017. While these air
                                                                                temperatures may have been influenced by the below-normal sea
                                                                                ice coverage and warm ocean water in autumn and early winter,
                                                                                southerly winds also played a role. Third, stronger-than-normal
                                                                                storm activity of the autumn and winter also played a role through
                                                                                wind-forcing and mixing of the upper water layers of the Bering
                                                                                Sea. Because many of the storms tracked through the Bering and
                                                                                Chukchi Seas, the winds over the coastal waters had a stronger
                                                                                southerly component than usual. The winds drive the currents
                                                                                (and sea ice) northward, in addition to advecting warm air over
                                                                                the region. Preliminary storminess metrics indicate that the
                                                                                winter of 2017-18 was among the five stormiest (although not “the”
                                                                                stormiest) of the past 70 years. The fact that an unprecedented
                                                                                absence of sea ice occurred during a winter that was not the
                                                                                stormiest on record indicates that the other factors highlighted
                                                                                above were also at work in limiting the sea ice cover.
                                                                                   The sea ice conditions of the past autumn and winter are
                                                                                consistent with climate model projections of diminished ice cover
                                                                                in the future. Although it may be a decade or longer before these
                                                                                winters become typical, there will likely be similar winters in
                                                                                future decades. For the immediate future (i.e., the next few years),
Figure 6.Wave activity at the coasts of Utqiagvik on December 21, 2017 (upper
panel) and Little Diomede on February 20, 2018. Photo credits: Craig George
                                                                                winter sea ice formation in Alaska’s western waters will likely
(upper) and Carla Ahkvaluk (lower).                                             remain low if the warm waters in the Bering Sea persist.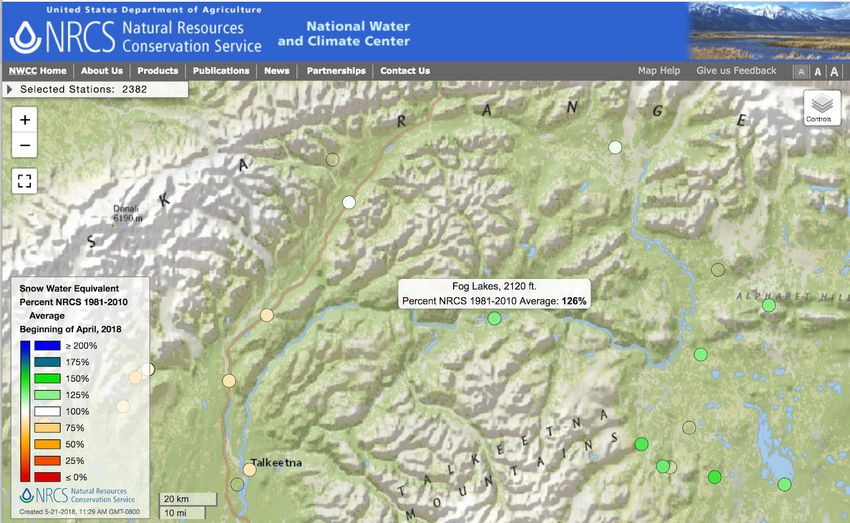
ALASKA CLIMATE DISPATCH • WINTER 2017–2018

   CHANGING SNOW                                                                                                                                       4
ALASKA'S CHANGING                                                               approximately 1.5" (estimate) over the intervening 22 hours. Over
                                                                                the course of a season, this can really add up. National Weather

SNOW                                                                            Service directives allow for snow measurements to be taken every
                                                                                6 hours to minimize this effect.

By Brian Brettschneider, International Arctic Research Center (IARC),           WIND
UAF
                                                                                Windy areas are notoriously difficult for measuring new snow.
“Let It Snow! Let It Snow! Let It Snow!” – Vaughn Monroe                        Even with new, modern equipment that allows snow to settle into
                                                                                a recording instrument, snow that falls sideways is often missed.
The two best metrics for describing the severity or intensity                   This leads to a significant underestimate of new, daily snow.
of a winter are temperature and seasonal snowfall. As a                         Alternatively, new snow is often estimated by the change in snow
climatologist working in Alaska, I am asked two questions most                  depth over consecutive days. This has its own set of issues related
often. Alaskans want to know how much snow we will get in                       to the variable nature of where snow drifts accumulate and where
the upcoming (or ongoing) winter. People from Outside want                      they do not. While the technique of estimating new snow from
to know how much the climate is really changing in Alaska. In                   changes in depth is generally accurate, the liquid equivalents
this article, we will tackle both subjects at once. Specifically, we            collected at automated stations suffer from the same undercatch of
will look at changes in snow and snow depth over the decades                    snow.
at several stations around Alaska. Has the amount of snowfall
mirrored the changes in temperature? Does snow stick around                     SITING
less than it used to? Does the intraseasonal distribution of snow               The presence of structures or trees near measurement locations
differ from prior decades?                                                      can have a significant effect on snow readings. If the measurement
                                                                                site is near a building, an undercatch of falling snow and an
                                                                                overcatch of snow blowing off a roof can lead to spurious results.
SNOW MEASUREMENT VARIABILITY                                                    For snow depth, the presence of structures greatly affects
                                                                                the thickness of drift piles. Trees are also very important to
TECHNIQUE                                                                       snow measurements. They slow down wind and allow for the
Of all the daily climate variables, measurements of snow are                    accumulation of drifting snow and provide shade for nearby
the most likely to vary as a function of observer technique. Two                fields of snow. For example, Anchorage's official snow station,
people, at the same location, measuring at the same time, can                   the NWS office on Sand Lake Road, is surrounded by trees. This
record different values for snow and snow depth. This can be due                provides shade for the snow and prevents Chinook winds from
to several factors. First and foremost is the timing and frequency              melting snow. Pre-1998, the snow measurements were taken
of observations. If 2" of snow falls at 8 a.m., a measurement at                at the Anchorage International Airport—a wide open space.
noon will record 2". But if measurements are scheduled only                     This difference is very apparent in the trends of snow depth for
once daily at 6 a.m., the 2" snowfall will have compressed to                   Anchorage.

       Snow measured                                                                   Snow measured in
       under a tree!                                                                   the open!

       Notice that only 3.0 inches of snow has accumulated here
                                                                                                Whereas 6.5 inches has fallen in the open

These slides from the Community Collaborative Rain, Hail & Snow Network (CoCoRaHS) Citizen Science training shows the effect of siting on snow depth measures.
From https://cocorahs.org
ALASKA CLIMATE DISPATCH • WINTER 2017–2018

  CHANGING SNOW                                                                                                                                       5
STATIONS AND METHODOLOGY
To look at changes in snow and snow depth over time, we need to find
appropriate time periods to compare and a balance between the length of time
versus the number of stations to evaluate. Shorter time periods allow us to
capture more stations and thus geographical trends. Longer periods are better
for capturing trends over time, but few stations in Alaska have a long record and
thus the spatial coverage is sparse. A compromise for this study is to compare
the most recent 30-year period (1988-2017) with the preceding 30-year period
(1958-1987). In Alaska, 16 of the 19 NWS first-order stations have 20 or more
complete seasons of snow and snow depth data during both time periods. These
records are long enough to provide meaningful representations of changes in
the last 60 years; however, caution is advised when extrapolating these trends as
markers of climate change [caveat emptor].
   Unlike temperature, precipitation (liquid and frozen) is strongly skewed.
Even a very snowy winter might only record measurable snow on 1/3 of all days.
Mapping skewed data is fraught with problems. Traditionally, averages/normals
are used for annual, monthly, and daily temperatures. For precipitation,
averages are not generally the best metric, and medians (the "middle value") are
more commonly used. Figure 1 compares using median (panel a) and average
(panel b) values side-by-side to reflect changes in snowfall over our two time
periods.

      Figure 1. Snowfall change between 1988-2017 and 1958-1987. Upper panel shows the
      difference between the median values of both time periods and lower panel b shows the
                                   difference between the average value of both time periods.

CHANGES IN SEASONAL SNOWFALL
TOTAL AMOUNT
In Figure 1, the change in snowfall from 1958-1987 to 1988-2017 is noted by colors ranging from blue (more snowy) to orange (less
snowy). Note that these changes are in absolute units (inches) and not percentages. A 5" change in annual snow is much more significant
in Kodiak than in Valdez. Since the amount (volume) of snow is important for climate and ecological analyses, changes in inches are
used throughout. Figure 1 clearly shows an increase in measured snow in northern and western Alaska, while in Southeast, snowfall has
decreased. Central portions of the state show a mixed signal. These transition zones are where the difference between using the median
and the average are most apparent.

                                                               DAYS WITH MEASURABLE SNOW
                                                               In far northern Alaska, measurable snow (0.1" or more) falls on 40% (or more) of
                                                               winter days. With cold temperatures and high humidity, it doesn’t take much to
                                                               squeeze a little snow out of the air. Farther south, snowy days are less common.
                                                               How have the number of snowy days in regions of Alaska changed between the
                                                               two 30-year time periods? Figure 2 shows the change in days with measurable
                                                               snow. There is an increase in snowy days from south to north generally from
                                                               Southcentral to the North Slope. Little change is noted along the west coast, and
                                                               a noticeable drop occurred in Southeast.

                                                               Figure 2. Difference in the number of days with measurable snow for the most recent 30-year
                                                               period (1988-2017) compared to the previous 30-year period (1958-1987).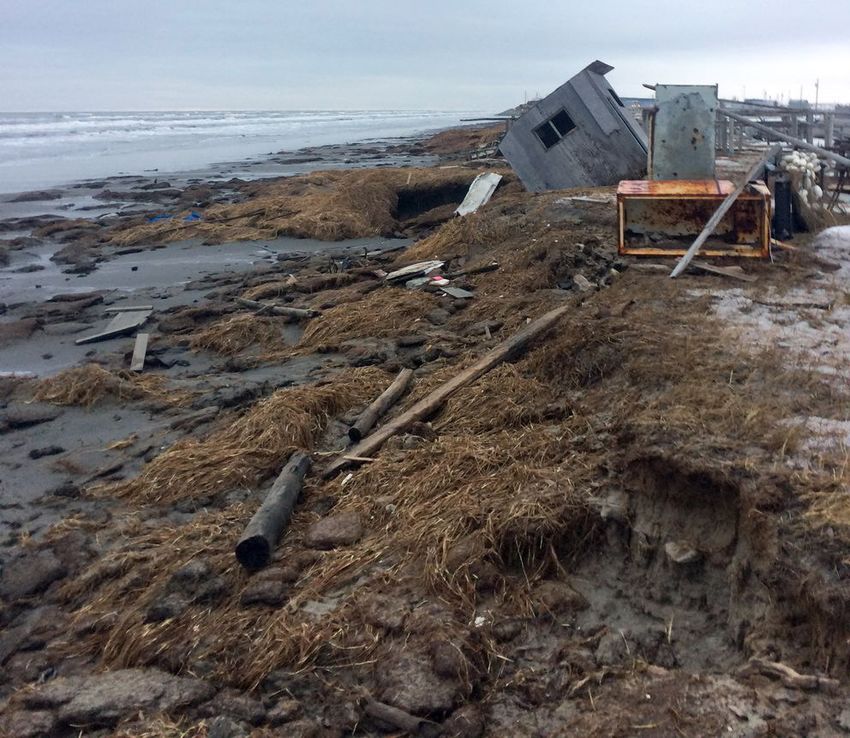
ALASKA CLIMATE DISPATCH • WINTER 2017–2018

    CHANGING SNOW                                                                                                                                          6
DAYS WITH 1"+,3"+, AND 6"+ OF SNOW
Moving past fleeting snow events to track more substantial snowfalls (1" or
more), the patterns change somewhat (Figure 3). A sizeable increase in 1"+
snow event frequencies is noted in most of mainland Alaska except for the area
just north of the Alaska Range. Once again, in Southeast, a region-wide drop
occurred. Is it noteworthy that we see an increase in 1"+ snowfall days (Figure
3) but not measurable days (Figure 2) along the west coast and North Slope?
Looking at Figure 4, a similar pattern emerges when we evaluate the change
in heavier (3"+) snowfall days. The pattern is distinct, but does not explain the
strong patterns for seasonal snowfall totals shown in Figure 1.
   Only when we see Figure 5 (change in 6"+ snowfalls) can we fully understand
the increase in annual snowfall totals. Most stations in mainland Alaska show
an increase in these very heavy snow events. If a station averages 60" snow per
season, the addition of an extra 6" snow event is a substantial contributor to the
total. If we assume that the extra 6" snow event “used to be" a 4" or 5" event, that                 Figure 3. Difference in the number of days with 1"+ snow for
additional 1" or 2" is 2% or 3% of the season total.                                                 the most recent 30-year period (1988-2017) compared to the
                                                                                                     previous 30-year period (1958-1987).
DURATION OF THE SNOW SEASON
Having snow on the ground is extremely important for the energy budget of
a region—and the planet. Snow is very reflective. Solar rays striking snow are
mostly reflected back into space. One of the reasons that the Arctic is warming
faster than the rest of the planet is due to loss of snow and ice. Without that
snow and ice, particularly in the fall and spring, solar energy is absorbed by the
ground and warms the surface.
    How do we define the snow season beyond how much snow falls? One
metric is the first and last dates that snow falls. For most places in Alaska,
measurable snow often falls after the winter snow pack has melted off, making
this last snow event important from ecological and planning perspectives.
Snowfall dates are also very important for issues related to transportation and
transportation infrastructure.
    Figure 6 shows the change in first and last dates where at least 1" of snow
falls on a day. I chose this value, as opposed to measurable, because very small
snow amounts are prone to major outlier events. These outliers can mask true
patterns. Again, the colors in Figure 6 represent more wintry (blue) and less                        Figure 4. Difference in the number of days with 3"+ snow for
wintry (orange). Positive values in the left panel (orange) indicate that the first 1"               the most recent 30-year period (1988-2017) compared to the
snow of the season falls later in the most recent 30-year period. Negative values                    previous 30-year period (1958-1987).
in the right panel (also orange) indicate the last 1" snow of the season falls
earlier in the most recent 30-year period. It is plainly apparent that 1" snows are
starting later and ending earlier.

Figure 6. Difference in the first (left panel) and last (right panel) dates where at least 1" snow
                                                                                                     Figure 5. Difference in the number of days with 6"+ snow for
fell for the most recent 30-year period (1988-2017) compared to the previous 30-year period
                                                                                                     the most recent 30-year period (1988-2017) compared to the
(1958-1987).
                                                                                                     previous 30-year period (1958-1987).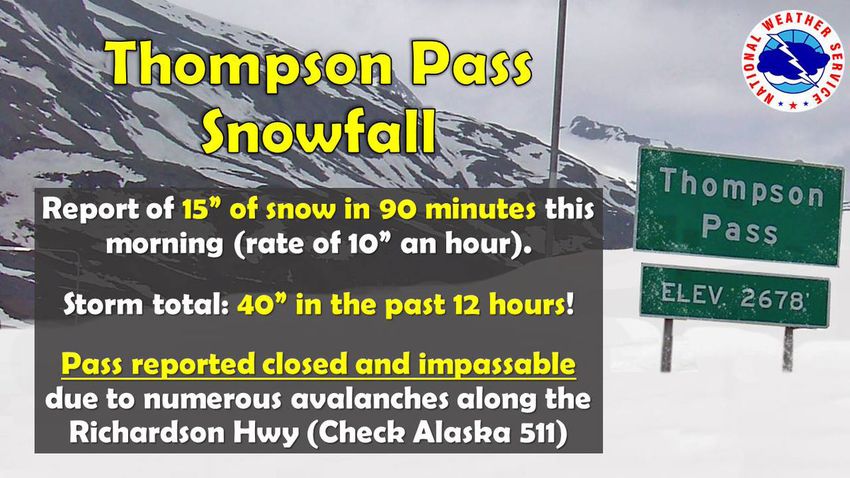
ALASKA CLIMATE DISPATCH • WINTER 2017–2018

   CHANGING SNOW                                                                                                                                                7
                                                                     When we evaluate a larger snowfall amount—at least 3"—the results are less
                                                                  clear. Since the number of 3" events per season for most locations is small (fewer
                                                                  than 10 for the majority of stations), the variability in the dates is very large.
                                                                  Therefore, even though the data are presented in Figure 7, there is not a lot to be
                                                                  read into the changes due to that small sample size.
                                                                     Another metric is the number of days with any snow on the ground and how
                                                                  that number has changed. Figure 8 shows the change in the number of such
                                                                  days. With the exception of Anchorage and Valdez, the number of days with
                                                                  snow on the ground has decreased everywhere. In the case of Anchorage, the
                                                                  change in snow depth measurement location from the Anchorage International
                                                                  Airport to the NWS Office in 1998 is largely responsible for the observed
                                                                  increase. The new location is more shaded and sheltered and protects the snow
                                                                  from the wind and sun.

                                                                  CHANGES IN SNOW PACK AND DEPTH
                                                                  SNOW PACK
                                                                  Another way to think of the snow season is to consider the length of the
                                                                  continuous winter snow pack. The snow that falls very early or very late in the
                                                                  season often melts within a day or two and may not contribute to the winter
                                                                  snow pack. This is important because the snow pack is a hydrologic reserve that
                                                                  largely determines when plants and animals are active. The health of the winter
                                                                  snow pack is threatened by warm temperatures, rain, and the high sun angle
                                                                  once we reach the spring season. A strong snow pack acts as a hydrologic buffer
                                                                  if the spring months are abnormally dry.
                                                                      The panels in Figure 9 show the changes in the dates of the period of
                                                                  continuous winter snowpack were established (left) and melted out (right). For
                                                                  each season, I chose the longest stretch of days where snow was on the ground
                                                                  continuously. A minimum value of 14 days was required for inclusion.
Figure 7. Difference in the first (upper panel) and last (lower
                                                                      Little change is noted in the dates where winter snow pack is first established.
panel) dates where at least 3" snow fell for the most recent
                                                                  This matches the findings in the first panels of Figures 6 & 7, which show
30-year period (1988-2017) compared to the previous 30-
year period (1958-1987).                                          the change in dates of when the first snows arrive. In western, northern, and
                                                                  southeastern Alaska, the snow pack melts off significantly earlier during this
                                                                  most recent 30-year period. In the central part of the mainland, the patterns
                                                                  are not as distinct. The early melt out of snow shown in Figure 9 leads to the
                                                                  obvious conclusion that the length of continuous snow pack is lower in many
                                                                  areas. Figure 10 (next page) shows that this is indeed the case. Other than the
                                                                  corridor from Anchorage to Fairbanks, every other place else has a shorter
                                                                  period of continuous snow cover.

Figure 8. Difference in the number of days with 1"+ snow on
the ground (depth) for the most recent 30-year period (1988-
2017) compared to the previous 30-year period (1958-1987).
                                                                  Figure 9. Difference in the first (left panel) and last (right panel) dates where the longest period
                                                                  of continuous winter snowpack was established and melted out for the most recent 30-year
                                                                  period (1988-2017) compared to the previous 30-year period (1958-1987).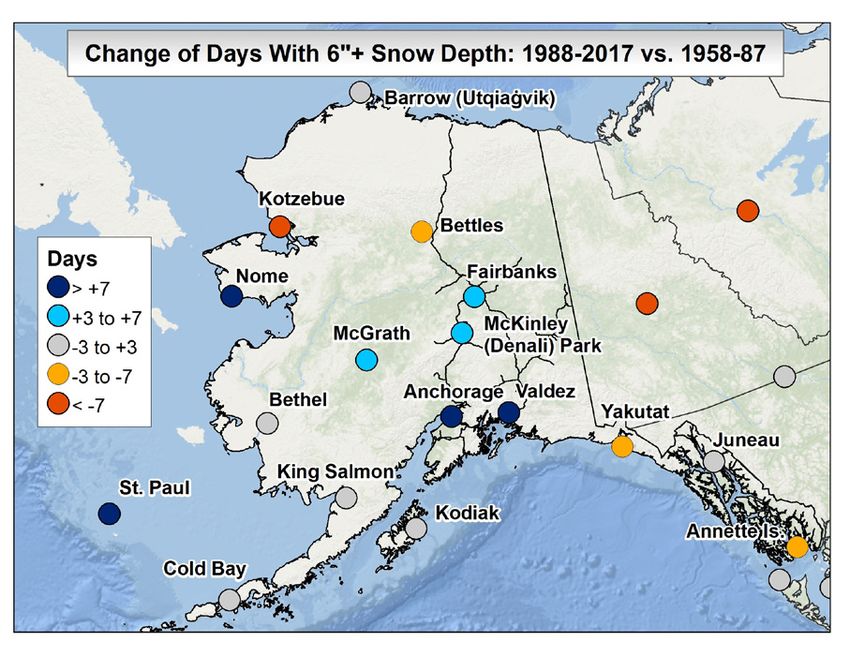
ALASKA CLIMATE DISPATCH • WINTER 2017–2018
CHANGING SNOW 8
CHANGES IN SNOW DEPTH
The amount of snow present on the ground is called the snow depth. Snow
depth is usually measured around 7:00 a.m. and is always recorded in whole
inch increments (plus Trace). As snow falls throughout the season, the depth
increases. As warm temperatures, direct sun, or rain falls, the depth decreases.
Figure 10 shows the change in number of days with snow at least 6" deep. Unlike
the 1"+ depth map in Figure 8, a number of stations have notably increased the
number of days with a deep snow cover. This may be a result of larger snow
events during the low sun angle season. If more snow falls in October, for
example, the sun will directly melt or sublimate some of the snow—even with
cold temperatures. On the other hand, if more snow falls in mid-winter when
solar radiation is lower, the snow depth will stay higher. Also, wind promotes
snow melting/evaporation. If there is a reduction in wind (not analyzed), the
snow depth would remain higher.
Figure 10. Difference in the number of days with continuous
CONCLUSIONS snow pack for the most recent 30-year period (1988-2017)
Snow and cold define Alaska. As the Earth warms, snow will slowly become less compared to the previous 30-year period (1958-1987).
prevalent in the state. Most of the figures presented here show that despite some
regional variability, snow is generally holding up fairly well in most places in
Alaska—albeit with a slight decline.
But this impression may be something of an illusion. As temperatures rise,
areas where a majority of snow events occur near the freezing point, such as
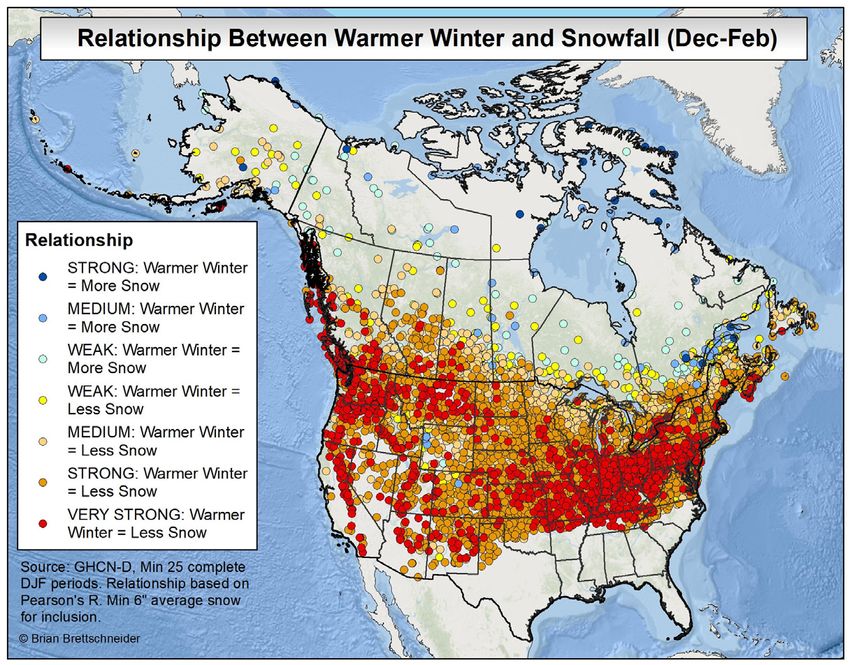
Southeast Alaska, will transition to more frequent rain events. In Figure 12, the
relationship between changing winter temperatures and snowfall is shown. In
Alaska, warming temperatures enable the atmosphere to hold more moisture,
but since winter temperatures are still well below freezing in most locations,
relatively few of the snow events become pure rain events. This effect allows for
an increase in snowfall in many locations, which may be most clearly reflected in
the increasing snow amounts (Figure 1) and snow depths (Figure 11).
Outside of mainland Alaska, rising temperatures dramatically impact winter
snow totals. Note the overwhelming preponderance of orange and red dots
in the Lower 48 in Figure 12. For southeast Alaska, the future is already here.
Warming temperatures have dramatically reduced seasonal snowfall totals.
There is no reason to expect that this trend will not encroach farther north into
mainland Alaska in the coming decades. Figure 11. Difference in the number of days with 6"+ snow on
the ground (depth) for the most recent 30-year period (1988-
2017) compared to the previous 30-year period (1958-1987).
Analyses of a broad range of data
relating to Alaska climate and weather
are available on the Alaska Climate Info
Facebook page: https://www.facebook.com/
AlaskaClimateFacts
Figure 12. Relationship between December-February
temperature and December-February snowfall between 1981
and 2017. Stations divisions mapped based on significance of
Pearson’s R value.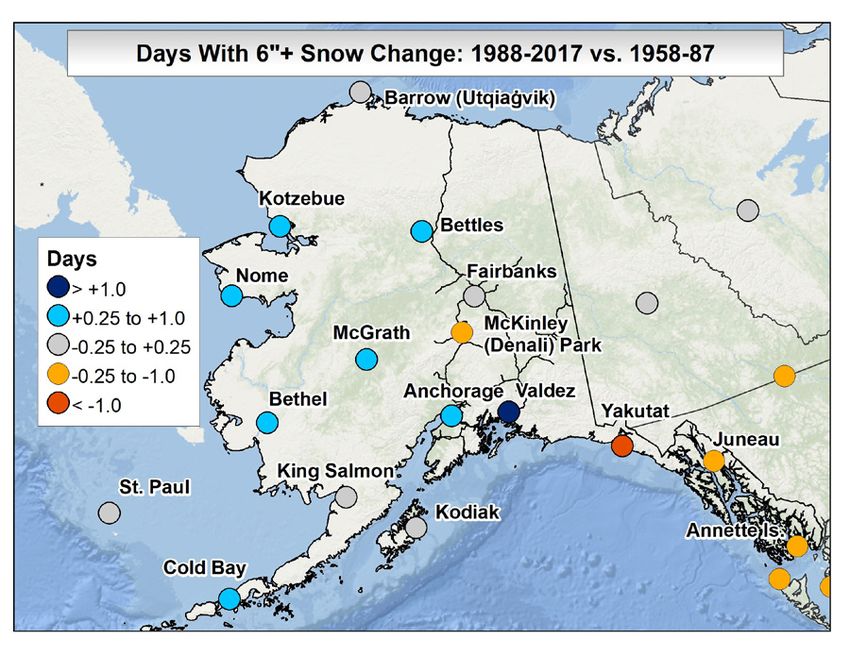
ALASKA CLIMATE DISPATCH • WINTER 2017–2018
SUSITNA FLOOD IMPACTS 9
THE WATER COLUMN: 2018 SUSITNA RIVER ICE JAM
FLOOD IMPACTS ON THE ALASKA RAILROAD
By Jessica Cherry, Alaska Pacific River Forecast Center, National Weather Service
Breakup season in Alaska is a big deal. When the
sun starts swinging higher in the springtime sky,
temperatures tick upwards, and snow and ice begin
to melt. Many of Alaska’s rivers are prone to ice
jam flooding, where sheets of ice block water like
a dam, causing flooding from the jam point and
upstream. These floods often lead to big impacts
in our rural communities. Most of Alaska’s non-
coastal villages are on rivers, and many of these are
far from the limited Alaska road system.
In fact, the majority of Alaska’s most expensive
natural disasters have been related to ice jam
flooding: the cost of the 2013 ice jam flooding in
Galena alone was on the order of $50 million. For
these reasons, the State of Alaska’s Division of
Homeland Security and Emergency Management
(DHS&EM) and the National Weather Service’s
(NWS) Alaska-Pacific River Forecast Center
(APRFC) have collaborated on an aircraft
Figure 1: ice boulders left on the bank of the Susitna River after May 2018 ice jam flooding.
reconnaissance program called Riverwatch for over
Photo credit: J. Cherry, NWS/APRFC
four decades. The Riverwatch program focuses on
the large Yukon and Kuskokwim Rivers and pairs
NWS hydrologists with DHS&EM personnel. These
teams fly over the rivers to assess ice conditions
and then communicate that information to local
residents through radio, TV, and social media. On
occasion, community leaders also participate in
these flights to gain a better perspective of the flood
potential or extent and may communicate those
insights to communities in their native language.
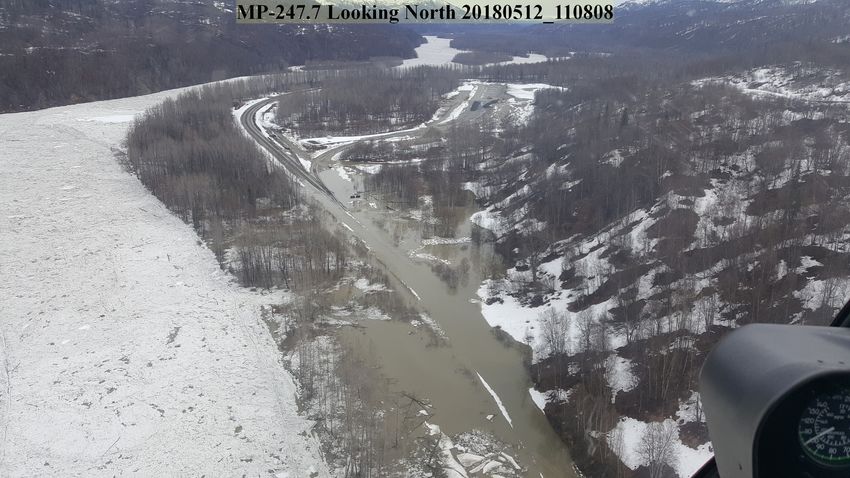
In 2018, though, the most significant ice jam
impacts occurred on the Susitna River in mid-
May, on a roadless section of the Alaska Railroad
corridor, near a place called Curry (Figure 1). When
the jam released down towards the more populated
area of Talkeetna, residents described it as a ‘wall
of water and ice’ flushing through. The railroad
was forced to shut down on May 12 and returned
to service on the evening of May 16, with operating
losses of $1 million/day, in addition to the cost of
repairs. Rail was displaced 25 feet in some sections,
and the ballast that holds up the rail ties washed
away.
In this stretch of the Susitna River, north of
Talkeetna, the railroad follows right along the
bank, because the terrain rises on either side of the Figure 2: USGS Gage record from station upstream of flood impacts. Image: NWS/APRFC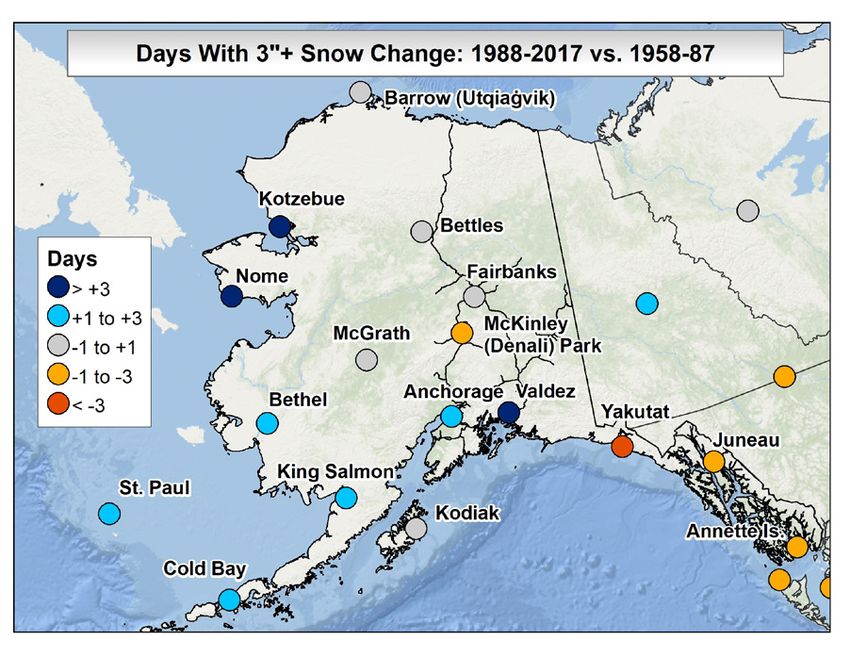
ALASKA CLIMATE DISPATCH • WINTER 2017–2018

   SUSITNA FLOOD IMPACTS                                                                                                                   10

Figure 3: Alaska Railroad flooding near Curry, AK at Milepost 247.7 on May 12, 2018. Image: Courtesy of AKRR.

                                                                                 railroad infrastructure, with a team of engineers, accountants,
river. This rising terrain ultimately forms Devil’s Canyon further               and environmental scientists. The train slowed to a crawl through
upstream. The railroad’s close proximity to the river near Curry                 the lower flooded sections, and we took photos and video from an
makes it vulnerable to erosion, even in summer, and the shape                    open box car. At Curry, the team disembarked and got in road-rail
of the channels tend to trap sheets of ice that come down from                   vehicles (also called hi-rail trucks) and proceeded to a section of
Devil’s Canyon. In the 1920s a hotel was built at Curry for summer               rail where maintenance crews were still working. We talked with
vacationers, and later for skiing, which operated until it burned in             the crew about the resources and effort required to maintain the
1957. Now Curry is home to an important gravel quarry that helps                 track through this type of ice jam event. Afterward, we boarded a
the Alaska Railroad Corp (AKRR), a state-owned corporation,                      southbound train again at Curry, and rode it back to Talkeetna.
maintain the railroad infrastructure.                                               Of course, as hydrologists, we wondered how we might be
    On the APRFC forecast desk, our first indication of an issue                 better able to forecast these events. According to Superintendent
was sharply rising water on a stream gage maintained by the USGS                 Tesch, the USGS gage that operated from 2011-2016 on the Susitna
on the Susitna river at Gold Creek, more than 20 miles upstream                  River near Tsusena Creek and Chulitna was used to identify ice
of Curry on the night of May 11 (Figure 2). AKRR maintenance                     damming and water build up some 5 hours before it would get to
superintendent Lloyd Tesch discovered the flood on his rounds                    Gold Creek. This was valuable information for a similar ice jam
and called for the southbound train to reverse course back up to                 flood in 2009. Five hours is enough time to get a passenger or
Denali Park. A helicopter survey on Saturday, May 12, showed                     freight train to safe grounds. Unfortunately, this Tsusena Creek
whole mile-long sections of track were devastated, and flooding                  gage was discontinued after 2016. The USGS still maintains a
left behind huge ice pans and chunks along surviving tracks in                   camera in the area, which takes pictures of the river once an hour
that area (Figure 3). AKRR environmental analyst Jeanette Holt                   throughout breakup, but these images are not telemetered. They
talked to the APRFC about what was and wasn’t known about the                    remain on that camera until downloaded and are not available to
event, and AKRR lead accountant Wendy Richerson invited us to                    warn stakeholders of ice conditions.
join their team for the flood impacts assessment.                                   A database maintained by the US Army Corps of Engineers
    Just a day after service resumed, APRFC staff members                        suggests that there have been more than a dozen ice jam floods in
boarded a whistle-stop train at Talkeetna and headed to the                      this area of Alaska since records began. In some areas of the state,
flood sites with AKRR and other agency personnel. This was a                     the APRFC uses data from the NWS and partner agencies, like
unique opportunity to learn more about how flooding impacts                      the USGS and the USDA Natural Resources Conservation Service,
ALASKA CLIMATE DISPATCH • WINTER 2017–2018
SUSITNA FLOOD IMPACTS 11
to provide an outlook on the likelihood of breakup
flooding, compared to average. Unfortunately,
despite the importance of railroad infrastructure to
the state and the vulnerability of this particular area
along the Susitna, there is very little data on snow
depth, ice thickness, and even air temperatures in
the area near the flooding.
Fish Lake, just south of Talkeetna, is the closest
site where the NWS has river ice and snow on
ice measurements (Figure 4). This provides some
indication that the Susitna River ice may have been
thicker than average, with a below-normal snow
cover. However, this site, which is not very close to
the flood site, did not show particularly thick ice
during the prior significant flood in 2009. Freezing
degree days (Figure 5, the sum of the average daily
degrees below freezing over the cold season) at
Talkeetna do not suggest air temperature was a
factor in making ice thicker than normal, although
Talkeetna is still a long distance from the source
region of the ice that jammed in the river. That Figure 4: Ice Thickness and Snow Depth on Fish Lake near Talkeetna, AK. Data: NWS.
would have been further upriver, in Devil’s Canyon.
We can also look at snow depth on the ground
(Figure 6). Snow depths at the start of March,
April, and May all show an interesting pattern of
anomalies. High elevation sites near the Susitna
River headwaters had above normal snowpacks
while lower elevation sites near Talkeetna had
below normal snowpacks. Finally, air temperatures
at Talkeetna and Chulitna offer one last clue
(Figure 7a,b), showing a period of relatively cool
temperatures during the last week of April and the
first week of May, followed by a sharp rise for three
above normal temperature days. This may have been
the push the river needed to mobilize large sheets
of ice prone to jamming, before they could begin
melting in place. Figure 5: Freezing degree days in the current and past water years, and the average at Talkeetna
airport. Data: NWS.
Figure 6: Snowpack observations at the start of April, 2018 in
the upper Susitna River basin.ALASKA CLIMATE DISPATCH • WINTER 2017–2018
SUSITNA FLOOD IMPACTS 12
Here at the APRFC, we will continue to study
this event and work with the Alaska Railroad to
identify what we call Impact-based Decision Support
Services (IDSS) that we can help provide along with
our other core partners. Different environmental
monitoring methods include Riverwatch-style
aerial reconnaissance, more weather stations and
river gages, remote cameras that transmit over
satellite, and even satellite imagery, but these efforts
all cost time and money, and costs of monitoring
add up. Other approaches could include AKRR
training their maintenance and operations crews to
recognize the threat of ice sheets coming down from
Devil’s Canyon. Extra precautions may be in order
if breakup has not yet occurred when the summer
passenger train schedule is set to begin. Breakup in
the upper Susitna River was very late this year, in
part because of the relatively cool air temperatures
in late April and early May. It didn’t take much: just
three warm days after that cool spell, and the ice
pushed downstream in large sheets. Had a tourist
train passed by at that very moment, it certainly
would have been a trip to remember.
Figure 7: daily air temperatures from Talkeetna (above) and
Chulitna River, AK (left). Data: NWS. Image: xmAcis.ALASKA CLIMATE DISPATCH • WINTER 2017–2018 NOV 2017–APRIL 2018 SUMMARY 13 CLIMATE AND WEATHER SUMMARY: NOVEMBER 2017-APRIL 2018 By Rick Thoman, National Weather Service SUMMARY: WINTER 2017-18 The winter of 2017-18 was remarkable in many respects. The 6 month October through March “cold season” was the warmest of record (since 1925) from the Aleutians northward across western Alaska and North Slope. Much of the rest of the state was also unusually mild (Figure 1). The primary exception was the eastern Gulf of Alaska and Southeast, where temperatures were not too far from normal over the 6 month period. At Anchorage, while overall temperatures were close to normal, the low temperature at the Anchorage Airport for the entire winter was only -2°F, on several days in early February. This ties with the winter of 2002-03 as the second mildest winter low temperature. The only winter in Anchorage that failed to have even one day below 0°F was 2000- 01, when the low was +2°F. Snowfall at Anchorage Airport was below normal but higher than 3 of the past 4 years. The lowest temperature of the season at Fairbanks was -33°F. This is the fourth highest Figure 1. Alaska regional average temperatures for October winter low in more than 110 years of climate observations. Total snowfall at 2017-March of 2018. Much of the state was unusually mild, Fairbanks was just over 85". While not even in the top ten snowiest winters, and a broad area from the Aleutians northward was the it was the most snow in the past 25 winters. At Juneau, temperature finished warmest on record for the 6 month period. up slightly below normal for the winter. Snowfall was close to average but was more than the past several winters. NOVEMBER November was an eventful month over much of Alaska. Western Alaska was quite stormy and mild, while Southeast Alaska was unusually cold and snowy. The average temperature at Utqiaġvik (Barrow) in November was 17.2°F, more than 16.5°F above the 1981-2010 normal and easily the warmest November in the past 98 years. The average temperature at St. Paul of 39.4°F was more than 6°F above normal and made this the second warmest November; the only warmer November was back in 1926. It was a different story over Southcentral and especially the Panhandle. Juneau airport recorded an average temperature of 27.2°F, which is more than 6°F below normal and the coolest November since 2006, while snowfall totaled 26.7", the highest November total since 2011. The Snettisham Power Plant, southeast of Juneau, totaled over 4' of snow in November, the highest low elevation snowfall reported in the state. Parts of Interior Alaska were also unusually snowy. Over 2' of snow fell at Fairbanks, with up to 40" at higher elevations north of town. The Airport total of 24.6" was enough to make this the seventh snowiest November in the past century.
ALASKA CLIMATE DISPATCH • WINTER 2017–2018

   NOV 2017–APRIL 2018 SUMMARY                                                                                                                     14
                                                                                                          A moderately strong storm moved across the
                                                                                                      Chukchi Sea November 11 and 12. With near-
                                                                                                      record low ice cover over the Chukchi for so late
                                                                                                      in the autumn (see page 1 and Figure 2), the long
                                                                                                      fetch of winds over the open water brought coastal
                                                                                                      flooding and severe erosion to several communities.
                                                                                                      Hardest hit were the northern Seward Peninsula
                                                                                                      communities of Shishmaref (Figures 3 and 4), where
                                                                                                      the road to the landfill suffered serious erosion,
                                                                                                      and Deering, where a home was evacuated and the
                                                                                                      airstrip cut off for about half a day. Minor flooding
                                                                                                      also occurred at Kotzebue, where some parking
                                                                                                      areas were inundated. Another storm November
                                                                                                      19 produce a whopping 22" of snow at the Iliamna
                                                                                                      Airport. A week later a strong, slow-moving storm
                                                                                                      brought a long period of high winds to the central
                                                                                                      and eastern Aleutians on November 26. Peak
                                                                                                      winds were around 90 mph at Adak, Atka, and
                                                                                                      Dutch Harbor. Wind gusts this strong are high but
Figure 2. On October 31, 2017, NASA's Aqua satellite captured this mostly cloud-free view of the      not excessive by Aleutian standards; notable was
Seward Peninsula and the Bering Strait.The autumn sun is low in the sky this time of year, and        the long duration of the high winds. At Atka, the
the mountains and clouds cast long shadows. But despite the approaching polar night, sea ice          average sustained wind speed between midnight
had yet to accumulate significantly in the region's protected waters. For much of the winter, near-   and noon on the 26th was over 50 mph, with winds
shore sea ice remained thin and unstable, with negative consequences for coastal communities.         gusting past hurricane force (75 mph) during that
NASA satellite image from Worldview.
                                                                                                      time.
                                                                                                          The temperature at Kodiak on November 1
                                                                                                      soared to 57°F, easily breaking the previous record
                                                                                                      high for the date of 52°F set in 2003. Two days later,
                                                                                                      on November 3, the temperature again topped out
                                                                                                      at 57°F, breaking the previous record of 54°F set in
                                                                                                      1936. Both of these readings are the second highest
                                                                                                      temperature of record at Kodiak for November
                                                                                                      (since 1930). The only milder November day was in
                                                                                                      2013, when the high temperature on the 14th was a
                                                                                                      balmy 59°F.

Figures 3 & 4. Roads and structures were heavily damaged in Shishmaref during a storm in the first week of November 2017. Photos provided by City of
Shishmaref.
ALASKA CLIMATE DISPATCH • WINTER 2017–2018
NOV 2017–APRIL 2018 SUMMARY 15
DECEMBER
December was an exceptionally mild winter month across much of Alaska, but
especially over northern and western portions of the state. A number of long-
term climate stations shattered previous records for the mildest December.
For the state as a whole, the National Centers for Environmental Information
(NCEI) reported that this was the warmest December since records began in
1925, with the average temperature more than 15°F above 20th century average
and 2°F above the previous warmest December of 1985. At McGrath, the average
temperature for the month of 19.3°F was more than 22°F above normal and
was 8°F warmer than the previous warmest December. Both Kotzebue and
Utqiaġvik (Barrow) were more than 5°F warmer than any previous December.
At Fairbanks, the average temperature of +9.0°F made this the mildest
December in more than a century.
In Southeast Alaska, December start off with very mild weather. Juneau Figure 5. A truck drives through an open lane after a mudslide
Airport set or tied daily record highs 5 days during the month, including 54°F on December 11 in Juneau.The slide happened near the
on December 8, which tied the all-time monthly record. At Sitka, the low intersection of Mill Street and Thane Road south of downtown
temperature on December 7 was 53°F, easily the warmest low temperature there Juneau. Photo by Rashah McChesney/Alaska’s Energy Desk,
from KTOO Media report.
for any December day. Even milder air pushed into southern Southeast on the
11th, when both Wrangell and Metlakatla reached 60°F or higher. Unlike western
Alaska, temperatures in Southeast took a sharp downturn late in the month, and
as a result month averages were closer to normal than the remainder of the state.
The same weather pattern that brought the very mild weather to the
Panhandle early in the month also brought heavy precipitation to the Prince
William Sound area. Thompson Pass, at 2678' elevation on the Richardson
Highway, is one of the snowiest places in Alaska that people regularly access.
On December 6 the Alaska Department of Transportation (DOT) reported that
40" of snow fell over 12 hours, including a whopping 15" in just 90 minutes. The
heavy snow triggered an avalanche more than 20' deep over the Richardson
Highway, which was closed for more than a day until DOT could clear the road.
Valdez received about 18" of snow during this time, but most of the precipitation
actually fell as rain. Anchorage saw very little snow during December. The total
at the airport was only 2.1", the third lowest of record and the lowest December Figure 6. A report on the December 6 snowstorm at Thompson
Pass from the NWS Twitter feed.
snowfall since 1982. Valdez reported the greatest
December snowfall from any community in the
state, with 51". However, this is only about 70% of
normal. Bettles was quite snowy the first 3 weeks of
December, when measurable snow fell on 20 of the
first 21 days of the month. The total snowfall for the
month was 32.4", more than twice normal.
Southwest Alaska was buffeted by several storms
during December. A storm on the 22nd produced
damage in several communities. At Quinhagak,
winds gusting to an estimated 85 mph caused half
the town to go without power for a day; fuel pumps
were damaged, and several structures suffered
significant wind damage. Cooler air following this
storm was enough to produce more than a foot of
wet heavy snow at Cold Bay on the 23rd, even as
temperatures never fell below freezing.
Figure 7. Alaska Department of Transportation (DOT) crews work to clear an avalanche on the
Richardson Highway near Thompson Pass following heavy snowfall in early December. Photo from
DOT.ALASKA CLIMATE DISPATCH • WINTER 2017–2018
NOV 2017–APRIL 2018 SUMMARY 16
JANUARY to the greater Fairbanks and Nenana areas on the evening of January 16 before
After the extraordinarily mild December, January changing to wet snow. Most areas received only a small amount of rain (less
temperatures were generally less extreme in most than 0.10") but it was enough to glaze surfaces, and on some roadways, the glaze
of Alaska, though virtually the entire state finished persisted into March.
up on the warm side of normal. The North Slope Late in the month a spell of cold weather over portions of the western Interior
was the mildest region relative to normal, while the and Northwest Alaska brought temperatures in the -50°F range at a number of
Cooper River Basin and parts of Southeast were very locations, and there were unofficial reports of temperatures near -60°F in the
close to the 1981-2010 average. Precipitation was, as upper Kobuk valley. However, the cold only lasted a few days before clouds and
usual, more variable, but much of western Alaska warmer air aloft caused a return to moderate conditions.
was quite dry, while the North Slope and southeast
mainland saw significantly more precipitation that is FEBRUARY
usual for January. At McGrath, the precipitation of February was another exceptionally mild month across northern and
0.10" is the second lowest January total in the past 75 western Alaska, while south and east of the Alaska Range temperatures were
years. In contrast, Northway’s total precipitation of predominately near to below normal. Preliminary analysis by NCEI put the
1.03" was more than 4 times normal and tied for the statewide average temperature for the month at more than 8°F above the 20th
third wettest January of record. century average. In northwest Alaska, this month was second only to 1989 for
A northward moving storm in the Gulf of Alaska the warmest February. At Utqiaġvik (Barrow), the average temperature for the
on January 14 and 15 brought exceptionally mild month was +4.0°F, a remarkable 18°F above normal. In contrast, Juneau airport
air to Southeast Alaska, with a number of long-term had an average temperature of 23.1°F, more than 7°F below normal and the
climate sites reporting record high temperatures for coldest February since 1994. This also allowed snow cover to last all month in
the month. Most notably, the NOAA tide gauge at the Capital City, the first time that every day in February has had measurable
Ketchikan came in with a maximum temperature snow on the ground since 1999. February was unusually snowy in Fairbanks,
of 67°F on the 14th. This is the highest reliable with a total of 23.4", all falling during the last 2½ weeks of the month. This
temperature ever recorded in Alaska in January, was more than twice the normal snowfall and enough to rank as the sixth
breaking the previous record of 62°F set multiple snowiest February in the past century. As is often the case in Southcentral
times, most recently near Port Alsworth on January Alaska, precipitation and snowfall varied dramatically in short distances due
27, 2014. Other all-time January record highs set this to the complex interplay of multiple mountain ranges and the waters of Cook
month included Annette at 66°F, Craig at 65°F, and Inlet. At the Anchorage Airport, February was unusually wet and snowy. Total
Sitka at 63°F. precipitation, mostly, but not entirely snow, totaled 2.32", the fourth highest
The Glennallen area is not an especially snowy February total in the past 66 years. Snowfall totaled 26.0", more than twice
region, but January 13-15 a total of 18.1" was normal and enough to be the sixth snowiest February since 1953. In contrast,
measured at the NWS cooperative station. This is Chugach and Kenai Peninsula mountain snowfall was well below normal.
the greatest 3 day snowfall since November 1-3, A series of storms moved through the Bering Sea during the middle of the
1999. The same storm system brought freezing rain month, culminating in a February 19-20 storm that moved northward just
west of the dateline before crossing Chukotka and
into the East Siberian Sea (Figure 8). This storm
produced wind gusts in excess of 60 mph on St.
Lawrence Island and over 75 mph in the Bering
Strait. With record low sea ice extent (Figure 9), the
storm brought unprecedented mid-winter coastal
flooding to Little Diomede that briefly inundated the
community’s power plant and storm surge waters
Figure 8. A lack of shorefast ice on Little Diomede Island left the community with no protection
from battering waves and ice debris during a winter storm on February 20, 2018. Photo by Carla
Ahkvaluk.
Figure 9. A large area of open water north of the community of Savoonga on February 14, 2018.
Photo by Savoonga IRA.ALASKA CLIMATE DISPATCH • WINTER 2017–2018
17
brought huge ice boulder onshore, closing the community helipad until the ice
could be removed. Another storm late in the month brought strong west winds
to the north side of the Alaska Peninsula. At Port Heiden, winds gusted 45 to
55 mph for more than half a day, and high waves produced extensive erosion
that cut through a road to the old village of Meshik. Significant snow reports
included 16" reported on the 11th and 12th at Chulitna and 15" near Talkeetna,
and the following days the storm brought up to 10" of snow in the Juneau area.
What little cold weather there was in February was found in the eastern
Interior during the first week of the month. Some normally colder valleys
reported overnight lows in the -40°F range, including -46°F at Northway and
-45°F at Tok, as well as the lowest official temperature in the state during the
month of -50°F at Chicken.
MARCH
Northern and western Alaska was very mild relative to normal in March,
with record or near record high temperatures for the month. This was the
mildest March in the 98 years of climate observations at Utqiaġvik (Barrow).
The average temperature of -0.7°F is 12°F above the 1981-2010 average. The
previous mildest March was in 2002 when the average temperature was -2.2°F.
The average temperature at Kotzebue in March was 12.8°F. This is 11.7°F
warmer than normal and ranks as the second warmest March of record. The
average temperature at St. Paul Island for March was 33.3°F, making this the
warmest March in more than 80 years. Temperatures were closer to normal
over Southcentral and Southeast Alaska, but southern Southeast had a couple of
very mild days near mid-month. At Ketchikan, only one March day in the past
century has been milder than the 65°F recorded on the 13th.
Southeast Alaska was drier than normal again this month, continuing the
trend since autumn. From October through March, Ketchikan received 59" of
rain and melted snow. This is just 67% of normal and was not sufficient to keep Figure 10. Swan Lake Dam hydro-electric power generation
area reservoirs at useful levels for hydropower generation. As a result, backup near Ketchikan suspended due to low reservoir levels, lowest
generators had to be used, resulting in much higher utility costs for regional levels since construction(1984). Photo provided by Southeast
Alaska Power Agency to the National Weather Service.
residents. At Wrangell, a combination of equipment problems and low reservoir
levels resulted in water use restrictions in place for much of the month.
Western Alaska was quite stormy after mid-month. Nome received 19.3"
of snow from a couple of storms between the 17th and 23rd. This is the third
highest one-week snowfall in March in Nome in more than a century of climate
observations. Parts of southern Alaska also saw significant snowfall in March.
Heavy snow fell in the Bristol Bay region March 6 through 8. King Salmon
reported 15.9" of snow March 7-8, the fourth highest 2-day total of record. Figure 11.The trend toward dry conditions in Southeast Alaska
led to low resevoir levels and water restrictions in Wrangell in
A storm total of 17" was reported from Iliamna. Heavy snow was reported
March 2018. Photo from KSTK Radio.
across the eastern Kenai Peninsula and upper Turnagain Arm area March 8-9.
In Seward there was an estimated 12" of snow and
Whittier reported 25". As is often the case, the storm
brought much lighter amounts to the immediate
Anchorage area, with generally 2 to 4" reported. Not
to be outdone, heavy snow fell late in the month over
parts of Southeast Alaska on March 26-27. Total
snowfalls included 9.6" at Elfin Cove and 9.2" at the
Juneau Airport.APRIL
Temperatures again in April were mildest relative to
normal over northwest and western Alaska. Both St. NEWS + EVENTS
Paul (35.2°F) and Cold Bay (38.3°F) had their fifth UPCOMING ACCAP WEBINARS
warmest April of record. In contrast, some parts
of the Interior and Southeast Alaska were slightly Register for monthly webinars and browse our
webinar archives, 2007–present
below normal. At Fairbanks, the month finished up
1.2°F cooler than normal. That’s hardly dramatic, www.accap.uaf.edu/webinars
but does mark the first month since March 2017 to
be even a little cooler than normal in the Golden ðð Virtual Alaska Weather Symposia: Volcanic Cloud Monitoring in the
Heart City. For Alaska as a whole, NCEI reported North Pacific: The Dawning of the GOES-R Era
the average statewide temperature about 3°F above Michael J. Pavolonis, NOAA Cooperative Institute for Meteorological Satellite
the 20th century average. Studies, University of Wisconsin - Madison
Rainfall was near to even a bit above normal in Wednesday, June 20, 2018 at 11:00 AM AKDT
southern Southeast Alaska in April and was enough https://accap.uaf.edu/VAWS_June2018
to ameliorate water restrictions and partially refill
ðð Monthly NWS Alaska Climate Forecast Briefing
power plant reservoirs. Ketchikan received more
Rick Thoman (National Weather Service)
than 13" of rain (almost 140% of normal), including
Friday, June 21, 2018 at 12:00 PM AKST
a daily record 3.18" on the 23rd.
https://accap.uaf.edu/June_2018
Southern Southeast Alaska received a late
season snow on April 3. Accumulations of 6" were
reported from Ward Cove, north of Ketchikan,
and 5" in Ketchikan City. Parts of inland Alaska
also had significant snow during the month. On
the south side of the Alaska Range, the cooperative
climate station near Chulitna received 31" of wet
snow during the last ten days of the month, and the
month ended with 54" of snow on the ground. More
clouds than usual and a lack of especially warm
temperatures left plenty of snow remaining in the
higher elevations of the Interior at the end of the
month, and was the most since 2013. This also was a
factor in a comparatively slow start to river break-
up, with little movement of ice during the month.
However, on the 30th an ice jam on the Tanana River
near Salcha produced localized flooding.
An unusually strong storm for so late in the
season in the southeast Bering Sea brought very
strong winds to the Anchorage area on April 24.
Winds gusted to 55 mph at Anchorage Airport and
60 mph at Merrill Field, and hillside winds were
clocked to 90 to 100 mph in some places. Numerous
trees came down in the wind, and there was some
structure damage reported and nearly 25,000
customers from Anchorage to Chugiak lost electrical
power, some for more than 12 hours.
M OS P H
D AT ER
AN IC
IC
N
AD
EA
MI
NATIONAL OC
NI S
ETRATION
U.
RC
DE
S
ME
.
PA
R TM OM
ENT OF C
ACCAP IS FUNDED BY THE NATIONAL OCEANIC AND ATMOSPHERIC ADMINISTRATION (NOAA) AND IS ONE OF A GROUP OF REGIONAL INTEGRATED
SCIENCES AND ASSESSMENTS (RISA) PROGRAMS NATIONWIDE. THE RISA PROGRAM SUPPORTS RESEARCH THAT ADDRESSES SENSITIVE AND COMPLEX
CLIMATE ISSUES OF CONCERN TO DECISION-MAKERS AND POLICY PLANNERS AT A REGIONAL LEVEL.
LEARN MORE ABOUT ACCAP
ACCAP@UAF.EDU • ACCAP.UAF.EDU • 907-474-7812You can also read


