Impact of COVID-19 on Mortality and Morbidity in 2020
←
→
Page content transcription
If your browser does not render page correctly, please read the page content below
3
                                         Research Note

                                       With a full year of mortality
                                       experience since the
                                       beginning of the pandemic,
                                       what does it tell us about
                                       deaths worldwide and in
                                       Australia? And how might
                                       future morbidity and mortality
                                       be impacted?

            Impact of COVID-19 on Mortality
            and Morbidity in 2020
JUNE 2021

            Karen Cutter, Jennifer Lang and Richard Lyon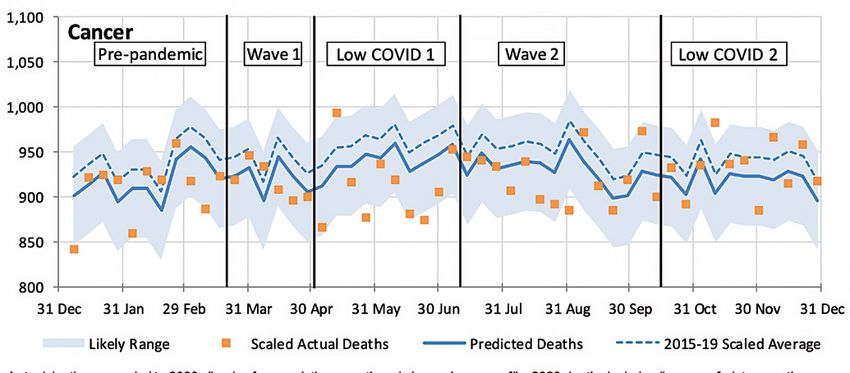
3
Research Note
                               About the authors

                               This research note has been written by Karen Cutter, Jennifer Lang and Richard Lyon.

                                                  Karen Cutter BEc, FIAA
                                                  Karen worked as a consulting actuary in the general insurance field for 25
                                                  years before taking a career break a few years ago. Finding herself at a loose
                                                  end during lockdown in March, she developed an interest in COVID-19-related
                                                  matters. Karen has authored a number of professional papers and has served on
                                                  the GIPC and other Institute committees.

                                                  Jennifer Lang BEc, GAICD, FIAA
                                                  Jennifer is a non-executive director and actuary. With more than 25 years of
                                                  corporate and consulting financial services experience, she is an advocate for
                                                  the insights actuaries can add to a wide variety of issues. She is Convenor of the
                                                  Actuaries Institute’s COVID-19 Working Group and a member of the Institute’s
                                                  working group on Climate Change. In her spare time she writes her popular
                                                  actuarial blog Actuarial Eye.

                                                  Richard Lyon MA, FIAA
                                                  Richard is an actuary at TAL, where his role now includes advising the company
                                                  on the impact of COVID-19. He is a co-author and co-editor of the Actuaries
                                                  Institute’s textbook Understanding Actuarial Management: the actuarial control
                                                  cycle and is a former member of the Institute’s Council. He has also served on
                                                  several Institute committees, working groups and taskforces.

                               Published June 2021
                               © Institute of Actuaries
                               of Australia 2021
                               All rights reserved

                               About the Actuaries Institute
                               The Actuaries Institute (‘the Institute’) is the sole professional body for Actuaries in Australia. The Institute
                               provides commentary on public policy issues where there is uncertainty of future financial outcomes.
The Actuaries Institute
                               Actuaries have a reputation for a high level of technical financial expertise and integrity. They apply their
acknowledges the traditional
                               risk management expertise to allocate capital efficiently, identify and mitigate emerging risks and help
custodians of the lands
                               maintain system integrity across multiple segments of the financial and other sectors.
and waters where we
live and work, travel and      The Institute is keen to help ensure the methodologies used in the industry to project Australian households
trade. We pay our respect      lifespans are as appropriate as possible and we provide examples where this may not always be the case.
to the members of those        Life expectancy calculations are often required in the superannuation and financial planning industries.
communities, Elders past and   They have a material impact on the way retirement income strategies and products are formulated and
present, and recognise and     evaluated.
celebrate their continuing     Our public policy principles can be viewed at: https://actuaries.asn.au/public-policy-and-media/public-
custodianship and culture.     policy/policyprinciples.

                                                                                            Research Note-3 • Actuaries Institute          2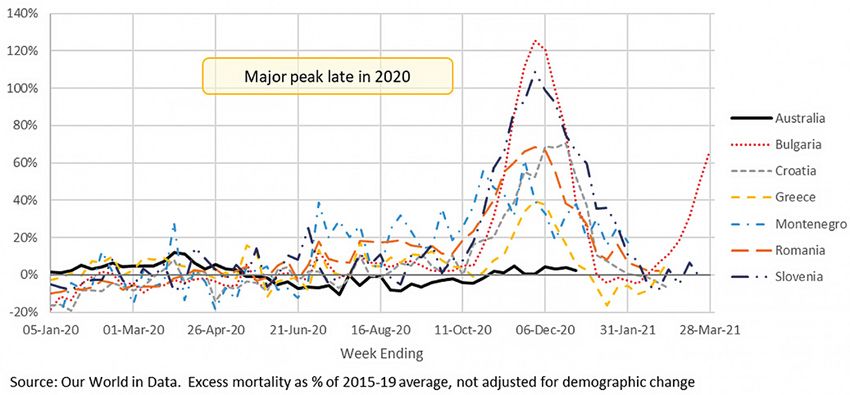
Introduction

This paper looks at a number of ways in which COVID-19 mortality has been measured around
the world and in Australia. We then take a closer look at the impact of COVID-19 (including border
closures and other non-pharmaceutical measures) on the mortality experience of Australia during
2020. And finally, we take a brief look at the impact of COVID-19 on long term illness, based on
studies from the US, the UK and Denmark.

An important way in which the impact of COVID-19 on mortality can be measured is by looking
at the total deaths from a population and comparing them with some measure of expected
deaths (either deaths in recent years, or some more sophisticated projection). This information
is not available for all countries, but for many countries it shows that the impact of COVID-19 on
mortality has been higher than the reported COVID-19 deaths.

In Australia, by contrast, because COVID-19 outbreaks and deaths have been very low in
comparison with the rest of the world, we can see the effect of border closures and other non-
pharmaceutical measures. Overall, Australian mortality has been much lower than our model
predicts, with around 3,900 (2.7%) fewer deaths in 2020 than predicted. This is driven by lower
numbers of deaths directly attributed to respiratory illness (around 3,200 fewer than predicted).
Higher than expected deaths from pneumonia at the end of March (likely undiagnosed COVID-19)
have been more than offset by the much lower numbers of all respiratory deaths since mid-April.
Dementia and ‘other’ deaths, where, in normal years, respiratory illness is likely to be a significant
contributing factor, have also been much lower than predicted (by around 1,500 deaths). Overall,
the various non pharmaceutical measures to reduce the spread of COVID-19 across Australia
(lockdowns, social distancing measures, wearing of facemasks, etc) have almost certainly
reduced mortality from other causes.

In other countries, a significant number of those who contract COVID-19 stay ill with a wide variety
of long-term symptoms including organ damage, neurological issues and psychiatric issues. The
long-term morbidity implications for countries which have had significant outbreaks are likely to
be material. Any insurer that covers morbidity or health care costs will need to understand the
prevalence of long-term post-COVID-19 illnesses in the population, both from those in their insured
population currently (whichever country they are located in) and from those who may become insured
in the future. Insurers (where permitted by legislation) will need to consider the appropriateness of
underwriting for previous COVID-19 disease when selecting new customers, noting that in Australia
health insurers do not underwrite individual customers due to community rating.

                                                Australian mortality in 2020
                                                has been much lower than
                                                expected. The measures used to
                                                reduce the spread of COVID-19
                                                have almost certainly reduced
                                                mortality from other causes.

                                                         Research Note-3 • Actuaries Institute      3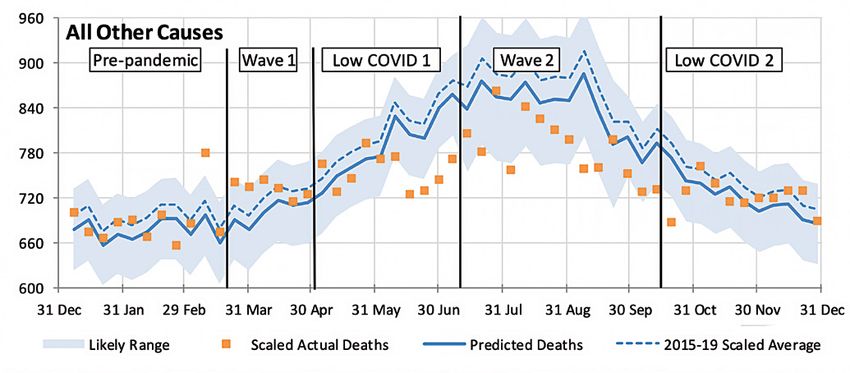
1. Excess mortality around the world

     The official global death toll from COVID-19 passed 3 million in April 2021. However, this statistic will
     not correctly measure the mortality impact of the pandemic, for reasons including:

          ● deaths from COVID-19 may have been recorded as from other causes;
          ● deaths from other causes may have been recorded as from COVID-19; and
          ● the disruption caused by COVID-19 had flow-on effects on activity and, hence, on
              mortality.

     Therefore, the interesting question is what overall excess mortality has been experienced in different
     countries. Fortunately, a rich data source is available in the form of Our World in Data (OWID:
     ourworldindata.org). Except where otherwise specified, all data for the charts and tables in this section
     comes from this source.

     1.1.     Handle with care!
     We note that the standard approach used by OWID to calculate excess mortality is to compare
     reported deaths for each week or month with the average for the equivalent period across 2015
     to 2019. This is subject to general uncertainty, to the extent that there may be reporting delays or
     errors, but it also fails to take account of both the demographic change in this time and any trends in
     experience. This is illustrated in our discussion of excess deaths in Australia in Section 2.

     1.2.     National and Regional Differences
     Different countries have experienced significantly different mortality since January 2020, each relative
     to its 2015-19 average. Appendix A contains a table, derived from OWID data, showing COVID-19 deaths
     and total excess deaths from January 2020 to the latest available date, for 38 countries. The table also
     expresses these deaths as a percentage of ‘expected deaths’, being the 2015-19 average.

     The chart below shows that several countries have experienced very high excess mortality from
     all causes in 2020, while a few have experienced close to ‘expected’. The chart also indicates the

Excess Mortality – COVID-19 and Total – Australia and Selected Others

    Source: Our World in Data. Excess mortality as % of 2015-19 average, not adjusted for demographic change.

                                                                          Research Note-3 • Actuaries Institute   4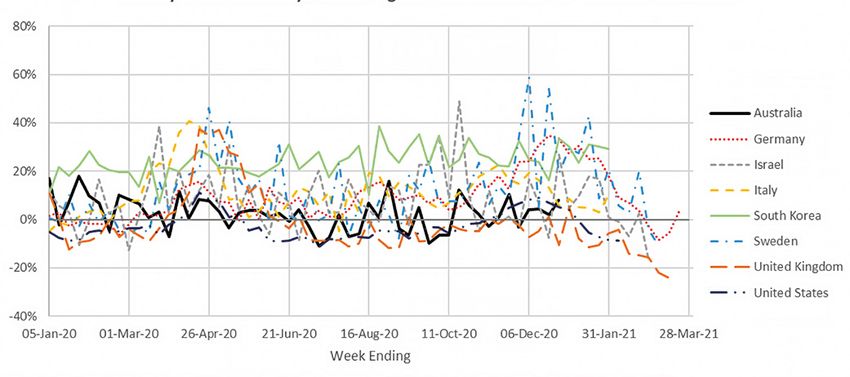
contribution of reported COVID-19 deaths to the total excess. Countries sitting above (below) the parity
                                        line on the chart have experienced excess deaths above (below) reported COVID-19 deaths. We have
                                        also shown a higher line, above which excess deaths other than those reported as COVID-19 were
                                        more than 10% of the 2015-19 average.

                                        Note that the table in Appendix A can be used to identify the individual countries represented by codes
                                        in this chart.

                                        Mexico, Azerbaijan, Russia, Uzbekistan, Colombia and Brazil sit above or near this higher line – and
                                        therefore well above the parity line. This suggests a major level of underreporting and indicates the
                                        pitfalls of relying on reported COVID-19 deaths in some countries.

                                        On the other hand, several countries sit well below the line. We have not investigated in detail why
                                        this may be so. However, in the case of Belgium, it may be because nursing home deaths where
                                        COVID-19 was suspected but not confirmed were generally counted as COVID-19 deaths, thus shifting
                                        deaths primarily from other causes into the COVID-19 column. Similarly, but to a lesser extent, we
                                        understand that the UK counts as a COVID-19 death any death up to 28 days after a positive test.

Countries such as                       It is also noteworthy that countries such as the USA and Chile have experienced total deaths more
the USA and Chile                       than 20% above expected. 12 other countries in the OWID data set but not in the chart also exceeded
have experienced                        +20%, including Ecuador at +64.3% and Bolivia at +55.0%.
total deaths more
than 20% above                          Unfortunately at the time of our analysis, data was not available for China, India, Indonesia, Papua New
expected.                               Guinea or Peru, among others which have had significant outbreaks and/or are close to Australia.

                                        The next chart compares Australia with a selection of other countries, broadly representative
                                        of various regions. It illustrates the regional variations in excess mortality experience, using
                                        a measure that OWID calls a P Score but that is simply the proportion by which actual deaths
                                        exceed expected deaths.

 Weekly Excess Mortality P Score – Australia and Selected Others

  Source: Our World in Data. Excess mortality as % of 2015-19 average, not adjusted for demographic change.

                                        There was a strong early peak in excess mortality in Western Europe as the pandemic spread,
                                        exacerbated by international travel. A subsequent peak occurred in the northern winter but was
                                        generally lower, in percentage terms at least. The following chart shows Western Europe, with
                                        Australia included as a frame of reference.

                                                                                                              Research Note-3 • Actuaries Institute   5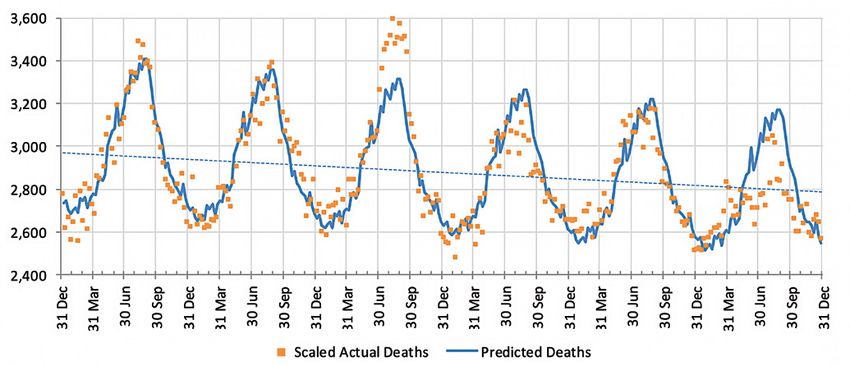
Weekly Excess Mortality P Score – Australia and Western Europe

Source: Our World in Data. Excess mortality as % of 2015-19 average, not adjusted for demographic change.

                                       The next chart shows that Northern Europe generally avoided a significant early peak (apart from
                                       Sweden) but several countries had poor experience towards the end of 2020.

Weekly Excess Mortality P Score – Australia and Northern Europe

Source: Our World in Data. Excess mortality as % of 2015-19 average, not adjusted for demographic change.

                                       The impact of COVID-19 seems to have been felt in the Balkans later than most, perhaps because
                                       they receive less international traffic. The next chart shows that, in some cases, such as Bulgaria
                                       and Slovenia, more recent mortality experience has been extremely poor.

                                                                                                            Research Note-3 • Actuaries Institute   6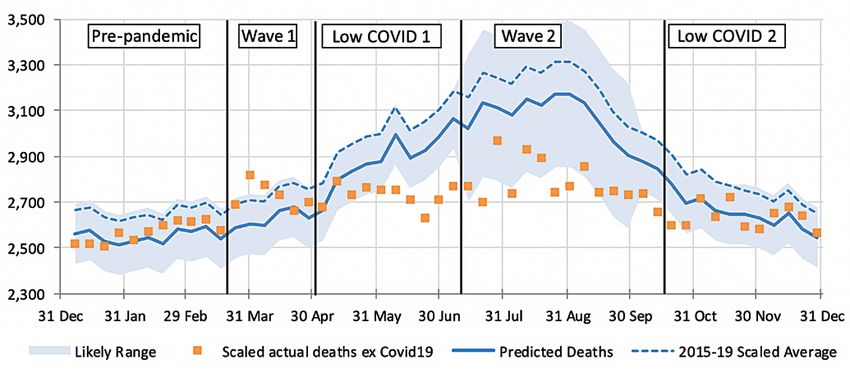
Weekly Excess Mortality P Score – Australia and Balkans

  Source: Our World in Data. Excess mortality as % of 2015-19 average, not adjusted for demographic change.

                                       Similarly, the next chart shows that Eurasia has generally had a delayed impact from COVID-19, again
                                       perhaps because of less international traffic. Azerbaijan’s 200% excess mortality in December 2020
                                       contrasts starkly with COVID-19 deaths averaging four per million (perhaps 25% of normal mortality).

 Weekly Excess Mortality P Score – Australia and Eurasia

 Source: Our World in Data. Excess mortality as % of 2015-19 average, not adjusted for demographic change.

                                       Experience in the Americas (see following chart) varies significantly by country. The USA
                                       and Canada broadly follow the Western European experience, but Mexico has suffered a very
                                       high second peak. In South America, each country seems to be different, but all seem to have
Due to a number                        experienced recent deterioration.
of influencing
factors, deaths
from COVID-19 have
varied markedly
around the world.

                                                                                                              Research Note-3 • Actuaries Institute   7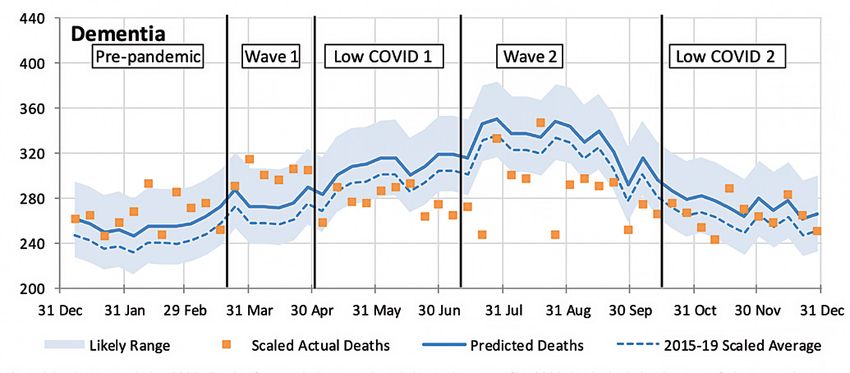
Weekly Excess Mortality P Score – Australia and Americas

     Source: Our World in Data. Excess mortality as % of 2015-19 average, not adjusted for demographic change.

                                         Australia, like many of its time-zone neighbours, has experienced low COVID-19 mortality and overall
                                         mortality close to the 2015-19 average. Accordingly, the selected countries and areas from this region
                                         (see below) are in the lower left of the bubble chart. There is a clear reduction in winter mortality in
                                         both Australia and New Zealand. We discuss this further in our analysis of Australian mortality.

    Weekly Excess Mortality P Score – Australia, NZ and E Asia

     Source: Our World in Data. Excess mortality as % of 2015-19 average, not adjusted for demographic change.

                                         1.3.      Dry tinder and COVID-19 shadows
                                         There have been several attempts to explain some of what we have seen during the pandemic. One
                                         interesting argument that first appeared around October 2020 concerns the much higher mortality
                                         in Sweden than in its neighbours and has been termed the ‘dry tinder’ effect. While many might put
                                         Sweden’s higher mortality down to the alleged pursuit of ‘herd immunity’, an article by Jonas Herby1
                                         argues that Sweden had experienced benign flu seasons for two years, unlike its neighbours. In effect,
1    American Institute for              the argument goes that this is like an area that often burns not experiencing bushfires for a longer
     Economic Research,                  period than usual. There will simply be more ‘dry tinder’ to burn next time a bushfire occurs. Thus, the
     article by Jonas Herby,
     November 2020
                                         vulnerable in Sweden’s population (the dry tinder) had been spared death for a year or two but would
     https://www.aier.org/               succumb at the next opportunity. In other words, the article suggests that extra deaths experienced in
     article/swedens-dry-
                                         2020 had been deferred from earlier years, albeit the catalyst was COVID-19 rather than the more usual
     tinder-accounts-for-many-
     covid-19-deaths/                    respiratory diseases.

                                                                                                                 Research Note-3 • Actuaries Institute   8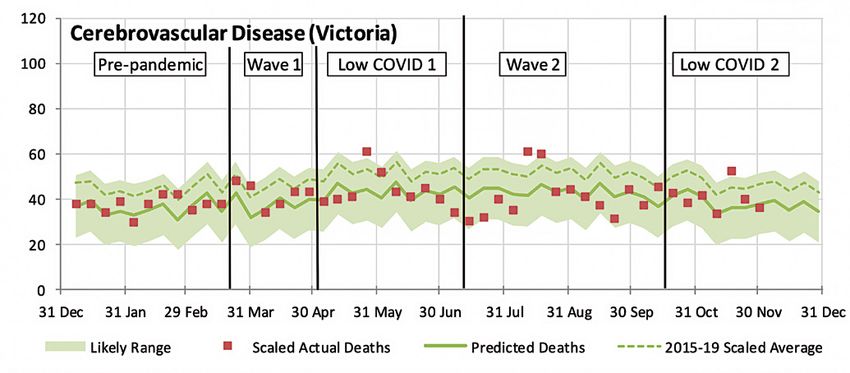
Another suggestion is that countries such as the UK will experience ‘COVID-19 shadows’. As the
                              vulnerable have been taken early by COVID-19, deaths will be lower than expected for a short period.
                              (Perhaps, if the dry tinder argument holds, that period might be as much as two years or more.)

                              On the other hand, it appears that countries that had effective lock-downs during winter have experienced
                              relatively low levels of respiratory infection, including flu. This has certainly been the case in Australia, as
                              we shall see in Section 2. Is it possible that this has resulted in the build-up of some dry tinder in those
                              countries? Certainly, the excess mortality in New Zealand in late 2020 and early 2021 suggests that this
                              might be true – all the more so when we understand (but have not tested) that this higher mortality is
                              among the elderly, the same age group that had a large reduction in mortality in the winter.

                              1.4.    Age-based mortality
It has been clear             It has been clear from the very beginning of the pandemic that the risk of death from a COVID-19
from the very                 infection is very different by age. In a very broad sense, it is somewhat proportional to the underlying
beginning of the              risk of death. Understanding the risk of death from a COVID-19 infection relies on identifying all cases
pandemic that the             of COVID-19 and all deaths from COVID-19. Different countries and different phases of the outbreak
risk of death from a          have had difficulty with both of these. Early in the COVID-19 pandemic, most infections identified (even
COVID-19 infection            with testing) were symptomatic. Studies have shown that up to half of all infections are asymptomatic,
is very different             even more if mild symptoms are ignored.
by age.
                              In addition, in phases of the pandemic where hospital resources were very stretched, not all deaths
                              from COVID-19 were identified as such, particularly in aged care facilities in a number of countries.

                              Australia
                              With these caveats, we have previously looked at the case fatality rates in Australia, which show that
                              the overall case fatality rate (deaths from COVID-19 divided by diagnosed cases) at 4 November is 3.3%
                              for Australia as a whole2. We urge caution when using case fatality rates. They could be too high if, as
                              in most populations, the diagnosed cases of COVID-19 are underestimated (as not all asymptomatic or
                              minor cases are tested, even when testing is quite comprehensive), and too low if not all deaths from
                              COVID-19 have been counted.

                              As in other countries, the case fatality rate in Australia at older ages is, as expected, significantly
                              higher than the average case fatality rate. The graph shows the case fatality rate for each age band
                              and gender, and also spilt between wave 1 (cases and deaths at 31 May) and wave 2 (cases and deaths
                              after 1 June). The overall case fatality rate for wave 1 is 1.5% and for wave 2 is 3.9%.

                                Case Fatality Rates

2   Calculated using
    data from Australian
    Government Department
    of Health website.
    https://www.health.gov.
    au/news/health-alerts/
    novel-coronavirus-
    2019-ncov-health-alert/
    coronavirus-COVID-19-
    current-situation-and-
    case-numbers#tests-
    conducted-and-results

                                                                                            Research Note-3 • Actuaries Institute         9
There have been no reported deaths in Australia from COVID-19 in any males under the age of 20
                                         or females under the age of 50. At all ages, the case fatality rate for males is higher than that of
                                         females, as is the case for mortality from most causes.

                                         The case fatality rate at older ages was much higher in Wave 2 compared with Wave 1 for both males
                                         and females. This may reflect some under-count of COVID-19 deaths during Wave 1 (discussed
                                         further in section 2), and the relatively better health of those infected in wave 1 (largely travellers)
                                         versus Wave 2 (dominated by those in aged care).

                                         Worldwide
https://link.springer.                   A more comprehensive world-wide study has recently been published in the European Journal of
com/content/                             Epidemiology3. It analysed the data to systematically understand the level of underreporting of infection
pdf/10.1007/s10654-
020-00698-1.pdf                          in each country, by age, to develop an aged-based infection fatality rate (IFR) around the world.

                                         These graphs show the overall results.

    Fig. 3 The log-linear relationship between IFR and age. Note: Our                Fig. 4 Benchmark analysis of the link between age and IFR. Note: This
    metaregression indicates that the infection fatality rate (IFR) increases        figure depicts the relationship between the infection fatality rate (IFR)
    exponentially with age, and hence this figure uses a base-10 logarithmic         and age, where IFR is shown in percentage terms. Each marker denotes
    scale so that the relationship is evident across all ages from 5 to 95 years.    a specific metaregression observation, that is, the IFR for a particular
    Each marker denotes a specific metaregression observation, that is, the IFR      age group in a particular location. The marker style reflects the type
    for a particular age group in a particular location. The marker style reflects   of observation: circles for observations from seroprevalence studies
    the type of observation: circles for observations from seroprevalence            of representative samples, diamonds for seroprevalence studies of
    studies of representative samples, diamonds for seroprevalence studies           convenience samples, and squares for countries with comprehensive
    of convenience samples, and squares for countries with comprehensive             tracing programs. The red line denotes the metaregression estimate of
    tracing programs. The red line denotes the metaregression estimate of IFR        IFR as a function of age, the shaded region depicts the 95% confidence
    as a function of age, the shaded region depicts the 95% confidence interval      interval for that estimate. The dashed lines denote the prediction
    for that estimate. The dashed lines denote the prediction interval (which        interval (which includes random variations across studies and age
    includes random variations across studies and age groups), and almost all        groups); almost all of the 104 metaregression observations lie within
    of the 108 metaregression observations lie within that interval.                 that interval.

                                         The estimated age-specific IFR is very low for children and younger adults but increases progressively
                                         with age. The table below compares these rates with the underlying mortality rates in the Australian
                                         population and the Australia COVID-19 case fatality rates in the second wave (when testing was more
                                         comprehensive).

                                              AGE             AUSTRALIAN POPULATION               AUSTRALIAN COVID-19                COVID-19 INFECTION
3   Assessing the age                                                MORTALITY RATE                CASE FATALITY RATE           FATALITY RATE (PER 1,000)
    specificity of infection                                              (PER 1,000)                      (PER 1,000)
    fatality rates for COVID-19:
    systematic review, meta                   10                              0.1                            0.0                               0.02
    analysis, and public policy
    implications, Andrew T.                   25                             0.5                             0.2                                 0.1
    Levin,· William P. Hanage,
                                              55                              4.1                            6.1                                4.0
    Nana Owusu Boaitey,
    Kensington B. Cochran,                    65                              7.8                          21.0                                14.0
    Seamus P. Walsh,·
    Gideon Meyerowitz Katz,                   75                            25.8                            148                                46.0
    European Journal of
    Epidemiology (2020)                       85                            72.8                            315                                 150

                                                                                                           Research Note-3 • Actuaries Institute             10
The Australian case fatality rates are considerably higher than the estimated infection fatality rates
across all age groups. At older ages (75+), we expect that this is due to the dominance of aged care
residents in the infected population.
On the basis of the relative mortality in the charts and previous table, and assuming that overall
excess mortality is largely explained by COVID-19, we would expect to see a higher excess mortality
P score for older people than for the young if infection rates are broadly independent of age. This
relationship is clear in Germany, as this chart shows.
Weekly Excess Mortality P Score by Age Group – Germany
Source: Our World in Data. Excess mortality as % of 2015-19 average, not adjusted for demographic change.
South Korea also demonstrates this relationship.
Weekly Excess Mortality P Score by Age Group – South Korea
Source: Our World in Data. Excess mortality as % of 2015-19 average, not adjusted for demographic change.
In the UK (see following chart), the relationship held in the initial peak, but it has since inverted,
perhaps reflecting increasing risk aversion by age and/or the operation of a COVID-19 shadow –
given the height of the initial peak – and potentially the effect of the vaccine in the last month
or two.
Research Note-3 • Actuaries Institute 11Weekly Excess Mortality P Score by Age Group – United Kingdom
Source: Our World in Data. Excess mortality as % of 2015-19 average, not adjusted for demographic change.
In Israel, we see the greatest excess mortality among what might be called the ‘active old’, perhaps
because of greater shielding by those over 75.
Weekly Excess Mortality P Score by Age Group – Israel
Source: Our World in Data. Excess mortality as % of 2015-19 average, not adjusted for demographic change.
Though the
elderly are more
susceptible to
COVID-19 the
relative excess
mortality ratio for
each age group
has varied in
different countries,
perhaps reflecting
different rates
of infection.
Research Note-3 • Actuaries Institute 12In the USA (below), the elderly appear to have been far more risk averse than other age groups, with
P scores for the 85+ age group generally at or below those for the 15-64 group.
Weekly Excess Mortality P Score by Age Group – United States
Source: Our World in Data. Excess mortality as % of 2015-19 average, not adjusted for demographic change.
Another way of viewing these relationships is by expressing excess mortality for each age group
relative to the 15-64 age group. For example, if the 85+ age group has a P score of 90% and 15-64 is
at -5%, the relative score for 85+ is 190/95 – 1 = 100%.
Of the eight selected countries in the chart below, Israel clearly shows the highest relative mortality
for ages 65-74. The UK’s relationship inversion shows through in the second half of the chart.
Weekly Excess Mortality P Score – Age 65-74 Relative to 15-64 – Australia and Selected
Source: Our World in Data and analysis. Excess mortality as % of 2015-19 average, not adjusted for demographic change.
By comparison, the next chart shows that it is Sweden that has the highest relative mortality in the
75-84 age group.
Research Note-3 • Actuaries Institute 13Weekly Excess Mortality P Score – Age 75-84 Relative to 15-64 – Australia and Selected
Source: Our World in Data and analysis. Excess mortality as % of 2015-19 average, not adjusted for demographic change.
Finally, the next chart shows that relative mortality among the elderly is consistently high in South
Korea but it is also generally high in other countries when overall excess mortality peaks.
Weekly Excess Mortality P Score – Age 85+ Relative to 15-64 – Australia and Selected
Source: Our World in Data and analysis. Excess mortality as % of 2015-19 average, not adjusted for demographic change.
The previous analysis is very superficial, directly reflecting the unadjusted data. It is quite possible
that a more sophisticated analysis, adjusting for demographic changes and mortality trends,
would reveal some different insights. We would encourage the interested reader to undertake such
analysis!
Research Note-3 • Actuaries Institute 142. Excess deaths in Australia
2.1. Data – what is out there?
The main source of death statistics in the public domain in relation to 2020 is the Australian Bureau
of Statistics (ABS) release Provisional Mortality Statistics, Australia 2020, showing the numbers of
deaths in Australia for each week in 2020 compared with prior years (the ‘ABS 2020 data’). However,
this data is based solely on doctor-certified deaths, so it does not include any deaths that have been
referred to a coroner (e.g. suicides, transport and other accidents, assaults, medical complications,
and other unexpected deaths where the cause of death is unknown).
The ABS 2020 data is probably missing around 10% to 15% of all deaths (around 20,000 deaths per
annum) – see Appendix B for detail.
Doctor-certified Causes of Death in Australia 2015-2019
deaths comprise
Other Coroner-
around 85-90% referred, 7%
of all deaths in Coroner-referred
Australia each year. diseases, 6% Cancer, 29%
Other Doctor-
certified, 23%
Ischaemic heart
Other respiratory
diseases, 9%
diseases, 2%
Influenza, 0%
Pneumonia, 2%
Dementia, 8%
Chronic lower
Diabetes, 3%
respiratory
conditons,5% Cerebrovascular
disease, 6%
The proportion of deaths that are doctor-certified versus coroner-referred varies by cause (see
Appendix B). Almost all cancer and dementia deaths are doctor-certified and thus included in the ABS
2020 data. Around 95% of deaths from other specified diseases are doctor-certified, with the exception
of ischaemic heart disease (heart attack, coronary heart disease) where only around 80% of deaths
are doctor-certified. This is not surprising given the unexpected nature of many deaths from heart
disease and hence their referral to the coroner.
The approximately 20,000 deaths referred to the coroner in any one year include around 6,500 deaths
from the specified diseases included in the ABS 2020 data, plus around another 3,000 deaths from
other diseases, i.e. they are resolved as deaths from natural causes. The remaining 11,000 or so
coroner-referred deaths are from ‘external causes’. In a small portion, the cause of death remains
unknown even after the coroners’ investigations are completed.
Research Note-3 • Actuaries Institute 152.2. Measuring excess deaths
While the ABS has produced two papers this year analysing excess deaths in some detail (one for
Australia: https://www.abs. Australia and one for Victoria), their standard monthly reporting of excess deaths compares 2020
gov.au/articles/measuring- deaths to the unadjusted average of 2015-2019 and this is also how most analysis of excess deaths in
excess-mortality-australia-
during-covid-19-pandemic other countries is presented. However, this analysis does not allow for changes in either the size or the
Victoria: https://www.abs. age structure of the population. Further, it does not allow for the continuation of any trends in mortality
gov.au/articles/measuring- that may have been expected in the absence of the pandemic. So, in the fortunate situation where
excess-mortality-victoria-
during-covid-19-pandemic there is only a small shock to mortality rates from COVID-19, the comparison with previous years can
be misleading.
The following graphs demonstrate this using the last four weeks of doctor-certified deaths in 2020 as
an example.
Doctor-certified deaths Comparison to Unadjusted Average
When comparing 2020 to the unadjusted data for 2015-2019, all four weeks appear to have
excess mortality, and three weeks are above the maximum/minimum range (implying they are
significantly higher than previous years). Across the four weeks, excess deaths are measured as
3.3% above ‘expected’.
After Population Adjustments Comparison to Adjusted Average
Research Note-3 • Actuaries Institute 16The picture looks quite different after allowing for later reported deaths and changes in the size and
age structure of the Australian population. All weeks are now below the average and excess deaths are
measured as 2.3% below ‘expected’. However, there is a clear trend in mortality, with overall mortality
reducing over the five years shown.
Comparison to Predicted
After allowing for the trend in mortality to continue into 2020, deaths in 2020 are close to predicted
for all weeks shown. Note that we have also moved to a statistical confidence interval based on the
observed standard deviation for the last five years (rather than just taking the maximum and minimum
values). This allows us to attach a probability to an identified outlier. Excess deaths are 1.6% above
predicted, and well within the normal range of expected volatility.
In Australia, In the Australian context, where excess mortality in 2020 has been small, these adjustments can have
where excess a material impact on the conclusions drawn. Across the whole of 2020, excess deaths as measured
mortality has using the three approaches above are -0.1% (comparison to unadjusted average), -6.6% (comparison
been small, to adjusted average) and -2.7% (comparison to predicted). Using the ABS standard reporting approach
adjustments for would indicate that mortality in 2020 is very close to expected, whereas our approach indicates that
population size mortality has been almost 3% better than predicted.
and age structure
can have a For other countries where excess mortality is very significant, making the adjustments is probably just
material impact adding spurious accuracy – it likely would not change the conclusion drawn.
on conclusions
drawn. 2.3. Doctor-certified deaths in 2020
Specifics on the model
As outlined above, we built a model predicting weekly doctor-certified deaths in 2020, based on the
information provided by the ABS about weekly deaths during 2015-2019. For each cause of death:
● we started with weekly deaths from 2015-2019;
● we scaled those deaths for population (an 8% increase over five years), age distribution
(a 4% increase over five years) and late-reported deaths; and
● we fitted a model to predict deaths in 2020, incorporating allowance for average
mortality improvement over the last five years (a 3.5% decrease over five years). Our
model allows for the improving mortality trend over the last five years and predicts
that deaths in 2020 would be lower than the 2015-19 average.
Details of our approach and the adjustments made are included in Appendix C.
Research Note-3 • Actuaries Institute 17The graphs shown in this section include the weekly doctor-certified deaths for:
● 2020, taken from the ABS data and after adding allowance for late reported deaths;
● the average of 2015 to 2019, after adjustments for both population size and age mix; and
● our prediction for 2020, in the absence of COVID-19.
All doctor-certified deaths
Weekly scaled actual and predicted doctor-certified deaths
Actual deaths are scaled to 2020 allowing for population growth and change in age profile; 2020 deaths include allowance for late reporting.
Predicted deaths come from the linear trend in each week’s scaled deaths in 2015 to 2019.
The experience of doctor-certified deaths in 2020 can be broken into five distinct periods:
● Pre-pandemic (deaths occurring before 17 March) – deaths during this period were
reasonably close to predicted.
● Wave 1 (for the weeks ending 24 March to 28 April, coinciding with the first wave
of COVID-19 infections and deaths) – deaths during this period were higher than
predicted.
● Low COVID 1 (for the weeks ending 5 May until 7 July, reflecting a period of low
numbers of COVID-19 cases) – deaths were lower than expected throughout most of
this period as the usual seasonal respiratory deaths did not eventuate in 2020, due to
the absence of respiratory illness in winter 2020.
● Wave 2 (for the weeks ending 14 July to 13 October, coinciding with the second wave
of COVID-19 infections and deaths, mainly in Victoria) – while deaths remained lower
than predicted, deaths increased to be closer to the predicted number in late July and
early August compared with surrounding weeks.
Mortality ● Low COVID 2 (for the weeks ending 20 October onwards, reflecting a second period
experience in of low COVID-19 cases) – deaths were close to predicted. This is not because
Australia in deaths increased, but rather because Australia does not normally have high levels of
2020 varied respiratory disease deaths in summer and hence experienced a lesser benefit from
across the year. reduced levels of respiratory disease deaths.
Research Note-3 • Actuaries Institute 18How many COVID-19 deaths are included in doctor-certified deaths?
Weekly scaled actual doctor-certified deaths
There are 832 COVID-19 deaths included in the ABS doctor-certified deaths in 2020. 78 of these
deaths occurred during the first wave, 730 occurred during the second wave, and a further 26 deaths
occurred outside of these two periods.
These deaths are 77 less than the 909 officially recorded COVID-19 deaths. The discrepancy arises
as some COVID-19 deaths will have been reported to the coroner (notably some deaths associated
with the Ruby Princess and some deaths in aged care homes in Victoria).
COVID-19 Deaths in Australia in 2020
Doctor-certified
COVID-19 deaths are
lower than officially
recorded deaths as
some are referred to
the coroner.
Research Note-3 • Actuaries Institute 19Non-COVID-19 deaths
The following chart shows weekly doctor-certified deaths in 2020 after removing known COVID-19
deaths.
Weekly scaled actual and predicted doctor-certified deaths
Actual deaths are scaled to 2020 allowing for population growth and change in age profile; 2020 deaths include allowance for late reporting.
Predicted deaths come from the linear trend in each week’s scaled deaths in 2015 to 2019.
Reported COVID-19 deaths clearly do not explain all of the higher than predicted numbers of deaths
during the first wave, nor the jump in deaths in the second wave:
● There are four specific causes of death with potential links to COVID-19 – pneumonia,
Reported COVID-19
diabetes, cerebrovascular disease (mainly strokes and brain haemorrhage) and
deaths do not
dementia. For all four of these causes, we have observed higher than expected numbers
account for all of
of deaths in the first wave, and also in Victoria in the second wave, although the
the higher than
numbers involved in the second wave are small for both pneumonia and diabetes.
predicted deaths
● While we cannot be definitive, we expect that more people probably died because of
during periods of
COVID-19 during the first wave of cases than was reported at the time. This is likely to
high COVID-19.
be because those people were not tested for COVID-19 (testing was limited and only
available to those who had travelled overseas or were a close contact of an existing
case), so the cause of their illnesses was not known at the time. These extra deaths were
probably reported as pneumonia, diabetes and possibly stroke, as deaths from these
causes were higher than expected during that period and all of these causes of death
are related to COVID-19 in some way.
● It is also possible that a small number of people in Victoria died of COVID-19 during the
second wave but were not recorded as such. The numbers involved are much smaller
than for the first wave and could be due to random fluctuation.
● For stroke, there could be a genuine increase in deaths from this cause in both the first
and second waves due to a reluctance to seek medical treatment during times of high
COVID-19 outbreaks.
● For dementia, it is not clear to us whether some of these deaths are also potentially
undetected COVID-19 deaths, or if it is a case of our modelling not predicting dementia
deaths as well as it predicts other causes. Dementia deaths were also high in one week
in Victoria near the start of the second wave which may be related to the significant
COVID-19-related issues aged care homes were experiencing at that time.
● The higher numbers of deaths in Victoria in the second wave from COVID-19-linked
causes do not fully account for the jump in deaths - the remaining impacts are due to
random fluctuation rather than a trend in any particular cause.
Research Note-3 • Actuaries Institute 20Deaths from respiratory disease have driven the lower numbers of deaths since early-May, both
where respiratory illness is the primary cause of death and where it is a significant contributing
factor. Overall, the various non pharmaceutical measures to reduce the spread of COVID-19 across
Australia (lockdowns, social distancing measures, wearing of facemasks, etc) have almost certainly
reduced mortality from other causes across Australia.
The following sections show the causes of death in more detail. For the four specific causes of
death with potential links to COVID-19 deaths (pneumonia, diabetes, cerebrovascular disease and
dementia), we have shown graphs for Australia in total and for Victoria only (concentrating on the
second wave).
Respiratory deaths
Weekly scaled actual and predicted doctor-certified deaths
Actual deaths are scaled to 2020 allowing for population growth and change in age profile; 2020 deaths include allowance for late reporting.
Predicted deaths come from the linear trend in each week’s scaled deaths in 2015 to 2019.
During the first wave, deaths from pneumonia were significantly higher than predicted and well
above the 95th percentile for the three weeks ending 31 March, 7 April and 14 April. We understand
that COVID-19 often presents as similar to pneumonia, and strongly suspect that some ‘pneumonia’
deaths during the first wave were undetected COVID-19 deaths.
Since mid-April, deaths from pneumonia have been lower than predicted, and significantly below the
5th percentile from mid-June – in turn, due to measures taken to reduce the spread of COVID-19.
During Wave 2, after testing capacity had been expanded, we did not observe any increase in
pneumonia deaths for Australia as a whole.
We strongly
suspect some
‘pneumonia’
deaths during
the first wave
were undetected
COVID-19 deaths.
Research Note-3 • Actuaries Institute 21Weekly scaled actual and predicted doctor-certified deaths
Actual deaths are scaled to 2020 allowing for population growth and change in age profile; 2020 deaths include allowance for late reporting.
Predicted deaths come from the linear trend in each week’s scaled deaths in 2015 to 2019.
In Victoria, there was a small increase in pneumonia deaths in the last week of July, however the
number of deaths involved is very small (around five more deaths than the preceding weeks).
Weekly scaled actual and predicted doctor-certified deaths
Actual deaths are scaled to 2020 allowing for population growth and change in age profile; 2020 deaths include allowance for late reporting.
Predicted deaths come from the linear trend in each week’s scaled deaths in 2015 to 2019.
Influenza deaths have been almost non-existent in Australia since mid-April. There have been only
three influenza deaths since 15 April 2020, compared to an expected number of around 600 in a
‘normal’ flu season. This will be due to the absence of influenza in Australia in 2020 because of
social distancing measures and perhaps also because of the closed international borders.
Research Note-3 • Actuaries Institute 22Weekly scaled actual and predicted doctor-certified deaths
Actual deaths are scaled to 2020 allowing for population growth and change in age profile; 2020 deaths include allowance for late reporting.
Predicted deaths come from the linear trend in each week’s scaled deaths in 2015 to 2019.
Deaths from chronic lower respiratory disease have been much lower than usual since end-April.
There appears to be a ‘baseline’ number of deaths from this cause of around 130 deaths per week.
Deaths normally increase above this baseline level during the winter flu season. There was no
increase this year, with deaths remaining at around 130 per week.
Weekly scaled actual and predicted doctor-certified deaths
Actual deaths are scaled to 2020 allowing for population growth and change in age profile; 2020 deaths include allowance for late reporting.
Predicted deaths come from the linear trend in each week’s scaled deaths in 2015 to 2019.
Deaths from other respiratory diseases have also remained at their baseline level of around 60
deaths per week throughout 2020, with no winter flu impact (noting the seasonal impact on these
causes of death are lower than for pneumonia, influenza and lower respiratory disease).
Research Note-3 • Actuaries Institute 23Weekly scaled actual and predicted doctor-certified deaths
Actual deaths are scaled to 2020 allowing for population growth and change in age profile; 2020 deaths include allowance for late reporting.
Predicted deaths come from the linear trend in each week’s scaled deaths in 2015 to 2019.
The total graph for all respiratory disease shows that many deaths from respiratory disease have
been avoided in Australia as a result of measures to control and eliminate COVID-19.
Causes of death with potential links to COVID-19
Weekly scaled actual and predicted doctor-certified deaths
Actual deaths are scaled to 2020 allowing for population growth and change in age profile; 2020 deaths include allowance for late reporting.
Predicted deaths come from the linear trend in each week’s scaled deaths in 2015 to 2019.
Diabetes is a known comorbidity of COVID-19. As for pneumonia, diabetes deaths were significantly
higher than predicted and above the 95th percentile for the three weeks ending 31 March, 7 April and
14 April. Diabetes deaths continued to be higher than the 95th percentile for the next three weeks,
possibly indicating undiagnosed COVID-19 deaths.
Since early-May, diabetes deaths have generally been close to expected, aside from three outliers in
mid-October and mid-November. We did not observe any increase in diabetes deaths for Australia in
total during the second wave.
Research Note-3 • Actuaries Institute 24Weekly scaled actual and predicted doctor-certified deaths
Actual deaths are scaled to 2020 allowing for population growth and change in age profile; 2020 deaths include allowance for late reporting.
Predicted deaths come from the linear trend in each week’s scaled deaths in 2015 to 2019.
In Victoria, there were two weeks during the second wave where diabetes deaths were higher than
predicted by around 7-10 deaths, possibly indicating a small number of undiagnosed COVID-19 deaths.
Weekly scaled actual and predicted doctor-certified deaths
Actual deaths are scaled to 2020 allowing for population growth and change in age profile; 2020 deaths include allowance for late reporting.
Predicted deaths come from the linear trend in each week’s scaled deaths in 2015 to 2019.
Deaths from cerebrovascular disease have generally been reasonably close to or lower than
predicted numbers. The exception to this is the three-week period during the first wave (31 March to
14 April), where deaths from this cause were higher than predicted, and above the 95th percentile for
the week ending 7 April.
Information from Monash University indicates that the number of brain scans for stroke reduced
quite dramatically in the week ending 31 March 2020 (down by around one third). This may indicate
people were not presenting to hospital with stroke as early as they normally would, possibly due
to fears of visiting healthcare settings. For a disease where time is of the essence, this may be a
Research Note-3 • Actuaries Institute 25contributor to the much higher number of stroke deaths than usual over this three-week period. We
also note that stroke is a known complication of COVID-19.
During the second wave, deaths from cerebrovascular disease were lower than predicted Australia-wide.
However, if we examine Victoria in isolation, we can see that there were two weeks during the second
wave when deaths from this cause were higher than predicted and higher than the 95th percentile.
Weekly scaled actual and predicted doctor-certified deaths
Actual deaths are scaled to 2020 allowing for population growth and change in age profile; 2020 deaths include allowance for late reporting.
Predicted deaths come from the linear trend in each week’s scaled deaths in 2015 to 2019.
There were around 20 more stroke deaths than predicted in Victoria in each of the two high weeks
in August.
Weekly scaled actual and predicted doctor-certified deaths
Actual deaths are scaled to 2020 allowing for population growth and change in age profile; 2020 deaths include allowance for late reporting.
Predicted deaths come from the linear trend in each week’s scaled deaths in 2015 to 2019.
Deaths from dementia were significantly higher than predicted for five out of six weeks during
the first wave, although only the first of those weeks was above the 95th percentile. Have some
Research Note-3 • Actuaries Institute 26COVID-19 deaths been missed here? If so, we find it hard to believe that there would be many, since
many of these deaths would have taken place in nursing homes. Experience of outbreaks in nursing
homes suggests that COVID-19 would likely have spread quickly and widely in any home and would
therefore have been detected. We think it more likely that our simple linear trend calculations do not
model dementia deaths as well as those from other causes.
Deaths from dementia have since fallen below predicted numbers for almost all weeks. It is
plausible that the reduction in common respiratory illnesses in the community led to lower deaths
from dementia and other causes, as any illness is likely to increase the mortality of the very frail or
otherwise unwell in our community.
There are two weeks during the second wave where dementia deaths are higher than surrounding
weeks. We have again examined Victorian in isolation.
Weekly scaled actual and predicted doctor-certified deaths
Actual deaths are scaled to 2020 allowing for population growth and change in age profile; 2020 deaths include allowance for late reporting.
Predicted deaths come from the linear trend in each week’s scaled deaths in 2015 to 2019.
There was one week in Victoria where dementia deaths were high (around 20 more deaths than
surrounding weeks), which coincides with one of the high Australia-wide points (week ending
28 July). These higher deaths may be related to the significant issues aged care homes were
experiencing at that time.
Lower dementia
deaths over
winter are likely
due to the lower
prevalence of
respiratory
disease.
Research Note-3 • Actuaries Institute 27Deaths from Other Causes
Weekly scaled actual and predicted doctor-certified deaths
Actual deaths are scaled to 2020 allowing for population growth and change in age profile; 2020 deaths include allowance for late reporting.
Predicted deaths come from the linear trend in each week’s scaled deaths in 2015 to 2019.
Cancer deaths do not appear to have been particularly affected by the pandemic, with deaths in
2020 generally within a reasonable range of predicted numbers. There is evidence however that
some cancer screening and therapeutic procedures dropped off during the first wave. To the extent
that deaths are caused by delayed diagnoses or missed treatments due to people avoiding health
care settings in 2020, these are unlikely to show up in the data yet - it is likely that any consequential
adverse impact on mortality will take some time to emerge.
Weekly scaled actual and predicted doctor-certified deaths
Actual deaths are scaled to 2020 allowing for population growth and change in age profile; 2020 deaths include allowance for late reporting.
Predicted deaths come from the linear trend in each week’s scaled deaths in 2015 to 2019.
Deaths from ischaemic heart disease (primarily heart attack and coronary heart disease) are close
to predicted in 2020, continuing the downward trend in mortality from this cause.
Research Note-3 • Actuaries Institute 28Weekly scaled actual and predicted doctor-certified deaths
Actual deaths are scaled to 2020 allowing for population growth and change in age profile; 2020 deaths include allowance for late reporting.
Predicted deaths come from the linear trend in each week’s scaled deaths in 2015 to 2019.
All other doctor-certified deaths are similar to predicted levels other than for most of March
(relatively high during the first wave) and from mid-June to mid-October (relatively low during the
usual winter flu season).
Summary of doctor-certified deaths
Year to 29 December – Actual vs Predicted
Cause of Death Actual Predicted Difference % Diff Contribution
Respiratory disease
Lower respiratory 6,656 7,898 (1,241) -16% -0.9%
Influenza 42 648 (606) -94% -0.4%
Overall, there
Pneumonia 2,085 2,967 (882) -30% -0.6%
were around
3,900 fewer Other respiratory 3,197 3,689 (492) -13% -0.3%
deaths in 2020 Total 11,980 15,201 (3,221) -21% -2.2%
than predicted,
driven by Cancer 47,786 48,154 (368) -1% -0.3%
lower levels Heart disease 13,442 13,423 19 0% 0.0%
of respiratory
illness. Cerebrovascular 8,954 8,911 43 0% 0.0%
disease
Dementia 14,439 15,197 (758) -5% -0.5%
Diabetes 4,844 4,516 328 7% 0.2%
Other 38,473 39,215 (742) -2% -0.5%
Total 127,938 129,416 (1,478) -1% -1.0%
COVID 832 - 832 0.6%
Total 140,750 144,617 (3,867) -2.7% -2.7%
Overall, there were around 3,900 (2.7%) fewer deaths in 2020 than predicted.
Research Note-3 • Actuaries Institute 29This is driven by lower numbers of deaths from respiratory illness (around 3,200 fewer
than predicted). Higher than expected deaths from pneumonia at the end of March (likely
undiagnosed COVID-19) have been more than offset by the much lower numbers of all respiratory
deaths since mid-April. While much of the press has focussed on lower levels of influenza deaths,
these account for only around 20% of the reduction in respiratory deaths. Pneumonia causes
more deaths than influenza, and chronic lower respiratory disease kills more than the other
two combined.
Deaths from non-respiratory causes are also lower than predicted by around 1,500 deaths:
● deaths from cancer are a little lower than predicted;
● deaths from heart disease are the same as predicted, as are deaths from
cerebrovascular disease (stroke, etc). For cerebrovascular disease, higher deaths than
predicted across Australia in the first wave and in Victoria in the second wave (possibly
due to undiagnosed COVID-19 or people delaying treatment) were mostly offset by lower
deaths from this cause in the rest of the year;
● deaths from diabetes are higher than expected, driven by higher than expected deaths in
the first wave (likely undiagnosed COVID-19)
● deaths from dementia and ‘other’ are lower than predicted. Higher than predicted
numbers of deaths from these causes during the first wave were more than offset by
lower than predicted deaths during the winter months as a result of lower levels of
respiratory disease.
2.4. Coroner-referred deaths in Australia in 2020
Road deaths
The Australian government publishes monthly road fatalities4 , and for the 2020 year, the number of
road deaths reduced by 7.9% per 100,000 population compared with 2019 – from 4.68 per 100,000
(1,186 deaths) to 4.31 per 100,000 (1,106 deaths). This is the lowest per population since records began
in Australia, and broadly a continuation of existing trends.
Road Deaths (adjusted for population size)
Road deaths were lower from March 2020 to May 2020, coinciding with the Australia-wide
lockdown during the first wave. Since then, road deaths in 2020 have been broadly similar to 2018
4 Road Fatalities Australia
Monthly Bulletin and 2019.
December 2020: https://
www.bitre.gov.au/sites/
default/files/documents/
Road deaths went up in two states compared with previous years – Queensland and Tasmania, but
rda_dec2020.pdf in both cases the five year trend is still down.
Research Note-3 • Actuaries Institute 30Suicide deaths
In 2020, three states published preliminary suicide statistics:
● For NSW, 5 there were 896 suspected or confirmed suicides in 2020, 47 (5%) fewer than
in 2019.
● In Victoria 6 , there were 698 suspected or confirmed suicides in 2020, 20 (3%) fewer
than in 2019.
● In Queensland7, there were 454 suspected or confirmed suicides in the seven months
The number of to 31 July 2020, 9 (2%) fewer than in 2019.
suicide deaths in
the two biggest Details of how the data is compiled are included in Appendix D.
states of Australia
appears not to The following charts show the monthly numbers of suicide deaths in each of Victoria and NSW, after
have increased. adjustment for changes in population size.
Suicide Deaths in Victoria (adjusted for population size)
After adjusting for increases in the size of the Victorian population, suicide deaths in 2020 were
5% lower than in 2019 overall. Reassuringly, there is no evidence of any increase in suicide over the
second lockdown period of July through to October. In fact, the months of September and October
2020 have the lowest numbers of suicide deaths of the three years shown. While this does not
preclude longer-term mental health impacts, it is good to see that the immediate impacts have not
5 NSW Suicide Monitoring
System Report 4 January led to increases in suicide rates.
202: https://www.health.
nsw.gov.au/mentalhealth/
resources/Publications/ Suicide Deaths in NSW (adjusted for population size)
suicide-monitoring-report-
jan-21.pdf
6 Coroners Court Monthly
Suicide Data Report,
December 2020
update, Coroners Court
of Victoria: https://
www.coronerscourt.
vic.gov.au/sites/
default/files/2021-01/
Coroners%20Court%20
Monthly%20Suicide%20
Data%20Report%20-%20
December%202020.pdf
7 Suicide and Self Harm
Monitoring, AIHW
website: https://www.
aihw.gov.au/suicide-self-
harm-monitoring/data/
suspected-deaths-by-
suicide/data-from-suicide-
registers
Research Note-3 • Actuaries Institute 31In NSW, after adjusting for increases in the population, suicide deaths in 2020 were 6% lower
than in 2019. While there was no discernible increase in suicide deaths during the first lockdown
period (March to May) compared with the previous year, the number of suicides in July and August
2020 were higher than in 2019. However, this was followed by a lower number of suicide deaths in
September to December 2020 compared with 2019. As data is unfortunately only available for the
two years shown, it is difficult to read much into the monthly data points.
There has been plenty of anecdotal evidence of the impact of lockdowns and other stresses on
mental health, so we were pleasantly surprised to see that the number of suicide deaths appears
not to have increased, at least not in the two biggest states of Australia. We could speculate on the
reasons for this, but we do not consider that we have any special insight. Mathematically, one of two
things has happened; either there has been no mortality impact from these stresses or there has
been an offsetting reduction in other drivers of suicide.
We are also cognisant of the potential for increases in rates of suicide in the next few years as the
longer-term consequences of financial distress can take some time to emerge.
If you or anyone you know needs support call Lifeline on 131 114, or Beyond Blue’s coronavirus mental
wellbeing support service on 1800 512 348.
Other Coroner-referred Deaths
In respect of other coroner-referred deaths for which no data is currently available, we make the
following broad comments:
We have no ● Diseases (around 9,400 in a normal year) – we would expect any changes in these deaths to
reason to expect follow a similar trend as the doctor-certified deaths i.e. a general reduction on prior years.
a significant ● Accidental deaths (around 5,800 in a normal year) – we may see an increased number
increase or of deaths from this cause based on anecdotal reports of an increased number of
reduction in total poisonings associated with hand sanitisers (poisonings usually account for around
coroner-referred 1,300 deaths). There may also be an argument for an increase in accidental deaths due
deaths. to people spending more time at home, which we might expect to be higher risk than the
workplace.
● Suicide deaths in other jurisdictions (around 1,000 in a normal year) – there is currently
no data available on suicide deaths in other jurisdictions for 2020. However, if the other
states follow the experience of Victoria, New South Wales and Queensland (and there
is no reason to think otherwise), then suicides are not likely to be a source of increased
deaths – they would, in fact, be a further source of mortality reduction in 2020.
● For other causes of death referred to the coroner, we cannot form a view, noting that
these deaths make up only a small portion of all deaths (around 600 in a normal year).
On balance, we have no reason to expect a significant increase or reduction in total coroner-referred
deaths. Given there have been around 3,900 fewer doctor certified deaths in 2020 than predicted, it
is difficult to see how increases in any category of coroner-referred deaths could offset these lower
doctor-certified deaths.
3. Long-term consequences of COVID-19
This paper has so far discussed the mortality of COVID-19. However, there are also morbidity impacts
from the disease – colloquially known as ‘Long COVID’.
8 Black Flu 1918: The story
of New Zealand’s worst These effects are of interest to those interested in public health and disability burdens (including
public health disaster, insurers) in countries with significant COVID-19 outbreaks, but also, over time will be of interest to
by Geoffrey W Rice,
published by Canterbury those in countries without outbreaks, as borders gradually open up, and some of those with long-term
University Press symptoms move to different countries.
Research Note-3 • Actuaries Institute 32You can also read