Indoor air quality investigation before and after relocation to WELL-certified office buildings
←
→
Page content transcription
If your browser does not render page correctly, please read the page content below
Indoor air quality investigation before and after relocation to
WELL-certified office buildings

Downloaded from: https://research.chalmers.se, 2021-09-29 06:12 UTC

     Citation for the original published paper (version of record):
     Licina, D., Langer, S. (2021)
     Indoor air quality investigation before and after relocation to WELL-certified office buildings
     Building and Environment, 204
     http://dx.doi.org/10.1016/j.buildenv.2021.108182

N.B. When citing this work, cite the original published paper.

research.chalmers.se offers the possibility of retrieving research publications produced at Chalmers University of Technology.
It covers all kind of research output: articles, dissertations, conference papers, reports etc. since 2004.
research.chalmers.se is administrated and maintained by Chalmers Library

                                           (article starts on next page)
Building and Environment 204 (2021) 108182
Contents lists available at ScienceDirect
Building and Environment
journal homepage: www.elsevier.com/locate/buildenv
Indoor air quality investigation before and after relocation to
WELL-certified office buildings
Dusan Licina a, *, Sarka Langer b, c
a
Human-Oriented Built Environment Lab, School of Architecture, Civil and Environmental Engineering, École Polytechnique Fédérale de Lausanne, Lausanne, Switzerland
b
IVL Swedish Environmental Research Institute, Göteborg, Sweden
c
Division of Building Services Engineering, Department of Architecture and Civil Engineering, Chalmers University of Technology, Göteborg, Sweden
A R T I C L E I N F O A B S T R A C T
Keywords: Air pollutant exposure in workplace environments has been associated with health and cognitive outcomes of
Green certification workers. While green building certification programs have been instrumental in promoting indoor air quality
Relocation (IAQ), the present literature indicates inconsistent evidence. Recent emergence and proliferation of WELL cer
Particulate matter
tification program that prioritizes human health has evoked new questions about its effectiveness in relation to
Volatile organic compounds
Thermal comfort
IAQ. To investigate the effectiveness of the WELL certification, we have quantitatively compared IAQ results
before and after relocation to two WELL-certified office buildings using the same cohort of occupants. Physical
measures included integrated samples of TVOC, individual VOC, formaldehyde and acetaldehyde, NO2, SO2, O3
and longitudinal records of CO2 and size-resolved particles. Complementary survey responses about satisfaction
with IAQ and thermal comfort were collected from ~250 employees. For the majority of air pollutants, there was
no significant concentration difference between non-WELL and WELL buildings, but not always. The WELL-
certified buildings had substantially higher levels of TVOC and individual VOC associated with paints, espe
cially shortly after the relocation. However, there was statistically significant improvement in IAQ satisfaction
after relocation into WELL buildings regardless of the air pollution levels, possibly confounded by thermal
environment, awareness of the WELL certification or other non-measurable factors.
1. Introduction symptoms (e.g. headache, shortness of breath, fatigue, eye and throat
irritation) to acute incidents, such as carbon dioxide poisoning [5] and
Since the appearance of the first green-certified buildings in the Legionnaire’s disease [6].
1990s, their performance targets have been evolving. While the green Air pollutant exposures indoors and occupant satisfaction with the
building industry has a long-standing history of attention to human quality of indoor air are not only associated to health outcomes, but also
health, its core objectives prioritized mitigation of environmental to overall human well-being, cognitive performance and learning
impact by reducing energy and water use, waste production and site [7–12]. In workplace environments particularly, this comes with enor
disturbance. More recently, we have witnessed a shift in the prioritiza mous economic implications [13], as the costs of office employees are
tion of objectives relative to the others, with a stronger emphasis on estimated to be two orders of magnitude higher than operating costs
building characteristics that explicitly promote the experience of associated with building energy use [14,15]. This offers a compelling
building occupants. This came as a result of several decades of research case for the building industry as reflected in the recent emergence of
and industry insights on adverse implications of poor indoor environ green building certification schemes that prioritize human health.
ments on well-being and that more effective interventions were possible. However, while the benefits related to energy and water savings are
For instance, energy conservation measures such as tightening the relatively well-documented [16], the IAQ and occupant satisfaction in
building envelope to reduce uncontrolled outdoor air infiltration [1,2], green buildings are only recently being studied [17].
have led to impaired perception of air quality and increased incidence of Majority of research examining the performance of green-certified
building related subclinical health symptoms — also known as Sick buildings in relation to IAQ and occupant satisfaction stem either from
Building Syndrome (SBS) symptoms [3,4]. These can vary from mild green-certified buildings alone, or from comparative studies between
* Corresponding author.
E-mail addresses: dusan.licina@epfl.ch, licinadusan@yahoo.com (D. Licina).
https://doi.org/10.1016/j.buildenv.2021.108182
Received 21 April 2021; Received in revised form 7 July 2021; Accepted 19 July 2021
Available online 21 July 2021
0360-1323/© 2021 The Authors. Published by Elsevier Ltd. This is an open access article under the CC BY license (http://creativecommons.org/licenses/by/4.0/).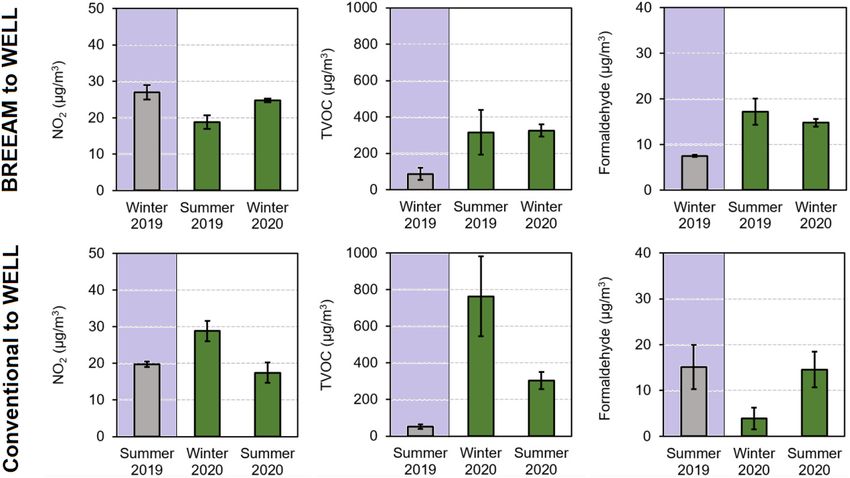
D. Licina and S. Langer Building and Environment 204 (2021) 108182
green-certified and conventional buildings. In spite of the general un before relocation (from BREEAM-certified and conventional), and to
derstanding that green-certified office buildings result in better IAQ and quantitatively compare the results after the relocation to the two WELL-
occupant satisfaction [18], reviews of the recent literature indicate an certified office buildings using the same cohort of occupants. In this
equivocal nature of the findings [19]. While multiple studies found that study, we also seek to understand the effect of source contribution and
green-certified office buildings contribute to improved perception of seasonal variations on physical and subjective IAQ assessment, as well as
IAQ relative to conventional offices [20–25], others reported matching possible confounding influences of thermal environment.
[26–29] or even lower satisfaction levels [30,31]. Except a few notable
studies [24,32–34], a common attribute of available research is that a 2. Methods
very few included direct comparison of subjective measures before and
after relocation to a green-certified building with a same cohort of oc 2.1. Study sites
cupants. Because humans are different (age, gender, job responsibilities,
etc.) and organizational structures differ from one company to another, Two office building pairs located in one of the large cities in the
it is important to control for confounding factors. This can be achieved Netherlands were selected as study sites (in total four buildings). The
by having comparison groups which are based on the same occupancy selection criteria included the following: a) that a company of each
cohorts. building plans to relocate into a WELL certified building during 2019; b)
Another common attribute is that the majority of IAQ-related studies that company has minimum of 50 workers to achieve sufficient statis
in green-certified buildings are based on self-reported and subjective tical power for subjective data; and c) that building managers are willing
measures on IAQ from post occupancy surveys only. Relatively few to take part in the study and facilitate its execution.
studies in green-certified buildings performed physical measurements of Out of two companies that fulfilled this criteria, Company A already
IAQ or even less a combination of both physical and subjective in had BREEAM certification before the relocation while Company B was a
vestigations. Among a handful of studies including physical measure conventional non-certified building. Distance between the pre- and post-
ments of IAQ, they focused on air pollutants such as carbon dioxide [21, relocation buildings was relatively low (2.3 km for Company A; 6.7 km
23,35–38], carbon monoxide [21,36,39], total or individual volatile for Company B). Therefore, differences in terms of the level of urbani
organic compounds (VOC) [23,35,36,39,40] ozone [39], particulate zation and outdoor climate were small; the latter was confirmed by the
matter [21,35,36,39], and biological samples of bacteria and fungi [36, outdoor climate measurements performed throughout the campaign
39]. Many of these studies are short-term and lack longitudinal assess (Table S1). Company A counted a much higher number of employees
ment over multiple seasons. In addition, the subjective results of IAQ (here referred to occupants) and their number increased to 500 by the
assessment are rarely connected to the physical and chemical mea end of the study. Company B had a stable number of occupants (70). All
surements [17,41]. Notably, none of the existing studies directly buildings were mechanically ventilated with 100% outdoor air,
compared IAQ performance between two different green-certification designed in accordance with local Dutch standard NEN 1087. Table 1
schemes based on occupancy transitioning from one to another summarizes key characteristics of the selected case study buildings.
green-certified building.
Along the above mentioned knowledge gaps, it is important to 2.2. Field campaign design
recognize the recent emergence and rapid adoption of several green
certification schemes that prioritize occupant health [e.g., 42,43. In this The study consisted of three 4-weeks long measurement campaigns
context, the WELL v2 certification is the most rapidly growing green per company (in total 6 campaigns): 1) within 3 months before reloca
rating system worldwide that aims to promote health-based building tion, 2) within 3 months after the relocation, and 3) after additional 7–8
design and operation [42]. The WELL certification encompasses ten months from the second campaign (Fig. 1). The purpose of the additional
health-relevant concepts, four of which relate to measurable indoor measurement campaign during the post-relocation phase was to probe
environmental quality (Air, Light, Thermal Comfort and Sound). The Air the time effect after moving into a new/renovated office building on
concept has four requirements: 1) meeting specific thresholds for par physical and subjective IAQ assessment. All campaigns fell into winter
ticulate matter (PM2.5 and PM10), organic gases (benzene, formalde and summer seasons. The last measurement campaign for Company B
hyde, toluene and TVOC (Total Volatile Organic Compounds)) and was delayed by three months as a result of work-from-home requirement
inorganic gases (carbon monoxide and ozone), 2) provision of during Covid-19 pandemic. The occupants returned to their office in
smoke-free environment, 3) meeting requirements of conventional August 2020, and the campaign was executed one month later.
building ventilation standards, and 4) managing air pollution during The air temperature, relative humidity, carbon dioxide (CO2) and
building construction and renovation. Other strategies that lead to size resolved particle number concentration (0.3–10 μm) were contin
further indoor air quality enhancement are optional (e.g., more stringent uously monitored and recorded during the field campaigns. The longi
threshold for indoor air pollutants (including nitrogen dioxide and a tudinal measurements continued for four consecutive weeks. Additional
broader suite of VOC), enhanced ventilation based on low CO2 levels, integrated samples were used to collect information about levels of
enhanced filtration, air quality monitoring, source separation, adoption TVOC and selected individual VOC, formaldehyde and acetaldehyde,
of materials that reduce hazardous VOC and SVOC emissions, relative sulphur dioxide (SO2), nitrogen dioxide (NO2), and ozone (O3). These air
humidity control, etc.). Pursuing these optional strategies is needed to pollutants are known to be commonly present in office spaces [44,45].
achieve higher levels of certification, such as Silver, Gold or Platinum. Except SO2 and certain VOCs, majority of measured parameters are
Another important feature of the WELL v2 certification is the need for incorporated into the WELL v2 certification. Duration of integrated
recertification every three years to assure continuous performance of sample collection was limited to seven days, and it was always sched
buildings. uled in the first week of a campaign.
To date, no studies have investigated the success of WELL- In each campaign, there were at least four measurement and sam
certification program relative to other green-certified and conven pling locations: open space office, meeting room, private office and
tional buildings. Specifically, it is not known whether WELL-certified outdoors. The three indoor locations contained the full suite of air
buildings lead to improved IAQ relative to other buildings. This study quality devices and samplers. The measuring devices and samplers were
is the first that contributes to bridging this knowledge gap by quanti normally positioned at the workstation around the breathing zone
tatively comparing physical and subjective IAQ measures before and height, within 1.0–1.2 m height above the floor. They were also placed
after relocation to two WELL-certified office buildings using the same at least 1.5 m away from the breathing zone, doors, walls, windows and
cohorts of occupants. The primary objective of this study is to assess ventilation diffusers. Not positioning the monitors and samplers directly
physical and subjective IAQ parameters in the two office buildings in the breathing zone could lead to underestimation of true inhalation
2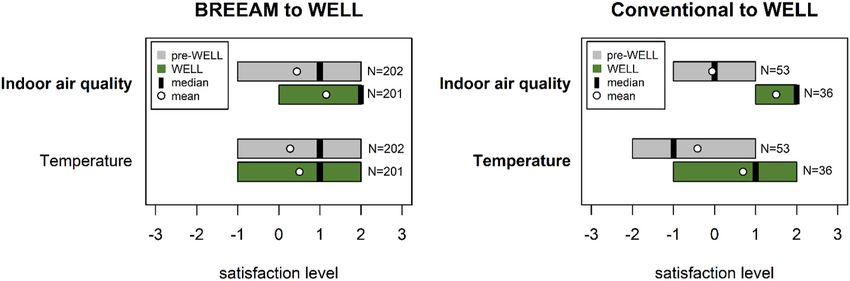
D. Licina and S. Langer Building and Environment 204 (2021) 108182
Table 1
Characteristics of building pairs selected as case studies.
Company A Company A Company B Company B
Pre-relocation Post-relocation Pre-relocation Post-relocation
Certification BREEAM-NL WELL v2 None WELL v2
BREEAM-NL
Certification level/ BREEAM Asset “Very Good”; Building Management WELL Platinum/ – WELL Platinum/Core&Shell;
type “Good” Core&Shell BREEAM Excellent/New
Construction
Construction year 2009 1960 1950 2020
Renovation year None 2020 2002 None
No of employees 464 500 70 70
No of workstations 288 309 64 84
Mechanical 100% filtered outdoor air 100% filtered outdoor air 100% filtered outdoor 100% filtered outdoor air
ventilation air
Ventilation operation Mon-Fri 7:00–19:00h; Mon-Fri 7:00–19:00h; Mon-Fri 7:00–20:00h; Mon-Fri 6:00–19:00h;
50% rest of the time 50% rest of the time 50% rest of the time 50% rest of the time
Heating/Cooling Fan-coil Fan-coil Fan-coil Radiant ceiling
Area (m2) 4223 4361 1210 1220
Fig. 1. Stages of the field campaigns with the associated timelines.
exposures associated with particles [46] and CO2 [47]. Additional
Table 2
continuous measurements of CO2, air temperature and relative humidity
Summary of monitored air pollutants and sampling/analysis methods.
were taken in the hallways and kitchens. Outdoors, we measured only
NO2, SO2 and O3 in addition to air temperature and relative humidity. Air pollutant Method Manufacturer/
Laboratory
The outdoor monitoring kit was positioned on the building façade of the
first floor of the building, at least 3 m above the ground level. Particulate matter optical particle counter 1) Met One HHPC 6+,
that sizes particles based Beckman
resolved particle number on light scattering Coulter Life Sciences,
2.3. Experimental equipment and sampling concentration in six size IL, USA
bins: 0.3–0.5; 0.5–1; 2) GrayWolf PC-3500,
The measurements of CO2 and particle number concentration were 1–2.5; 2.5–5; 5–10 GrayWolf Sensing
taken with 5-min resolution to record unsteady responses to dynami Solutions, CT, USA
Carbon dioxide (CO2) non-dispersive infrared HOBO MX CO2 Data
cally changing conditions typically encountered in office buildings. also includes air self-calibrating CO2 Logger, Onset
Table 2 summarizes the information of measured air pollutants, mea temperature and relative sensor with reported Computer Corporation,
surement methods, instrument models, technical and analysis humidity records accuracy of ±50 ppm MA, USA
specifications. and ±5% of reading
TVOC (n = 20 individual diffusive sampling on Markes International,
IVL (Swedish Environmental Research Institute) diffusive samplers
VOC) Llantrisant, UK
[48] were used for measurements of concentrations of NO2, SO2 and O3. Individual VOC are Tenax TA adsorbent
The samplers are cylinders with a diameter of 25 mm and height of 13 presented in Table 4 tubes. In compliance
mm. The sampling technique is based on molecular diffusion. The with ISO 16017–2 [49]
compounds are quantitatively collected on an impregnated membrane Aldehydes (n = 2) diffusive sampling on Suppelco, Bellefonte,
Formaldehyde, DSD-DNPH Aldehyde PA, USA
during a period of time. For measurements of TVOC (including indi acetaldehyde Diffusive Sampling
vidual VOC), formaldehyde and acetaldehyde, selective diffusive de Device. In compliance
vices were used (Table 2). with ISO 16000–4 [50]
Nitrogen dioxide (NO2) Diffusive sampling IVL diffusive sampler
Sulphur dioxide (SO2) Diffusive sampling IVL diffusive sampler
2.4. Questionnaire surveys
Ozone (O3) Diffusive sampling IVL diffusive sampler
In addition to physical measurements, a web-based survey ques
tionnaire was administered to building occupants during each campaign (including lighting, acoustic, cleanliness, maintenance, office furnish
(three per company, six in total; see Fig. 1). Each survey remained open ings and layout and overall workplace satisfaction) [51,52],
for three weeks and the building management sent two follow up emails self-assessed productivity and sick building syndrome symptoms. Here,
in order to augment the response rate. The results reported in this study we focused on questions relating to IAQ and temperature satisfaction
are part of a more comprehensive survey study that aimed to evaluate before and after the relocation along with potential sources of
the perceived occupant satisfaction with indoor environmental quality dissatisfaction.
3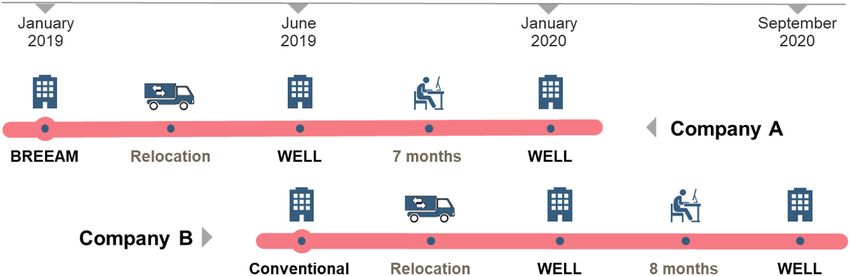
D. Licina and S. Langer Building and Environment 204 (2021) 108182
The satisfaction questions were answered by means of standardized 2.6. Quality assurance
7-point scale ranging from “very dissatisfied” (− 3) to “very satisfied”
(+3), with a neutral midpoint (0). Answers marked with “dissatisfied” For accurate comparison of results recorded with multiple CO2
prompted more thorough follow up questions to gain insights into monitors and two brands of optical particle counters (Table 2), we
sources of dissatisfaction with IAQ and thermal comfort. performed data correction using adjustment factors derived from mul
The collected response rate varied between 31 and 44% across all six tiple side-by-side tests of instrument performance through the campaign
campaigns. In Company A, we collected responses from 202 occupants (Table S2). Flow rate checks for particle counters were conducted at the
before relocation, followed by 203 and 253 responses after relocation to beginning and the end of the measurement campaigns and all the results
the WELL-certified building. In Company B, we collected responses from were always within the 4% range reported by the manufacturers (2.83
53 respondents in the conventional building (pre-relocation), and sub L/min). The performance of CO2 monitors was within manufacturer-
sequently 36 and 39 responses in the WELL-certified building (post- specified values. Adjustment of CO2 values was not needed as the rela
relocation). tive differences were always below 3% considering the range between
400 and 1000 ppm.
The analytical procedures for the inorganic air pollutants are
2.5. Data analyses and statistical methods accredited by the Swedish accreditation agency SWEDAC. The limit of
detection (LOD) was 0.7 μg/m3 for SO2 and NO2 and 7 μg/m3 for ozone.
The continuous data were processed in a way to retain only working The measurement uncertainty was, at 95% confidence level, 12% for
hours (08:30–20:30h) while excluding weekends and public holidays. SO2 and 10% for NO2 and ozone. The procedures for the determination
The assumption of the 12 h occupancy therefore represents the lower- of TVOC and the aldehydes followed IVL’s internal methods, based on
bound estimate of the physical IAQ data because the majority of em the ISO standards. The LODs for individual VOC, formaldehyde and
ployees are present during 9 h only. The PM10 and PM2.5 mass levels acetaldehyde were 0.1 μg/m3, 0.06 μg/m3 and 0.3 μg/m3, respectively,
were computed by summing estimated particle mass concentrations in based on 3 times the signal-to-noise ratio and 7-days sampling period.
the size bins between 0.3 and 2.5 μm, and between 0.3 and 10 μm, The corresponding measurement uncertainties were 10%, 20% and 40%
respectively. Contribution of particles with optical diameter
D. Licina and S. Langer Building and Environment 204 (2021) 108182
Fig. 2. Boxplots of air temperature, relative humidity
and concentrations of CO2 before and after relocation
into the two WELL-certified office buildings. The re
sults are averaged across three measurement locations
(open space, private office and meeting room).
Shaded purple areas represent pre-relocation condi
tions, either from BREEAM (Company A) or from
conventional building (Company B). The results are
obtained based on 5-min mean concentrations. Box
plots indicate 1st quartile, mean (while circles), me
dian and 3rd quartile values. The ends of the whiskers
represent 5th and 95th percentiles. (For interpretation
of the references to colour in this figure legend, the
reader is referred to the Web version of this article.)
Table 3
Descriptive data of dry-bulb temperature, relative humidity, CO2, particle mass below 2.5 μm (PM2.5) and particle mass below 10 μm (PM10) levels recorded in the two
companies before and after their relocation into WELL buildings.
T (◦ C) RH (%) CO2 (ppm) PM2.5 (μg/m3) PM10 (μg/m3)
mean ± sd P95 mean ± sd P95 mean ± sd P95 mean ± sd P95 mean ± sd P95
Company A 22.5 ± 0.7 23.5 29 ± 5 38 650 ± 153 929 3.1 ± 1.9 6.9 15.2 ± 5.8 25.7
Winter 2019
Company A 22.4 ± 0.6 23.5 52 ± 8 63 513 ± 84 660 2.2 ± 1.7 4.5 12.2 ± 9.6 24.3
Summer 2019
Company A 22.3 ± 0.4 23.0 37 ± 3 42 521 ± 91 710 2.5 ± 1.6 5.8 9.9 ± 5.6 19.9
Winter 2020
Company B 24.7 ± 0.6 25.7 47 ± 5 56 445 ± 39 520 2.4 ± 1.8 6.1 8.7 ± 6.2 17.0
Summer 2019
Company B 22.0 ± 0.7 23.0 38 ± 5 45 625 ± 130 883 1.9 ± 1.5 4.2 7.3 ± 7.2 11.2
Winter 2020
Company B 22.5 ± 0.6 23.7 56 ± 10 73 556 ± 81 710 1.9 ± 1.2 4.3 6.5 ± 3.6 13.4
Summer 2020
in winter 2020 was better, averaging at 37%. In Company B, relative recorded in the two building pairs before and after relocation into the
humidity before relocation (conventional building) was near the optimal WELL-certified buildings. Additional statistics is presented in Table 3.
level (mean = 47%) with low fluctuations (interquartile range (IQR) = The monitored PM2.5 mass concentrations in all buildings were low,
8%). One year later (summer 2020), the humidity levels in the ranging from 1.9 μg/m3 to 3.1 μg/m3. The influences of building certi
WELL-certified buildings averaged at 56% with relatively high oscilla fication labels or seasons were not obvious. These results are in good
tions (standard deviation = 10%, IQR = 16%). During 5% of the occu compliance with the mean results reported in a modern office building
pied hours, the relative humidity in the WELL-building was 73% which in Finland (2.7–3.4 μg/m3), but lower than the maximum values iden
exceeds even the loosest requirements of EN16798 and ISO 17772 tified in the OFFICAIR study (for Hungary, mean PM2.5 was in the range
(Category 3 upper limit = 70%) [59,60] and the maximum permissible 9.7–32 μg/m3) [45]. Other studies reported the mean PM2.5 mass con
level of 65% prescribed by ASHRAE [61]. This results also indicates that centration of 15 μg/m3 in Belgian offices [63] and 34.5 μg/m3 in offices
this building would not meet the requirement of a credit “T07 Humidity in Paris [64]. These studies were performed by means of gravimetric
Control” of the WELL v2 guideline that specifies that relative humidity analysis with particle collection on a filter, unlike our study which relied
must be maintained within 30–60% at all times [42]. on several assumptions for particle number to mass conversion.
The CO2 levels in both building pairs were within the range typical of Considering PM10 mass, the mean levels spanned from 6.5 μg/m3 to
properly ventilated buildings [62]. Factors influencing the variability of 15.2 μg/m3, with slightly lower levels reported in the WELL-certified
CO2 concentrations could be mainly attributed to variable occupancy buildings relative to BREEAM and conventional buildings. These levels
rates, as the HVAC systems delivered a constant amount of outdoor air. are substantially lower than typical concentrations reported in other
In Company A, relocation from BREEAM to WELL-certified building building types, such as schools (median = 102 μg/m3) and homes
resulted in lower mean CO2 levels, from 650 to ~520 ppm. In Company (median = 34.7 μg/m3) [65], and slightly lower than levels reported in
B, relocation from conventional to WELL building increased the mean other offices (mean = 20 μg/m3) [63]. The main source of the PM10 mass
CO2 concentrations from 445 to 625 ppm. Considering that number of concentrations were building occupants, almost exclusively within the
occupant and office space were kept steady before and after relocation, coarse (2.5–10 μm) particle size fraction. This is evident from the
the reported difference could be attributed to improved airtightness in comparison in PM10 mass concentrations during occupied and unoccu
the building after relocation. Considering 95th percentile values, they pied hours; the PM10 levels during occupied hours of Company A
were always within the limits of Category 1 (550 ppm above outdoor averaged across all three campaigns at 12.4 μg/m3 which was substan
level) of the Standards [59,60]. tially higher than 4.2 μg/m3 recorded during unoccupied hours. In
Fig. 3 shows box plots of PM2.5 and PM10 mass concentrations Company B, this difference was comparably high (7.5 μg/m3 vs 4.2
5
D. Licina and S. Langer Building and Environment 204 (2021) 108182
Fig. 3. Boxplots of particle mass concentrations
(PM2.5 and PM10) before and after relocation into the
two WELL-certified office buildings. The results are
averaged across three measurement locations (open
space, private office and meeting room). Shaded
purple areas represent pre-relocation conditions,
either from BREEAM (Company A) or from conven
tional building (Company B). The results are obtained
based on 5-min mean concentrations. Box plots indi
cate 1st quartile, mean (while circles), median and
3rd quartile values. The ends of the whiskers repre
sent 5th and 95th percentiles. (For interpretation of
the references to colour in this figure legend, the
reader is referred to the Web version of this article.)
μg/m3). Differences between occupied and unoccupied hours were not the recommended ambient annual mean limits of WHO AQG for PM2.5
discernible for smaller particles (PM2.5), indicating that large particle (10 μg/m3) and PM10 (20 μg/m3), and below the recommended 24-h
concentrations are dominated by occupancy, whereas small particles are mean limits for PM2.5 (25 μg/m3) and PM10 (50 μg/m3) [68]. It should
governed by outdoor air. Similar findings are published for other indoor however be noted that these guidelines pertain to outdoor air, and
environments [66,67]. outdoor particles can differ in composition and morphology relative to
Comparison of the recorded PM2.5 and PM10 mass concentrations those indoors [68]. At present, there is insufficient scientific evidence
against the standard values reveals that both building pairs were below for establishing limits for indoor particle mass concentrations [69]. The
Table 4
Mean and standard deviation of concentrations of sulphur dioxide, ozone, nitrogen dioxide, TVOC, aldehydes and the most abundant individual VOC (μg/m3 as toluene
equivalent or using compound specific response factors), recorded in the two companies before and after their relocation into WELL buildings. The results are averaged
across three measurement locations (open space, private office and meeting room). All values as expressed in μg/m3.
Air pollutant Company A Company A Company A Company B Company B Company B
BREEAM Winter WELL Summer WELL Winter Conventional Summer WELL Winter WELL Summer
2019 2019 2020 2019 2020 2020
Sulphur dioxideD. Licina and S. Langer Building and Environment 204 (2021) 108182
95th percentile PM10 values in both BREEAM and WELL-certified below the guideline values for indoor environments of 300 μg/m3
buildings were ~25 μg/m3. The mean PM10 results suggest that both specified by BREEAM [73] and the German Committee on Indoor Guide
WELL-certified buildings would generally comply with the enhanced Values [74]. These values were similar to TVOC concentrations
thresholds for particulate matter of the WELL v2 (Feature 05 “Enhanced measured in 176 modern, urban office buildings in subarctic climate of
Air Quality”: PM2.5 = 10 μg/m3 or lower; PM10 = 20 μg/m3 or lower). Finland [75]; the geometric mean concentrations were 88 μg/m3 in of
However, the WELL v2 guideline does not specify duration of compli fice rooms and 75 μg/m3 in the open plan offices. In our study, the
ance, meaning that if the building performance verification would take average TVOC concentrations significantly increased after the re
place during the 5% of the time when the PM10 levels were higher (~25 locations to WELL buildings: in Company A to 316 μg/m3 in summer and
μg/m3), the building would not meet the requirements. 325 μg/m3 in the following winter; the values slightly above the refer
enced threshold (300 μg/m3). In Company B after the relocation, the
3.2. Summary of time-integrated air pollution data mean TVOC concentration was 760 μg/m3 in the winter but it decreased
to 304 μg/m3 in the following summer. Therefore, shortly after the
The results from the time-integrated measurements are presented in relocation, the TVOC levels were above the TVOC threshold of 500
Table 4. The inorganic air pollutants sulphur dioxide (SO2), nitrogen μg/m3 specified by WELL [42]. As similarly reported elsewhere, the
dioxide (NO2) and ozone (O3) typically origin from outdoor combustion concentration of most VOC decreases substantially in newly constructed
sources and photochemical reactions and are brought indoors by buildings with mechanical ventilation within the first 6 months [76].
ventilation and infiltration. SO2 in indoor air could not be detected in The average concentration of formaldehyde (Table 4 and Fig. 4)
concentrations above the LOD (0.7 μg/m3) throughout the study, before the relocation was well below the guideline value of 100 μg/m3 in
whereas outdoors concentrations were low — 0.82 μg/m3 during the the offices of Company A (7.5 μg/m3) and Company B (15 μg/m3); the
campaign in summer 2019. Indoor O3 was detected at levels above the same guideline values applies for general indoor environments [71] and
LOD (7 μg/m3) only during the summer measurements, and it ranged BREEAM [73]. After the relocation to WELL-certified buildings, the
between 9 μg/m3 and 13 μg/m3. These values were well below the WHO concentrations in the offices of Company A were 17 μg/m3 in summer
and WELL maximum thresholds of 100 μg/m3 often used as general and 15 μg/m3 in winter, and in the Company B, they were 4 μg/m3 and
guideline for IAQ (WELL v2, 2021; WHO, 2005). Indoor-to-outdoor (I/ 15 μg/m3 in winter and summer, respectively. These measured con
O) ratios for ozone were 0.22 (summer 2019) and 0.25 (summer 2020). centrations were below the WELL-compulsory guideline level for form
The I/O ratio for ozone is most often in the range of 0.2–0.7 with the aldehyde of 50 μg/m3 but above the enhanced formaldehyde threshold
lower values in buildings with low air change rate (ACR) [70]. The of 9 μg/m3.
outdoor concentrations and I/O ratios of inorganic gases are shown in Two large-scale studies report concentrations of VOC, formaldehyde
Table S3 in Supplementary Information. and acetaldehyde in European office buildings that can serve as an in
NO2 was detected in indoor air of the offices both before and after the dicator of typical exposure values: AIRMEX [77] and OFFICAIR [45].
relocation, in concentrations above the LOD (0.7 μg/m3) (Table 4 and However, both the AIRMEX study (from 2003 to 2008) and the OFFI
Fig. 4). The maximum recorded concentration was 29 μg/m3 in the CAIR study (from 2012 to 2013) did not work with the concept of TVOC
WELL-certified building of Company B. This means that all buildings as they measured only individual VOC, formaldehyde and acetaldehyde
were always below WELL and WHO guideline values ofD. Licina and S. Langer Building and Environment 204 (2021) 108182
humans (from skin); the cyclosiloxanes D4 and D5 are widely used in Table 5
cosmetics and skin care products; 1-butanol and 2-ethylhexanol are Mean and standard deviation results of occupant satisfaction with IAQ and
often reported as products of alkaline degradation of phthalates; and temperature before and after relocation into WELL buildings. The table also
acetaldehyde has sources in building materials and consumer goods. includes values for the difference or means (Δmean), significance (p-value) and
Fig. S1 summarizes the percentage contribution of various VOC cate effect size (Spearman’s rho).
gories to TVOC in the two building pairs. Company A BREEAM WELL
Glycol ethers (2-butoxyethanol, 1-(2-butoxyethoxy) ethanol, 1-(2- mean ± sd mean ± Δmean p- Spearman’s
butoxyethoxy) ethanol acetate) that are used as solvents in paints and sd value rho
cleaners were found in significantly higher concentrations in the Com Indoor air 0.44 ± 1.43 1.15 ± 0.71a 0.000 0.27
pany A after relocation to the WELL-certified building. Xylenes also quality 1.42
found in higher concentrations in both WELL-certified buildings are Temperature 0.28 ± 1.51 0.50 ± 0.23 0.122 0.08
parts of paint thinners. 2-Butanone oxime, an anti-skinning agent in the 1.53
Company B Conventional WELL
formulation of alkyd paints, primers, varnishes and stain, was the single mean ± sd mean ± Δmean p- Spearman’s
individual VOC identified in alarmingly high concentration in the WELL- sd value rho
certified building of Company B (322 μg/m3, winter). This concentration Indoor air − 0.06 ± 1.50 1.50 ± 1.56a 0.000 0.48
exceeds the German Committee on Indoor Guide Values [74] threshold quality 1.32
Temperature − 0.42 ± 1.60 0.69 ± 1.11a 0.004 0.31
of 60 μg/m3 by 5.4 times. This specific guideline value represents the
1.77
concentration of a substance which, if reached or exceeded, requires
a
immediate action as this concentration could pose a health hazard. The The statistical significance (bolded rows) was considered when the p-value is
off-gassing process led to reduced concentrations to a level below LOD below 0.05 and when the effect size (Spearman’s rho) is above 0.2.
(D. Licina and S. Langer Building and Environment 204 (2021) 108182
can explain significantly lower satisfaction scores with IAQ in conven certification labels was not obvious. However, higher concentrations of
tional building of Company B. Nonetheless, in Company A, there was no TVOC and several individual organic compounds were detected in WELL
statistically significant difference in objective and subjective measures buildings which exceeded the upper recommended standard thresholds.
of temperature between the two buildings. As explained by Hedge et al. Some of these compounds are relevant to human health, but currently
[22], other possible “interferences” of green building design could result are not embedded in the WELL certification program. For the majority of
in improved occupant satisfaction with IAQ. Being aware of VOC in WELL buildings, concentrations decreased within 7–8 months
WELL-certification could have led to “positive bias” in occupants’ after the relocation, including for TVOC (from 760 to 304 μg/m3),
satisfaction votes [84]. Additionally, “halo effect” that increases ten indicating the process of chemical off-gassing from indoor materials,
dency of occupants for positive impressions is commonly reported, particularly from solvents in paints. These findings indicate the need for
although we did not observe any significant differences by comparing obligatory adoption of low-emission materials that can mitigate the VOC
the survey results from two post-relocation datasets. Other aspects of the exposures in the early lifetime of WELL buildings. Concerning thermal
indoor environment that we did not measure [85] as well as various environment, air temperatures were kept within recommended ranges
non-measurable aspects of green-certification could have contributed to both in BREEAM and WELL buildings, and were elevated in the non-
improved satisfaction scores. certified (conventional) building (24.7 ◦ C). The relative humidity was
generally below 60%, except in one WELL building where the humidity
3.4. Study strengths and limitations was 73% during 5% of the occupied hours.
Pre- and post-relocation surveys indicated that occupants of
The uniqueness of the study comes from the ability to measure BREEAM and WELL buildings had similar levels of satisfaction with
diverse air pollutants in two companies – before and after their reloca thermal environments. Statistically significant improvements in tem
tion into WELL-certified buildings. In addition, this study is among a few perature satisfaction and thermal sensation were detected after reloca
to include a direct comparison between physical and subjective mea tion from conventional to WELL-certified building; these results were
surements of IAQ before and after relocation into green-certified well correlated with the air temperature data. Concerning IAQ, occu
buildings, and the first one to do so in WELL-certified buildings and pants were significantly more satisfied with IAQ in WELL-certified
following the same cohort of the occupants. As such, this study can buildings than those in BREEAM and conventional buildings. Notably,
inform the green building certification developers as it offers direct the improvement of satisfaction scores were higher when relocating
benchmarking of IAQ levels and occupant satisfaction scores against the from the conventional building, relative to relocating from the BREEAM
sample of green-certified and conventional buildings. building. Based on these results it can be concluded that occupants of
This study also contains several limitations. The number of examined WELL-certified buildings were more satisfied with IAQ, although the
case study buildings is small which limits the ability to assess their physical measures of IAQ were equal or even lower. This outcome may
representativeness among the existing stock of green-certified buildings. be explained in part by influences of other environmental factors, pri
We were also unable to obtain more comprehensive information about marily thermal comfort. These results may also suggest that the impact
building systems and the list of credits met by the two WELL projects, of WELL certification on occupant satisfaction could extend beyond the
which would be useful for further interpreting the physical and sub measurable IAQ parameters, which is the subject that merits further
jective results. Concerning physical measurements of IAQ, the following attention.
limitations are evident: 1) 1-month measurements during summer and While the green building industry has a long-standing history of
winter seasons cannot be considered representative of the yearlong ex attention to human health, there has been a recent shift in the prioriti
posures; 2) particle mass results are limited to several assumptions made zation of this issue relative to the others, with a new emphasis on fea
for the purpose of number-to-mass conversion; 3) time-integrated sam tures that explicitly promote the experience of building occupants. In
ples may not be representative of long-term exposures as they were this context, the WELL certification is the new and emerging rating
based on limited number of 7-days continuous sampling campaigns system that aims to promote health-based building design and opera
which includes the unoccupied office hours. It should also be noted that tion. Our results suggest that working in WELL-certified buildings leads
despite the requirements of WELL v2 for building recertification every to improved satisfaction scores with IAQ, but this data were not sup
three years, the presented results may not be fully representative of the ported with the result of physical measurements of IAQ. The current
building lifetime operational performance. requirements of WELL-certification scheme include selected air pollut
Considering subjective results, limitations are the following: 1) the ants intended to protect occupants’ health. Our results point towards the
employees of the two companies were aware of this study and of the need for inclusion of a broader suite of VOC, along with the re
building certification labels, which could have led to bias in their quirements for compliance with surveys evaluating people’s perception
perception and “halo effect” [86], although our results point towards the and satisfaction with IAQ.
absence of this effect; 2) lack of agreement between subjective and
physical data could be caused by other environmental factors which Declaration of competing interest
were not reported; 3) the percentage of survey respondents was high,
but the absolute number of responses per campaign (~250) should be The authors declare that they have no known competing financial
higher for better representativeness with a higher statistical power. interests or personal relationships that could have appeared to influence
the work reported in this paper.
4. Conclusions
Acknowledgements
This study is the first attempt to understand the performance of
WELL-certified office buildings by combining the field monitoring of The authors of this study would like to thank the employees of the
IAQ and its subjective assessment. This was done by tracking the same two companies for their generous support with accessing the building
cohort of employees who transitioned from two non-WELL buildings premises, looking after the measurement instruments and samplers and
(BREEAM-certified and conventional) to two WELL-certified buildings. for survey dissemination to their employees. Additional thanks are
Findings from the physical measurements suggest that regardless of expressed to Dr. Veronika Földváry Ličina for her technical support in
the certification status and type, all buildings maintained similarly low the study design and execution, to Ms. Serra Yildirim for her assistance
concentrations of common air pollutants (PM2.5, PM10, CO2, NO2, SO2 in subjective data analysis from the survey questionnaire, and to Dr.
and O3). For each of these air pollutants, compliance with various in Shen Yang for his help with preparing the real-time monitors. Finally,
ternational standards was achieved and the influence of green we thank Building and Environment journal for their review of this
9D. Licina and S. Langer Building and Environment 204 (2021) 108182
manuscript. [28] S. Ravindu, R. Rameezdeen, J. Zuo, et al., Indoor environment quality of green
buildings: case study of an LEED platinum certified factory in a warm humid
tropical climate, Build. Environ. 84 (2015) 105–113.
Appendix A. Supplementary data [29] B.G. Sediso, M.S. Lee, Indoor environmental quality in Korean green building
certification criteria—certified office buildings—occupant satisfaction and
Supplementary data to this article can be found online at https://doi. performance, Sci Technol Built Environ 22 (2016) 606–618.
[30] Z. Brown, R.J. Cole, Influence of occupants’ knowledge on comfort expectations
org/10.1016/j.buildenv.2021.108182. and behaviour, Build. Res. Inf. 37 (2009) 227–245.
[31] S. Altomonte, S. Saadouni, S. Schiavon, Occupant Satisfaction in LEED and
Authors contributions BREEAM-Certified Office Buildings, Proceedings of PLEA 2016–36th international
conference on passive and low energy Architecture: Cities, buildings, People:
Towards regenerative environments. Los Angeles, 2016.
Dusan Licina: Conceptualization (lead); Formal analysis (lead); [32] A. Singh, M. Syal, S. Grady, et al., Effects of green buildings on employee health
Funding Acquisition (lead); Investigation (lead); Methodology (lead); and productivity, Am. J. Publ. Health 100 (2010) 1665–1668.
[33] S. Agha-Hossein Mm, A.A. El-Jouzi, J. Elmualim, et al., Post-occupancy studies of
Project administration (lead); Resources (lead); Writing-original draft an office environment: energy performance and occupants’ satisfaction, Build.
(lead); Writing-review & editing (lead). Sarka Langer: Formal analysis Environ. 69 (2013) 121–130.
(equal); Investigation (supporting); Methodology (supporting); Writing- [34] P. MacNaughton, J. Spengler, J. Vallarino, et al., Environmental perceptions and
health before and after relocation to a green building, Build. Environ. 104 (2016)
original draft (equal); Writing-review & editing (supporting). 138–144.
[35] P. MacNaughton, U. Satish, J.G.C. Laurent, et al., The impact of working in a green
References certified building on cognitive function and health, Build. Environ. 114 (2017)
178–186.
[36] J. Lee, P. Wargocki, Y. Chan, et al., Indoor environmental quality, occupant
[1] D.M. Murray, D.E. Burmaster, Residential air exchange rates in the United States:
satisfaction, and acute building-related health symptoms in Green Mark-certified
empirical and estimated parametric distributions by season and climatic region,
compared with non-certified office buildings, Indoor Air 29 (2019) 112–129.
Risk Anal. 15 (1995) 459–465.
[37] L. Pastore, M. Andersen, Building energy certification versus user satisfaction with
[2] A.P. Jones, Indoor air quality and health, Atmos. Environ. 33 (1999) 4535–4564.
the indoor environment: findings from a multi-site post-occupancy evaluation
[3] D.E. Riesenberg, J. Arehart-Treichel, “Sick building” syndrome plagues workers,
(POE) in Switzerland, Build. Environ. 150 (2019) 60–74.
dwellers, J. Am. Med. Assoc. 255 (1986), 3063-3063.
[38] J.-Y. Lee, P. Wargocki, Y.-H. Chan, et al., How does indoor environmental quality
[4] C.A. Redlich, J. Sparer, M.R. Cullen, Sick-building syndrome, Lancet 349 (1997)
in green refurbished office buildings compare with the one in new certified
1013–1016.
buildings? Build. Environ. 171 (2020), 106677.
[5] J. Wright, Chronic and occult carbon monoxide poisoning: we don’t know what
[39] K.W. Tham, P. Wargocki, Y.F. Tan, Indoor environmental quality, occupant
we’re missing, Emerg. Med. J. 19 (2002) 386–390.
perception, prevalence of sick building syndrome symptoms, and sick leave in a
[6] D.W. Fraser, T.R. Tsai, W. Orenstein, et al., Legionnaires’ disease: description of an
green mark platinum-rated versus a non-green mark-rated building: a case study,
epidemic of pneumonia, N. Engl. J. Med. 297 (1977) 1189–1197.
Sci Technol Built Environ 21 (2015) 35–44.
[7] P. Wargocki, J. Sundell, W. Bischof, et al., Ventilation and health in non-industrial
[40] S. Yang, J. Goyette Pernot, C. Hare Jörin, et al., Energy, indoor air quality,
indoor environments: report from a European multidisciplinary scientific
occupant behavior, self-reported symptoms and satisfaction in energy-efficient
consensus meeting (EUROVEN), Indoor Air 12 (2002) 113–128.
dwellings in Switzerland, Build. Environ. 171 (2020), 106618.
[8] P. Wargocki, O. Seppänen, J. Anderson, et al., Indoor climate and productivity in
[41] D. Licina, S. Bhangar, C. Pyke, Occupant health & well-being in green buildings,
offices, REHVA Guide No 6 (2006).
ASHRAE J. 61 (2019) 74–77.
[9] O. Seppänen, W.J. Fisk, Q.H. Lei, Ventilation and performance in office work,
[42] International WELL Building Institute, WELL v2. https://www.wellcertified.com/c
Indoor Air 16 (2005) 28–36.
ertification/v2, 2021. (Accessed 12 February 2021).
[10] L. Lan, Z. Lian, L. Pan, The effects of air temperature on office workers’ well-being,
[43] GSA, General services administration - facility management – Fitwel. https://www.
workload and productivity- evaluated with subjective ratings, Appl. Ergon. 42
gsa.gov/real-estate/facilities-management/tenant-services/cafeterias-and-vendin
(2010) 29–36.
g-facilities/health-and-wellness/fitwel, 2019. (Accessed 12 February 2021).
[11] P. Bluyssen, The Healthy Indoor Environment: How to Assess Occupants’
[44] P. Wolkoff, Indoor air pollutants in office environments: assessment of comfort,
Wellbeing in Buildings, Routledge, Oxon, 2014.
health, and performance, Int. J. Hyg Environ. Health 216 (2013) 371–394.
[12] J.G. Allen, P. MacNaughton, U. Satish, et al., Associations of cognitive function
[45] C. Mandin, M. Trantallidi, A. Cattaneo, et al., Assessment of indoor air quality in
scores with carbon dioxide, ventilation, and volatile organic compound exposures
office buildings across Europe - the OFFICAIR study, Sci. Total Environ. 579 (2017)
in office workers: a controlled exposure study of green and conventional office
169–178.
environments, Environ. Health Perspect. 124 (2016) 805–812.
[46] D. Licina, Y. Tian, W.W. Nazaroff, Emission rates and the personal cloud effect
[13] W.J. Fisk, D. Black, G. Brunner, Benefits and costs of improved IEQ in U.S. offices,
associated with particle release from the perihuman environment, Indoor Air 27
Indoor Air 21 (2011) 357–367.
(2017) 791–802.
[14] A. Wilson, Making the case for green building, Environ Build News 14 (2005) 1–15.
[47] J. Pantelic, S. Liu, L. Pistore, et al., Personal CO2 cloud: laboratory measurements
[15] D. Clements-Croome (Ed.), Creating the Productive Workplace, second ed., Taylor
of metabolic CO2 inhalation zone concentration and dispersion in a typical office
& Francis, New York, 2006.
desk setting, J. Expo. Sci. Environ. Epidemiol. 30 (2019) 328–337.
[16] GSA, Green Building Performance—A Post Occupancy Evaluation of 22 GSA
[48] M. Ferm, H. Rodhe, Measurements of air concentrations of SO2, NO2 and NH3 at
Buildings, U.S. General Services Administration, Washington D.C, 2011.
rural and remote sites in Asia, J. Atmos. Chem. 27 (1997) 17–29.
[17] A. Steinemann, P. Wargocki, B. Rismanchi, Ten questions concerning green
[49] ISO 16017-2, Indoor, Ambient and Workplace Air — Sampling and Analysis of
buildings and indoor air quality, Build. Environ. 112 (2017) 351–358.
Volatile Organic Compounds by Sorbent Tube/thermal Desorption/capillary Gas
[18] J.G. Allen, P. MacNaughton, J.G.C. Laurent, et al., Green buildings and health, Curr
Chromatography — Part 2: Diffusive Sampling, International Organization of
Environ Health Rep 2 (2015) 250–258.
Standardization, Geneva, 2003.
[19] M. Khoshbakht, Z. Gou, Y. Lu, et al., Are green buildings more satisfactory? A
[50] ISO 16000-4, Indoor Air — Part 4: Determination of Formaldehyde — Diffusive
review of global Evidence, Habitat Int. 74 (2018) 57–65.
Sampling Method, International Organization of Standardization, Geneva, 2012.
[20] M.H. Issa, J.H. Rankin, M. Attalla, A.J. Christian, Absenteeism, performance and
[51] C. Huizenga, L. Zagreus, E. Arens, et al., Measuring Indoor Environmental Quality:
occupant satisfaction with the indoor environment of green Toronto schools,
a Web-Based Occupant Satisfaction Survey, Center for the Built Environment, UC
Indoor Built Environ. 20 (2011) 511–523.
Berkeley, 2003.
[21] G. Newsham, B. Birt, C. Arsenault, et al., Do ‘green’ buildings have better indoor
[52] L.T. Graham, T. Parkinson, S. Schiavon, Lessons learned from 20 years of CBE’s
environments? New evidence, Build. Res. Inf. 41 (2013) 415–434.
occupant surveys, Build Cities 2 (2021) 166–184.
[22] A. Hedge, L. Miller, J. Dorsey, Occupant comfort and health in green and
[53] W.C. Hinds, Aerosol Technology: Properties, Behavior, and Measurement of
conventional university buildings, Work 49 (2014) 363–372.
Airborne Particles, John Wiley & Sons, New York, 1999.
[23] H. Liang, C. Chen, R. Hwang, et al., Satisfaction of occupants toward indoor
[54] R.J. Delfino, C. Sioutas, S. Malik, Potential role of ultrafine particles in associations
environment quality of certified green office buildings in Taiwan, Build. Environ.
between airborne particle mass and cardiovascular health, Environ. Health
72 (2014) 232–242.
Perspect. 113 (2005) 934–946.
[24] M.D. Colton, P. Macnaughton, J. Vallarino, et al., Indoor air quality in green vs
[55] L. Wallace, Correlations of personal exposure to particles with outdoor air
conventional multifamily low-income housing, Environ. Sci. Technol. 48 (2014)
measurements: a review of recent studies, Aerosol Sci. Technol. 32 (2000) 15–25.
7833–7841.
[56] A.R. Ferro, R.J. Kopperud, L.M. Hildemann, Source strengths for indoor human
[25] S.K. Kim, Y. Hwang, Y.S. Lee, W. Corser, Occupant comfort and satisfaction in
activities that resuspend particulate matter, Environ. Sci. Technol. 38 (2004)
green healthcare environments: a survey study focusing on healthcare staff,
1759–1764.
J. Sustain. Dev. 8 (2015) 156–173.
[57] J. Zhou, A. Chen, Q. Cao, et al., Particle exposure during the 2013 haze in
[26] Z. Gou, S.S.-Y. Lau, J. Shen, Indoor environmental satisfaction in two LEED offices
Singapore: importance of the built environment, Build. Environ. 93 (2015) 14–23.
and its implications in Green interior design, Indoor Built Environ. 21 (2012)
[58] C. Ferguson, An effect size primer: a guide for clinicians and researchers, Prof
503–514.
Psychol Res Pr Practice 40 (2009) 532–538.
[27] S. Altomonte, S. Schiavon, Occupant satisfaction in LEED and non-LEED certified
buildings, Build. Environ. 68 (2013) 66–76.
10D. Licina and S. Langer Building and Environment 204 (2021) 108182
[59] CEN, CEN/TR 16798-2:2019, Guideline for Using Indoor Environmental Input MUK2014SchemeDocument/content/05_health/hea02.htm, 2016. (Accessed 25
Parameters for the Design and Assessment of Energy Performance of Buildings, February 2021).
Draft for Working Group Red, BSI, 2019. [74] H. Fromme, M. Debiak, H. Sagunski, et al., The German approach to regulate
[60] ISO, ISO/TR 17772-2:2018, Part 2: Guideline for Using Indoor Environmental indoor air contaminants, Int. J. Hyg Environ. Health 222 (2019) 347–354.
Input Parameters for the Design and Assessment of Energy Performance of [75] H.J. Salonen, A.-L. Pasanen, S.K. Lappalainen, et al., Airborne concentrations of
Buildings, ISO, Geneva, 2018. volatile organic compounds, formaldehyde and ammonia in Finnish office
[61] ASHRAE, ANSI/ASHRAE Standard 62.1-2019, Ventilation for Acceptable Indoor buildings with suspected indoor air problems, J. Occup. Environ. Hyg. 6 (2009)
Air Quality, ASHRAE, Atlanta, GA, 2019. 200–209.
[62] O.A. Seppänen, W.J. Fisk, M.J. Mendell, Association of ventilation rates and CO2 [76] H. Järnström, K. Saarela, P. Kalliokoski, A.-L. Pasanen, Reference values for indoor
concentrations with health and other responses in commercial and institutional air pollutant concentrations in new, residential buildings in Finland, Atmos.
buildings, Indoor Air 9 (1999) 226–252. Environ. 40 (2006) 7178–7191.
[63] B. Horemans, R. Van Grieken, Speciation and diurnal variation of thoracic, fine [77] O. Geiss, G. Giannopoulos, S. Tirendi, et al., The AIRMEX study - VOC
thoracic and sub-micrometer airborne particulate matter at naturally ventilated measurements in public buildings and schools/kindergartens in eleven European
office environments, Atmos. Environ. 44 (2010) 1497–1505. cities: statistical analysis of the data, Atmos. Environ. 45 (2011) 3676–3684.
[64] L. Mosqueron, I. Momas, Y. Le Moullec, Personal exposure of Paris office workers [78] S. Altomonte, S. Saadouni, M.G. Kent, S. Schiavon, Satisfaction with indoor
to nitrogen dioxide and fine particles, Occup. Environ. Med. 59 (2002) 550–555. environmental quality in BREEAM and non-BREEAM certified office buildings,
[65] L. Morawska, A. Afshari, G.N. Bae, et al., Indoor aerosols: from personal exposure Architect. Sci. Rev. 60 (2017) 343–355.
to risk assessment, Indoor Air 23 (2013) 462–487. [79] J.E. Cometto-Muniz, M.H. Abraham, Odor detection by humans of lineal aliphatic
[66] A. Wierzbicka, M. Bohgard, J.H. Pagels, et al., Quantification of differences aldehydes and helional as gauged by dose–response functions, Cem Senses 35
between occupancy and total monitoring periods for better assessment of exposure (2010) 289–299.
to particles in indoor environments, Atmos. Environ. 106 (2015) 419–428. [80] J.H. Ruth, Odor thresholds and irritation levels of several chemical substances: a
[67] D. Licina, S. Bhangar, B. Brooks, et al., Concentrations and sources of airborne review, Am Ind Hyg Assoc 47 (1986) A142–A151.
particles in a neonatal intensive care unit, PloS One 11 (2016), e0154991. [81] S. Langer, O. Ramalho, E. Le Ponner, et al., Perceived indoor air quality and its
[68] World Health Organization, Occupational and Environmental Health. WHO Air relationship to air pollutants in French dwellings, Indoor Air 27 (2017)
Quality Guidelines for Particulate Matter, Ozone, Nitrogen Dioxide and Sulfur 1168–1176.
Dioxide: Global Update 2005: Summary of Risk Assessment, 2005. [82] À. Boso, B. Álvarez, C. Oltra, et al., The grass is always greener on my side: a field
[69] T. Schneider, J. Sundell, W. Bischof, et al., ‘EUROPART’. Airborne particles in the experiment examining the home halo effect, Sustainability 12 (2020) 6335.
indoor environment. A European interdisciplinary review of scientific evidence on [83] L. Fang, D.P. Wyon, G. Clausen, Impact of indoor air temperature and humidity in
associations between exposure to particles in buildings and health effects, Indoor an office on perceived air quality, SBS symptoms and performance, Indoor Air 14
Air 13 (2003) 38–48. (2004) 74–81.
[70] C.J. Weschler, Ozone in indoor environments: concentration and chemistry, Indoor [84] M. Holmgren, A. Kabanshi, P. Sörqvist, Occupant perception of “green” buildings:
Air 10 (2000) 269–288. distinguishing physical and psychological factors, Build. Environ. 114 (2017)
[71] World Health Organization, WHO Guidelines for Indoor Air Quality: Selected 140–147.
Pollutants, World Health Organization Regional Office for Europe, Copenhagen, [85] W. Wei, P. Wargocki, J. Zirngibl, et al., Review of parameters used to assess the
Denmark, 2010. quality of the indoor environment in Green Building certification schemes for
[72] Y. Hu, B. Zhao, Relationship between indoor and outdoor NO2: a review, Build. offices and hotels, Energy Build. 209 (2020), 109683.
Environ. 180 (2020), 106909. [86] Á. Hofflinger, À. Boso, C. Oltra, The home halo effect: how air quality perception is
[73] BRE, BREEAM UK new construction. Non-domestic buildings (United Kingdom), influenced by place attachment, Hum. Ecol. 47 (2019) 589–600.
Technical Manual SD5076:5.0 - 2016, https://www.breeam.com/BREEA
11You can also read