Late Miocene megalake regressions in Eurasia - Nature
←
→
Page content transcription
If your browser does not render page correctly, please read the page content below
www.nature.com/scientificreports
OPEN Late Miocene megalake regressions
in Eurasia
Dan Valentin Palcu1,2*, Irina Stanislavovna Patina3*, Ionuț Șandric4, Sergei Lazarev1,
Iuliana Vasiliev5, Marius Stoica6 & Wout Krijgsman1
The largest megalake in the geological record formed in Eurasia during the late Miocene, when the
epicontinental Paratethys Sea became tectonically-trapped and disconnected from the global ocean.
The megalake was characterized by several episodes of hydrological instability and partial desiccation,
but the chronology, magnitude and impacts of these paleoenvironmental crises are poorly known.
Our integrated stratigraphic study shows that the main desiccation episodes occurred between
9.75 and 7.65 million years ago. We identify four major regressions that correlate with aridification
events, vegetation changes and faunal turnovers in large parts of Europe. Our paleogeographic
reconstructions reveal that the Paratethys was profoundly transformed during regression episodes,
losing ~ 1/3 of the water volume and ~ 70% of its surface during the most extreme events. The
remaining water was stored in a central salt-lake and peripheral desalinated basins while vast regions
(up to 1.75 million km2) became emergent land, suitable for development of forest-steppe landscapes.
The partial megalake desiccations match with climate, food-web and landscape changes throughout
Eurasia, although the exact triggers and mechanisms remain to be resolved.
A tectonically trapped sea turns into a megalake. At the beginning of the late Miocene (11.6 Ma)
the European continent was very different from today (Fig. 1). In the west it was separated from Africa by an
archipelago1,2. To the south the Anatolian—Balkan landmass was splitting apart, giving way to lakes that would
become the modern Aegean Sea3,4, while the landmasses of modern Italy were scattered in a cluster of islands in
the central Mediterranean Sea5,6. However, the most striking feature was the Paratethys—a water body the size
of the Mediterranean that stretched between the Eastern Alps and modern K azakhstan6,7.
The Paratethys was initially an epicontinental sea that formed at the beginning of the Oligocene (~ 34 Ma)
from the remnants of the northern Tethys Ocean8. The sea was characterized by progressive fragmentation, gate-
way restrictions and sediment filling, mostly due to t ectonics9. Progressive uplift of the central European moun-
tain ranges gradually isolated the Paratethys from the global ocean. At the onset of the late Miocene, the ancient
sea transformed into a megalake characterized by anomalohaline salinities (generally ranging between 12–14‰)10
and developed a unique endemic fauna (e.g., mollusks and ostracods). The landlocked Paratethys underwent
extreme hydrological crises and partial desiccation episodes7. This had devastating effects on the aquatic fauna
as the diversity of the endemic ecosystem was greatly reduced and multiple groups, such as foraminifera and
nannoplankton, disappeared almost e ntirely11,12. The wider impacts and implications of these hydrological crises,
in particular beyond the Paratethys area, are still poorly understood.
Chronology of late Miocene megalake regressions in Eurasia. Upper Miocene Paratethys sedimen-
tary successions are exposed extensively in Eurasia but are often incomplete or interrupted by continental depos-
its (Fig. S1). In the western Black Sea region, carbonate platform deposits crop out and are truncated by repeated
erosion and karstification episodes13, while in the northwestern region riverine-lacustrine successions of an
extensive deltaic system developed14. Well-preserved aquatic records have been reported in peripheral basins
of the southwest Caspian7 and south Carpathians15, but limited biostratigraphic information prevents develop-
ment of integrated stratigraphies in these regions. More suitable fossiliferous sections are available on the eastern
Crimean and western Taman peninsulas16. The classical Neogene sections of Taman were first described at the
1
Paleomagnetic Laboratory Fort Hoofddijk, Department of Earth Sciences, Utrecht University, Utrecht,
The Netherlands. 2Oceanographic Institute, University of Sao Paulo, Sao Paulo, Brazil. 3Geological Institute
of the Russian Academy of Science, Moscow, Russia. 4Faculty of Geography, University of Bucharest,
Bucharest, Romania. 5Senckenberg Biodiversity and Climate Research Centre (SBiK-F), Frankfurt am Main,
Germany. 6Department of Geology, University of Bucharest, Bucharest, Romania. *email: d.v.palcu@uu.nl;
irina.patina@gmail.com
Scientific Reports | (2021) 11:11471 | https://doi.org/10.1038/s41598-021-91001-z 1
Vol.:(0123456789)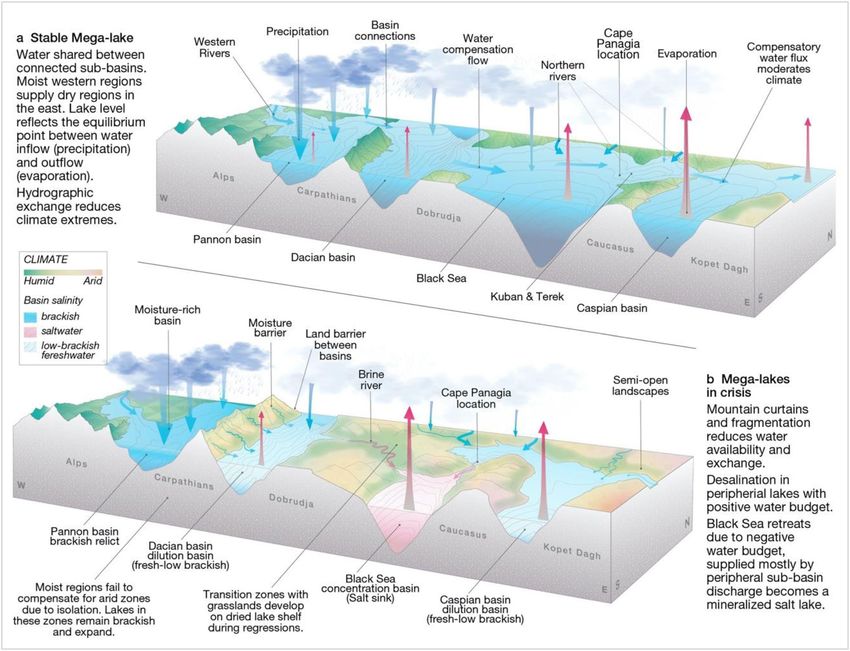
www.nature.com/scientificreports/
Figure 1. Paleogeographic reconstruction of late Miocene Paratethys fluctuations. During regressive phases,
the megalake lost most of its surface. The remaining water was split between a central salt-lake in the Black
Sea basin (marked in red) and peripheral basins that periodically refilled and became fresher (light blue)
(Map generated in ArcGIS Pro https://www.esri.com/en-us/arcgis/products/arcgis-pro/overview, v. 2.1, see
“Methods”).
end of the nineteenth century and beginning of the twentieth century and have been used as reference sections
for development of the Eastern Paratethys regional stratigraphic chart17. Attempts to retrieve cores of the late
Miocene record from the deeper central Black Sea basin during Deep-Sea Drilling Project (DSDP) Leg 42b had
limited success, leaving the Neogene sections on the Black Sea coast of Taman (Fig. 1) as the only viable option
for developing a chronology of late Miocene megalake fluctuations.
Taman Peninsula, Russia (Figs. 1, S2), contains several key stratigraphic sections18–20, including Cape Pana-
gia (45°15′57.81″N/26°25′31.91″E), the only place known to host a continuous sedimentary record of the late
Miocene Paratethys hydrological c rises7,15,16. The sedimentary succession of Cape Panagia (Fig. S3) belongs to
the Kuban basin20, adjacent to the Black Sea basin, the central and deepest part of the Paratethys. The section has
been subject to extensive lithological and paleontological investigations, synthesized in a recent monograph16
that we use as a litho-biostratigraphic reference. Our sedimentologic analyses (see “Methods” and Fig. S4), cor-
related with biostratigraphic d ata16, indicate that the Panagia section is characterized by deep-water sediments,
interrupted by four major water-level regressions identified throughout the Paratethys7.
The first regression interval is ~ 50 m thick and contains organogenic carbonate buildups (bryozoan-algal
and microbial-algal mats)21, interbedded with finely laminated dolomitized limestones22 and clays (Figs. S2–S5,
Table S1). Biostratigraphic correlations indicate that this interval corresponds to a significant base-level fall,
freshening and shrinking of the basin7,16. According to estimations of Paratethys water level fluctuations and
shore migrations7, this regression involved a ~ 230 m drop (from + 80 to − 150 m). It corresponds to the collapse
of saltwater Paratethys fauna at the regional Bessarabian-Khersonian substage b oundary16. Multiple faunal groups
disappeared, and the endemic fauna was greatly reduced, indicating a significant biological crisis for aquatic
life. The second regression phase contains organogenic carbonate buildups (bryozoan-algal mats21), interbedded
with finely laminated limestones and clays, indicating paleobathymetric reductions alternating with incomplete
recovery phases. This regression is not clearly described in the literature, likely because it occurred shortly after
the previous episode. Based on its lithological expression we tentatively estimate a lowstand similar to the first
event. Carbonate levels, similar to the previous levels but less developed are correlated to a third regression
documented in Paratethys, when water levels dropped by ~ 100 m (from + 50 to − 50 m)7. The fourth and final
regression is the most severe and is known as the Great Khersonian Drying15 (event kd, in Fig. 3, Fig. S4). It cor-
responds to a water level drop of more than 250 m (from + 50 to > − 200 m) at the end of the Khersonian regional
stage, when Panagia environments became terrestrial for a brief time. The Maeotian transgression7 (event mt,
in Fig. 3, Fig. S4), widely documented throughout Eurasia, marks the end of this dry period and progressively
asin15.
refilled the b
Paleomagnetic measurements allow development of a polarity pattern that can be used to date the partial
Paratethys desiccations. The Panagia polarity pattern (Fig. 2, Fig. S6) consists of 17 polarity intervals, 9 of normal
polarity and 8 of reversed polarity, plus two additional short polarity fl uctuations23, that can be correlated with
Scientific Reports | (2021) 11:11471 | https://doi.org/10.1038/s41598-021-91001-z 2
Vol:.(1234567890)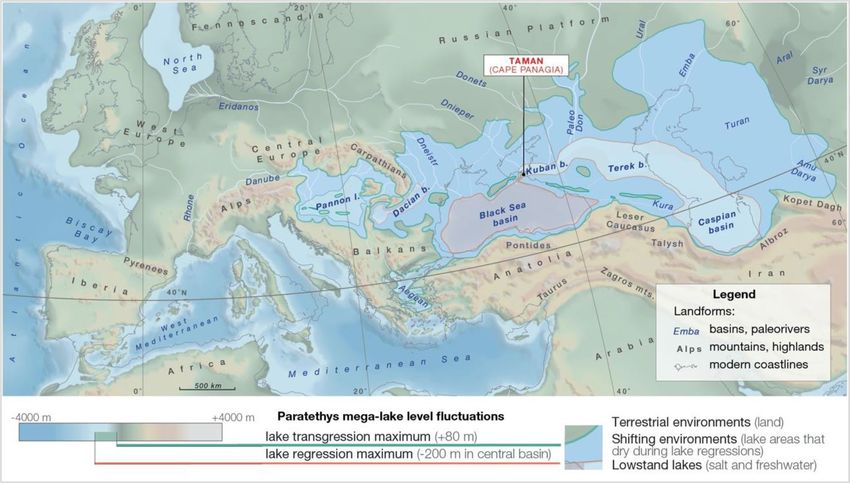
www.nature.com/scientificreports/

                                  Figure 2.  Paleomagnetic results from Cape Panagia. (a) Examples of demagnetization plots with normal and
                                  reversed polarities (AF alternating field, Th thermal demagnetization) with intervals used for interpretation
                                  highlighted in red; (b) Thermal behaviour of samples from Cape Panagia, obtained from Curie balance
                                  experiments with multiple cooling and heating steps; (c) Magnetic directions plotted in stratigraphic order and
                                  local magnetic polarity pattern. Log and lithological unit numbers are edited, from Popov et al.16; the coloured
                                  bar indicates Paratethys high-stands (light blue) and low-stands (red).

Scientific Reports |   (2021) 11:11471 |              https://doi.org/10.1038/s41598-021-91001-z                                                     3

                                                                                                                                             Vol.:(0123456789)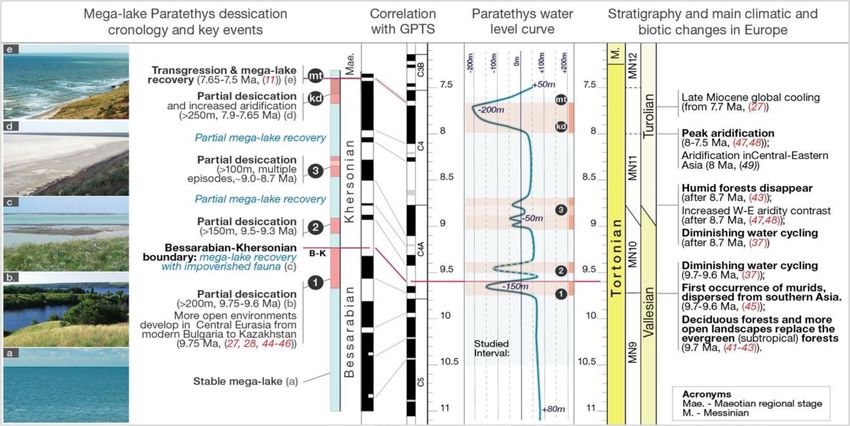
www.nature.com/scientificreports/
Figure 3. Chronology of the megalake Paratethys hydrological crises, correlations with the Geomagnetic
Polarity Time Scale (GPTS 202025), Paratethys water-level curve compared with present-day sea-level in Black
Sea (adapted after Popov et al.7), stratigraphic correlations (Stratigraphic Stages, Mammal MN zones, European
Mammals Zones) and bio-climatic events from neighbouring Europe and Asia. Images on the left exemplify
the dynamics of the north Paratethys region: (a) submerged lake domain; (b) lakes and widespread semi-open
landscapes; (c) submerged lake domain with some semi-open landscapes; (d) dry-arid plains and lagoons; e.
submerged lake domain and semi-open landscapes (Image source: Wikimedia commons).
the geomagnetic polarity time scale (GPTS)24 and are inferred to correspond to the 11–7.5 Ma interval (Fig. 3,
Fig. S6 for a detailed correlation). This correlation provides the first direct age constraints for regression episodes
in the Paratethys realm and permits chronological adjustment of the late Miocene Paratethys water level curve
of Popov et al.7 (Fig. 3).
The first regression episode occurred between 9.75 and 9.6 Ma with a climax at 9.66 Ma (event 1, in Fig. 3,
Fig. S6). The next partial desiccation episodes (events 2 and 3, in Fig. 3, Fig. S6) date between 9.5 and 9.3 Ma
and between ~ 9.0 and ~ 8.7 Ma. The fourth regression episode began at ~ 8.3 Ma but became more severe
between ~ 7.9 and 7.65 Ma. This partial desiccation episode was terminated by the Maeotian transgression (mt)
at 7.65 Ma15,26, and was linked to a late Miocene global cooling episode27.
Paleogeographic simulations of lake regressions. The late Miocene paleogeographic configuration
of the Paratethys realm is poorly known for the 11–7.5 Ma interval. We combine existing paleogeographic recon-
structions, lithofacies maps and shoreline data to develop a digital elevation model and simulate water level
fluctuations, revealing configurations during the most extreme lake regressions. According to these quantitative
paleogeographic reconstructions, we show that the Paratethys had a surface area of more than 2.8 million k m2
(slightly larger than the present-day Mediterranean Sea) and contained a water volume of more than 1.77 mil-
lion km3 (representing more than 1/3 the volume of the modern Mediterranean), which is larger than any other
megalake in the geological record28.
Next, we use our 3D paleogeographic model to simulate the maximum regression (~ 280 m water level d rop7),
and resulting paleogeography of the partially desiccated megalake (Fig. 1). In this scenario, the shore signifi-
cantly retreats on the relatively flat eastern (400–600 km) and northern (100–350 km) margins, while coastlines
moderately shift in the western margin (~ 100 km) and the limited steep southern margin (Fig. 1). In addition,
regressions fragment the Paratethys into a system of subbasins separated by land bridges. The final paleogeo-
graphic configuration implies salt re-distribution in various subbasins, similar to the situation documented dur-
ing desiccation of Lake A ral29. Peripheral basins receive most of the freshwater from precipitation, and outflow
from these basins transfers salt to the central basin, a natural process of desalination (Fig. 1). In the heart of the
system, deprived of direct discharge from major rivers and fed by salty outflow rivers from peripheral basins,
the Black Sea Basin becomes a salt lake, concentrating most of the Paratethys salts30. During arid episodes, this
central basin will be the most affected, shrinking further as diminished outflow from surrounding peripheral
lakes will not compensate for evaporation.
Simulation of the maximum water level drop (to − 200 m) indicates that the remaining lakes would be reduced
to 31% of the initial surface and would retain 66% of their initial water volume (Table S2). Simulation of complete
desalination of peripheral basins indicates that the Black Sea basin salinity would increase from 12–14‰ in the
Paratethys high-stand16 to 28.2–32.8‰, which is insufficient to precipitate halite.
Scientific Reports | (2021) 11:11471 | https://doi.org/10.1038/s41598-021-91001-z 4
Vol:.(1234567890)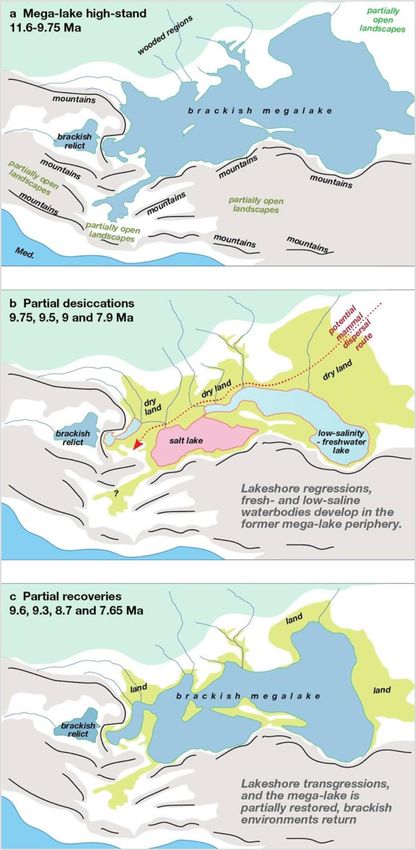
www.nature.com/scientificreports/
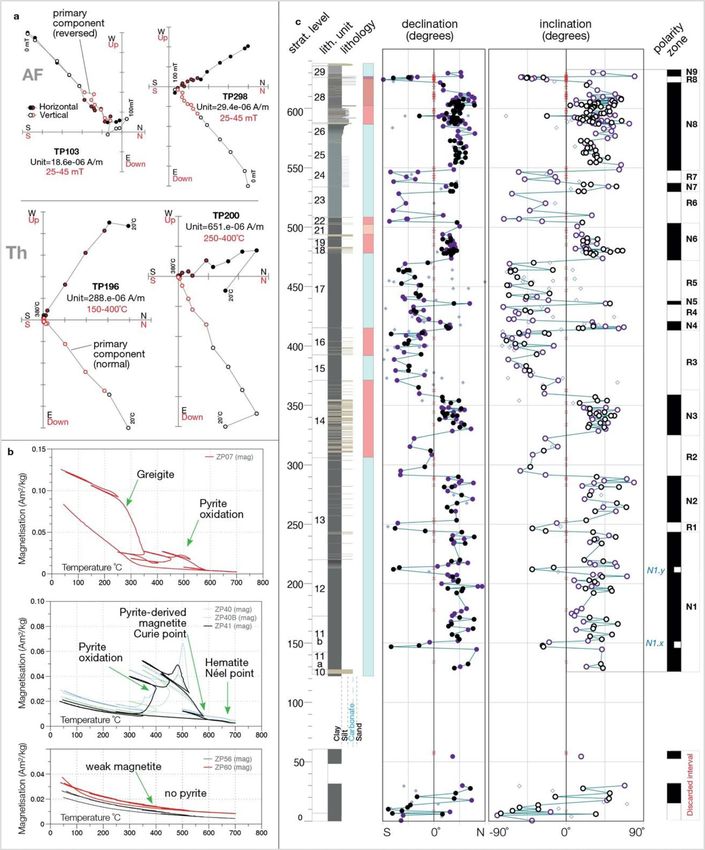
Figure 4. Climate and connectivity impacts on the Paratethys water-basins, a theoretical model illustrating the
humid and dry climate impacts on an endorheic Paratethys system. (a) Stable system; (b) System during partial
desiccation episodes.
Landscape and environmental changes in inner Eurasia. The Paratethys consisted of a chain of deep
sub-basins, connected by shallow zones, distributed roughly along the same latitude (Fig. 1). Due to its isolation
from the ocean, the megalake expanded or contracted, determined by the balance between precipitation, river
run-off and evaporation. The landlocked paleogeographic configuration made the lake levels prone to water-
level instability episodes that occurred when dry or rain belts moved over this latitudinal zone. Initially, water-
levels were relatively stable due to the humid regions lying closer to the Atlantic in the west, with positive water
budgets that compensated the drier basins of the Eurasian interior (Fig. 4). Disconnection of Lake Pannon in the
western periphery led to increased sensitivity to droughts for the remaining Paratethys.
During regression, much of the Paratethys megalake desiccated while remaining sub-basins became independ-
ent freshwater, brackish or saline lakes. In a paradoxical twist, regression allowed formation of large desalinated
lakes in the Paratethys periphery. A significant area of the Paratethys periphery, particularly the gentle landscape
of the northern shelf zone (> 1.75 million km2), emerged during regressions and was flooded during transgres-
sions. This ongoing instability hampered permanent development of woodlands, favouring the more flexible
grassland-shrub vegetation and giving rise to a late Miocene forest-steppe belt that stretched over 3000 km along
the 45° latitude between Central Europe and Central Asia. Pollen records from Panagia indicate that these late
Miocene lake regressions corresponded to the expansion of more open landscapes31 and increased charcoal in
sediments hints at the augmentation of natural fi res32. Similar late Miocene vegetation changes toward more
open landscapes are documented throughout inner Eurasia in Kazakhstan, Ukraine, Moldova33 and Bulgaria34.
Opening of the forest-steppe belt and formation of land bridges during lake regressions (Fig. 5) probably provided
an ideal moment of dispersal for mammal populations, living in open Central Asian landscapes through these
new passageways to Europe, which in turn would have impacted the food-webs of western Eurasia. Estimations
of such dispersals remain poorly constrained because our new age model prompts chronological revision for
mammal sites around the Paratethys.
Lake regressions correlate with environmental changes in Europe and Central Asia. The Para-
tethys water crises correlate with climate and landscape changes on the continent. At the beginning of the late
Scientific Reports | (2021) 11:11471 | https://doi.org/10.1038/s41598-021-91001-z 5
Vol.:(0123456789)www.nature.com/scientificreports/
Figure 5. Schematic paleogeographic maps of lake regressions and landscapes of inner Eurasia. Dark green
shading represents closed (forest) landscapes, light green shading shows former lake regions transformed to
semi-open landscapes and brown shading indicate mountainous regions. Red dotted line indicates potential
mammal dispersal routes across dry land and landbridges during lake-level regressions. (a) Paratethys megalake
during high-stand configuration, (b) water distribution during the maximum lake regression. Note that a
significant stretch of semi-open landscapes formed in the northern peripheral regions of the former megalake,
providing potential passageways for mammal dispersals. (c) Paratethys during the partial water level recovery
episodes, pushing back open landscapes.
Miocene, most of inner Eurasia was covered by forests, gradually fading from tropical mixed forests in the
south-west to cold conifer forests in the mountains and the far north35, except for the East Mediterranean region
where drier climates favoured diverse and more open landscapes36. Stepwise climatic changes throughout the
late Miocene led to increased aridification and seasonality, accompanied by expanding open landscapes (Fig. 3).
The first change occurred at ~ 9.7 Ma, contemporaneous with the onset of Paratethys instability (events 1 and
2 in Fig. 3). An episode of diminished water cycling is observed in Europe in the 9.7–9.5 Ma time i nterval37. In
the northern Black Sea region, relatively closed forest environments were replaced by more open environments38
ocumented39,40. In western Europe marked decrease of
and in Panagia, the first evidence of xeric vegetation is d
the fruit‐rich evergreen (subtropical) forests and their replacement by deciduous forests and open landscapes
Scientific Reports | (2021) 11:11471 | https://doi.org/10.1038/s41598-021-91001-z 6
Vol:.(1234567890)www.nature.com/scientificreports/
began at 9.7 Ma41–43, as a consequence of increased s easonality44. Fauna changed too: most humidity-adapted
and forest-dwelling faunal groups disappeared and immigrants from the peri-Mediterranean and Asia (e.g.,
murids) arrived in E urope45.
The next important climate and paleoenvironmental change occurred at ~ 8.7 Ma, contemporaneous with
Paratethys instability (event 3 in Fig. 3). European humid forest landscapes were l ost43 and replaced by dry, open
woodland and g rasslands46,47, followed by diminished water cycling37 and increased aridity47,48.
Peak aridity in Europe is documented between 8 and 7.5 Ma37,47, while central-eastern Asia experienced
increased aridity at ~ 8 Ma49, corresponding to the largest lake regression documented in Paratethys (event kd
in Fig. 3).Our results fill a blank spot in the chronology of inner Eurasia and Eurasian climate and landscape
dynamics. Drought episodes in Europe and Asia correlate with water availability crises in the Paratethys meg-
alake. Paleogeographic simulations provide a basis for future studies that are required to understand the triggers
and dynamics of the late Miocene drying of Europe and the role that the inner Eurasian megalake Paratethys
played in these events.
Conclusions
We constrain the age of the late Miocene hydrological crises in the Eurasian megalake Paratethys by integrating
sedimentological analyses and magnetostratigraphic dating and resolve four main hydrological crises during
the period from 11 to 7.5 million years ago. Using a 3D paleogeographic model, we calculate that the megalake
lost ~ 70% of its surface and 1/3 of its volume during regressions, which impacted the climate, hydrology and
vegetation of surrounding regions. The model predicts that the remaining water would be split between a central
salt lake and peripheral low-salinity or freshwater lakes. Emergent land was preconditioned to become forest-
steppe belts that better connected Central Asia with Europe and allowed terrestrial faunal exchanges between
east and west. In an endorheic state, the Eurasian Paratethys megalake became unstable and experienced partial
desiccation episodes. These events correlate stepwise drying and landscape opening in Europe with dry climate
episodes in central Asia, which raises questions about whether the Paratethys crises were trigger, contributor or
mere expressions of dry climatic episodes in Europe and central Asia.
Materials and methods
Sedimentology. We focus here on a ~ 500 m thick stratigraphic interval containing the Khersonian regional
sub-stage16 that was logged, sampled and mapped in high-resolution. Detailed sedimentological studies focused
on the uppermost Bessarabian–Khersonian–Maeotian interval of Panagia (Fig. S4) and are based on field obser-
vations focused on lithofacies descriptions (lithology, grain-size, colour, sedimentary structures) and associated
trace fossils. The descriptive terminology follows the field guide of T ucker50, while the general facies concept is
based on M iall51,52. Later, commonly occurring lithofacies were combined into eight distinct facies associations
following the concept of Collinson53,54. Facies associations were correlated to specific depositional environments
based on sedimentological reasoning and comparison with literature examples (Table S1).
Paleomagnetism. Magnetostratigraphy can provide age dating for rock successions if the established
polarity pattern of studied sections can be correlated to the reversal pattern of the Geomagnetic Polarity Time
Scale24 (GPTS). This approach has proven successful with Paratethys sediments, when adequate demagnetiza-
tion techniques are applied to deal with the generally high concentration of iron sulphides in anoxic sediments,
and particularly with the magnetic mineral greigite55,56.
The Panagia section is a cliff affected by active coastal erosion and erosion-induced instability. We drilled
and oriented in situ 694 paleomagnetic samples, corresponding to 347 discrete stratigraphic levels (Fig. 2), and
measured bedding planes for each sample level.
Samples corresponding to distinct lithological units have been subjected to thermomagnetic measurements
to determine the chemical nature of the magnetic carrier and to identify the most suitable heating profile for
thermal demagnetization.
Rock magnetism. Thermomagnetic measurements of the induced magnetization (J-T curves) in air at high
temperatures were conducted with a modified horizontal translation-type Curie balance with a sensitivity of
~ 5 × 10⁻⁹ Am257. A field, cycled between 100 and 300 mT, was applied to powdered sediment samples (~ 70 mg).
Multiple heating (6°/min) and cooling runs (10°/min) were performed between room temperature and steps of
150 °C, 250 °C, 350 °C, 450 °C, 525 °C and 700 °C. In terms of rock-magnetic properties (Fig. 2b), we divided
the samples into three types: type 1 is characterized by the presence of greigite, indicated by the typical irrevers-
ible magnetization decrease after heating to ~ 320 °C and pyrite as indicated by a magnetization increase after
heating to 380–420 °C (due to its oxidation)58. Type one samples are rare (less than 5%). Type 2 samples are
characterized by weak iron oxides. The presence of pyrite indicates that reductive dissolution of iron oxides has
occurred, which causes lower magnetisations of s ediments59. These samples are abundant and are mostly found
in the Bessarabian and lower Khersonian, suggesting a stratified environment and frequent bottom water anoxia.
Finally, type 3 samples are characterized by iron oxide magnetic carriers. Sulfides such a pyrite and greigite are
lacking in these samples found in carbonatic beds and the upper Khersonian continental levels.
Magnetostratigraphy. We use progressive thermal demagnetization and/or progressive alternating field demag-
netization to isolate the characteristic remanent magnetization (ChRM). The natural remanent magnetization
(NRM) was thermally demagnetized and measured using a 2G Enterprises DC Superconducting QUantum
Interference Device (SQUID) cryogenic magnetometer (noise level of 3 × 10⁻¹² Am2). Heating was performed
in a laboratory-built, magnetically shielded furnace, with a residual field less than 10 nT. The presence of pyrite,
Scientific Reports | (2021) 11:11471 | https://doi.org/10.1038/s41598-021-91001-z 7
Vol.:(0123456789)www.nature.com/scientificreports/
indicated by J-T runs, informed the thermal demagnetization runs strategy, which were limited to a maximum
temperature level of 380 °C. Due to pyrite oxidation at 420 °C, we restricted heating to well below this point
(380 °C) to avoid pyrite oxidation artefacts from contaminating our results. Also, alternating field demagnetiza-
tion was performed, with small field increments, up to a maximum of 100 mT with an in-house robotized sample
handler, attached to a horizontal 2G Enterprises DC SQUID cryogenic m agnetometer60.
Thermal and alternating field demagnetization of Cape Panagia samples reveal a weak, low-temperature (LT),
viscous overprint that is generally removed at 150 °C and 15 mT (Fig. 2a). A second higher temperature (HT)
component that we consider to correspond to the ChRM is demagnetized at temperatures between 120 and
380 °C or fields between 15–45 mT. This component is averaged from four or more consecutive temperature/
field steps and calculated using principal component analysis61. We obtained ChRM directions for 614 samples
of both reversed and normal polarities.
We used only one sample per level for plots and statistics, discarding duplicates with lower mean angular
deviation (MAD). The 456 samples that resulted after the selection are assigned to four qualitative groups. The
highest quality directions represent samples with MAD values (unanchored) below 6° and are attributed to
group Q1 (Fig. 2, black dots—164 specimens). Average quality directions represent group Q2 (Fig. 2, purple
diamonds—167 specimens) and comprise samples with abnormal orientations and MAD values between 6°
and 12°. The third group Q3 represents poor quality directions with MAD > 12° (Fig. 2, labelled with lilac dia-
monds—62 specimens). A fourth group X (Fig. 2, labelled with grey x-es—63 specimens) contains specimens
that do not show consistent directions. Only Group Q1 and Q2 samples have been used to develop a polarity
pattern (totalling 331 specimens) for the Cape Panagia section. The remaining samples from groups Q3 and X
(totalling 125 specimens) have been discarded from polarity interpretation but are nevertheless plotted to give a
full picture of ChRM estimates for the Cape Panagia record. Group X samples are plotted as zero values for the
sole purpose of highlighting areas with problematic ChRM preservation.
The final polarity pattern of the Cape Panagia section consists of 17 intervals, 9 of normal polarity, and 8 of
reversed polarity (Fig. 2, Fig. S6) and two thin polarity intervals (1 × and N1y, of reversed polarity (in the N1
zone) that could represent short-term polarity fluctuations23. The lowermost part of the section (120–250 m)
comprises a long normal polarity interval (N1) that we tentatively correlate to the long normal polarity chron
C5n.2n of the GPTS (Fig. S6). The short events N1x and N1y could then correspond to short-term polarity fluc-
tuations C5n.2n-1 and C5n.2n-262. Upward tuning subsequently correlates N2 to C5n.1n and N3 to C4Ar.2n,
which places the Bessarabian-Khersonian boundary (310 m) at 9.6 Ma. The long dominantly reversed polarity
interval between 360 and 420 m most likely correlates to C4Ar. We detected two short normal polarity zones: N4,
which correlates to C4Ar.1n (N4) and N5, which correlates to the short-term polarity fluctuation C4Ar.1r-123.
Next, we associate normal polarity interval N6 with C4An, N7 with C4r.1n, and the long normal polarity interval
N8 with C4n.2n (Fig. S6). This correlation implies that the Khersonian–Maeotian boundary is located in chron
C4n.1r at 7.65 Ma, in agreement with previous s tudies15,16,26.
Sediment accumulation rates for the Cape Panagia section (Fig. S6) have a marked change in the middle
Khersonian. Relatively high average sedimentation rates (~ 25 cm/kyr) characterize the older deposits that pre-
cede the water-level instability phase (10.4–9.1 Ma). Lower sedimentation rates (~ 10 cm/kyr) are typical in the
upper interval (9.1–7.65 Ma). In both cases, sedimentation rate increases are associated with hydrological crises
identified from biostratigraphic and sedimentological observations.
Magnetostratigraphic correlation allows us to develop an age model for late Miocene hydrological instability
events identified by paleontological, lithological and sedimentological investigations. The terminal Bessara-
bian regression (event 1 in Fig. 2, Fig. S6) corresponds to the time interval between 9.75 and 9.6 Ma, with a
climax at 9.66 Ma. The next two instability episodes (2 and 3 in Fig. 2, Fig. S6) date between 9.5 and 9.3 Ma
and between ~ 9.0 and ~ 8.7 Ma. The Paratethys megalake experienced a maximum regression during the Great
Khersonian Drying (kd in Fig. 2, Fig. S6) that occurred between ~ 8.3 and 7.65 Ma, followed by the Maeotian
transgression (mt) at 7.65 Ma.
For the Panagia section, the reversal and Watson t ests63,64 give negative results, due to high ChRM directions
scatter which makes the angle γ between mean normal and reversed polarities larger than the critical angle γc.
Paleomagnetic directions (declinations) for the normal polarity samples from Group Q1 have an average dec-
lination of ~ 346°, suggesting a counter-clockwise rotation of 14°, which is significantly different from the 14°
clockwise rotation revealed by the average declination of reverse polarity samples (~ 194°). The one explanation
for this result is the incomplete removal of a secondary NRM component as observed by other authors on simi-
lar sections where multiple magnetic carriers are present65–67. Overlapping unblocking spectra may also lead to
overestimation of inclinations for normal polarity directions and, hence, to a negative reversal test. However, this
does not disqualify the magnetostratigraphic results. The polarity results from Panagia are robust with clustered
ChRM directions that define a complex pattern that can be correlated with the GPTS and that is in agreement
with patterns documented at other sites throughout Paratethys for the end Khersonian-Maeotian interval15,26,66,68.
Inclination values (36.7°) are lower than expected for the late Miocene position of T aman69, which suggests
that the Cape Panagia sediments have been subjected to inclination shallowing processes like compaction and
de-watering (Fig. S7). We use the E-I method70 on the online platform Paleomagnetism.org71 to detect and correct
for inclination shallowing of the Panagia sample directions (after tectonic correction). The average inclination
changes from 36.7° (before unflattening) to 61.9° (after unflattening) (Fig. S7).
Paleogeographic reconstructions. Paratethys paleogeography has been the subject of intense research
in recent decades resulting in local paleogeographic m aps9,72–74, tectonic reconstructions75 and regional paleo-
geographic maps4,15. Popov et al.6,8,20,76 recompiled and refined local maps in a series of paleogeographic and
paleo-facies maps for the Paratethys region, supplemented by shoreline reconstructions for platform regions of
Scientific Reports | (2021) 11:11471 | https://doi.org/10.1038/s41598-021-91001-z 8
Vol:.(1234567890)www.nature.com/scientificreports/
southern Russia and Ukraine7. However, these reconstructions generally avoid the time interval between 11.6
and 7.2 Ma.
To reconstruct the paleogeography in this interval, we present two digital elevation models (DEM), based on
the late Serravallian (> 11.6 Ma—Map 6) and late Tortonian-early Messinian (~ 7.2 Ma Map 7) reconstructions of
Popov. The first DEM is used to estimate the maximum megalake expansion (Fig. 5a). The second DEM (Fig. 5c),
closer to the largest partial megalake desiccation episodes (~ 8–7.65 Ma), is used to simulate the water-level drop
and obtain the partially desiccated megalake paleogeography (Fig. 5b).
These Paratethys paleogeographic reconstructions are complemented by paleogeographic data from a range of
regional studies of northern Europe77, western Europe78, Alps and Central Europe79, Pannonian basin80, Gibraltar
region1,2, Aegean Sea4, Marmara Sea paleobathymetry81,82, Mediterranean paleobathymetry and paleotopography5
and a Middle East tectonic map83.
Reconstructing the paleogeography of the Paratethys realm required conversion from facies on existing
paleogeographic maps to bathymetry, based on digitizing facies zones and converting them to depths using
facies-depth estimations and references from the modern analog Black Sea, Azov Sea, and Caspian Lake. For the
Black Sea and Caspian Lake basins, maximal depth zones are based on analogies with present-day bathymetry
of the above-mentioned basins.
To generate a Paratethys DEM, we used the ANUDEM method applied in ESRI ArcGIS Pro, version 2.184,
which calculates topographical surfaces sensitive to shape and drainage structure resulting in hydrologically
correct models. The model was then used to calculate the total water volume. Subsequently, DEMs for various
base-level drops were obtained by applying simple map algebra additions and subtractions to the Parathetys
DEM. For each newly created DEM, the volume, 2D area and 3D area were estimated below specific thresholds.
This was accomplished using the Surface Volume tool from ArcGIS Pro, version 2.185.
Data availability
All data are available in the main text or supplementary materials.
Received: 7 October 2020; Accepted: 19 May 2021
References
1. Flecker, R. et al. Evolution of the Late Miocene Mediterranean-Atlantic gateways and their impact on regional and global envi-
ronmental change. Earth Sci. Rev. 150, 365–392 (2015).
2. Booth-Rea, G., Ranero, C. & Grevemeyer, I. The Alboran volcanic-arc modulated the Messinian faunal exchange and salinity crisis.
Sci. Rep. 8, 1–14 (2018).
3. Görür, N. et al. Neogene Paratethyan succession in Turkey and its implications for the palaeogeography of the eastern Paratethys.
Geol. Soc. Spec. Publ. 173, 251–269 (2000).
4. Krijgsman, W., Palcu, D. V., Andreetto, F., Stoica, M. & Mandic, O. Changing seas in the late Miocene Northern Aegean: A Para-
tethyan approach to Mediterranean basin evolution. Earth Sci. Rev. 210, 103386 (2020).
5. Govers, R., Meijer, P. & Krijgsman, W. Regional isostatic response to Messinian Salinity Crisis events. Tectonophysics 463, 109–129
(2009).
6. Popov, S. V. et al. Late Miocene to Pliocene palaeogeography of the Paratethys and its relation to the Mediterranean. Palaeogeogr.
Palaeoclimatol. Palaeoecol. 238, 91–106 (2006).
7. Popov, S. V., Antipov, M. P., Zastrozhnov, A. S., Kurina, E. E. & Pinchuk, T. N. Sea-level fluctuations on the northern shelf of the
Eastern Paratethys in the Oligocene-Neogene. Stratigr. Geol. Correl. 18, 200–224 (2010).
8. Popov, S. V. et al. Lithological-paleogeographic maps of paratethys. CFS Courier Forschungsinstitut Senckenberg 1–46 (2004).
9. Steininger, F. F. & Rögl, F. Paleogeography and palinspastic reconstruction of the Neogene of the Mediterranean and Paratethys.
Geol. Soc. Spec. Publ. 17, 659–668 (1984).
10. Suess, E. Untersuchungen über den Charakter der osterr. tertiärablagerungen II. Uber die Bedeutung der sogennanten, brackischen
Stufe’oder, Cerithienschichten’, Sitzungsber. Oesterr. Akad. Wiss. Math. Naturwiss 54 (1866).
11. Maissuradze, L. & Koiava, K. Biodiversity of Sarmatian foraminifera of the Eastern Paratethys. Bull. Georg. Natl. Acad. Sci. 5,
143–151 (2011).
12. Radionova, E. P. et al. Middle-Upper Miocene stratigraphy of the Taman Peninsula, Eastern Paratethys. Cent. Eur. J. Geosci. 4,
188–204 (2012).
13. Koleva-Rekalova, E. Sarmatian (Bessarabian) carbonate tempestites from Cape Kaliakra, North-Eastern Bulgaria. Comptes Rendu
l’Academie Bulg. des Sci. 53, 71–74 (2000).
14. de Leeuw, A. et al. Late Miocene sediment delivery from the axial drainage system of the East Carpathian foreland basin to the
Black Sea. Geology 48, 761–765 (2020).
15. Palcu, D. V. D. V., Vasiliev, I., Stoica, M. & Krijgsman, W. The end of the Great Khersonian Drying of Eurasia: Magnetostratigraphic
dating of the Maeotian transgression in the Eastern Paratethys. Basin Res. 31, 33–58 (2019).
16. Popov, S. V. et al. Paleontology and stratigraphy of the Middle-Upper Miocene of the Taman Peninsula: Part 1. Description of key
sections and benthic fossil groups. Paleontol. J. 50, 1039–1206 (2016).
17. Nevesskaja, L. A., Goncharova, I. A., Iljina, L. B., Paramonova, N. P. & Khondkarian., S. O. A. The Neogene stratigraphic scale of
the Eastern Paratethys. Stratigr. Geol. Korrelyatsiya 11(2), 3026 (2003) (see 105–127).
18. Vasiliev, I., Reichart, G. J., Krijgsman, W. & Mulch, A. Black Sea rivers capture significant change in catchment-wide mean annual
temperature and soil pH during the Miocene-to-Pliocene transition. Glob. Planet. Change 172, 428–439 (2019).
19. Golovina, L. A., Radionova, E. P., van Baak, C. G. C. C., Krijgsman, W. & Palcu, D. V. A Late Maeotian age (6.7–6.3 Ma) for the
enigmatic “Pebbly Breccia” unit in DSDP Hole 380A of the Black Sea. Palaeogeogr. Palaeoclimatol. Palaeoecol. 533, 109269 (2019).
20. Popov, S. V., Rostovtseva, Y. V., Pinchuk, T. N., Patina, I. S. & Goncharova, I. A. Oligocene to Neogene paleogeography and depo-
sitional environments of the Euxinian part of Paratethys in Crimean–Caucasian junction. Mar. Pet. Geol. 103, 163–175 (2019).
21. Goncharova, I. A. & Rostovtseva, Y. V. Evolution of organogenic carbonate buildups in the Middle through Late Miocene of the
Euxine-Caspian Basin (Eastern Paratethys). Paleontol. J. 43, 866–876 (2009).
22. Rostovtseva, Y. V. & Kuleshov, V. N. Carbon and oxygen stable isotopes in the middle-upper miocene and lower pliocene carbonates
of the Eastern Paratethys (Kerch-Taman Region): Palaeoenvironments and post-sedimentation changes. Lithol. Miner. Resour. 51,
333–346 (2016).
Scientific Reports | (2021) 11:11471 | https://doi.org/10.1038/s41598-021-91001-z 9
Vol.:(0123456789)www.nature.com/scientificreports/
23. Krijgsman, W. & Kent, D. V. Non-uniform occurrence of short-term polarity fluctuations in the geomagnetic field? New results
from middle to late miocene sediments of the North Atlantic (DSDP site 608). Geophys. Monogr. Ser. 145, 161–174 (2004).
24. Hilgen, F. J. et al. The Neogene Period. In The Geologic Time Scale 2012 vols 1–2 (eds Gradstein, F. M. et al.) 923–978 (Oslo Uni-
versity, Norway, 2012).
25. Gradstein, F. M. & Ogg, J. G. The chronostratigraphic scale. In Geologic Time Scale 2020 21–32 (Elsevier, 2020).
26. Pilipenko, O. V., Trubikhin, V. M., Rostovtseva, Y. V., Rybkina, A. I. & Filina, E. V. Magnitostratigraphic studies of the upper
Sarmatian-lower Maeotian deposits in the Panagia Cape section (the Taman Peninsula). Bull. Kamchatka Reg. Assoc. “Educational-
Scientific Center” Earth Sci. 42, 67–76 (2019).
27. Herbert, T. D. et al. Late Miocene global cooling and the rise of modern ecosystems. Nat. Geosci. 9, 843–847 (2016).
28. Gornitz, V. Encyclopedia of Paleoclimatology and ancient environments (2007).
29. Plotnikov, I. S. & Aladin, N. V. An overview of hybrid marine and lacustrine seas and saline lakes of the world. Lake Reserv. Res.
Manag. 16, 97–108 (2011).
30. Kojumdgieva, E. Palaeogeographic environment during the desiccation of the Black Sea. Palaeogeogr. Palaeoclimatol. Palaeoecol.
43, 195–204 (1983).
31. Razumkova, E. S. Palynological characterization of the Sarmatian deposits of the Eastern Paratethys (Section Zelenskii Mountain-
Cape Panagiya, Taman Peninsula). Stratigr. Geol. Correl. 20, 97–108 (2012).
32. Feurdean, A. & Vasiliev, I. The contribution of fire to the late Miocene spread of grasslands in eastern Eurasia (Black Sea region).
Sci. Rep. 9, 1–7 (2019).
33. Panova, L. A. & Gromova, N. S. Palynostratigraphy of Neogene Deposits. In Prakticheskaya palinostratigrafiya (Practical
Palynostratigraphy) 183–201 (Nedra, 1990).
34. Ivanov, D., Ashraf, A. R., Mosbrugger, V. & Palamarev, E. Palynological evidence for Miocene climate change in the Forecarpathian
Basin (Central Paratethys, NW Bulgaria). Palaeogeogr. Palaeoclimatol. Palaeoecol. 178, 19–37 (2002).
35. Pound, M. J. et al. A Tortonian (Late Miocene, 11.61–7.25 Ma) global vegetation reconstruction. Palaeogeogr. Palaeoclimatol.
Palaeoecol. 300, 29–45 (2011).
36. Strömberg, C. A. E., Werdelin, L., Friis, E. M. & Saraç, G. The spread of grass-dominated habitats in Turkey and surrounding areas
during the Cenozoic: Phytolith evidence. Palaeogeogr. Palaeoclimatol. Palaeoecol. 250, 18–49 (2007).
37. Böhme, M., Ilg, A. & Winklhofer, M. Late Miocene ‘washhouse’ climate in Europe. Earth Planet. Sci. Lett. 275, 393–401 (2008).
38. Syabryaj, S., Utescher, T., Molchanoff, S. & Bruch, A. A. A. Vegetation and palaeoclimate in the Miocene of Ukraine. Palaeogeogr.
Palaeoclimatol. Palaeoecol. 253, 153–168 (2007).
39. Kovar-Eder, J., Jechorek, H., Kvaček, Z. & Parashiv, V. The integrated plant record: An essential tool for reconstructing neogene
zonal vegetation in Europe. Palaios 23, 97–111 (2008).
40. Bruch, A. A., Utescher, T. & Mosbrugger, V. Precipitation patterns in the Miocene of Central Europe and the development of
continentality. Palaeogeogr. Palaeoclimatol. Palaeoecol. 304, 202–211 (2011).
41. Casanovas-Vilar, I. et al. Updated chronology for the Miocene hominoid radiation in Western Eurasia. Proc. Natl. Acad. Sci. U.S.A.
108, 5554–5559 (2011).
42. Casanovas-Vilar, I., van den Hoek Ostende, L. W., Furió, M. & Madern, P. A. The range and extent of the Vallesian Crisis (Late
Miocene): New prospects based on the micromammal record from the Vallès-Penedès basin (Catalonia, Spain). J. Iber. Geol. 40,
29–48 (2014).
43. Agustí, J. et al. A calibrated mammal scale for the Neogene of Western Europe State of the art. Earth Sci. Rev. 52, 247–260 (2001).
44. Moyà-Solà, I. C. V. S., Agustí, J. & Köhler, M. The geography of a faunal turnover: Tracking the vallesian crisis. Migr. Org. Clim.
Geogr. Ecol. https://doi.org/10.1007/3-540-26604-6_9 (2005).
45. Koufos, G. D., Kostopoulos, D. S. & Vlachou, T. D. Neogene/Quaternary mammalian migrations in Eastern Mediterranean. Belgian
J. Zool. 135, 181–190 (2005).
46. Merceron, G., Kaiser, T. M., Kostopoulos, D. S. & Schulz, E. Ruminant diets and the Miocene extinction of European great apes.
Proc. R. Soc. B Biol. Sci. 277, 3105–3112 (2010).
47. Fortelius, M. et al. Late Miocene and Pliocene large land mammals and climatic changes in Eurasia. Palaeogeogr. Palaeoclimatol.
Palaeoecol. 238, 219–227 (2006).
48. Böhme, M., Van Baak, C. G. C., Prieto, J., Winklhofer, M. & Spassov, N. Late Miocene stratigraphy, palaeoclimate and evolution
of the Sandanski Basin (Bulgaria) and the chronology of the Pikermian faunal changes. Glob. Planet. Change 170, 1–19 (2018).
49. Tang, Z. H. & Ding, Z. L. A palynological insight into the Miocene aridification in the Eurasian interior. Palaeoworld 22, 77–85
(2013).
50. Tucker, M. E. Sedimentary Rocks in the Field: A Practical Guide Vol. 38 (Wiley, 2011).
51. Miall, A. & Postma, G. The geology of fluvial deposits, sedimentary facies, basin analysis and petroleum geology. Sediment. Geol.
110, 149 (1997).
52. Miall, A. D. The Geology of Fluvial Deposits: Sedimentary Facies, Basin Analysis, and Petroleum Geology (Springer, 2013).
53. Collinson, J. D. The sedimentology of the Grindslow shales and the Kinderscout grit; a deltaic complex in the Namurian of northern
England. J. Sediment. Res. 39, 194–221 (1969).
54. Posamentier, H. W. & Walker, R. G. Facies models revisited (2006).
55. Van Baak, C. G. C. et al. A greigite-based magnetostratigraphic time frame for the late Miocene to recent DSDP Leg 42B cores
from the Black Sea. Front. Earth Sci. 4, 1–18 (2016).
56. Liu, S., Krijgsman, W., Dekkers, M. J. & Palcu, D. V. Early diagenetic greigite as an indicator of paleosalinity changes in the middle
Miocene Paratethys Sea of central Europe. Geochem. Geophys. Geosyst. 18, 2634–2645 (2017).
57. Mullender, T. A. T. T., van Velzen, A. J. & Dekkers, M. J. Continuous drift correction and separate identification of ferrimagnetic
and paramagnetic contributions in thermomagnetic runs. Geophys. J. Int. 114, 663–672 (1993).
58. Wang, L., Pan, Y. X., Li, J. H. & Qin, H. F. Magnetic properties related to thermal treatment of pyrite. Sci. China Ser. D Earth Sci.
51, 1144–1153 (2008).
59. Roberts, A. P. Magnetic mineral diagenesis. Earth Sci. Rev. 151, 1–47 (2015).
60. Mullender, T. A. T. et al. Automated paleomagnetic and rock magnetic data acquisition with an in-line horizontal “2G” system.
Geochem. Geophys. Geosyst. 17, 3546–3559 (2016).
61. Kirschvink, J. L. The least-squares line and plane and the analysis of palaeomagnetic data. Geophys. J. R. Astron. Soc. 62, 699–718
(1980).
62. Roberts, A. P. & Lewin-Harris, J. C. Marine magnetic anomalies: Evidence that ‘tiny wiggles’ represent short period geomagnetic
polarity intervals. Earth Planet. Sci. Lett. 183, 375–388 (2000).
63. McFadden, P. L. & McElhinny, M. W. Classification of the reversal test in palaeomagnetism. Geophys. J. Int. 103, 725–729 (1990).
64. Watson, G. S. Analysis of dispersion on a sphere. Geophys. Suppl. Mon. Not. R. Astron. Soc. 7, 153–159 (1956).
65. Dallanave, E. et al. Eocene (46–44 Ma) Onset of Australia-Pacific plate motion in the Southwest pacific inferred from stratigraphy
in New Caledonia and New Zealand. Geochem. Geophys. Geosyst. 21(7), e2019GC008699. https://doi.org/10.1029/2019GC0086
99 (2020).
66. Vasiliev, I. et al. Magnetostratigraphy and radio-isotope dating of upper Miocene-lower Pliocene sedimentary successions of the
Black Sea Basin (Taman Peninsula, Russia). Palaeogeogr. Palaeoclimatol. Palaeoecol. 310, 163–175 (2011).
Scientific Reports | (2021) 11:11471 | https://doi.org/10.1038/s41598-021-91001-z 10
Vol:.(1234567890)www.nature.com/scientificreports/
67. Hüsing, S. K., Hilgen, F. J., Abdul Aziz, H. & Krijgsman, W. Completing the Neogene geological time scale between 8.5 and 12.5 Ma.
Earth Planet. Sci. Lett. 253, 340–358 (2007).
68. Trubikhin, V. M. & Pilipenko, O. V. Rock magnetism and paleomagnetism of Maeotian deposits of the Popov Kamen reference
section (Taman Peninsula). Izv. Phys. Solid Earth 47, 233–245 (2011).
69. Torsvik, T. H. et al. Phanerozoic polar wander, palaeogeography and dynamics. Earth Sci. Rev. 114, 325–368 (2012).
70. Tauxe, L., Kodama, K. P. & Kent, D. V. Testing corrections for paleomagnetic inclination error in sedimentary rocks: A comparative
approach. Phys. Earth Planet. Inter. 169, 152–165 (2008).
71. Koymans, M. R., Langereis, C. G., Pastor-Galán, D. & van Hinsbergen, D. J. J. Paleomagnetism.org: An online multi-platform open
source environment for paleomagnetic data analysis. Comput. Geosci. 93, 127–137 (2016).
72. Kováč, M. et al. Paleogeography of the Central Paratethys during the Karpatian and Badenian. Scr. Fac. Sci. Nat. Univ. Masaryk.
Brun. Geol. 31, 7–17 (2004).
73. Rögl, F. Palaeogeographic considerations for Mediterranean and Paratethys seaways. Ann. Naturhist. Mus. Wien 99A, 279–310
(1999).
74. Magyar, I., Geary, D. H. & Müller, P. Paleogeographic evolution of the Late Miocene Lake Pannon in Central Europe. Palaeogeogr.
Palaeoclimatol. Palaeoecol. 147, 151–167 (1999).
75. Barrier, E., Vrielynck, B., Brouillet, J.-F. & Brunet, M. F. Darius Paleotectonic Reconstruction of the Central Tethyan Realm (2018).
76. Meulenkamp, J. E. & Sissingh, W. Tertiary palaeogeography and tectonostratigraphic evolution of the Northern and Southern
Peri-Tethys platforms and the intermediate domains of the African-Eurasian convergent plate boundary zone. Palaeogeogr. Pal-
aeoclimatol. Palaeoecol. 196, 209–228 (2003).
77. Gibbard, P. L. & Lewin, J. André Dumont medallist lecture 2014: Filling the North Sea Basin: Cenozoic sediment sources and river
styles. Geol. Belgica 19, 201–217 (2016).
78. Alvinerie, J. et al. Synthetic data on the paleogeographic history of Northeastern Atlantic and Betic-Rifian basin, during the Neo-
gene (from Brittany, France, to Morocco). Palaeogeogr. Palaeoclimatol. Palaeoecol. 95, 263–286 (1992).
79. Kuhlemann, J. Paleogeographic and paleotopographic evolution of the Swiss and Eastern Alps since the Oligocene. Glob. Planet.
Change 58, 224–236 (2007).
80. Magyar, I. et al. Progradation of the paleo-Danube shelf margin across the Pannonian Basin during the Late Miocene and Early
Pliocene. Glob. Planet. Change 103, 168–173 (2013).
81. Suc, J. P. et al. The region of the Strandja Sill (North Turkey) and the Messinian events. Mar. Pet. Geol. 66, 149–164 (2015).
82. Sakinç, M. & Yaltirak, C. Messinian crisis: What happened around the northeastern Aegean?. Mar. Geol. 221, 423–436 (2005).
83. Barrier, E. & Vrielynck, B. Palaeotectonic maps of the Middle East. MEBE Programme. Atlas of 14 maps. CCGM 1, 1–14 (2008).
84. ArcGIS Pro | ArcGIS Desktop https://pro.arcgis.com/en/pro-app/latest/get-started/view-help-for-arcgis-pro.htm.
85. Surface Volume—Help | ArcGIS Desktop https://desktop.arcgis.com/en/arcmap/10.3/tools/3d-analyst-toolbox/surface-volume.
htm.
Acknowledgements
We are indebted to Sergei. Popov, Alexander Guzhov and Alexandra Rylova, who helped us in the field, to Alex-
ander Iosifidi and Victor Popov, who participated in the initial paleomagnetic sampling, and to Ashley Ham-
mond, Plinio Jaqueto and Luigi Jovane, who helped to edit the manuscript. We are grateful to Andrew Roberts,
Madelaine Böhme, an anonymous reviewer and the Editorial board of the journal for their cogent observa-
tions and comments, which have improved the quality of the manuscript. Photo credits: Fig. 3a. Azov Sea—B.
Mitronov-Slobod, Wikimedia commons; Fig. 3b. Dniprovi Porohy—V. Maniuk, Wikimedia commons; Fig. 3c.
Syvash Lake—D. Vynokurov, Wikimedia commons; Fig. 3d. Kuyuk-Tuk Island—D. Vynokurov, Wikimedia
commons; Fig. 3e. The Azov coast—Wikimedia commons; Fig. S1. Late Miocene sites—D.V. Palcu; Fig. S3. The
Panagia Section—S.V. Popov; Fig. S5. Panagia lithologies—D.V. Palcu. Map credits: Figs S1, S2. Europe IAEA
map—Dachmann, Wikimedia commons.
Author contributions
D.P. and W.K. designed the study; D.P., I.V, M.S., and S.L. participated in field observations; M.S. logged the
section and coordinated the sampling, D.P., I.V., and W.K. developed the age model; I.P. and D.P. developed the
paleogeographic review; S.L. conducted sedimentological observations on site and developed the sedimentologi-
cal interpretation; I.S. and D.P. developed the digital elevation model; D.P., W.K. and I.P. discussed the results and
developed the concepts; all mentioned authors participated in manuscript writing and refinement.
Funding
This work was financially supported by the Netherlands Organization for Scientific Research (NWO) [grant
865.10.011] to WK; DP acknowledges the Fundação de Amparo à Pesquisa do Estado de São Paulo (FAPESP) for
financial support through grant 2018/20733-6; SL was financially supported by the PRIDE project (Pontocaspian
RIse and DEmise), which was funded by the European Union’s Horizon 2020 research and innovation program,
under the Marie Skłodowska-Curie Action (grant agreement no. 642973); I.P. acknowledges funding from the
Russian Foundation for Basic Research, project A 19-05-00743 and State Assignment GIN RAS.
Competing interests
The authors declare no competing interests.
Additional information
Supplementary Information The online version contains supplementary material available at https://doi.org/
10.1038/s41598-021-91001-z.
Correspondence and requests for materials should be addressed to D.V.P. or I.S.P.
Reprints and permissions information is available at www.nature.com/reprints.
Publisher’s note Springer Nature remains neutral with regard to jurisdictional claims in published maps and
institutional affiliations.
Scientific Reports | (2021) 11:11471 | https://doi.org/10.1038/s41598-021-91001-z 11
Vol.:(0123456789)www.nature.com/scientificreports/
Open Access This article is licensed under a Creative Commons Attribution 4.0 International
License, which permits use, sharing, adaptation, distribution and reproduction in any medium or
format, as long as you give appropriate credit to the original author(s) and the source, provide a link to the
Creative Commons licence, and indicate if changes were made. The images or other third party material in this
article are included in the article’s Creative Commons licence, unless indicated otherwise in a credit line to the
material. If material is not included in the article’s Creative Commons licence and your intended use is not
permitted by statutory regulation or exceeds the permitted use, you will need to obtain permission directly from
the copyright holder. To view a copy of this licence, visit http://creativecommons.org/licenses/by/4.0/.
© The Author(s) 2021
Scientific Reports | (2021) 11:11471 | https://doi.org/10.1038/s41598-021-91001-z 12
Vol:.(1234567890)You can also read