Why and How to Measure Food Loss and Waste - A PRACTICAL GUIDE - VERSION 2.0 - Commission for Environmental Cooperation
←
→
Page content transcription
If your browser does not render page correctly, please read the page content below
Commission for Environmental Cooperation

Why and How to Measure
Food Loss and Waste
A PRACTICAL GUIDE - VERSION 2.0

                                           Commission for Environmental Cooperation   i
PLEASE CITE AS:                                                PUBLICATION DETAILS

CEC. 2021. Why and How to Measure Food Loss and Waste: A       Document category: Project publication

Practical Guide - Version 2.0. Montreal, Canada: Commission    Publication date: March 2021

for Environmental Cooperation.                                 Original language: English
                                                               Review and quality assurance procedures:
This publication was prepared by Brian Lipinski and Austin     Final Party review: December 2020
Clowes (WRI) for the Secretariat of the Commission for         QAP359-21
Environmental Cooperation. The information contained           Project: Operational Plan 2019-2020/Preventing and
herein is the responsibility of the authors and does not       reducing food loss and waste
necessarily reflect the views of the CEC, or the governments
of Canada, Mexico or the United States of America.             FOR MORE INFORMATION:

ABOUT THE AUTHORS:                                             Commission for Environmental Cooperation
                                                               700 de la Gauchetière St. West, Suite 1620
WRI is a global research organization that turns big           Montreal (Quebec)
ideas into action at the nexus of environment, economic        H3B 5M2 Canada
opportunity and human well-being.                              t 514.350.4300 f 514.350.4314
                                                               info@cec.org / www.cec.org
Reproduction of this document in whole or in part and in
any form for educational or non-profit purposes may be
made without special permission from the CEC Secretariat,
provided acknowledgment of the source is made. The CEC
would appreciate receiving a copy of any publication or
material that uses this document as a source.

Except where otherwise noted, this work is protected
under a Creative Commons Attribution Noncommercial-
NoDerivative Works License.

© Commission for Environmental Cooperation, 2021
ISBN: 978-2-89700-286-2
Disponible en français—ISBN: 978-2-89700-287-9
Disponible en español—ISBN: 978-2-89700-288-6
Legal deposit—Bibliothèque et Archives nationales du
Québec, 2021
Legal deposit—Library and Archives Canada, 2021
CONTENTS

Acknowledgments............................................................................................................................................................................... 3

Executive Summary............................................................................................................................................................................ 5

Introduction........................................................................................................................................................................................... 6

Why Measure FLW?..............................................................................................................................................................................7

The Business Case for FLW Measurement, Prevention and Reduction................................................................... 9

Making the Change........................................................................................................................................................................... 13

Setting Your Scope........................................................................................................................................................................... 16

Determining Root Causes.............................................................................................................................................................20

Selecting Key Performance Indicators and Identifying Impacts..............................................................................24

Sector-specific Guidance..............................................................................................................................................................28
Primary Production................................................................................................................................................................................................... 30
Processing and Manufacturing.............................................................................................................................................................................32
Distribution and Wholesale.................................................................................................................................................................................. 34
Retail................................................................................................................................................................................................................................ 36
Food Service/Institutions...................................................................................................................................................................................... 38
Households...................................................................................................................................................................................................................40
Whole Supply Chain Approaches....................................................................................................................................................................... 42

Bibliography.........................................................................................................................................................................................44
FIGURES
Figure 1: Food Recovery Hierarchy.................................................................................................................................................................................................. 8
Figure 2: Average Return on Investment for FLW Prevention and Reduction..........................................................................................................11
Figure 3: Continuous Improvement Cycle for Reducing FLW.............................................................................................................................................12
Figure 4. Scope of an FLW Inventory............................................................................................................................................................................................ 18
TABLES
Table 1: Examples of Costs and Benefits Associated with Food Loss and Waste Measurement and Reduction................................... 10
Table 2. Tracking Reduction in FLW by Measuring FLW Sent to Various Destinations over Time (tonnes/year)....................................17
Table 3. Definition of FLW Destinations used in the FLW Standard.............................................................................................................................. 19
Table 4. Some Causes of FLW by Stage of the Food Supply Chain.................................................................................................................................21
Table 5. Some Drivers of FLW by Stage of the Food Supply Chain.................................................................................................................................21
Table 6. Tracking Causes by Method............................................................................................................................................................................................ 22
Table 7. Tracking Causes and Drivers........................................................................................................................................................................................... 23
Table 8. Summary of Most Common Key Performance Indicators and Impacts.................................................................................................... 27
Table 9. Methods Used to Measure FLW in the Primary Production Sector..............................................................................................................31
Table 10. Methods Used to Measure FLW in the Processing and Manufacturing Sector................................................................................... 33
Table 11. Methods Used to Measure FLW in the Distribution and Wholesale Sector ......................................................................................... 35
Table 12. Methods Used to Measure FLW in the Retail Sector........................................................................................................................................ 37
Table 13. Methods Used to Measure FLW in the Food Service Sector ........................................................................................................................ 39
Table 14. Methods Used to Measure FLW in the Household Sector.............................................................................................................................40
Table 15. Methods Used to Measure FLW across the Whole Supply Chain .............................................................................................................. 42
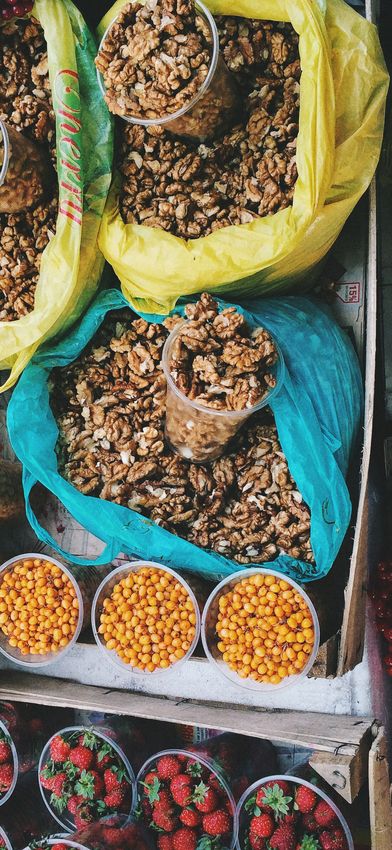
Photo credits: cover istock.com/Environmantic; p. 4 Kira Laktionov, Flickr, United Colors of Autumn, Creative Commons 2.0;
p. 6 istock.com/dusanpetkovic; p. 8 istock.com/jacoblund; p. 10 istock.com/SDI Productions; p. 12 istock.com/LiudmylaSupynska;
p. 16 istock.com/PrathanChorruangsak; p. 20 StateofIsrael, Flickr, Agriculture, Creative Commons 2.0; p. 24 FotoMediamatic, Flickr,
Workshop: Tempeh, Creative Commons 2.0.
2 Why and How to Measure Food Loss and Waste: A Practical Guide
ACKNOWLEDGMENTS
The authors thank the Commission for Environmental Cooperation (CEC) and its steering committee [comprised of the US Environmental
Protection Agency (EPA), Environment and Climate Change Canada (ECCC) and Secretaría de Medio Ambiente y Recursos Naturales (Semarnat)]
and the following individuals for their contribution to this practical guide and its accompanying technical report.

CEC STEERING COMMITTEE

ECCC: Michael Vanderpol
Semarnat: Itzel González Ornelas, Lydia Meade Ocaranza, Claudia Sánchez Castro
US EPA: Elle Chang, Claudia Fabiano, Maxwell Tomey
CEC: Antonia Andúgar Miñarro, Armando Yáñez Sandoval

FOOD LOSS AND WASTE EXPERT GROUP

Jean Buzby (USDA)                                    Monica McBride (World Wildlife Fund)              Renan Alberto Poveda (World Bank)
Cristina Cortinas (Independent Consultant)           Cher Mereweather (Provision Coalition)            Andrew Rhodes (Pronatura Mexico, A.C.)
Lesly Gonzalez Montaño (Nestle)                      Pete Pearson (World Wildlife Fund)                Bruce Taylor (Enviro-Stewards Inc.)
Martin Gooch (Center for Food Chain Excellence)      Gustavo Pérez Berlanga (Toks Restaurants)         Ashley Zanolli (Specialist)

OTHER CONTRIBUTORS

Selene Alencastro (Independent Consultant)                                 Suzanne Morrell (Creating Events)
Kari Armbruster (Kroger)                                                   Sara Pace (UC Davis)
Yvette Cabrera (Natural Resources Defence Council)                         Evelyn Park (Statistics Canada)
Gillian Chin-Sang (Second Harvest)                                         Camila Pascual (Dardin)
Florian Doerr (FAO)                                                        Leonor Paz Gómez (INEGI)
Melissa Donnelly (Campbell Soup Company)                                   Quentin Read (SESYNC)
Abdel Felfel (AAFC)                                                        Ned Spang (UC Davis)
Arturo Flores (Semarnat)                                                   Lee Ann Sullivan (AAFC)
Susan Fraser (AAFC)                                                        Gail Tavil (ConAgra)
Hilary French (UN Environment)                                             Andrew Telfer (Walmart)
Nell Fry (Sodexo)                                                          Paul Van Der Werf (2cg Inc.)
Heather Garlich (Food Marketing Institute)                                 José María Arroy Vargas (SIAP)
Martin Heller (Independent Consultant)                                     Federico González Celaya (BAMX)
Darby Hoover (Natural Resources Defense Council)                           Lini Wollenberg (University of Vermont)
Wesley Ingwersen (US EPA)                                                  Robert Wood (Ecocaterers)
Lisa Johnson (North Carolina State University)                             Jude Zuppiger (Independent Consultant)

                                                                                             Commission for Environmental Cooperation           3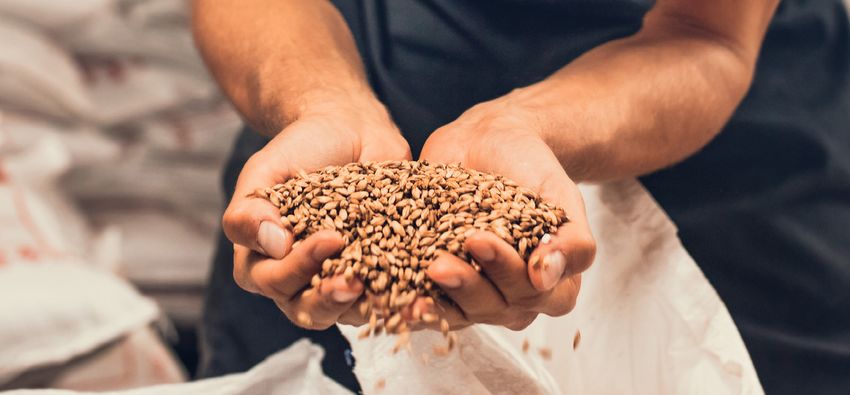
ACKNOWLEDGMENTS - VERSION 2.0

    Bancos de Alimentos de Mexico (BAMX)                               The Kellogg Company
    Bimbo Canada                                                       Loop Resource
    Bruized                                                            Los Trompos
    Canadian Produce Marketing Association                             Miss Bāo Restaurant
    Central de Abasto de la Ciudad de México (CDMX)                    Ontario Restaurant, Hotel, and Motel Assocation
    Centro Intercultural de Estudios de Desiertos y Océanos (CEDO)     PlantedMeals
    Conseil de la transformation alimentaie du Québec                  Recycle Leaders
    Denver Department of Public Health and Environment                 Restaurants Canada
    Enviro-Stewards                                                    San Diego Food System Alliance
    EtOh Brasserie                                                     Second Harvest
    FoodMesh                                                           The Spent Goods Company
    Grupo Bimbo MX                                                     TBJ Gourmet
    Grupo Lala                                                         York, Ontario
    Hotel Association of Canada

4      Why and How to Measure Food Loss and Waste: A Practical Guide
Executive Summary
This practical guide provides a step-by-step plan for how companies and governments can begin the process of measuring
food loss and waste. It addresses key topics, such as:

•   Why measure food loss and waste (FLW)
•   Establishing a business case for food loss and waste measurement
•   Addressing common barriers and obstacles
•   Tracking causes of food loss and waste
•   Converting measurements to other financial, environmental and social impacts
•   Selecting a measurement method

This guide was developed in partnership with government representatives, business experts and others in Canada, Mexico
and the United States as part of work under the CEC to address food waste across North America’s supply chain. WRI and
WRAP, two international organizations with specialized expertise in FLW reduction, co-authored the CEC guide.

VERSION 2.0
Version 2.0 of the guide, which was developed in 2020, provides a number of improvements upon the initial release, based on
feedback and input from pilot testers, expert contributors, and other individuals and organizations consulted by the authors.
These improvements were designed to make the guide more user-friendly and allow readers to more easily find the material
most useful to them. In addition, a number of new tools and case studies are available at http://www.cec.org/flwm/ to assist
users in their FLW measurement journey. These tools are intended to provide information and activities designed to help
businesses, institutions and others prevent, recover and recycle FLW. Appendix A, which provides descriptions of several FLW
measurements methods, is also available for download at this link.

                                                                                 Commission for Environmental Cooperation       5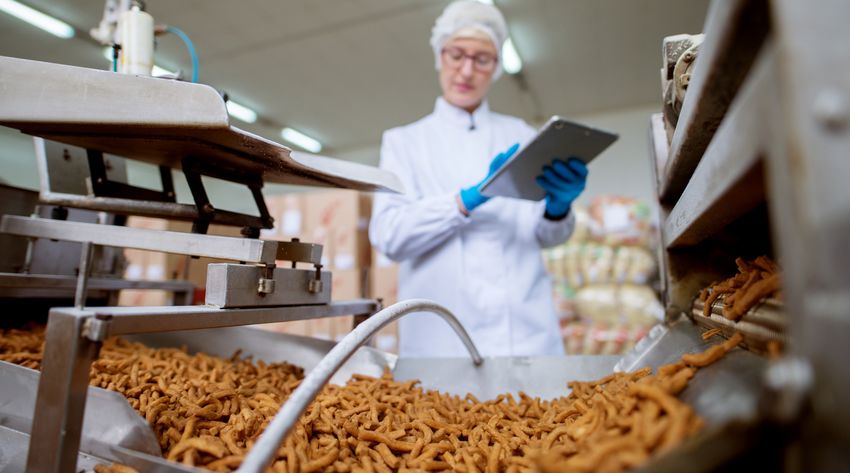
Introduction
    Across North America,1 businesses, institutions and others increasingly realize the enormous impacts of food loss and waste.
    Uneaten food represents social, environmental and economic costs, but also a large opportunity. Taking action to prevent
    and reduce food loss and waste offers a rare “triple win” for a business, institution or other organization, as it can lower
    economic costs by addressing operational inefficiencies, support efforts to combat food insecurity in communities, and
    reduce environmental impacts, including its carbon footprint.2

    To be successful in preventing and reducing food loss and waste, an organization or facility must first measure how much
    food is being lost or wasted within its boundaries. Measurement identifies the scale of the problem and the hotspots that
    most need to be addressed and allows for tracking progress over time. In short, what gets measured gets managed.

    This practical guide walks readers through the steps for measuring food loss and waste (FLW).3 Treat it as a quick reference
    for assistance and look for internal links that allow you to quickly reach the material of most interest.

    The checklist below shows seven steps to measuring FLW and the corresponding modules that address them in this guide.
    Use it to track progress and easily access the most appropriate module. Steps 1–6 are the same for all user types, while Step 7
    offers sector-specific information applicable to measuring FLW at different stages of the food supply chain.

                     Step 1: Determine why you want to prevent and reduce food loss and waste.
                     (Module: Why Measure FLW?)

                     Step 2: Establish your business case for preventing and reducing food loss and waste.
                     (Module: The Business Case for FLW Measurement, Prevention and Reduction)

                     Step 3: Prepare for the change of measuring, preventing and reducing food loss and waste.
                     (Module: Making the Change)

                     Step 4: Determine your definition of food loss and waste.
                     (Module: Setting Your Scope)

                     Step 5: Determine your causes of food loss and waste and identify solutions.
                     (Module: Determining Root Causes)

                     Step 6: Identify what will be measured to monitor progress over time.
                     (Module: Selecting Key Performance Indicators and Identifying Impacts)

                     Step 7: Select and implement a food loss and waste measurement method based on your sector.
                     (Module: Sector-Specific Guidance)

    1) In this guide, North America refers to the countries of Canada, Mexico and the United States.

    2) A
        ccording to the Food and Agriculture Organizations of the United Nations “Reducing food loss and waste is widely seen as an important way to reduce
       production costs and increase the efficiency of the food system, improve food security and nutrition, and contribute towards environmental sustainability.”
       FAO. 2019. The State of Food and Agriculture 2019. Moving forward on food loss and waste reduction. Rome. http://www.fao.org/3/ca6030en/ca6030en.pdf

    3) A
        lthough many definitions of food loss and waste exist in this guide, food loss and waste denote all possible material and disposal routes that could be
       considered food loss and waste. For more information on defining food loss and waste in specific contexts, see the “Setting Your Scope” section.

6       Why and How to Measure Food Loss and Waste: A Practical Guide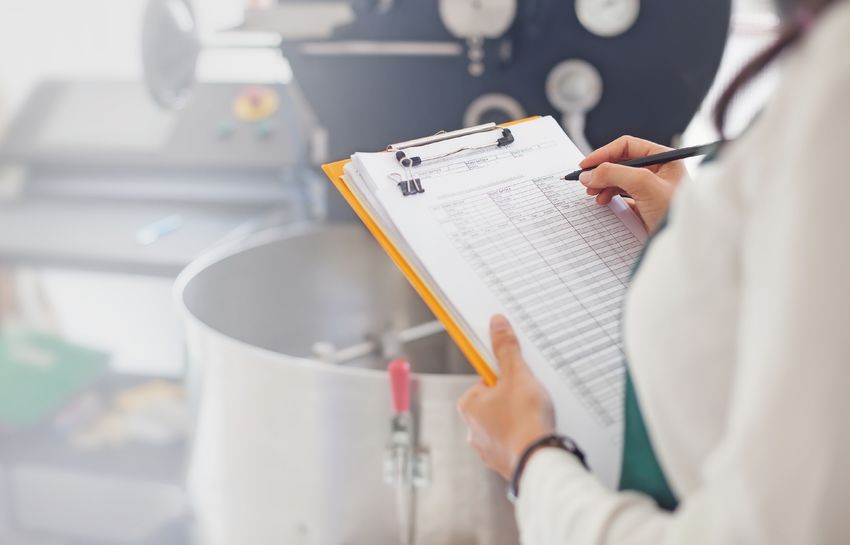
Why Measure FLW?

A significant amount of food grown for human                 ENVIRONMENTAL: When food is lost or wasted, all of the
consumption is never eaten. In fact, by weight, about        environmental inputs used on that food are wasted as well
one-third of all food produced in the world in 2009 was      (FAO 2011). That means all the land, water, fertilizer, fuel and
lost or wasted (FAO 2011). In North America, approximately   other resources that produced, processed, or transported a
168 million tonnes of FLW are generated annually: 13         food item are wasted when food meant to be consumed by
million in Canada, 28 million in Mexico and 126 million      people is thrown away. Food waste sent to landfills creates
in the United States. This equates to 396 kilograms          methane—a powerful greenhouse gas. Thus, reducing FLW
per capita in Canada, 249 in Mexico and 415 in the           can reduce a company’s environmental footprint.
United States (CEC 2017).
                                                             SOCIAL: Surplus edible food can be redistributed to food
This level of inefficiency suggests three strong             banks, food rescue agencies and other charities, which
incentives to reduce food loss and waste: economic,          can direct it to food insecure populations, making good
environmental and social.                                    use of the food rather than disposing of it. For many
                                                             companies, food donation or redistribution is an important
ECONOMIC: The huge amounts of food lost or wasted are        part of their corporate social responsibility activities. Food
currently considered part of the cost of doing business as   directed to human consumption is not considered to be
usual. Rather than trying to maximize the value of food      lost or wasted.
produced, companies and other organizations tend to
focus on the disposal costs for the products that are lost
or wasted. Companies could make significant economic
gains by putting food headed for the waste stream
to profitable uses.

                                                                               Commission for Environmental Cooperation         7
The old adage that “what gets measured gets managed”
THE FOOD RECOVERY
holds true with FLW. Measuring food waste helps an
HIERARCHY
organization understand the root causes of food waste and
thus work to prevent it. When trying to reduce FLW, the first emphasis should be on
prevention, or source reduction. Although some end-of-
life destinations for FLW have fewer negative impacts than
THE RISK OF NOT CHANGING others (e.g., FLW going to animal feed is preferable to FLW
The business-as-usual path has risks. If a company going to a landfill), prevention should be the foremost goal.
continues to operate with built-in assumptions about This principle is reflected in the Food Recovery Hierarchy
acceptable levels of waste, it risks being surpassed by (Figure 1) developed by the United States Environmental
its more innovative competitors who can turn waste into Protection Agency (US EPA).
profit. The business case of reducing FLW is strong and
those who ignore this opportunity will continue to waste Source reduction (i.e., preventing food waste in the first
money and resources. Additionally, an increasing number place) is the most desirable way to address FLW because it
of local, subnational and national governments are prevents the negative social, environmental and economic
imposing disposal bans on food waste or requiring excess impacts of producing food that is wasted. Moving down
food to be donated (Sustainable America 2017; Christian the recovery hierarchy stages, less value is recovered
Science Monitor 2018). If this trend continues, companies from the FLW at each stage, until the bottom stage—
may face increased expenses from further regulations landfill, incineration, or sewer disposal—where negative
in the future. environmental impacts are highest. From a climate
perspective, tonne for tonne, preventing wasted food is six
to seven times as beneficial as composting or anaerobic
digestion of the waste (US EPA 2016).
Figure 1: Food Recovery Hierarchy
Food Recovery Hierarchy
Most p
Prevention/Source Reduction
Reduce the volume of the surplus food generated
referre
Feed Hungry People
Donate extra food to food banks,
soup kitchens, and shelters
d
Feed Animals
Divert food scraps to animal feed
Industrial Uses
Provide waste oils for rendering and fuel conversion
and food scraps for digestion to recover energy
Composting
Least p
Create a nutrient-rich soil amendment
refe
Landfill/Incineration/Sewer
Last resort to disposal
rred
Source: Adapted from US EPA n.d.
8 Why and How to Measure Food Loss and Waste: A Practical GuideThe Business Case for FLW
Measurement, Prevention
and Reduction
Regional and global institutions are increasingly leaders around the world are recognizing that reducing
recognizing the importance of addressing FLW. The CEC FLW is an opportunity to improve their bottom lines while
Strategic Plan 2021-2025 identifies the circular economy contributing to food security and environmental goals.
as a key pillar of achieving greater sustainability, pointing Although measuring FLW may involve some upfront costs,
out that “food loss and waste entails enormous social, ample evidence shows that the benefits of measuring
environmental and economic costs” (CEC 2020). and reducing FLW far outweigh the long-term costs of not
addressing it. The upfront costs of quantifying FLW for
Additionally, in 2015 the United Nations General Assembly the first time and implementing an FLW prevention and
adopted a set of 17 Sustainable Development Goals to reduction program can lead to a steady stream of financial
end poverty and protect the planet. Among these goals is benefits for years with only minimal continued investment.
a target (known as Target 12.3) to halve per capita global
food waste at the retail and consumer levels and reduce An illustrative list of costs and benefits associated with
food losses along production and supply chains by 2030. measuring FLW is shown in Table 1.
Businesses, organizations and others are also realizing When starting to measure FLW, businesses often see a
the importance and benefits of addressing food loss quick payback. In many cases, a suite of simple solutions
and waste, but many have to start by making their own can quickly and dramatically cut FLW and its associated
internal business case for action. Across the food industry, costs. Many organizations can achieve a positive return on
FLW is often buried in operational budgets, where it is investment within just one year.
accepted as the cost of doing business. However, business
Commission for Environmental Cooperation 9Table 1: Examples of Costs and Benefits Associated with Food Loss and Waste
Measurement and Reduction
Costs Benefits
• Measuring food loss and waste and identifying hotspots • Increased operational efficiency
• Expenditures on consultants and staff training • Lower operating costs (including purchasing costs,
• Purchasing new equipment and/or repairing existing energy costs and even labor costs)
equipment • Additional revenue via previously unsold foods
• Changing purchasing or inventory management • Lower waste collection and management costs
practices
• Changing daily business operating procedures
Source: Authors.
In fact, as shown in Figure 2, it has been found that of the true cost of FLW to your organization. Focus on the
businesses tend to experience a median savings of $14 for value of the food as it moves through the supply chain and
every $1 invested on FLW measurement, prevention and identify processes, activities and services that contribute
reduction (Hanson and Mitchell 2017). to unsold surplus and wasted food to find opportunities
for improvement. To maximize potential economic savings,
Financial savings and increased revenue carry on over time focus on FLW attributed to normal day-to-day business
with minimal continued investment; especially as “best operations (versus atypical occurrences like broken
practice” behaviors and habits for reducing FLW become equipment). Many businesses assume a certain amount of
engrained in a business’s standard operating procedures. waste as being fundamental to their operations, so these
The positive effects of more efficient business operations assumptions should be checked and challenged as well.
compound over time.
For example, imagine a manufacturer that produces
In addition to financial benefits, reducing FLW can canned tomatoes. This manufacturer sends a tonne of
contribute to environmental and corporate social oversupplied tomatoes to the landfill each month at a cost
responsibility goals, brand recognition and improved of $100. However, that same amount of tomatoes is valued
stakeholder relationships. These impacts are discussed in at $900 at the time it is removed from the food supply
greater detail in the “Selecting Key Performance Indicators chain. So in actuality, the cost of the FLW is the $900 in
and Identifying Impacts” module of this guide. lost product value in addition to the $100 in disposal fees,
resulting in a total loss of $1,000 each month.
MAKING YOUR OWN
BUSINESS CASE For another example, imagine a restaurant that generates
FLW as part of its front-of-house (dining area) and back-
Although evidence shows that reducing FLW generally of-house (preparation area) operations. After measuring
results in economic gains, managers may still need to the FLW that is generated on the diner side, the owners
establish the benefits for their own companies. find that much of the FLW is from bread that is given to
customers for free before ordering their meals, costing
To make the case, follow two basic steps:
$200 in surplus bread to be sent to landfill. In the kitchen,
the FLW is found to be primarily due to over-ordering of
FIRST, DETERMINE HOW MUCH FOOD LOSS AND WASTE IS
food, costing $800 worth of food to be sent to landfill. This
COSTING YOUR COMPANY.
same amount of food costs the restaurant $100 a month
to be sent to landfill, meaning all of the FLW combined is
Waste management fees (e.g., transport, landfill,
costing the restaurant $1100 a month.
composting, etc.) account for a relatively small portion
10 Why and How to Measure Food Loss and Waste: A Practical GuideFigure 2: Average Return on Investment for FLW Prevention and Reduction
COMPANIES
- +
EVERY YIELDED
$1 $14
INVESTED IN RETURN
Measuring waste Selling imperfect produce
Training staff Creating new products
Improving inventory management Reducing waste management costs
Changing packaging Avoiding cost of food not sold
Source: Adapted from Hanson and Mitchell 2017.
One useful tool that can be used to estimate the cost In the prior restaurant example, the restaurant can achieve
of FLW to a business is the Provision Coalition’s Food savings by serving bread pre-appetisers only upon request
Loss and Waste Toolkit, which provides a step-by-step (and/or reducing portion sizes) and improving inventory
calculator for determining the value of FLW as it moves management of food in the kitchen. Each of these
through processing and manufacturing.4 Although the interventions is actually cost-free for the restaurant and
toolkit is intended for use by manufacturers, the principle will immediately begin to realize $1100 in savings a month
behind it can be adapted to other sectors. if implemented fully.
SECOND, DETERMINE THE POTENTIAL BENEFITS OF TAKING
ACTION TO PREVENT FOOD LOSS AND WASTE.
IMPLEMENTATION AND
IMPROVEMENT OVER TIME
After assessing the cost of FLW, assess the costs associated Once a business case has been accepted, a business
with taking action to prevent or reduce it. For example, in or organization can implement cost-effective solutions
the manufacturing example above, the tomato processor to prevent and reduce food loss and waste. To ensure
may discover that 2.5 tonnes per month of tomatoes, which continuous improvement over time, it is important to
could be used for tomato soup, are being sent to a landfill. periodically reexamine additional opportunities for
The soup is valued at $2,000 per tonne and the cost of the reducing FLW and introduce additional corrective actions
equipment necessary to produce the soup is a one-time where appropriate. As seen in Figure 3, quantification and
investment of $10,000. So in this case, reducing the wasted implementation are part of a “continuous improvement
tomatoes by using them in soup would pay for itself in two loop” that lead to greater improvements over time.
months and generate $5,000 per month in profit from that Measuring and preventing food waste is not a one-time
point onward. Even if the company did not want to redirect event, but an ongoing journey.
the tomatoes to a new product, it could change ordering
practices to avoid tomato surpluses and achieve savings
that way.
4) The Provision Coalition is a Canadian food and beverage manufacturer sustainability consultancy firm.
Commission for Environmental Cooperation 11Figure 3: Continuous Improvement Cycle for Reducing FLW
Step 1:
Quantifying Food Loss
and Waste
Step 5: Step 2:
Monitoring Identifying Root Causes
of Solutions of Food Loss and Waste
Step 4: Step 3:
Implementation of Selection and Evaluation
Solutions of Solutions
Source: Adapted from Provision Coalition 2017.
12 Why and How to Measure Food Loss and Waste: A Practical GuideMaking the Change
Measuring and reducing food loss and waste is a big “We don’t waste any food.”
adjustment for many businesses, institutions and other
organizations. Achieving significant reductions means FLW occurs whenever food that could have otherwise
challenging key assumptions about how a system operates. been sold and safely eaten is discarded. Opportunities to
To accomplish significant change, you must prepare for it. prevent and reduce FLW exist in all organizations and all
stages of the food supply chain (i.e., from food production
Within an organization, individuals will find many reasons to consumption). Causes of FLW at different stages of the
to resist taking action on FLW. These concerns are often supply chain are highlighted in the “Determining Root
legitimate and should not be disregarded. However, they Causes” module of this guide.
generally fall into broad categories.
While some organizations may focus on directing
wasted food to beneficial end uses, such as animal feed,
bioproducts and composting, they can profit more by
taking steps to minimize the amount of FLW generated
in the first place.
Commission for Environmental Cooperation 13Simply put, FLW represents an operational inefficiency The upfront costs associated with FLW measurement,
to an organization—the costs of which compound over prevention and reduction are frequently repaid within
time. Minimizing the amount of FLW generated from the a relatively short time period, often in less than a year.
outset (i.e., before it needs to be managed as waste) is The module “The Business Case for FLW Prevention and
good for the long-term financial health of an organization. Reduction” provides more information about payback
Measurement helps to identify where those money saving periods for investments.
opportunities exist, by pinpointing where ongoing FLW is
“This is the way we’ve always done things.”
generated within a facility.
Generating FLW is often built into the assumptions of
“We already have too much going on to how a business or organization operates. For example,
measure something else.” in a restaurant that operates a buffet, a certain amount
Many sustainability managers are already tasked with of leftover food may be expected as “the cost of doing
overseeing various measurements, such as greenhouse business.” However, measuring those leftovers might
gas (GHG) emissions or water use. Measurement of FLW pinpoint opportunities to prevent and reduce FLW and
can seem like an added burden. However, FLW represents save money (e.g., using smaller plate sizes, discontinuing
an operational inefficiency that not only costs a business unpopular dishes).
directly but also relates to many other environmental
Different parts of a business or organization will also
impacts, including land, water, and greenhouse gases.
have different perspectives on FLW. A chef in a restaurant
Profit margins for food businesses are often slim and
may think of “food waste” as food that gets thrown away
addressing inefficiencies can cause significant benefits
from the refrigerators, but not consider waste from
for a company’s bottom line. So although FLW may seem
food preparation or plate waste. A server in that same
like “just another thing to measure,” it in fact can lead to
restaurant may not think about food that’s getting thrown
significant benefits for the business.
away from refrigerators, but may be very aware of the food
Initial measurements may be aided by existing records to that customers leave on their plates. By ensuring that
provide a cost-effective start. Inventory records and waste everyone is using the same definition and considering
transfer receipts can, with minimal investment, provide an all potential sources, you may be able to overcome some
early estimate of FLW levels. These records can help ease resistance to FLW measurement and reduction. The
whatever time burden FLW measurement may represent “Setting Your Scope” module of this guide can help you
for a company or organization. The “Records” section in establish a common definition.
Appendix A provides more information about using such “This isn’t working.”
documents to estimate FLW levels.
If a change is not going smoothly it is important to
“It’s not worth the cost to measure FLW.” understand why this is the case. Each of the following
The cost of measuring and implementing changes to elements can greatly improve the likelihood of success:
prevent and reduce FLW is small relative to the long- • Senior management commitment and support
term economic upside. Measuring FLW helps identify
• Sufficient resources (funding, time, expertise)
where operational and process inefficiencies may exist,
and also signal where corrective action is needed. Many • Concrete plan that allocates responsibilities
approaches to measuring FLW can be achieved with • Employee awareness and training
minimal investment, while others may require higher levels
• Internal “champions” to foster action
of investment. The “Sector-Specific Guidance” module in
this guide offers tables displaying a range of methods for
measuring FLW, along with the level of resources required.
14 Why and How to Measure Food Loss and Waste: A Practical GuideIn one case, the Provision Coalition worked with Ippolito
Fruit & Produce in Canada to reduce FLW in its operations.
For the “reinforcement” stage in the change management
process, they identified key steps to help keep the change
in motion (Mereweather 2018):
• Gathering feedback from employees
• Developing accountability and performance
management systems
• Auditing and identifying compliance of change
• Finding root causes of FLW and taking corrective action
• Recognizing, celebrating and rewarding successes
These steps can help keep people on board with
the difficult process of making a change toward FLW
measurement, prevention and reduction. Like any new
change, there will be challenges along the way. But if a
business has a strong case and rationale, these challenges
can be overcome.5
5) For more about making the change, see the guidance published by the FLW Protocol titled “Overcoming Resistance to the Measurement of Food Loss and Waste.”
Commission for Environmental Cooperation 15Setting Your
Setting Your Scope
Scope
Once you’ve determined that it is worthwhile to measure removed from the food supply chain” (FLW Protocol 2016a).
FLW, define what FLW means in your operations and how The standard clarifies definitions and shows the possible
you will communicate that information, both internally destinations of FLW when it is removed from the human
and externally. Reporting FLW data publicly has multiple food supply chain.
benefits: it raises awareness of the issue, allows for
information-sharing among businesses, provides
TRACKING PROGRESS ON
information to policymakers and assists FLW tracking
efforts over time.
PREVENTING FLW
The FLW Standard does not provide specific guidance on
Public reporting should align with the Food Loss and Waste tracking progress on preventing FLW. However, prevention
Accounting and Reporting Standard, or FLW Standard. can be tracked by establishing a base year as a starting
The FLW Standard is “a global standard that provides point and assessing prevention efforts against that
requirements and guidance for quantifying and reporting baseline. If total production is increasing or decreasing,
on the weight of food and/or associated inedible parts intensive measurements (tonnes per unit of production)
16 Why and How to Measure Food Loss and Waste: A Practical Guidecan better quantify how much FLW was prevented. For
Material Type
example, a company may set a base year of 2016 when
Identify the materials included in the inventory: food only,
it had 15,000 tonnes of FLW. The following year, the FLW
associated inedible parts only, or both. Associated inedible
may be 13,500 tonnes, meaning 1,500 tonnes of FLW
parts are defined as the components of a food product
had been prevented.
that are not intended for consumption, such as bones,
A hypothetical example of how prevention can be tracked rinds or pits.
alongside FLW amounts is shown in Table 2.
Destination
REPORTING AMOUNTS OF FLW The destination is where the FLW goes when removed from
Reporting using the FLW Standard requires setting the the food supply chain. The 10 categories for destinations
“scope” of your FLW, as shown in Figure 4. This scope described in the FLW Standard are listed and defined in
includes only food that has been removed from the Table 3. Again, these destinations are only for FLW that has
human food supply chain, meaning that food donated, been removed from the human food supply chain and do
redistributed, or otherwise kept in the food supply chain not include prevention or redistribution of FLW, which can
is not included. Tracking redistribution of food may align be tracked as described in the section “Tracking Progress
with your objectives and can be tracked using a method on Preventing FLW.” Food that is distributed to humans
similar to that outlined in the section “Tracking Progress on outside the marketplace is not considered to be lost or
Preventing FLW.” wasted, since it is not sent to a destination.
The scope has four components: timeframe, material type, Food that is recovered for donation to feed hungry people
destination and boundary. and that would otherwise be lost or wasted, is generally
not considered to be FLW and therefore not identified as
Timeframe a destination in Figure 4. Some organizations may also
exclude animal feed and bio-based materials/biochemical
Define the period of time for which the inventory results are
processing (where material is converted into industrial
reported. Typically, results are reported on an annual basis.
products) from their definition of FLW.
Table 2. Tracking Reduction in FLW by Measuring FLW Sent to Various
Destinations over Time (tonnes/year)
2016 2017 2018
Total Production 100,000 tonnes 100,000 tonnes 100,000 tonnes
Anaerobic Digestion 3,000 tonnes 4,000 tonnes 4,000 tonnes
Landfill 8,000 tonnes 6,000 tonnes 5,500 tonnes
Sewer/water treatment 4,000 tonnes 3,500 tonnes 3,500 tonnes
Total FLW 15,000 tonnes 13,500 tonnes 13,000 tonnes
Tonnes FLW per unit of production
15% 13.5% 13%
(percent)
Reduction in FLW
0% -10% -13%
(percent relative to 2016)
Source: Authors.
Commission for Environmental Cooperation 17Figure 4. Scope of an FLW Inventory
TIM EFR AM E M ATER IA L T YPE D EST IN AT IO N BO U N DA RY
FOOD Animal Feed Food category
INEDIBLE PARTS Biomaterial/processing Lifecycle stage
Co/anaerobic digestion Geography
Compost/aerobic Organization
Controlled combustion
Land application
Landfill
Not harvested
Refuse/discards
Sewer
Source: FLW Protocol 2016a.
While definitions and scope of FLW can differ, it is FLW Standard. By disclosing the scope of an inventory, a
nonetheless important to measure all possible end business or government clarifies its definition of FLW, thus
destinations of recovered food and FLW to support efforts allowing for more accurate comparisons and tracking of
to minimize operational inefficiencies. FLW over time.
Boundary
The boundary has four components: ADDITIONAL RESOURCES
• THE FOOD CATEGORY, or the types of food included in
FOR REPORTING
the inventory The FLW Standard contains a number of reporting
• THE LIFECYCLE STAGE, or the stages of the food supply resources. Chapter 6 outlines the process for setting a
chain (e.g., processing and manufacturing, retail)
scope and Chapter 13 provides additional guidance on
included in the inventory
reporting. A sample reporting template and customizable
• GEOGRAPHY, or the geographic borders within which
scope template are available for download.
the inventory occurs
• ORGANIZATION, or the type of unit (e.g., household or
factory) within which the FLW occurs Additionally, multiple online databases allow businesses
and organizations to submit their own FLW data and review
WHY SCOPE MATTERS FLW data from others. These include the UN FAO “Food
Loss and Waste Database” and the “Food Waste Atlas,”
Disclosing the scope of an inventory is important because developed by the World Resources Institute and WRAP.
numerous definitions of “food loss and waste” exist. Some
include only food but not inedible parts, while others
consider only a subset of the possible destinations in the
18 Why and How to Measure Food Loss and Waste: A Practical GuideTable 3. Definition of FLW Destinations used in the FLW Standard
Destination Definition
Animal feed Diverting material from the food supply chain to animals
Bio-based materials/biochemical
Converting material into industrial products
processing
Codigestion/
Breaking down material via bacteria in the absence of oxygen
anaerobic digestion
Composting/aerobic processes Breaking down material via bacteria in oxygen-rich environments
Controlled combustion A facility that is specifically designed for combustion in a controlled manner
Spreading, spraying, injecting or incorporating organic material onto or below the
Land application
surface of the land to enhance soil quality
Landfill An area of land or an excavated site specifically designed to receive wastes
Not harvested/plowed-in Leaving crops that were ready for harvest in the field or tilling them into the soil
Refuse/discards/litter Abandoning material on land or disposing of it in the sea
Sewer/wastewater treatment Sending material down the sewer, with or without prior treatment
Other Sending material to a destination different from the 10 listed above
Source: FLW Protocol 2016a.
Commission for Environmental Cooperation 19Determining Root Causes
It is difficult to reduce FLW without understanding uses the terms “causes” and “drivers.” A cause is defined
what causes it. For example, after performing a waste as the proximate or immediate reason for FLW, while a
composition analysis, a restaurant may discover that driver is defined as an underlying factor that played a
it is discarding a large amount of tomatoes each week, role in creating that reason (FLW Protocol 2016a). Tables
but the waste data do not tell it why those tomatoes 4 and 5 list some possible causes and drivers by stage in
are being discarded. This module describes how to track the food supply chain.
causes of FLW when the information is not obvious in the
quantification method. If a restaurant discards a large amount of tomatoes, the
immediate cause might be that the tomatoes spoiled after
DEFINING CAUSES
sitting unused in the kitchen. The underlying driver may be
AND DRIVERS
that the restaurant is incorrectly forecasting the amount
of tomatoes it needs each week. Perhaps a previously
There are two layers to identifying the cause of FLW—the popular dish that requires tomatoes is not selling as much
immediate reason why something became FLW and the as anticipated, but the restaurant is continuing to order
underlying factor that led to the waste. The FLW Standard tomatoes based on prior rather than current demand.
20 Why and How to Measure Food Loss and Waste: A Practical GuideTable 4. Some Causes of FLW by Stage of the Food Supply Chain
Primary Processing and Distribution Retail Food Service/ Household
Production Manufacturing and Institutions
Wholesale
• Spillage • Spillage • Cosmetic or • Product recall • Product recall • Product recall
physical damage
• Cosmetic or • Trimming during • Food prepared • Food prepared • Food prepared
physical damage processing • Spoilage improperly improperly improperly
• Damage from • Rejected from • Past sell-by date • Food cooked but • Food cooked but • Food cooked
pests or animals market not eaten not eaten but not eaten
• Rejected from
• Not harvested market • Cosmetic • Cosmetic • Cosmetic
damage damage damage
• Unable to sell • Unable to reach
due to quantity market • Spoilage • Spoilage • Spoilage
or size
• Past sell-by date • Past sell-by or
• Unable to reach use-by date
market
Source: FLW Protocol 2016a, CEC 2017.
Table 5. Some Drivers of FLW by Stage of the Food Supply Chain
Primary Processing and Distribution Retail Food Service/ Household
Production Manufacturing and Institutions
Wholesale
• Premature • Outdated or • Excessive • Regular • Regular • Overpurchase
or delayed inefficient centralization of replenishment of replenishment
harvesting equipment and food distribution stocks to evoke of buffet or • Inadequate
processes processes abundance cafeteria to planning
• Poor harvesting evoke abundance before
technique/ • Stringent product • Lack of effective • Package sizes too shopping
inadequate specifications cold-chain large • Portion sizes too
equipment management large • Lack of cooking
• Human or • Failure in knowledge
• Lack of access mechanical error • Stringent product demand • Failure in
to market or resulting in defects specifications forecasting demand • Confusion over
processing forecasting date labels
facilities • Poor • Too many
transportation products offered • Too many • Inadequate
• Poor access infrastructure products offered or improper
to farming • Lack of system storage of food
equipment • Failure in for food • Lack of system
demand donation for food • Desire for
• Price volatility forecasting donation variety,
resulting
• Stringent product • Ineffective • Improper training in uneaten
specifications packaging of food preparers leftovers
or storage
• Overproduction conditions • Overcooking
• Improper storage
Source: FLW Protocol 2016a, CEC 2017.
Commission for Environmental Cooperation 21In this example, simply knowing that a large amount reduction consultant may be beneficial. Numerous firms
of tomatoes was being discarded was not sufficient to make detailed sustainability audits of facilities and
determine the correct course of action to reduce waste. organizations to address root causes of inefficiencies
However, once the tomato FLW was linked to a cause (e.g., and unsustainable practices.
spoilage after not being used) and an underlying driver
(e.g., failure of demand forecasting), the restaurant was
INCORPORATING CAUSES
now able to take action to reduce the FLW (e.g., reduce the
INTO FLW QUANTIFICATION
weekly order for tomatoes or adjust the menu to remove
the dish not being ordered).
METHODS
The methods described in this guide differ in how well they
In more complicated cases, the causes and drivers track the causes and drivers of FLW. Table 6 provides a list
may not be clear. Meeting with an outside waste- of methods, whether they can track causes and how to best
do so.
Table 6. Tracking Causes by Method
Method Can it track How to track causes with the method
causes?
Direct weighing Yes Although direct weighing provides only numerical data, staff can be
instructed to log causes while weighing the FLW. This will provide an
additional data point about how the FLW occurred.
Waste composition No A waste composition analysis will not directly provide information
analysis on causes of FLW, since the waste is being analyzed after it has been
discarded. For this reason, waste composition analyses are often paired
with a survey or process diary to generate qualitative data on causes and
drivers assessed in tandem with the waste analysis.
Records Not usually Because records are kept for purposes other than FLW quantification, they
are less likely to contain information relating to FLW causes and drivers.
However, some records will have information that can help identify causes.
(For example, a repair record for a piece of faulty equipment may help
identify a cause of food waste.) Usually, a diary or survey will need to be
implemented to generate qualitative data.
Diaries Yes A diary can be used to determine causes and drivers of FLW. The diarist
can be asked to provide information on why the FLW occurred while
recording it.
Interviews/Surveys Yes A survey can be used to determine causes and drivers of FLW. The
respondent can be asked to provide information about why FLW occurs
within those boundaries.
Proxy data/mass No Because inference by calculation is a mathematical operation based
balance on material flows and proxy data, it will not provide information about
causes and drivers of FLW. It provides only a quantitative estimate of the
amount of FLW occurring within a given sector or commodity type. An
additional analysis of the relevant sector or commodity will be necessary
Source: Authors. to understand the causes of FLW.
22 Why and How to Measure Food Loss and Waste: A Practical GuideHOW TO TRACK
CAUSES AND DRIVERS
Causes and drivers can be tracked simply by capturing
information on causes while numerical estimates of FLW
are being logged. In most cases, only the immediate cause
will be available at first and additional research may be
needed to detect the driver. Table 7 shows an example
of how causes and drivers can be tracked alongside
numerical estimates of FLW.
Table 7. Tracking Causes and Drivers
Food Type Amount Stage of the Cause Driver
Supply Chain
Wheat 1000 kg Primary production Eaten by pests Improper storage on the farm
Apples 10 kg Processing Trimmings Inefficient equipment trims more
than necessary
Strawberries 40 kg Distribution and Spoilage / Damage Lack of effective cold-chain
wholesale during transport management / Improper packaging /
Excessive centralization of
distribution processes
Beef 100 kg Retail Spoilage Improper refrigeration
Fish 34 kg Food service/ Spoilage Failure in demand forecasting
institution
Milk 500 g Household Past sell-by date Confusion over meaning of date
(but not spoiled) labels
Note: the information in this table is illustrative.
Source: Authors.
Commission for Environmental Cooperation 23Selecting Key Performance
Indicators and Identifying Impacts
Measuring FLW should go beyond simply measuring the organizations can find out if they are achieving FLW
amount of food that leaves the food supply chain. This prevention, redistribution or diversion. These metrics can
measurement fails to capture the impacts and benefits also evaluate progress and tailor future interventions.
of reducing and preventing FLW. Preventing FLW has far- Possible impacts fall into three broad categories:
reaching economic, environmental and social benefits that
• Financial impacts
can also be tracked.
• Social impacts
WHICH IMPACTS • Environmental impacts
SHOULD I TRACK? Organizations can monitor progress (and communicate
success) more effectively if they use a range of appropriate
Key performance indicators can determine an
metrics and consider reporting results in
organization’s success in achieving an objective or
all three categories.
evaluating activities. Using a well-chosen suite of metrics,
24 Why and How to Measure Food Loss and Waste: A Practical GuideFINANCIAL IMPACTS Nutritional Content of FLW
Most of the financial impacts of FLW are associated The nutritional content of FLW can be assessed in
with disposal, however the total cost of FLW includes several ways, including calories, macronutrients
all resource inputs wasted along with the food. Simply (i.e., carbohydrates, fat and protein), fiber and other
focusing on disposal costs overlooks the vast majority micronutrients. The most comprehensive database of food
of financial opportunities and benefits of preventing types and their associated nutrients is the USDA’s National
FLW. Quantifying the costs of FLW might typically involve Nutrient Database for Standard Reference, which contains
assessing the following items: information on 8,100 food items and 146 components,
including vitamins, minerals, amino acids and more (USDA
• The purchasing costs of the incoming food and/or n.d.). By sorting FLW by food type and multiplying the
ingredients amount of FLW by the nutrient of interest in the database,
• The costs added to the food within the business (e.g.,
you can estimate the nutritional content of the FLW.
relating to labor and utilities)
Meals Wasted
• The costs associated with redistribution of surplus food
or the disposal and treatment of FLW Expressing FLW in terms of meals wasted can show laypeo-
Financial impacts that can be tracked alongside FLW data ple the impacts of FLW. Meals are generally expressed as
include the following examples: a number of calories, usually 600–700.6 To determine the
number of meals wasted, first determine the total caloric
• The value of the food that was lost or wasted content of the waste using the USDA National Nutrient Da-
• The cost of FLW as a percentage of food sales
tabase for Standard Reference, then divide that number by
the calories in a typical meal. This will provide a total num-
• The cost and benefits of investment in a food-waste-
ber of meals, although it should be specified that these
reduction program
are not necessarily healthy or complete meals. Calories are
just one measure of nutrition and depending on the type
Two direct measurement tools can capture the weight of
of FLW, meals may not be the best measure.
FLW and translate it into dollar values: smart scales in the
food service sector (e.g., LeanPath or Winnow tools) and
ENVIRONMENTAL IMPACTS
the Provision Coalition’s Food Loss and Waste Toolkit for
Food production and all its associated processes (including
manufacturers.
processing, manufacturing, packaging, distribution,
SOCIAL IMPACTS refrigeration and cooking) require resources, such as
arable and pasture land, fresh water, fuel and chemical
Social impacts refer to the effects of FLW on humans.
inputs (e.g., fertilizer, herbicides and pesticides) and
Examples of trackable social impacts are the value of the
cause environmental impacts, such as air and water
donated food, the nutritional content and meals wasted.
pollution, soil erosion, emissions of greenhouse gases
and biodiversity loss.
Donation Amount
A company may wish to track the amount of food it Depending on its management, FLW can cause additional
donates to food banks and other nonprofits. Records of environmental impacts that would not have occurred had
these donations are usually kept and just need to be the food been consumed. Some of these are associated
collated. If a company does not maintain records, food with transportation of waste, land uses for landfills and
banks may record how much food they have received from methane emissions from landfills. While less important
each company. than impacts associated with production, these impacts
can still be significant.
6) There is no correct number of calories to consume per day (since proper intake depends on energy expenditure), but several health organizations suggest
2,000 calories per day for an adult as a reasonable average. Therefore, assuming three meals a day, the average meal would be 600–700 calories.
Commission for Environmental Cooperation 25You can also read