Research & Development White Paper - WHP 393 The energy footprint of BBC radio services: now and in the future
←
→
Page content transcription
If your browser does not render page correctly, please read the page content below
Research & Development

                      White Paper

                                 WHP 393

                               October 2020

The energy footprint of BBC radio services:
                     now and in the future

     Chloe Fletcher and Jigna Chandaria

     BRITISH BROADCASTING CORPORATION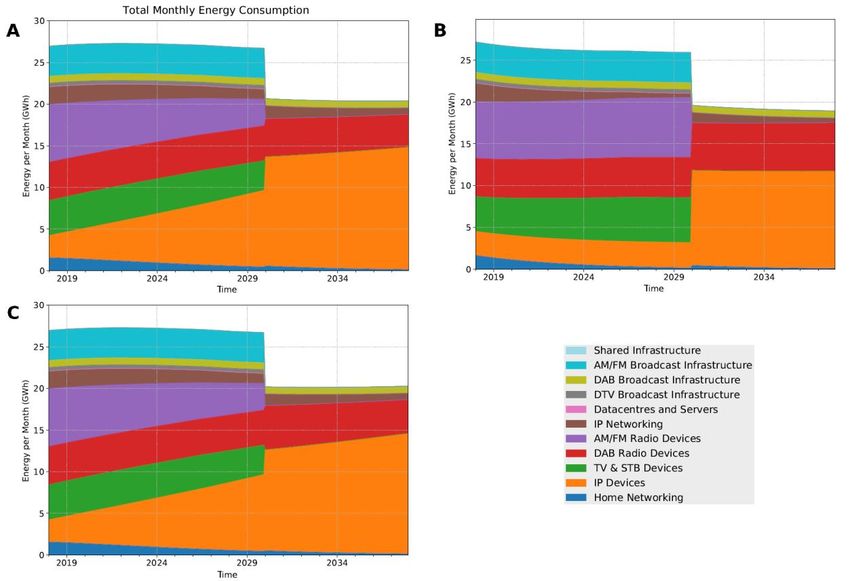
BBC Research & Development
                             White Paper WHP 393

    The energy footprint of BBC radio services: now and in the future

                       Chloe Fletcher and Jigna Chandaria

Abstract
 There are various studies investigating the energy footprint of digital technology and
 services, including streaming, broadcast television, telecommunications and
 consumer electronic devices. However, there are currently no complete studies
 estimating the electricity consumption of radio broadcast and listening. This paper
 presents our approach to modelling the energy required to prepare, distribute and
 consume BBC radio services, exploring both the current usage and how this may
 change over 20 years under a variety of scenarios. Our methodology applies the
 principles of lifecycle assessment to evaluate the energy intensity of each radio
 delivery platform and highlight key ‘hotspots’ within the end-to-end radio chain.

 We show the total mean energy consumption for our 2018 baseline to be 325 GWh,
 equivalent to 0.1% of UK electricity use. Per device-hour, we determine DAB to be
 the least energy-intensive platform (9.3 Wh/device-hour) and DTV radio services to
 be the most (80.6 Wh/device-hour). Of all future scenarios modelled, we estimate
 that switching off AM, FM and DTV radio services, and retaining DAB and IP, leads to
 the largest energy saving – almost twice as much as moving to IP-only distribution.
 We show consumer devices to be the dominant driver of energy use, comprising
 73.4%-81.0% of the total energy across our baseline and scenario results. We identify
 smart speaker and radio set standby power to be the key parameters impacting
 energy. As a result, we simulate the removal of smart speaker and radio set standby
 power from 2021 in our model which leads to a mean energy reduction of 38.3%
 across scenarios. This demonstrates the value of reducing standby power through
 regulation, manufacturers and audience education. Moreover, we highlight the
 importance of sustainable decision-making when choosing devices to access radio.

Additional key words: Sustainability, Radio, Distribution, IP Distribution,
Internet, Energy Intensity, Environmental Impact, Lifecycle Assessment
BBC Research & Development
                                                              White Paper WHP 393

                     The energy footprint of BBC radio services: now and in the future

                                                      Chloe Fletcher and Jigna Chandaria

Contents

List of Figures .........................................................................................................................................................
List of Tables ..........................................................................................................................................................
Abbreviations .........................................................................................................................................................
1 Introduction ..................................................................................................................................................... 1
      1.1 Background .............................................................................................................................................................. 1
      1.2 Research Objectives .............................................................................................................................................. 2
      1.3 Scope .......................................................................................................................................................................... 3
             1.3.1 Baseline ......................................................................................................................................................... 3
             1.3.2 Scenarios ....................................................................................................................................................... 3
2 Literature Review............................................................................................................................................ 3
3 Methods............................................................................................................................................................. 7
      3.1 Radio System Overview ........................................................................................................................................ 7
             3.1.1 Preparation .................................................................................................................................................. 7
             3.1.2 Distribution .................................................................................................................................................. 8
             3.1.3 Consumption ............................................................................................................................................... 8
      3.2 Data Acquisition and Modelling ......................................................................................................................... 9
             3.2.1 Playout Infrastructure .............................................................................................................................. 9
             3.2.2 Audio Encoding and Multiplexing ......................................................................................................... 9
             3.2.3 Broadcast Infrastructure .......................................................................................................................... 9
             3.2.4 Internet Distribution ............................................................................................................................... 10
             3.2.5 Consumer Devices ................................................................................................................................... 11
             3.2.6 Home Networking Equipment .............................................................................................................. 12
      3.3 Uncertainty and Sensitivity Analysis ............................................................................................................... 13
4 Results ............................................................................................................................................................ 13
      4.1 Results: Baseline .................................................................................................................................................. 13
      4.2 Sensitivity Analysis: Baseline ............................................................................................................................ 17
      4.3 Results: Scenarios ................................................................................................................................................. 17
             4.3.1 Scenario 0: Business As Usual ............................................................................................................... 18
             4.3.2 Scenario 1: Digital Only ........................................................................................................................... 18
             4.3.3 Scenario 2: DAB/IP Only ......................................................................................................................... 19
             4.3.4 Scenario 3: IP Only ................................................................................................................................... 20
             4.3.5 Summary ..................................................................................................................................................... 20
4.4 Sensitivity Analysis: Scenarios ......................................................................................................................... 21
4.4.1 Device Popularity ..................................................................................................................................... 21
4.4.2 Listening Hours ......................................................................................................................................... 24
4.4.3 Radio Device Power Figures .................................................................................................................. 24
4.4.3.1 Standby Power Intervention ................................................................................................. 24
5 Discussion ...................................................................................................................................................... 25
6 Conclusion ..................................................................................................................................................... 29
7 Acknowledgements .................................................................................................................................... 30
References ........................................................................................................................................................... 31
Appendices .......................................................................................................................................................... 35
Appendix A ...................................................................................................................................................... 35
Appendix B ...................................................................................................................................................... 37
Appendix C ...................................................................................................................................................... 38List of Figures
Figure 1: System map of the end-to-end BBC radio chain from production to consumption
Figure 2: Estimated energy used to prepare, distribute and consume BBC radio in 2018 per platform and in total
Figure 3: Estimated energy for BBC radio in 2018 by preparation, distribution and consumption
Figure 4: Estimated energy for BBC radio in 2018 by preparation, distribution and consumption for each platform:
a) AM, b) FM, c) DAB, d) DTV and e) IP
Figure 5: Mean number of unique listening hours for BBC radio in 2018 per platform per month
Figure 6: Estimated energy per device-hour to prepare, distribute and consume BBC radio in 2018 per platform
Figure 7: Estimated energy per month to prepare, distribute and consume BBC radio from 2018 to 2037 under
BAU
Figure 8: Estimated energy per month to prepare, distribute and consume BBC radio from 2018 to 2037 for
Scenario 1
Figure 9: Estimated energy per month to prepare, distribute and consume BBC radio from 2018 to 2037 for
Scenario 2
Figure 10: Estimated energy per month to prepare, distribute and consume BBC radio from 2018 to 2037 for
Scenario 3
Figure 11: Estimated mean annual energy saving for each scenario compared to BAU from switch-off to 2037
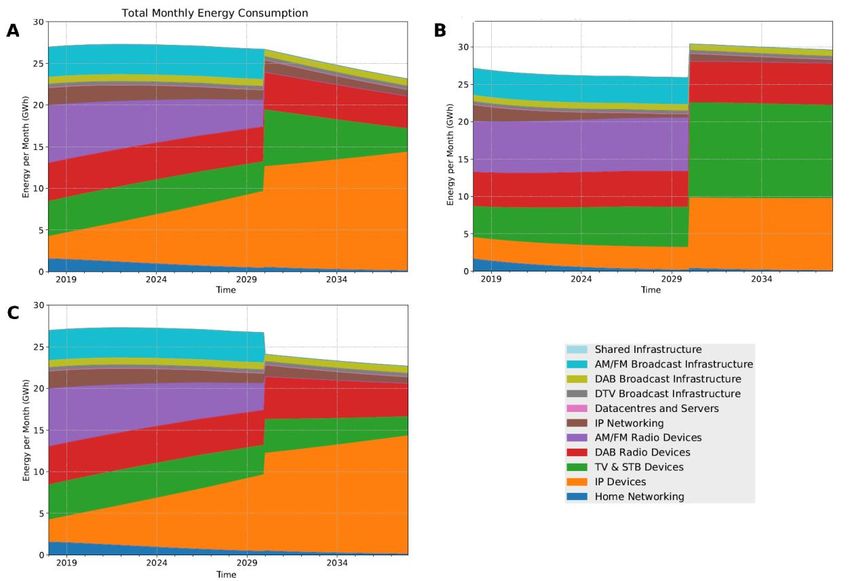
Figure 12: Comparative energy per month of BBC radio from 2018 to 2037 for Configurations A, B and C for
Scenario 1
Figure 13: Comparative energy per month of BBC radio from 2018 to 2037 for Configurations A, B and C for
Scenario 2
Figure 14: Comparative energy per month of BBC radio from 2018 to 2037 for Configurations A, B and C for
Scenario 3
Figure 15: Estimated mean annual energy saving for each scenario configuration compared to BAU from switch-off
List of Tables
Table 1: Top five components with the highest energy consumption in the BBC radio system for 2018
Table 2: Estimated energy and proportional share per platform for BBC radio in 2018 if on and standby power of
radio sets and smart speakers were adjusted by 50% from the baseline
Table 3: Different configurations used to model device popularity across scenarios for sensitivity analysis
Table 4: Estimated energy difference across all scenarios if listening hours were to increase or decrease by 50% by
2038
Table 5: Estimated energy difference across all scenarios if on and standby power of radio sets and smart speakers
were adjusted by 50%
Table 6: Estimated energy difference across all scenarios if standby power of devices were set to zero from 2021
Table 7: Radio devices used to measure power consumptionAbbreviations ADSL Asymmetric Digital Subscriber Line AM Amplitude Modulation AWS Amazon Web Services BARB Broadcasters Audience Research Board BAU Business As Usual BEIS Department for Business, Energy and Industrial Strategy CAGR Compound Annual Growth Rate CCM Centralised Coding and Multiplexing CDN Content Delivery Network CO2e CO2-equivalent CPE Customer Premise Equipment DAB Digital Audio Broadcasting DCMS Department for Digital, Culture, Media and Sport Defra Department for Environmental, Food and Rural Affairs DSO Digital Switchover DTT Digital Terrestrial Television DTV Digital Television E&M Entertainment and Media FM Frequency Modulation FTTC Fibre to the Cabinet FTTP Fibre to the Premises GHG Greenhouse Gas HTTP Hypertext Transfer Protocol ICT Information and Communication Technology IEC International Electrotechnical Commission IP Internet Protocol ISP Internet Service Provider IPCC Intergovernmental Panel on Climate Change LCA Lifecycle Assessment LW Long-wave (radio) MIDAS Measurement of Internet Delivered Audio Services MW Medium-wave (radio) NICAM Near Instantaneous Companded Audio Multiplex ONS Office for National Statistics PVR Personal Video Recorder R&D Research and Development RAJAR Radio Joint Audience Research RDS Radio Data System STB Set-top Box
White Papers are distributed freely on request.
                            Authorisation of the R&D Section Head or Head of
                                 Standards is required for publication.

© BBC 2020. All rights reserved. Except as provided below, no part of this document may be reproduced in any
material form (including photocopying or storing it in any medium by electronic means) without the prior written
permission of BBC except in accordance with the provisions of the (UK) Copyright, Designs and Patents Act 1988.

The BBC grants permission to individuals and organisations to make copies of the entire document (including this
copyright notice) for their own internal use. No copies of this document may be published, distributed or made
available to third parties whether by paper, electronic or other means without the BBC's prior written permission.
Where necessary, third parties should be directed to the relevant page on BBC's website at
http://www.bbc.co.uk/rd/pubs/whp for a copy of this document.
BBC Research & Development
White Paper WHP 393
The energy footprint of BBC radio services: now and in the future
Chloe Fletcher and Jigna Chandaria
1. Introduction
1.1. Background
Anthropogenic climate change conceivably poses the greatest threat to humanity, and is driven
primarily by fossil fuel combustion and industrial processes (IPCC, 2014). The ratification of the
Paris Agreement – since the United Nations Conference of the Parties (COP21) in 2015 – has
emphasised the importance of ensuring mean global temperature rise does not exceed 1.5°C
above pre-industrial levels (United Nations, 2015). In 2020, human activities were estimated to
have caused an average increase of 1.0°C since c.1880, two-thirds of which have occurred over
the last 45 years (NASA, 2020). To date, nine of the 10 warmest years on record have taken place
since 2005 (Lindsey & Dahlman, 2020). This trend of global heating is posited to continue at an
exponential rate if solid interventions are not made.
Energy generation and industry account for approximately 56% of greenhouse gas (GHG)
emissions; therefore, effective reduction, mitigation and adaptation strategies must be
implemented across all public and private sectors for this 1.5°C objective to be met (IPCC, 2014).
It has been estimated that, by 2020, the Information and Communication Technology (ICT) and
Entertainment and Media (E&M) sectors may account for up to 1.9% and 2.0% of global CO 2-
equivalent (CO2e) emissions, respectively (Malmodin et al., 2013). Whilst these footprints appear
small, they are comparable to that of the global aviation sector (ATAG, 2020) and, in an
increasingly data-driven world, are susceptible to rapid growth in the absence of efficiencies and
decarbonisation.
The BBC “Greener Broadcasting” strategy is committed to reducing BBC carbon emissions by
24% and energy consumption by 10% between 2015 and 2022 (BBC, 2018). Although targets
primarily focus on emissions the BBC has direct control over, such as those from on-site
generators and company vehicles, and indirectly from the electricity purchased and consumed
across its sites, it is also important for the BBC to consider its wider footprint. As the UK’s largest
public service broadcaster, the BBC has audiences in the order of millions for its core services –
television, radio and online. The preparation, distribution and consumption of these services,
particularly when scaled up by vast audiences, have an inevitable impact on the environment. In
2016, it was estimated that the BBC’s television services alone accounted for 0.6% of UK
electricity used that year, equivalent to 0.2% of CO 2e emissions (Schien et al., 2020). At present,
there is limited research looking into the energy impact of radio.
BBC radio is an integral service consumed, on average, by 35.6 million people per week in the UK
(MIDAS, 2018). At present, there are 62 network, nations and local BBC radio stations available
across a multitude of delivery platforms – AM (amplitude modulation) services on long-wave (LW)
1and medium-wave (MW); FM (frequency modulation) services; DAB (digital audio broadcasting);
DTV (digital television) including terrestrial, satellite and cable; and IP (Internet Protocol)
streaming services like BBC Sounds and Spotify.
Network radio stations are available at scale with coverage across the majority of the UK. There
are 11 domestic network channels – BBC Radio 1, BBC Radio 1Xtra, BBC Radio 2, BBC Radio 3,
BBC Radio 4, BBC Radio 4 LW, BBC Radio 4 Extra, BBC Radio 5 Live, BBC Radio 5 Live Sports
Extra, BBC Radio 6 Music, BBC Asian Network – and one international network station, BBC
World Service. There are nine stations available within the three devolved nations: Wales (BBC
Radio Wales, BBC Radio Cymru, BBC Radio Cymru 2), Scotland (BBC Radio Scotland, BBC Radio
nan Gàidheal, BBC Radio Orkney, BBC Radio Shetland), and Northern Ireland (BBC Radio Ulster,
BBC Radio Foyle), known as nations radio channels. Local radio stations, which represent counties
across England and the Channel Islands, are available locally and within the surrounding region.
There are a vast range of devices capable of accessing these radio services in the home, in-car and
outside such as radio receivers, TVs, set-top boxes (STBs), smart speakers and portable devices.
In 2012, the UK completed its TV digital switchover (DSO) where analogue terrestrial television
was replaced by digital terrestrial television (DTT). Subsequently, the Department for Digital,
Culture, Media and Sport (DCMS) conducted a review to evaluate the economic, infrastructural
and environmental effects a radio DSO could have on the UK (DCMS, 2013). It was concluded that
a radio DSO would most likely have an overall negative impact if implemented before 2020 due
to insufficient DAB coverage and the costs associated with replacing analogue technology.
According to the UK Government’s Digital Radio Action Plan (DCMS, 2014), the criteria required
for reconsideration of a radio DSO were for: (i) 50% of radio consumption to occur via digital
platforms, and (ii) national DAB coverage to be comparable to FM. These criteria were met in
2018 therefore a review is now underway.
Separate to government policy, the BBC and other media organisations have been investigating
the feasibility of migrating television and radio services to IP-only distribution. The
implementation of either a radio DSO or IP-only services would have notable environmental
impacts due to changes in infrastructure, data traffic and user behaviour; however, these are yet
to be quantified. It is important that the environmental impacts of these core services are
understood to provide a benchmark for which future consumption can be measured against, aid
decision-making in emissions reduction efforts, and embed sustainability into relevant
architectural design processes.
1.2. Research Objectives
The objectives of this study are:
- to quantify the total energy required to prepare, distribute and consume BBC radio
services for the baseline year of 2018;
- to establish the energy used by each radio delivery platform for the 2018 baseline year;
- to model how the energy consumption of BBC radio may change under various future
scenarios (as outlined in Section 1.3.2) over 20 years, from 2018 to 2037; and
- to identify the largest drivers of electricity use within the end-to-end radio chain, both
now and in the future.
21.3. Scope
This study explores the energy required to prepare, distribute and consume BBC radio services.
Radio is defined in this study as live broadcasting, podcasts and ‘listen again’ (also known as
‘catch-up’) services. For live and listen again radio outputs, only network radio has been modelled
to reduce system complexity. Solely infrastructure and listening within the UK have been
investigated. With approximately 35% of radio consumed outside of the home (MIDAS, 2018),
both domestic and non-domestic consumption have been considered, including listening in the
home, in vehicle (e.g. car or lorry), at a place of work or study, on public transport, walking or
elsewhere.
Neither music production nor radio production have been considered in this study. It has also
been assumed that the infrastructure required to provide radio services has already been
established, meaning the energy associated with manufacturing, transportation and installation
of equipment has not been included. Furthermore, the energy associated with equipment disposal
has been excluded. Lastly, the independent recording of radio onto a CD, tape, personal video
recorder (PVR) or otherwise was assumed to be minimal and has therefore been not considered.
1.3.1. Baseline
The baseline reference period used to quantify the energy of preparing, distributing and
consuming BBC radio services was the year 2018, from 1st January to 31st December. Metrics
used to evaluate energy performance for this reference period were total system energy, total
energy per delivery platform, and total energy per platform per device-hour.
1.3.2. Scenarios
The scenarios selected for consideration within this study were:
- Scenario 0: Business as Usual – All platforms retained
- Scenario 1: Digital Only – Switch off LW, MW and FM from 2030
- Scenario 2: DAB/IP Only – Switch off LW, MW, FM and DTV radio from 2030
- Scenario 3: IP Only – Switch off LW, MW, FM, DTV radio and DAB from 2030
It is important to note that these scenarios are for illustrative purposes, and do not represent the
intentions of the BBC.
The scenario reference period of 20 years – from 1st January 2018 to 31st December 2037 – was
used, with switch-off occurring immediately on 1st January of the stated year. Metrics used to
evaluate energy performance for this reference period were total system energy and mean
monthly energy.
2. Literature Review
In Malmodin & Lundén (2018), the ICT sector is characterised as the intersection of information
technology and telecommunications, encompassing a range of infrastructure and devices such as
computers, phones and tablets; modems and routers; datacentres; and broadband, telephony and
cellular networks. Similarly, the E&M sector is the union of the entertainment and media sectors,
which includes TVs, peripherals and networks; other consumer electronic devices; content
production; and paper media.
3The research of Malmodin & Lundén (2018) quantified the global energy and carbon footprints of
the ICT and E&M sectors between 2010 and 2015. It was deduced that ICT accounted for 3.8% of
global electricity in 20151, with the largest contributor – user devices – responsible for
approximately 45% of energy use. The E&M sector consumed 2.8% of global electricity in 2015 1,
two-thirds of which were attributed to TVs, STBs and broadcast networks. The CO 2e emissions for
the ICT and E&M sectors were calculated to be approximately 1.5% and 1.2% 2 of global
emissions, respectively, with the latter reducing to 0.8% if paper media were excluded. TVs were
shown to have the largest carbon footprint of all user devices – vastly higher than that of
smartphones, which were almost twice as prevalent in the global population.
It is important to note that the carbon footprints in Malmodin & Lundén (2018) were calculated
using a full lifecycle approach, whereas energy footprints only included operational and use-
phase consumption. Lifecycle assessment (LCA) is a methodology used to evaluate the
environmental effects of products or services at every stage of its lifetime, including raw material
acquisition, manufacturing, distribution, use and waste management. In Malmodin & Lundén
(2018), the embodied energy from mining, manufacturing, transportation and waste were not
included. As a result, the energy footprints of these sectors were not fully realised. Malmodin et
al. (2018) provide a more detailed analysis of the material and carbon footprints for the mining
and end-of-life stages of the ICT and E&M sectors, but, due to a lack of publicly available data,
this research still omits a comprehensive overview of energy use.
Results from Malmodin & Lundén (2018) concluded that global energy consumption for both the
ICT and E&M sectors peaked between 2010 and 2015, and has demonstrated subsequent decline
despite increases in data traffic. This is consistent with a similar study of ICT and E&M for
Sweden, conducted by the same authors, which determined a peak in electricity consumption
around 2010 (Malmodin & Lundén, 2016). The sectorial reductions in energy consumption
globally from 2010 to 2015 were shown to be primarily attributed to the increased efficiency of
TVs, STBs and broadcast networks as well as other user devices. Fixed and mobile networks
demonstrated an increase in total energy by 30.8% in 2015, relative to 2010. This was
significantly lower than the estimated compound annual growth rate (CAGR) of 29.0% for
Internet data traffic (Cisco, 2012), which, from 2010 to 2015, could have theoretically led to a
257.2% increase in energy use in absence of efficiency improvements.
Aslan et al. (2018) conducted a review of 14 studies to establish a trend in the electricity intensity
of Internet data transmission – in kilowatt-hours per gigabyte (kWh/GB) – over time. The studies
under consideration covered a variety of system boundaries, methodologies, reference years and
locations. Estimates of electricity intensity varied by up to 105, with the highest estimate being
136 kWh/GB in 2000 (Koomey et al., 2004) and the lowest 0.004 kWh/GB in 2008 (Baliga et al.,
2009). To ensure studies were comparable, Aslan et al. (2018) recalculated estimates after
applying a common system boundary and deriving averages from eight different configurations.
After computing new estimates in line with this common framework, differences of up to three
orders of magnitude were observed. Moore’s Law implies that electricity intensity values should
approximately halve every two years due to efficiency gains. With estimates spread over 15 years,
Moore’s Law would imply differences of up to two orders of magnitude, indicating disparities
_________________
1
Calculated using Statistica record of global electricity consumption in 2015
2
Calculated using The World Bank data for CO2, methane, nitrous oxide and HFC gas emissions in 2014
4between values. As a result, the authors undertook a critical analysis to determine which studies
satisfied a minimum set of criteria, of which five of them met (Koomey et al., 2004; Taylor &
Koomey, 2008; Malmodin et al., 2014; Krug et al., 2014; Malmodin & Lundén, 2016). An additional
sixth estimate was deduced from updated data applied to the methodology in Krug et al. (2014).
These six estimates exhibited consistency with Moore’s Law, with a coefficient of determination
(R2) equal to 0.98.
However, it is unlikely for electrical efficiency to improve in line with Moore’s law indefinitely.
Andrae & Edler (2015) presented estimates of the global energy use for communication
technology – including the production and use of devices, networks and datacentres – from 2010
to 2030. Their work considered three scenarios – the best, expected and worst cases. For each
scenario, the annual electrical efficiency improvement from 2022 onwards was set to the worst-
case value of 5% per year. Estimates for the proportion of global energy attributed to
communication technology were highly disparate across scenarios. In 2020, the best, expected
and worst cases were estimated to be 6%, 11% and 21%, respectively; these further diverged to
8%, 21% and 51% by 2030. Despite the authors concluding that the worst-case scenario was
“dramatic”, and that the most likely outcome would be between the best and expected-case
scenarios, significant attention has been drawn to the 51% figure for 2030. This was the focal
point of the paper’s abstract, along with its associated 23% share of global GHG emissions.
The Shift Project (2019a) adopted the methodology presented in Andrae & Edler (2015) to
determine the environmental impact of digital technologies, using estimates between the
expected and worst-case scenarios as the closest approximation to real-world values. It was
concluded that online video streaming produced over 300 MtCO2e emissions in 2018, stated to
be equivalent to the annual CO2e emissions of Spain (The Shift Project, 2019b). This widely
shared study suggested that an hour of streaming generated approximately 3.20 kgCO2e
emissions, despite only including portable devices such as smartphones and laptops within their
scope. This grossly overestimated emissions compared to congruent studies. For example,
analysis conducted by the Carbon Brief (2020) across a range of user devices – primarily TV sets –
determined the emissions from streaming video on Netflix to be between 0.056 and 0.114
kgCO2e per hour. Chandaria et al. (2011) estimated the carbon footprint of video-on-demand via
BBC iPlayer to be between 0.030 and 0.086 kgCO2e per viewer-hour. Similarly, a more recent
study investigating the footprint of BBC television services via IP distribution in 2016 estimated
emissions to be approximately 0.078 kgCO2e per viewer-hour (Schien et al., 2020). Both BBC-
focused studies included a large range of consumer devices – primarily TVs and STBs, which
typically require higher amounts of power than the portable devices considered by the Shift
Project. Preist et al. (2019) estimated the carbon footprint of YouTube video streaming in 2016
based on publicly available data. The design of this study was the most comparable to the Shift
Project research as phones, laptops and computers comprised 84% of user devices; however,
their estimate of 0.028 kgCO2e per viewer-hour was two orders of magnitude lower.
Differences in the proportion of carbon within the UK energy mix between years would account
for some variation in results, but these would be marginal. The average bitrate of 24 Mbps used
by the Shift Project was considered to be six times larger than the global average bitrate for
Netflix (Carbon Brief, 2020). In Schien et al. (2020), the mean bitrates for BBC iPlayer on
smartphones and laptops were estimated to be 1.8 Mbps and 3.5 Mbps and thus, respectively, a
thirteenth and seventh of the estimates used by the Shift Project. Furthermore, the energy
5intensity of datacentres, content delivery networks (CDNs) and data transmission networks were
found to be approximately 6 to 18 times higher than that claimed in other literature (Carbon
Brief, 2020). The adoption of methodologies in line with the expected and worst-case scenarios
from Andrae & Edler (2015) also led to inaccurate emissions estimates. Andrae (2019) has
subsequently published a paper acknowledging that the real-world trends in global energy use of
communication technology have been more in line with the best-case scenario, and are projected
to do so until at least 2023.
Despite vast overestimations in most system components, the Shift Project study considerably
underestimated the energy associated with consumer devices by a factor of 4 to 7 (Carbon Brief,
2020. This is likely due to the omission of high-powered devices, such as TVs and STBs. The Shift
Project (2019b) concluded that consumer devices comprised the smallest amount of energy
across the end-to-end IP distribution chain; however, this conclusion is contested by multiple
studies. Schien et al. (2013) conducted an analysis of the emissions produced by Guardian News &
Media Limited in the distribution and consumption of their digital media services in 2012, in which
it was deduced that consumer devices were responsible for 75% of emissions. Similarly, in
Chandaria et al. (2011), user equipment for the consumption of BBC television services via DTT on
a TV set and via IP on a desktop computer accounted for 76% and 78% of emissions, respectively.
It was however noted that when IP-delivered services were consumed via a laptop, equipment
constituted only 37% of emissions due to the comparably lower power. In Preist et al. (2019),
where consumption was predominantly via smartphones, laptops and tablets, devices used
approximately 30% of the total system energy. In Schien et al. (2020), user equipment comprised
67% of the overall energy for the consumption of BBC television services over IP. Interestingly,
this was dominated by network customer premise equipment (CPE) – such as modems and
routers – which contributed 72% of energy for equipment compared to 28% for viewing devices.
For the consumption of BBC television via terrestrial, cable and satellite broadcast platforms –
where a TV and STB was the predominant viewing set-up – user equipment respectively
accounted for 97%, 80% and just under 100% of the total energy per platform. High standby
power for STBs was the highest contributor to these results, followed by the on power of TV sets
and STBs. Across all platforms, user equipment accounted for 92% of the total system energy.
With greater prominence given to television and video streaming, limited research has been
conducted on the energy or carbon footprints of radio services. Between 2010 and 2013, the UK
Government Department for Environment, Food and Rural Affairs (Defra) and DCMS jointly
commissioned a three-phased study to determine the power consumption of radio sets (Defra,
2010; Defra, 2011; Defra, 2013). The aim of this research was to monitor the power consumption
of radio devices and inform the impact on energy, were a radio DSO to have been implemented in
2015. A total of 299 devices – including FM, DAB and Internet radio devices – were selected to
represent the market. Significant reductions in mean power were exhibited between Phase 1
(2010) and Phase 3 (2013) across all device types. FM radio sets demonstrated a 26% reduction in
on power, whereas the mean power for FM listening on DAB radio sets decreased by 45%. The
average on power for DAB and Internet radio devices decreased by 46% and 66%, respectively.
Additionally, standby power reduced by 66% across all devices. This study considered only
operational energy associated with consumer devices, specifically radio receivers, and not energy
attributed to the preparation or distribution of radio, or the manufacturing or disposal of
equipment.
63. Methods
This study adopts the approach of Schien et al. (2020) to establish the energy associated with
preparing, distributing and consuming BBC radio services. Our methodology applies the
principles of LCA to calculate energy for the lifecycle distribution and use phases, and to identify
‘hotspots’ within the radio system. Cumulative energy has been determined for the whole system
and per platform and, where appropriate, converted to estimated GHG emissions. Other inputs,
lifecycle stages and outputs have not been considered.
3.1. Radio System Overview
Figure 1 provides a system overview of BBC network radio from production to consumption. This
map represents the flow of data across various delivery methods and consumer devices. Each
component is characterised by its stage in the system: preparation, distribution or consumption.
Figure 1: System map of the end-to-end BBC radio chain from production to consumption
3.1.1. Preparation
Playout for audio content is managed by the dira! digital playout system, which is used across
network, nations and local BBC radio stations for both live and pre-recorded programmes. dira!
handles recording, editing, scheduling and reporting as well as the storage of media and
metadata. Depending on the platform used, the audio is encoded (compressed to reduce bitrate)
and multiplexed (packaged alongside other services to a single stream).
Analogue network radio services are encoded through NICAM (Near Instantaneous Companded
Audio Multiplex) for subsequent distribution via a national network which also carries dynamic
RDS (Radio Data System) – such as station identification, programme type and radio text. For
7DAB and DTV services, encoding and multiplexing are carried out at Centralised Coding and
Multiplexing (CCM) facilities in the UK. The BBC has one national DAB multiplex for network
radio. For radio via DTV, there are three multiplexes which bundle together local, nations and
network radio channels along with television services – two for satellite (DSAT2 and DSAT5) and
one for terrestrial (PSB1), the channels of which vary by location.
3.1.2. Distribution
Distribution for network radio services via LW, MW, FM, DAB and DTT involves relaying the
respective signals to networks of transmitters across the UK. Platforms require different numbers
of transmitters for national coverage. For example, AM radio, which occupies lower frequencies, is
characterised by a small number of transmitters, whereas DAB operates at higher frequencies
and uses a higher number of typically lower-powered transmitters. A transmission site may carry
multiple transmitters for different delivery platforms. These transmitter networks are managed
by a third-party contractor, Arqiva.
Distribution via satellite television requires signals to be sent via earth station uplinks (one main
and one back-up) to one of the broadcast satellites in the Astra 2 constellation, where it is
received by the DSAT2 and DSAT5 transponders. These signals are then rebroadcast to Earth via
downlinks and picked up by CPE (i.e. satellite dishes). For radio services on cable television, this
satellite feed is received and re-multiplexed for distribution over a private fibre-optic network to
street-side cabinets, which is then routed to customers via coaxial cable service drops.
Podcasts, listen again and live radio are also available via Internet distribution. Digital audio input
streams are carried to the BBC Audio Factory for encoding, storage, packaging and transcoding in
the cloud. Cloud infrastructure for the BBC is currently provided by Amazon Web Services (AWS).
The Audio Factory system encodes BBC radio content via three codecs – AAC-LC, HE-AACv1 and
MP3 – at various bitrates (BBC, 2020a). Content is packaged into short (3 to 8 second) chunks and
delivered individually via HTTP streaming protocols – HLS, HDS and MPEG-DASH (BBC, 2020b).
Origin content is stored on a number of servers within BBC datacentres and delivered via Content
Delivery Networks (CDNs). CDNs cache copies of the origin content across the UK so that
requests can be managed locally, thereby minimising latency and network traffic. These CDNs
usually distribute content from edge networks to home equipment via access networks –
dependent on the Internet Service Provider (ISP) – which reach consumer devices over WiFi or a
fixed line. Alternatively, content is distributed from the edge to the consumer device directly
through mobile cellular networks, including 3G, 4G and 5G.
3.1.3. Consumption
Radio listening can take place on a range of consumer devices which vary according to the
preferred delivery platform. Typical radio sets may contain circuitry that decodes AM, FM, DAB or
IP signals, or a combination thereof. These devices range in size, quality and functionality, and can
be powered via different means – including mains electric, rechargeable batteries, dry cells or in-
car. Many listening devices also support connection to external headphones or speakers.
Radio consumption via DTV requires a television set which may be accompanied by a STB or PVR.
These STBs or PVRs decode terrestrial, satellite, cable or Internet signals. For radio listening over
8IP, there are a variety of additional consumer devices available. Among these are smart speakers,
desktop computers, laptops, smartphones and tablets. These devices may receive Internet via
either a wired or WiFi connection, and may require network CPE such as a modem or router, or
access to the cellular network. Network CPE typically receive Internet via either an Asymmetric
Digital Subscriber Line (ADSL), fibre, cable, 4G or 5G connection.
3.2. Data Acquisition and Modelling
3.2.1. Playout Infrastructure
Due to COVID-19, direct measurements of radio playout power usage could not be obtained, as
planned. Therefore, with a lack of available data, a rough estimate was made using the playout
energy calculated in Schien et al. (2020) for BBC television. A scaling factor, dubbed the ratio of
radio to TV bitrate, was multiplied to this figure to give a ballpark estimate for the playout energy
of BBC radio services. This ratio – originally calculated for CCM energy use – was established by
summing distribution bitrates for network radio channels across DSAT2, DSAT5, PSB1 and DAB,
and dividing by the sum of distribution bitrates for TV and radio services across all multiplexes.
Whilst BBC television and radio services have largely different playout infrastructure, the total
power of these system components was small compared to other components. From discussions
with internal experts, it is likely the energy derived in this study is an overestimate and has been
included for a sense of the scale. In future, a clamp meter would be used to measure the power
consumption of relevant playout equipment and provide a more accurate estimate of energy use.
3.2.2. Audio Encoding and Multiplexing
Power attributed to the CCM for DAB, DTT and satellite were calculated individually in the model
and broken down into the number of multiplexes, the number of channels per multiplex, and the
power per channel per multiplex to provide model flexibility. These power values were
aggregated to derive the mean power of CCM, and then multiplied by time to obtain the energy.
To estimate the power per channel per multiplex for each platform, the mean power for each of
the two CCM facilities – which includes lighting, cooling and IT – was obtained internally. Bitrates
were used to estimate the mean power for each multiplex (including those dedicated to
television). A ratio of radio to TV bitrate, tailored to each multiplex, was then used to find the
mean power per multiplex specifically for radio. Lastly, this was divided by the number of
channels per platform.
3.2.3. Broadcast Infrastructure
Energy data for AM, FM, DAB and DTT broadcast infrastructure – used to inform billing – were
made available by Arqiva. These datasets provide per-transmitter granularity of energy
consumption. For each platform, the mean power was calculated and broken down into the
number of channels, the number of transmitters and the mean power per channel per transmitter.
For AM broadcast infrastructure, the mean power of LW and MW were calculated separately and
aggregated to establish the mean power of AM.
To estimate the energy for radio services available on satellite, the mean power for the satellite
uplink was adopted from Schien et al. (2020). In their study, the back-up site was directly
9measured and the main site energy estimated. The ratio of radio to TV bitrate was used to
represent the energy allocation for BBC radio services.
For cable television infrastructure, estimates were based on Virgin Media corporate sustainability
reporting of Scope 2 emissions for 2018 (Virgin Media, 2018). General operational energy was
estimated by multiplying the total number of full-time equivalent (FTE) Virgin Media employees
with an average estimate of 2.3 tCO2e per FTE employee, as used in Schien et al. (2020), and
removed. The 2018 UK carbon factor was then used to approximate energy use (BEIS, 2018). The
ratio of IP to TV services was estimated from the reported number of modems to STBs. The
energy consumption of cable television services was separated out using this proportion, with the
ratio of radio to TV bitrate then used to estimate energy for radio services. Lastly, the proportional
share of BBC radio listening hours was applied to represent the BBC allocation of energy.
Despite likely increases in the efficiency of transmitter and delivery networks over time, all
broadcast infrastructure energy was assumed constant over 20 years. In a scenario where a
platform was switched off, the infrastructure energy associated with that platform was set to zero
from the date of switch-off.
3.2.4. Internet Distribution
Cloud infrastructure was modelled using AWS billing data, which estimates energy usage to be of
the order of 1.0 GWh per year for all BBC streamed media services. The radio allocation was
estimated to be 30%, with a triangular distribution of 15% to 45% to represent uncertainty. This
was presumed to be a cautious overestimate due to a lack of granular data for the total energy
consumption or the proportion dedicated to radio services. For the CDN origin, an estimate for
the proportion of servers dedicated to radio was made by an internal expert. The power
consumption of CDN origin servers was measured in Schien et al. (2020) and adopted in this
research, with the radio proportion applied. Both the cloud and CDN origin infrastructure were
assumed to have a constant power consumption over the 20-year period.
The national IP networking infrastructure was broken down into components – ADSL access,
ADSL backhaul, cable, cellular, CDN, core, fibre access, fibre backhaul and metro. Not all data
passes through each component; the infrastructure required depends upon the network used.
Therefore, we estimated the data traffic through each IP networking component. Data was
categorised as either cellular (for 3G, 4G, 5G and core), non-cellular (for core), cable (for cable),
non-cellular-non-cable (for metro) or all (for ADSL and fibre). Data traffic per network was
estimated by taking the average bitrate per device, categorising data flows as above based on
MIDAS (2018) location analytics, and multiplying by the consumption time.
For cellular, cable, core, metro and CDN, the data traffic was multiplied by the relevant network
energy intensity. For 3G, 4G and 5G, the energy intensities were estimated from Andrae & Edler
(2015), where the expected case scenario was used to quantify the intensity at 2018 and the
average CAGR of -8.7% from 2018 to 2037 (assuming an annual improvement of 22% up to 2022
and 5% thereafter). Cable energy intensity was estimated from corporate reporting (Virgin Media,
2020). Metro, core and CDN energy intensities were adopted from Schien et al. (2020). The shared
CAGR for cable, metro and core networks was estimated to be -7.3% using a combination of Krug
et al. (2014) which estimates an annual improvement of 16% and Andrae & Edler (2015) which
indicates an annual improvement of 5% from 2022.
10The ADSL and fibre access and backhaul networks were calculated by multiplying the average
power per line – adopted from Krug et al. (2014) – with the total number of subscriber lines which
access IP radio per network. The latter was estimated by using the number of UK households
from the Office for National Statistics (ONS), the proportion of radio listening via IP delivery from
MIDAS, and the proportion of ADSL and fibre connections in 2018 from the 2019 Ofcom
Communications Market Report (Ofcom, 2019). Here, fibre includes both fibre to the cabinet
(FTTC) and fibre to the premises (FTTP). The BBC data allocation was estimated by calculating
the total data traffic for BBC radio services and dividing that figure by the total UK data traffic as
quantified by Cisco (2016).
3.2.5. Consumer Devices
The power consumption of TVs, STBs, smartphones, tablets, laptops, and desktop and monitors
were adopted from Schien et al. (2020). For smart speakers, Amazon represented 75% of the UK
market in 2018 (Ofcom, 2018), thus the on power was averaged across four Amazon devices 3,
assuming an equal market share. Each device offers three standby power modes – low power
mode (off), networked standby (microphones on/camera off) and networked standby
(microphones/camera on) – an average was taken across these three standby modes and four
devices, assuming equal use of each mode and device. For radio receivers, classed here as
analogue, DAB and Internet radio sets, the mean on and standby power figures were averaged
from direct measurements. Our methodology is outlined in Appendix A (note: due to COVID-19,
we were unable to measure the power consumption of car radios, as planned). All power values
were assumed constant over 20 years – with the exception of TVs and STBs, which were modelled
in line with Schien et al. (2020). Parameter sensitivities have been explored in Section 4.2 and 4.4.
MIDAS (2018) data was used to estimate the proportion of the UK population who listen to radio
and the average number of listening hours per person per day. Furthermore, MIDAS was used to
establish the proportional share of listening hours per device type in 2018, with future projections
based upon the UK future consumption of audio report (Mediatique, 2019) and extrapolated from
2035. Note, this report is likely to be updated to reflect recent changes in listener behaviour.
However, listening hours are not unique, meaning that MIDAS datasets do not account for
multiple people listening on the same device at the same time. This needs to be taken into
account to ensure device on hours are not incidentally duplicated. Therefore, a shared listening
ratio was determined for each device type using MIDAS (2018) ‘who listened with’ data to
ascertain the unique listening hours per person per platform per day. The BBC share of radio
consumption at 45%, also deduced from MIDAS (2018), was assumed constant over 20 years.
To calculate the energy consumption of smartphones, laptops, desktops and tablets, the unique
listening hours for BBC content per device was multiplied by the device on power, and further
multiplied by the representative population of listeners who access BBC radio via the specific
device. The standby energy associated with these devices was not taken into account in our
estimates. As smartphones, laptops, desktops and tablets generally offer a wide range of non-
audio or radio-related services, we assumed the standby power attributed to radio listening on
these devices to be negligible. Contrarily, radio listening was considered to be a core function for
radio sets, TV sets, STBs and smart speakers; therefore, for these devices, the standby energy was
_________________
3
Amazon Echo (1st Generation), Amazon Echo Show, Amazon Echo (2nd Generation), Amazon Echo Plus
11taken into consideration. For radio sets, standby energy was calculated by subtracting the unique
listening hours per person per day from 24 hours and multiplying by the standby power. This was
similarly multiplied by the representative population, as well as the BBC share of listening at
45%. This however assumes one radio per listener; whereas, MIDAS (2018) estimates
approximately 1.4 radios per listener. Therefore, the estimated standby energy was further
upscaled by 1.4 to account for additional device standby power. Smart speaker standby energy
was similarly calculated, but with an additional parameter for the proportion of smart speaker
energy allocated to radio listening. It was estimated that 90% of energy was attributed to audio
streaming, with MIDAS (2018) data indicating 55% of smart speaker audio streaming to be for
radio. As TV sets and STBs are predominantly used for television services, the ratio of radio to TV
bitrate was applied to represent the radio allocation of device standby energy.
User analytics and device power data for AM and FM radio services are often collected as a single
metric. Therefore, the energy associated with AM and FM consumer devices were modelled as a
single output, ‘analogue radio sets’. To estimate the energy apportioned to each platform
separately, MIDAS (2018) analytics data were used to classify listening hours by network radio
stations, where BBC Radio 5 Live and BBC Asian Network were classed as AM, and BBC Radio 1,
BBC Radio 2 and BBC Radio 3 were classed as FM. BBC Radio 4 and BBC World Service broadcast
on both AM and FM, therefore it was estimated that 10% of listening on these channels were on
AM with a triangular distribution of 5% to 15%.
Peripheral equipment, such as headphones and external speakers, would have an inevitable
impact on device power consumption. However, due to a lack of available data, these impacts are
not in scope. It is also worth noting that radio listening can be a secondary activity on an in-use
device, such as a laptop being used for work purposes. This additional radio listening would have
a small impact on additional power consumption. Therefore, listening as a non-primary activity on
desktops and laptops was identified through MIDAS (2018) ‘activities’ data and the proportional
energy removed.
For our scenarios, some devices were modelled to be redundant after platforms were switched
off, implying that individuals would need to move to other devices to consume radio. Listening
‘location’ data (MIDAS, 2018) was used to predict device migration using matrix multiplication.
3.2.6. Home Networking Equipment
Home networking equipment, such as modems and routers, were assumed to be continuously on.
The on power for cable CPE was obtained from corporate reporting (Virgin Media, 2018), whereas
ADSL, fibre and 4G/5G routers were based upon alternative online sources (ISPreview, 2017;
Genexis, 2016; HUAWEI, 2020). These figures were assumed constant over our 20-year reference
period.
Although both domestic and non-domestic radio consumption have been included, for simplicity,
CPE energy was modelled on a household basis, assuming one router per household. The number
of households per broadband type for 2018 were deduced from Ofcom (2018), with future
projections adopted from Schien et al. (2020). The proportion of households that access radio via
IP devices was determined through MIDAS (2018) data. As CPE is not solely used for radio
consumption, the BBC allocation was estimated by calculating the total data traffic for BBC radio
services (as in Section 3.2.4) and dividing by the total UK data traffic (Cisco, 2016).
123.3. Uncertainty and Sensitivity Analysis
Models are impacted by the accuracy, assumptions and availability of data. Capturing every
intricacy of a system is virtually impossible, making models inherently imperfect. Therefore,
uncertainty and sensitivity analysis have been used to explore the robustness of our results.
In this research, all input variables were represented as distributions to account for parameter
uncertainty. The Monte Carlo method, which randomly selects input values based upon these
distributions, was performed on the whole model over 10,000 simulations. This permits the
evaluation of output uncertainty, represented as a range within which the “true” result may lie.
Sensitivity analysis is the process of changing parameter values or testing alternative
assumptions to evaluate the impact on model outputs. This gives insight into how specific
variables affect results. This methodology is effective when performed on variables with high
uncertainty or high model dependency. The latter can be identified by determining the
components with the highest energy consumption and the parameters which contributed the
most to that result, as shown in Section 4.2 and Section 4.4.
4. Results
4.1. Results: Baseline
Figure 2 presents the estimated energy to prepare, distribute and consume BBC radio in the UK
per delivery platform and in total for the baseline year of 2018. The boxplots display the medians
and interquartile ranges, with flyers representing the spread from the 5th to 95th percentiles.
Shared infrastructure energy was distributed by the unique listening hours per platform.
Figure 2: Estimated energy used to prepare, distribute and consume BBC radio in 2018 per platform and in total
The energy required to prepare, distribute and consume BBC radio services in 2018 was 325 GWh.
This equated to a mean power consumption of 37 MW. Across delivery platforms, the mean
energy for AM was 25 GWh (7.7%), FM was 100 GWh (30.8%), DAB was 65 GWh (20.0%), DTV
was 56 GWh (17.2%) and IP was 79 GWh (24.3%).
13You can also read