COULD A HEARTLAND VISA HELP STRUGGLING REGIONS? - FROM MANAGING DECLINE TO BUILDING THE FUTURE - Economic Innovation Group
←
→
Page content transcription
If your browser does not render page correctly, please read the page content below

APRIL 2019

AUTHORS
Adam Ozimek of Moody’s Analytics with
Kenan Fikri and John Lettieri of EIG

   FROM MANAGING DECLINE TO BUILDING THE FUTURE
COULD A HEARTLAND VISA HELP STRUGGLING REGIONS?

                                        Economic Innovation Group | 1
Table of
                  Contents

                   Key findings                                       3

                   The idea                                           4

                   Introduction                                       5

                   Population loss economics                          7

                   Population loss hurts housing markets              17

                   Population loss erodes local government finances   20

                   Population loss reduces dynamism                   22

                   Could better skilled immigration policy help?      28

                   Place-based visas: A new tool for the heartland?   35

                   Conclusion                                         40

                   Citations                                          41

2 | Economic Innovation Group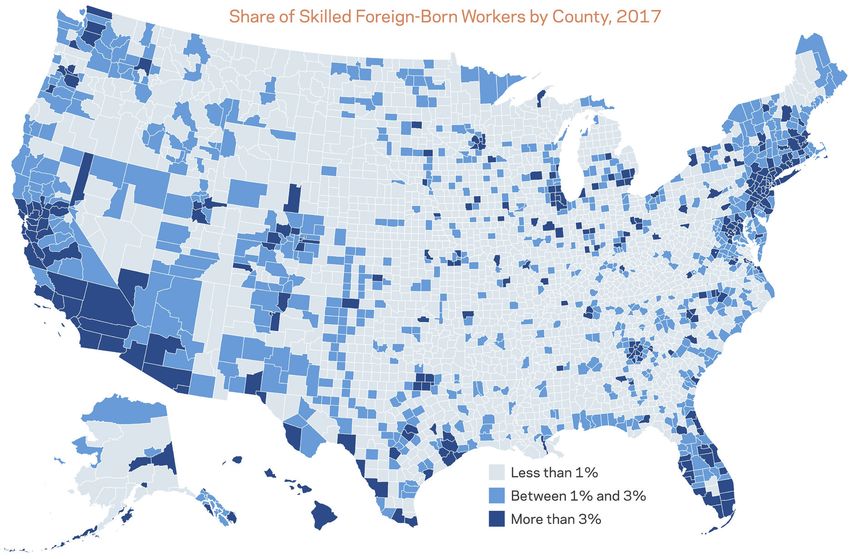
Key findings

•   U.S. population growth has fallen to 80-year lows. The country now adds
    approximately 900,000 fewer people each year than it did in the early 2000s.

•   The last decade marks the first time in the past century that the United States
    has experienced low population growth and low prime working age growth on a
    sustained basis at the same time.

•   Uneven population growth is leaving more places behind. 86% of counties now grow
    more slowly than the nation as a whole, up from 64% in the 1990s.

•   In total, 61 million Americans live in counties with stagnant or shrinking
    populations and 38 million live in the 41% of U.S. counties experiencing rates of
    demographic decline similar to Japan’s.

•   80% of U.S. counties, home to 149 million Americans, lost prime working age adults
    from 2007 to 2017, and 65% will again over the next decade.

•   By 2037, two-thirds of U.S. counties will contain fewer prime working age adults than
    they did in 1997, even though the country will add 24.1 million prime working age
    adults and 98.8 million people in total over that same period.

•   Population decline affects communities in every state. Half of U.S. states lost
    prime working age adults from 2007-2017. 43% of counties in the average state
    lost population in that same time period, and 76% lost prime working age adults.

•   Shrinking places are also aging the most rapidly. By 2027, 26% of the population in
    the fastest shrinking counties will be 65 and older compared to 20% nationwide.

•   Population loss is hitting many places with already weak socioeconomic
    foundations. The share of the adult population with at least a bachelor’s degree
    in the bottom decile of population loss is half that in the top decile of population
    growth. Educational attainment in the fastest shrinking counties is on average
    equivalent to that of Mexico today or the United States in 1978.

•   Population loss itself perpetuates economic decline. Its deleterious effects on
    housing markets, local government finances, productivity, and dynamism make it
    harder for communities to bounce back. For example, this analysis found that a 1
    percentage point decline in a county’s population growth rate is associated with a
    2-3 percentage point decline in its startup rate over the past decade.

                                                                            Economic Innovation Group | 3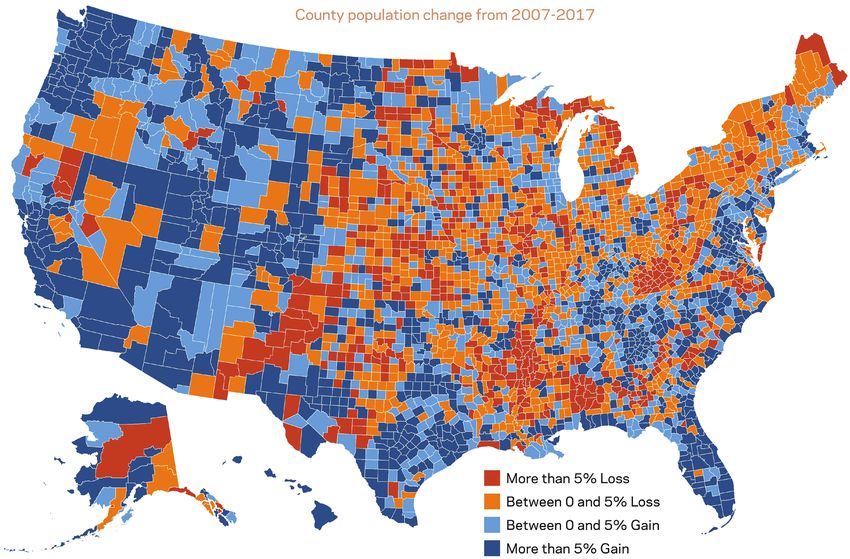
The idea

                   Current skilled immigration policy largely benefits populous, booming metro areas
                   but fails most heartland communities. A new program of place-based visas—let’s call
                   them Heartland Visas—could become a powerful economic development tool for
                   communities facing the consequences of demographic stagnation, but not content
                   to simply manage decline. The visas would constitute a new, additive, and voluntary
                   pathway for skilled immigrants to come to the United States. Eligible communities
                   would opt-in to hosting visa holders, who would provide a much-needed injection
                   of human capital and entrepreneurial vitality into parts of the country that retain
                   considerable economic potential.

4 | Economic Innovation Group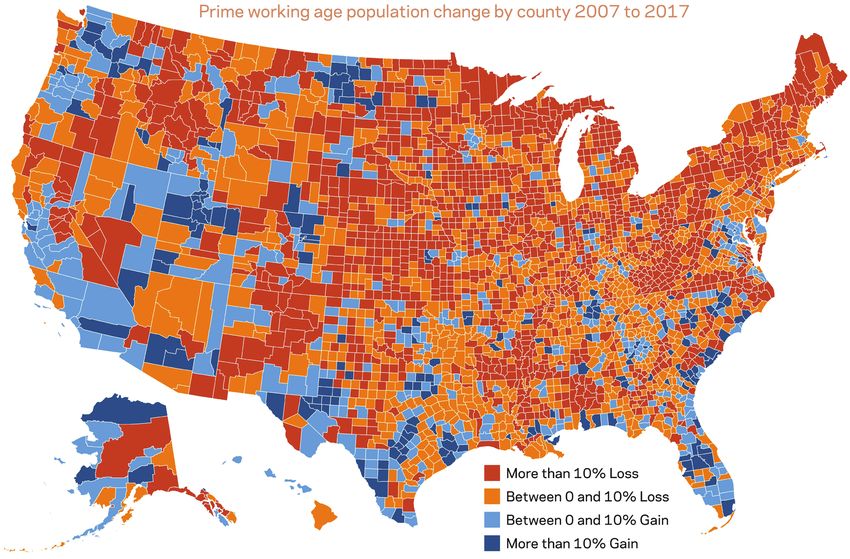
Introduction

Parts of the United States count among the richest, most educated economies in
the world, while others struggle with a variety of socioeconomic problems. This
has been true throughout U.S. history, but today diverging economic fortunes are
exacerbated by a new era of demographic challenges. Population growth has slowed,
the number of prime working age people (25-54) is stagnating, and the country is
aging rapidly. These trends have raised concerns that the United States will soon
face the serious demographic problems that Japan and parts of Western Europe have
confronted in recent decades. The truth is, for many parts of the country, including
much of the heartland, those challenges have already arrived. Over the last decade,
Japan’s population shrank by 1% and its prime working age population shrank by
4.4%. Across the United States, 41% of counties, with a population of 38 million,
have declined by this much or more over the last decade.

Across the United States, 41% of counties, totaling 38 million people,
have experienced rates of demographic decline similar to Japan’s.

The demographic challenges facing large parts of the country are not benign.
Demographic decline and population loss are not just symptoms of place-based
economic decline, they are direct causes of it. As this report will document,
demographic decline leads to a variety of economic problems. Population loss
reverberates through housing markets and municipal finances. Low-growth places
have weaker labor markets and suffer from less economic dynamism. What’s more,
these trends are set to deepen over the next decade.

What is the appropriate policy response to such developments, and how can the
federal government, in particular, be supportive of communities not content to
accept decline as destiny?

This report will explore one potential tool the federal government could put at
the disposal of communities experiencing demographic decline: a new visa that
would connect skilled immigrants to communities that want and need them. The
new visas would bolster the local human capital base and help unlock the latent
potential of the country’s struggling regions. Such a policy would be strengthened
by complementary initiatives to upskill and retrain long-standing residents as well.
Yet this report lays out the case for why more skilled people in sheer numerical

                                                                      Economic Innovation Group | 5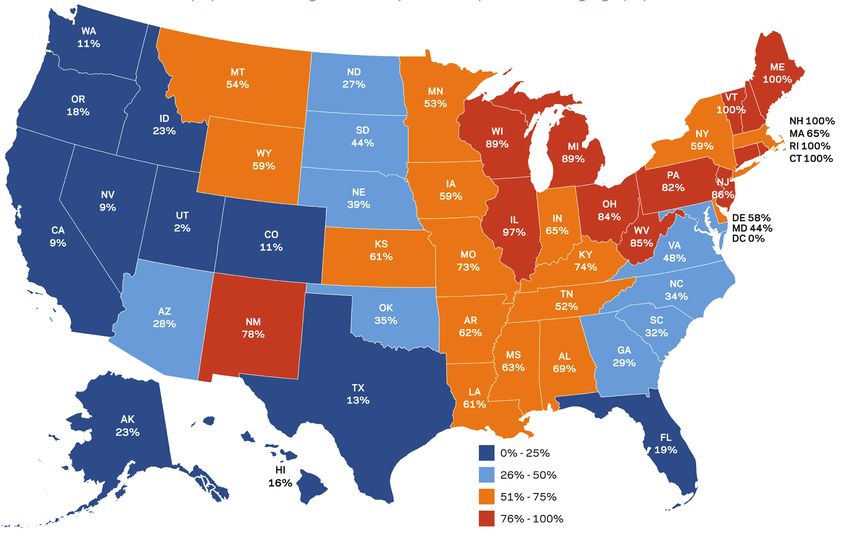
terms are needed to spark durable turnarounds and counteract the economic drag
                   of population decline itself. Skilled immigrants, who are typically young, well-
                   educated, entrepreneurial, and innovative, can meaningfully enhance local efforts
                   to kickstart the process of economic revitalization.

                   This report starts by unpacking the demographic challenges that struggling places
                   are facing today and in the future. Then it will explore how demographic decline
                   seriously exacerbates economic problems through three main channels: the housing
                   market, fiscal effects, and economic dynamism. Finally, we discuss how skilled
                   immigration might be able to offset and reverse those challenges before presenting a
                   rough outline for a place-based visa policy.

6 | Economic Innovation Group
Population loss
economics
Demographic headwinds have pushed U.S. population growth over the last decade
to its slowest pace since the Great Depression. Fewer births, mostly flat immigration
rates, and an aging population have left net growth at 0.7% on average annually
over the last decade, compared to a 1% or higher average over the last 30, 50, and
100 years. This slowdown translates into roughly 900,000 fewer new Americans
each year. The most recent data is no better, with 2018 marking the slowest rate of
population growth in the United States in over 80 years.
The last decade marks the first time in the past century that the United
States has experienced low population growth and low prime working age
growth on a sustained basis at the same time.
The aging of the baby boomers out of their prime working years means that growth in
the number of Americans ages 25 to 54 has slowed even more sharply than the overall
population, settling in at 0.4% in 2018. While the United States has experienced low
population growth and low prime working age growth in the past, the last decade is
the first time in the past century that both have occurred on a sustained basis at the
same time. These low-growth conditions are set to persist for the foreseeable future.
U.S. population and prime working age population, % change from the year prior
2.5%
2.0%
1.5%
1.0%
0.5%
0.0%
1922 1930 1938 1946 1954 1962 1970 1978 1986 1994 2002 2010 2018
Source: U.S. Census Bureau, Moody's Analytics
Population Prime working age population
Source: U.S. Census Bureau, Moody’s Analytics
Economic Innovation Group | 7Compounding these negative population growth trends is the rapid aging of the
population that has pushed the senior share to historic heights. The percent of the
population age 65 and over is projected to shoot up from 13% in 2007 to 20% in 2027.
Share of U.S. population age 65 and over
25%
The U.S. share of the
20% population 65 and
older has already
doubled since 1950.
15%
Current forecasts
expect it to increase
10% to one-fifth of total
population within
a decade, close to
5% what Germany is
today.
0% Source: U.S. Census Bureau, Moody's Analytics
1950 1957 1964 1971 1978 1985 1992 1999 2006 2013 2020 2027
Source: U.S. Census Bureau, Moody’s Analytics
These demographic challenges are not distributed evenly across the United States.
Instead, some parts of the country are still adding people at a healthy pace, while
others are losing them, sometimes at a dramatic rate. The recent slowdown in
U.S. population growth thus understates the problem in many places. Even as the
national growth rate has decelerated, the share of all counties falling below it has
increased steadily from 64% from 1990 to 2000, to 73% from 2000 to 2010, to 86%
from 2010 to 2017. About half of U.S. counties are now losing population outright
each year—an historically high proportion. Over 50 million people, or 15% of the U.S.
population, live in counties that have shrunk over the past decade, and another 11
million live in counties with largely flat populations.1
Share of counties losing population annually
90%
80%
70%
60%
50%
40%
30%
20%
10%
0% Source: Census Bureau, Moody's Analytics
1971 1975 1979 1983 1987 1991 1995 1999 2003 2007 2011 2015 2019 2023 2027
Population Prime working age population
Source: U.S. Census Bureau, Moody’s Analytics
1. We define flat as 0.1% per year annual growth on average over the decade.
8 | Economic Innovation GroupPopulation loss affects every state. Declining population is more prevalent in
particular regions, specifically the Northeast and Midwest, but 43% of counties in
the average state are shrinking. In only four states did no counties lose residents
over the past decade: Delaware, DC, Hawaii, and Washington. At the other end of
the spectrum, 80% of counties in Illinois and West Virginia lost population. See
Appendix Table 1 for data on all states.
County population change from 2007-2017
More than 5% loss Between 0 and 5% loss Between 0 and 5% gain More than 5% gain
Source: U.S. Census Bureau, Moody’s Analytics
The story for prime working age population is even more dramatic, with 80%
of counties losing population ages 25 to 54 over the last decade. Together these
counties were home to 149 million Americans in 2017. The proportion of counties
losing prime working age population annually has been well above historic highs
since 2000, where Moody’s Analytics forecasts it to remain into the next decade.
These projections mean that, by 2037, 67% of U.S. counties will contain fewer prime
working age adults than they did in 1997, even though the United States as a whole
will add 24.1 million prime working age adults and 98.8 million people in total over
that same period.
Economic Innovation Group | 9Prime working age population change by county 2007 to 2017
More than 10% loss Between 0 and 10% loss Between 0 and 10% gain More than 10% gain
Share of 2017 population living in a county that lost prime working age population 2007-2017
0-25% 26-50% 51-75% 76-100%
Source: U.S. Census Bureau, Moody’s Analytics
10 | Economic Innovation GroupIn the average state, three-quarters of counties have shed prime working age adults
over the past decade. In five northeastern states, prime working age population is
shrinking in every county: Vermont, Maine, Connecticut, Rhode Island, and New
Hampshire. Underscoring just how much of the country is impacted by the
demographic drag now setting in across the American economy, a majority of the
population in 28 states lives in a county that lost prime working age adults between
2010 and 2017. Western states appear by far the most resilient in the face of these
trends.
By 2037, two-thirds of U.S. counties will contain fewer prime working age
adults than they did in 1997.
To examine the challenges that accompany demographic decline, it is useful to divide
the more than 3,000 U.S. counties into deciles based on their population growth over
the last decade. This allows us to compare, for example, the 10% of counties that are
growing most quickly to the 10% that are shrinking most quickly across a range of
socioeconomic factors. In general, the results show that a lack of population growth is
consistently accompanied by worse economic, social, and demographic outcomes.
Just under half of U.S. counties (48%) lost population over the decade to 2017.
Translated across deciles, this means that the bottom four deciles capture counties
that are losing population, the fifth decile captures those on either cusp of flat
population growth, and all counties in the remaining top five deciles are gaining
population. The bottom 10% of counties lost on average 1% of their population per
year between 2007 and 2017, while the top 10% grew on average by 2%. The same
decile groupings, combined with Moody’s Analytics forecasts, suggest that the next
decade will look similar, with today’s population losers continuing to decline and
today’s gainers continuing to grow.
Places with the most population loss are struggling with even sharper declines in the
prime working age population. Looking at the same deciles used above, we can see
that the 10% of counties suffering from the greatest overall population losses also
experienced the steepest declines in prime working age population. These counties
saw their prime working age population shrink by 2% a year over the past decade.
In contrast, the counties with the fastest growing population saw prime working
age growth of over 1% a year. Again, Moody’s Analytics forecasts suggest that these
trends will continue over the coming decade.2
2. Moody’s Analytics uses both a top-down and bottom-up approach to forecasting population growth. County and metro
area population growth is a function of historical growth, a cohort-based model using births, deaths, and net-migration,
and the state population forecast. The state forecast, in turn, is a function of historical growth, a cohort-based model
using births, deaths, and net-migration, and the U.S. population forecast.
Economic Innovation Group | 11Half of U.S. counties lost population over the last decade
Average annual change in population 3%
2.0%
2%
1.0%
(2007-2017)
1% 0.6%
0.1% 0.3%
0%
0.0%
-0.2%
-1% -0.4%
-0.6%
-1.0%
-2%
Fastest shrinking counties Fastest growing counties
Deciles of population change (2007-2017)
Source: U.S. Census Bureau, Moody’s Analytics
Beyond those that are shrinking outright, there are hundreds of counties where total
population is largely flat but the prime working age population is falling quickly. For
example, even counties in the sixth decile for overall population growth are losing
prime working age residents at a rapid clip, averaging 0.8% per year over the last
decade and a projected 0.3% over the next. An even larger share of these places are
populous urban counties. Among the 30 million people living in this decile, more
than half live in counties of 300,000 people or more—places such as Cook County, IL
(Chicago), Shelby County, TN (Memphis), or Providence County, RI (Providence).
Prime working age population is declining even faster and in more places
Average annual change in population
3%
ages 25 to 54 (2007-2017)
2% 1.4%
1% 0.2%
0%
-1% -0.3%
-0.8% -0.6%
-1.2% -1.0%
-2% -1.4%
-1.7%
-2.2%
-3%
Fastest shrinking counties Fastest growing counties
Deciles of population change (2007-2017)
Source: U.S. Census Bureau, Moody’s Analytics
As Box 1 highlights, shrinking counties are generally more rural and have smaller
populations than those that are growing. As a result, 6 million people live in the
bottom 10% of counties, while 94.5 million live in the top 10%. However, several
large, urban counties land in the bottom 30% as well, including Wayne County, MI
(Detroit), Cuyahoga County, OH (Cleveland), and St. Louis city, MO (St Louis). The
skewed distribution means that only 6% of counties (84 in total) account for 41% of
the population in shrinking places. For further context, Appendix Table 2 contains
a list of metro areas that lost population over the past decade, including places as
diverse as Anniston, AL; Carson City, NV; and Pittsburgh, PA.
12 | Economic Innovation GroupBox 1: Contextualizing the deciles of population change
Regional distribution of counties across population change deciles
100% Western and Southern
counties clearly dominate
80% the top deciles of population
growth. The South stands
out for its large number of
60% counties at both ends of
the distribution. A modest
40% number of Midwestern
counties are growing
strongly, but most skew
20% toward population decline.
Northeastern counties are
disproportionately likely to
0%
be stagnating. Yet, there are
Fastest shrinking counties Fastest growing counties exceptions to these general
rules in every region.
Deciles of population change (2007-2017)
Northeast Midwest South West
Total population of county population change deciles
100% 94.5 Given the composition
of each decile, it is not
Population (millions)
surprising that the fastest
80%
67.5 growing group of U.S.
counties is also the most
60% 51.5 populous with 94.5 million
residents. At the other
end of the spectrum, 6.1
40% 30.2 million Americans live in the
27.7
most rapidly depopulating
16.8
20% 11.9 12.1 counties, fewer than in any
6.1 7.4 other decile.
0%
Fastest shrinking counties Fastest growing counties
Deciles of population change (2007-2017)
Population size distribution of counties across population change deciles
100% Small-population counties—
those with fewer than
80% 50,000 residents—account
for 68% of all American
counties, and they are far
60% more likely to be declining
than growing. Counties
with between 100,000 and
40%
300,000 residents are most
prevalent in the top quintile.
20% Reflecting the inherent
economic advantages of
large population centers
0%
today, more counties with
Fastest shrinking counties Fastest growing counties over 300,000 residents
can be found in the top two
Deciles of population change (2007-2017) deciles than in the bottom
eight combined.
Under 50,000 people 50-100,000 people 100-300,000 people Over 300,000 people
Economic Innovation Group | 13Aging compounds the demographic challenges facing low-growth counties. Counties
in the bottom decile were as old in 2017 as the rapidly-greying country itself will be in
2035. By 2027, more than 1 in every 5 residents in the bottom two deciles of counties
will be 65 and over. By contrast, fast-growing counties are meaningfully younger
than the country as a whole, with 12% of their population 65 and up compared to 16%
nationally. These disparities are expected to persist into the future.
Low-growth places are farthest down the aging curve
30%
27%
26% 2017 2027
Percent of the population age 65 and over
25% 25%
25% 24%
23%
22% 22% 22%
21% 21%
20% 20% 20%
20% 19%
18% 18% 18%
17%
15% 14%
10%
5%
0%
Fastest shrinking counties Fastest growing counties
Deciles of population change (2007-2017)
Source: U.S. Census Bureau, Moody’s Analytics
Employment and education gaps are widening
Low-growth places lag far behind their peers both demographically and
socioeconomically. Notably, as population growth falls, employment rates deteriorate
especially quickly for men in their prime working years of ages 25 to 54. In the
fastest shrinking counties, 29% of prime working age men did not hold jobs between
2013 and 2017, compared to 17% in the fastest growing (top decile) counties. For
comparison, the 12 percentage point gap between these two groups of counties is
significantly larger than the 7 percentage point increase in non-employment the
United States experienced during the Great Recession.
Population loss is not itself inherently negative, and indeed it can provide a healthy
valve for economic adjustment. The movement of people across the United States
historically has been an important force for equalizing economic opportunity among
different parts of the country. Traditionally, people tended to move from poorer
places towards richer and more productive ones. This process helped to generate
convergence in incomes and living standards, as it made labor scarcer and boosted
wages in shrinking places and made labor more abundant in growing ones. However,
in recent decades migration-driven convergence has stalled, dragged down by a
variety of forces that have kept many Americans stuck in place.3
3. Ganong and Shoag, 2017.
14 | Economic Innovation GroupPrime working age employment is especially depressed in low-growth areas
Prime working age non-employment rate (2017) 40%
Men Women
33%
31%
30% 30% 30% 30% 30%
29% 29% 29%
30% 28%
24% 24%
23% 23% 23%
21% 21%
19%
20% 17%
10%
0%
Fastest shrinking counties Fastest growing counties
Deciles of population change (2007-2017)
Source: U.S. Census Bureau, Moody’s Analytics
One important reason that convergence has stalled is that migration out of struggling
places has become skill-biased. While both low-skilled and high-skilled households
used to move towards opportunity, today it is predominantly the high-skilled who
leave economically struggling places and the low-skilled who stay behind.4 Fully 3.7%
of Americans with a bachelor’s degree or higher move to a new county in any given
year, compared to only 2.6% of high school graduates. Someone with a professional
or graduate degree is twice as likely to move states as a high school graduate.5 As
a result, migration leaves struggling places falling farther behind the rest of the
country in terms of educational attainment.
Educational attainment in the fastest shrinking counties is equivalent to
that of the United States in 1978 and close to that of Mexico today.
In the fastest shrinking counties, the share of the adult population at least 25 years of
age with a bachelor’s or higher is 15.8%, half the share in the top-performing decile.
Educational attainment in the fastest shrinking counties is equivalent to that of the
United States in 1978—four decades ago—and close to that of Mexico today. What
is more, the education gap between shrinking and growing counties is widening. In
the fastest shrinking counties, educational attainment has increased about half as
quickly over the past decade as in the fastest growing counties. For every one college
graduate that the fastest shrinking counties add, the fastest growing add two.
4. Ganong and Shoag, 2017.
5. Analysis of Census Bureau Geographical Mobility Data for 2017 to 2018.
Economic Innovation Group | 15High-growth counties are compounding their initial human capital advantages
Prime working age non-employment rate (2017) 40%
Share in 2007 Increase from 2007 to 2017
30%
+7%
+5%
+5%
20%
+4%
+4%
+4% +4% +4%
+4%
+3%
10%
0%
Fastest shrinking counties Fastest growing counties
Deciles of population change (2007-2017)
Source: U.S. Census Bureau, Moody’s Analytics
Alarmingly, in some struggling parts of the country, educational attainment is
headed in the wrong direction entirely. In total, 13% of U.S. counties home to 6.1
million Americans, saw the number of adults with at least a bachelor’s degree fall
from 2010 to 2017.
In sum, the economics of demographic decline are already affecting many American
communities. Places that are losing population demonstrate worse outcomes along a
variety of demographic and socioeconomic factors. These trends are likely to worsen
as affected communities fall farther behind over the next decade. In the following
sections, we will review how these demographic challenges reverberate even further
through the economy via three main channels: the housing market, local government
finances, and dynamism.
16 | Economic Innovation GroupPopulation loss hurts
housing markets
One of the ways in which population growth and loss affects local economies
is through the housing market. These effects can be significant, and, as we will
see, imply that losing population is far less benign than many economists and
policymakers typically assume.6
The relationship between population growth and housing demand is clear. More
people means more demand for housing, and fewer people means less demand.
However, there is an important difference in how housing markets react to growing
versus shrinking populations. The demand for additional housing created by
population growth can be accommodated through new construction, but when
population shrinks housing is rarely torn down, and when it is, only after long
periods of vacancy and depreciation. As a result, a shrinking population will lead
to falling prices and a deteriorating, vacancy-plagued housing stock that may take
generations to clear.
On the surface, it may be unclear why falling house prices are undesirable. Cheaper
housing is good for first-time home buyers and renters, but bad for homeowners.
One might therefore suspect that falling house prices are a wash when it comes to
the overall economic effect. However, there are four important reasons why falling
house prices attributed to a lack of demand can cause serious economic problems in
struggling places: negative wealth effects, low construction activity, vacant housing,
and strained local government finances.
The wealth effect
Housing represents a source of wealth for more than half of U.S. households. As
such, a $100 decline in housing value leads on average to a $5 to $10 decline in
spending, as households perceive the depreciation as a decline in wealth and cut
back on their spending.7 Falling house prices thus ripple through the local economy
as homeowners spend less on local goods and services. These negative wealth effects
are three times larger for low-income homeowners, who predominate in struggling
communities, than for high-income ones.
6. An exception is economist Greg Howard, whose 2018 paper found that a 1% decrease in population via migration
increases the unemployment rate by 0.1 percentage points in the first year and by 0.25 percentage points over the next
four years, and that this occurs mainly via the housing market.
7. Mian, Rao, Sufi, 2013.
Economic Innovation Group | 17In addition, the costs of lost housing wealth extend well beyond consumption.
Housing wealth represents an important source of borrowing for those looking to
start new businesses. When housing wealth declines, home equity for would-be
entrepreneurs evaporates. Recent research suggests that the loss of home equity
from the housing bust has had a significant effect on the startup rate by reducing
the access to credit to invest in new businesses.8 As discussed below, fewer startups
create a variety of spillover problems for the local economy, making this effect of lost
housing wealth important.
The construction effect
The second problem with falling house prices is that it reduces the incentive to both
build new homes and maintain existing ones. When house prices fall far enough,
large swathes of the existing housing stock can become worth less than it would
cost to retrofit or replace with new construction. In Trumbull County, OH (-0.7%
annual population growth from 2007 to 2017), for example, the median sale price
of a single-family home was $67,962 in 2017. In Genesee County, MI, home of Flint,
(-0.7%) the median single-family home value was only $84,716 The simple economics
of home construction and refurbishment in such markets will frequently not pan out.
Unsurprisingly, there is a strong empirical relationship between population growth
and the share of housing stock that is worth less than the replacement costs.10
As new-builds and renovations fall off, employment opportunities for construction
workers also disappear. While parts of the country with strong local economies
and low unemployment rates can adapt relatively easily to modest declines in
construction employment, displaced construction workers struggle to find work
in places with already weak labor markets. In contrast, expanding construction
employment in these areas could provide jobs for workers who have been laid off
from declining local blue-collar industries, such as manufacturing and mining.11 At
almost $28 an hour, construction jobs offer 22% higher average wages than the typical
non-supervisory production job. Rekindling housing market demand above the
replacement threshold would provide an immediate stimulus for the construction
sector and its potential workforce.
The vacancy effect
The third problem with falling house prices is that properties are more likely to
remain vacant and abandoned. Indeed, among the 10% most rapidly shrinking
counties, the average residential vacancy rate is 15%, nearly double that of the fastest
growing counties. Population growth over the last decade is strongly and statistically
significantly related to the residential rate at the county level.12 A regression analysis
shows that a 1 percentage point decrease in average annual population growth is
associated with a 1.9 percentage point increase in the vacancy rate. Moreover, the
effects are asymmetrical: falling population has a four-times greater impact on
vacancy rates than a growing population.
8. Davis and Haltiwanger, 2019.
9. CoreLogic and Moody’s Analytics.
10. Glaeser and Gyourko, 2005.
11. Kofi, Hurst, and Notowidigdo, 2016.
12. Using the 2013-2017 American Community Survey.
18 | Economic Innovation GroupHousing vacancy is commonplace in low-growth counties
16% 15.0%
12.8%
Residential vacancy rate (2017)
11.6% 11.5%
12% 11.3% 11.0%
10.1%
9.6% 9.2%
8.2%
8%
4%
0%
Fastest shrinking counties Fastest growing counties
Deciles of population change (2007-2017)
Source: U.S. Census Bureau, Moody’s Analytics
Vacancies are problematic for a variety of reasons. Signs of blighted property, such
as broken windows, trash dumping, overgrowth and squatting, are more prevalent in
areas with a significant number of vacant homes. This blighted property can make
a neighborhood less desirable and lead to an increase in crime, thus depressing
prices of occupied homes.13 These negative spillovers are especially large in densely
populated neighborhoods with low property values.14
The fiscal effect
Finally, poor housing demand has serious fiscal consequences for state and local
governments. First and foremost, falling prices and vacant homes mean lower
property tax revenues. Across the United States, 1.5% of state and 73% of local
government tax revenues come from property taxes, meaning a declining housing
market can cause serious fiscal strain.
In addition, many local governments incur costs related to vacant properties
including lawn maintenance, boarding up and securing, and demolition. A study
from the Government Accountability Office found that boarding up and securing
a vacant property costs local governments between $233 and $1,400 per vacant
property and demolition costs between $4,000 and $40,000.15 In addition, local
governments can face extra costs related to public safety and fire hazards created
by vacant properties, as well as the administrative and legal costs to process them.
These costs accumulate for shrinking places. In Detroit, for example, 14,500 homes
have been demolished in recent years at a cost of $175 million,16 and the city still has
22,000 abandoned homes that it plans to demolish, board up, or rehabilitate.17 The
fiscal effects of population loss are multifaceted and go beyond the housing market,
however. We turn to that broader discussion next.
13. See Gerardi et al., 2015.
14. Anenburg and Kung, 2014.
15. Government Accountability Office, 2011.
16. Chad Livengood, “Detroit Land Bank farms out demolition bid scoring to PwC,” Crain’s Detroit Business, July 27, 2018.
17. Dana Afana, “Detroit aims to fix, demolish or board up 22,000 abandoned homes by end of 2019,” M Live, March 7, 2018.
Economic Innovation Group | 19Population loss erodes
local government finances
When population declines, state and local governments collect less tax revenue, but
they also spend less. On net, however, population loss often leads to fiscal problems.
On the revenue side, the story is clear. Overall tax revenues in low-growth places are
weakened by a declining number of prime working age adults, a high proportion of
seniors, and a declining number of households. Property taxes, sales taxes, and income
taxes are all negatively affected. As noted above, when an excess of housing relative
to the size of the population leads to falling house prices, property tax revenues fall
alongside. When properties are vacant due to foreclosure or abandonment, local
governments collect even less. An aging population can be a fiscal drag too, as senior
households tend to have lower taxable incomes, spend less on goods that generate
revenue from sales tax, and often receive property tax exemptions. Income taxes fall
when the prime working age population shrinks and highly-educated, wealthier people
leave.
Property, sales, and income tax receipts in low-growth places are all
weakened by prime working age population loss, aging, and declining
numbers of households.
Declining revenues would not be an issue if they were offset entirely by declining
costs. However, while some costs will decline as state and local governments serve a
smaller population, in general revenues fall faster. Pension liabilities are one example
of a cost that does not adjust with population. Governments make a variety of other
investments that are impossible or slow to reverse in things like infrastructure, too.
Even as population falls, cities must pay to maintain water, energy, road, and transit
infrastructure built to serve a greater number of people. The associated fixed costs
mean that declining population translates into higher costs per remaining resident.
Even when infrastructure can be scaled back in theory, the economic and political
costs of doing so are often significant. For example, decommissioning roads can reduce
maintenance costs over time but also involves significant upfront capital costs and may
prompt backlashes from affected residents.18
Perhaps nowhere have the consequences of a shrinking population manifested
themselves more clearly than in the city of Detroit, where the population has declined
by 1.2 million people over the last half century, leaving over 20 square miles essentially
18. Hornbeeko and Schwarz, 2009.
19. Kate Davidson, “Detroit has tons of vacant land. But forty square miles?” Michigan Radio, April 18, 2012.
20 | Economic Innovation GroupLow population growth is associated with worse municipal finances
6
Average municipal credit rating 5.2 5.2
5
4.5 4.5 4.5
(lower is better) (2010)
4.1
4
3.5 3.5
3 2.8
2.4
2
1
0
Fastest shrinking counties Fastest growing counties
Deciles of population change (2007-2017)
Source: U.S. Census Bureau, Moody’s Analytics
abandoned.19 Despite the dramatic scale of the population loss, the city has struggled
with the politically unpopular decision of scaling back services in sparsely populated
areas. “It’s politically difficult to pick winners and losers, which neighborhoods are
viable and which should go back to God,” as the director of the city’s Water and Sewage
Department put it.20 The fiscal challenges of shrinking are part of the reason why
Detroit has poor public services despite the highest property taxes among major cities
in the country.
In addition to case studies like Detroit, we can look to municipal bond ratings to
confirm that a lack of population growth is bad for local government finances. Using
a dataset of 665 county general obligation bond ratings, we can see that county fiscal
health has been strongly correlated with population growth over the last decade.
Counties in the lowest 10% of population growth are 2 points worse on the Moody’s
Analytics muni ratings scale than those in the top 10%. This is the equivalent of moving
from an Aa2 muni rating to an A1, which is consistent with a probability of default over
30 years two-times higher in shrinking areas, 5.9% compared to 2.2%. This translates to
approximately 30 basis points in added borrowing costs.
Using the same sample, we find that average population growth over the previous
decade is statistically significantly associated with better ratings.21 Specifically, a
regression analysis shows that a 2.3 percentage point decline in average population
growth would result in a single notch downgrading. However, here again population
loss has a much larger effect than population growth. When a county is shrinking,
it only takes a decline of 0.6 percentage points in the rate of population growth to
add up to a downgrade. Using the USDA’s measure of county-level amenities as an
instrumental variable provides further evidence that the relationship documented here
is causal: in other words, population loss does indeed appear to cause a deterioration in
a city’s fiscal health.22
20. Joel Kurth, “Detroit studying whether to shut water in underpopulated neighborhoods,” Bridge, October 24, 2018.
21. All of the 665 county bond ratings are as of 2010. This marked a unique year where many county bond ratings were
rated for regulatory reasons. Focusing on 2010 thus provides a large sample that was rated on an apples-to-apples basis.
Other models using data from multiple years produce consistent results.
22. See for example, Rappaport, 2009. The effect is statistically significant and even larger than in the simple regression.
Economic Innovation Group | 21Population loss reduces
dynamism
The housing market and fiscal effects of demographic decline are just the tip of the
iceberg. An emerging literature in economics also warns that demographics affect the
economy in deep, important, and causal ways. We now turn to how low or negative
population growth, an aging population, and a lack of human capital all drive down
productivity, dynamism, and employment.
The startup connection
Economists increasingly understand that population growth is an important driver
of the very health of an economy, not just its size. Population growth stokes demand,
it provides new and fast-growing firms with needed labor, and it eases the piloting
of new business models as companies compete for new customers, not only over
existing ones.
The firm startup (birth) rate languishes near all-time lows
16%
Share of all firms starting or closing annually
14%
12%
10%
8%
6% Source: U.S. Census Bureau
02
78
80
82
84
86
88
90
92
94
96
98
00
04
06
08
10
12
14
16
20
19
19
19
19
19
19
19
19
19
19
19
20
20
20
20
20
20
20
20
Death Rate Birth Rate
Source: U.S. Census Bureau
It is thus telling that the U.S. startup rate has declined in tandem with the
deceleration of U.S. population growth. The various causes of the falling startup rate
are not yet fully understood, but population dynamics clearly contribute.23 Research
23. See Litan and Hathaway, 2014. For recent analysis and broader implications, see Hopenhayn, Neira, and Singhania, 2018.
22 | Economic Innovation Groupshows that startups are especially responsive in taking advantage of both the new
demand and the new labor supply embodied in population growth.24 A growing
population thus facilitates the steady emergence of new firms in an area, while
population loss discourages new firms from forming.
The theory is intuitive, but more importantly the relationship between the startup
rate and population growth is clear in the data. At the county level, we utilize Moody’s
Analytics broad-based startup rate measure to show that the average startup rate over
the past decade is strongly related to population growth over the same period.25 A
1 percentage point increase in average annual population growth is associated with
a 1 percentage point increase in the startup rate, all else equal.26 Importantly, this
relationship is likely causal. Using metro-to-metro migration27 and long lags of a state’s
fertility rate,28 past research has demonstrated that growth in local population and, in
particular, the prime working age population, drives startup rates.
Population growth supports business starts at the county level
8%
Average Moody’s broad-based startup rate (2007-2017)
8%
7%
7%
Size of circle varies based
on county population
6%
6%
5%
5%
4%
4%
3%
3%
2%
2%
1%
1%
0%
0%
-3
-3%
-2 -1
-1%
0 1
1%
2 3
3%
4 5%
5
Average annual population growth
startup rate
Source: U.S. Census Bureau, Moody’s Analytics
In addition to this growing body of research, we find further support for the causal
relationship using the USDA natural amenities instrument from above. This more
rigorous model estimates that a 1 percentage point decline in annual population growth
from 2007 to 2017 caused a county’s startup rate to decline by a statistically significant 2
to 3 percentage points over the period.
24. See Adelino, Ma, Robinson, 2017 and Karahan, Pugsley, and Sahin, 2016.
25. Moody’s Analytics broad based startup rate (BBSR) is based on estimates of the share of employment that is in new
firms for 14 industries at the county level using the Census Bureau’s Quarterly Workforce Indicators data, which covers
the near universe of private sector employers. The BBSR is equal to the median startup rate across these industries. This
measure improves on existing startup rate measures by capturing broad-based entrepreneurship and by avoiding being
driven by one potentially fast-growing industry.
26. First documented by Litan and Hathaway, 2014. Using population weighted regression, the relationship varies
between 1.1 and 0.9 depending on which population weights are used.
27. Ozimek and Wurm, 2017.
28. Karahan, Pugsley, and Sahin, 2016.
Economic Innovation Group | 23Startups matter because they are such important catalysts for maintaining a dynamic
local and national economy. New firms are important sources of innovation,
productivity growth, and job growth.29 In general, a 1 percentage point decline in the
startup rate leads to a 1 to 2 percentage point decline in local annual productivity
growth, which is crucial for wage growth in the long run.30 A low startup rate also
leaves a local economy with bigger, older firms that pay a lower share of their income
to workers. Indeed, recent research suggests that a declining population is one of the
main reason why the labor share of income has declined in recent decades.31 In sum,
population loss appears to kick off a cycle through which the very dynamism that keeps
the economy healthy at both the national and regional scales winds down.
The aging and productivity connection
The U.S. population is older than it has ever been, and it will only get older over the next
few decades. While this has well-known effects on state, local, and federal government
coffers, a worrying thread of new research suggests that an aging workforce has
significant direct impacts on the economy that go well beyond public sector finances.
In fact, the evidence suggests the aging of the population is one of the primary factors
holding back productivity growth, meaning that places with older workers will be less
productive and wages will be lower than in places with younger populations.
The negative effect of population aging on productivity is somewhat counterintuitive.
After all, older workers have more experience and typically earn higher pay, and as a
result we might expect an older workforce to be more productive. But recent research
suggests that large contingents of older workers may create negative spillovers that
reduce productivity at the firm level. The relationship between an older workforce
and lower pay and productivity has been found across a variety of datasets, including
matched employer-employee administrative data from the payroll company ADP, and is
robust to state, industry, and even firm fixed effects.32
Population loss appears to kick off a cycle through which the very dynamism
that keeps the economy healthy at both the national and regional scales
winds down.
While more evidence on why older workers hold back productivity is needed to
be conclusive, it appears that the effect is due to the higher costs of embracing
technological change when the workforce is older. Consider a firm looking to upgrade to
a new software package that will increase productivity but requires extensive training.
The costs of training a young worker on this software can be paid back by higher
productivity over the worker’s long remaining career. However, training a worker on
the verge of retirement will leave little time to recoup the costs of training. Thus, even if
young workers and old workers are equally capable of learning new ways to do business,
it will be less profitable for the company to take on such an investment when a large
29. Decker, Haltiwanger, Jarmin, and Miranda, 2014.
30. Alon, Berger, Dent, and Pugsley, 2018.
31. Hopenhayn, Neira, and Singhania, 2018.
32. Ozimek, DeAntonio, and Zandi, 2018. For additional research using U.S. states, see Maestas, Mullen, and Powell, 2016.
The senior share is defined as the percent of workers who are age 65 and up.
24 | Economic Innovation Groupshare of the workforce is older. Additionally, younger workers may be more adept at
learning new technologies and ways of doing business, and thus training costs are
maybe higher with an older workforce. The relationship remains even when controlling
for job growth, which means that more productive industries are not just seeing a
younger workforce because they are hiring faster.
The productivity-dampening effect of an older workforce translates into lower wages
for others as well. The effect holds across different branches of the same firm: workers
in locations with older colleagues are less productive and earn less than co-workers
in other offices with younger colleagues. The impact is larger in industries with more
skilled workers—exactly where one would expect productivity-enhancing technologies
to be most important and consistent with the hypothesis that older workers reduce
productivity growth by blocking, slowing, or reducing the returns to the adoption of
new technologies.
Overall, the Moody’s Analytics analysis suggests that a 1 percentage point increase
in the share of the workforce age 65 and up reduces productivity by between 1 and 3
percentage points. These estimates imply that the aging of the workforce can explain
between one-quarter and three-quarters of the productivity slowdown over the past
decade or so. Given that struggling places have significantly older populations, this
research offers one more partial explanation for why they are falling behind in myriad
respects.
The human capital connection
Shrinking and slow-growing counties tend to have less educated residents than fast-
growing ones, and the gap has widened over the past decade. This divergence has broad
implications because higher educational attainment helps individuals and families
achieve a variety of better life outcomes, ranging from better pay and greater labor force
attachment to improved health. Furthermore, human capital generates a variety of
positive spillover effects across a spectrum of social measures for communities.
Average earnings are more than $9,000 lower in low-growth places
$41,000
$39,085
Average personal earnings (2017)
$37,000
$35,224 $35,659
$33,867
$33,055
$32,459 $32,564
$33,000 $32,197
$31,324
$29,946
$29,000
$25,000
Fastest shrinking counties Fastest growing counties
Deciles of population change (2007-2017)
Source: Census Bureau, Moody’s Analytics
Economic Innovation Group | 25The direct benefits of education for individuals and communities are obvious.
Education provides the credentials and training for higher paying careers with
greater productivity and better long-run prospects. But higher education is also
a proxy for a wide variety of other factors, broadly known as human capital. This
includes raw intelligence as well as other abilities and skills, such as teamwork,
literacy, and conscientiousness. When present, these factors all contribute to an
overall higher level of productivity and innovativeness in individuals, communities,
and countries. Lower levels of human capital may explain why shrinking places
also patent at one-third the rate of the fastest growing places. Given their greater
productivity and innovativeness, counties with a higher share of skilled workers also
post higher average earnings: earnings in the fastest-growing decile of counties are
30% higher on average than in the fastest-shrinking decile.
Low-growth counties patent at one-third the rate of their high-growth peers
4.0
3.4
Patents per 1,000 people (2000-2015)
3.3
3.0
2.4
2.0
1.9
2.0 1.7 1.7
1.6
1.2
1.1
1.0
0.0
Fastest shrinking counties Fastest growing counties
Deciles of population change (2007-2017)
Source: USPTO, Census Bureau, Moody’s Analytics
Places with low levels of human capital miss out on important spillovers present in
areas with a more skilled workforce. Having lots of skilled people boosts everyone
else’s productivity. One reason is that places and firms with many skilled workers are
more likely to embrace new technologies first. This is why “new jobs” that did not
exist a decade earlier tend to show up first in the most highly-educated cities.33
In addition, skilled coworkers help to raise the productivity of those around them.
In this way human capital functions similarly to regular capital. Just as a computer
raises a worker’s productivity, so does a skilled coworker.34 Such workers also boost
productivity by driving knowledge flows, as interactions among skilled people lead
to the natural sharing of ideas and new collaborations. This effect may seem a bit
nebulous, but it has been recognized by economists since 1890, when Alfred Marshall
wrote that in cities “The mysteries of the trade become no mysteries; but are as it
were in the air.”35
33. Lin, 2011.
34. Moretti, 2012.
35. Avent, 2016.
26 | Economic Innovation GroupAs economist Enrico Moretti writes, “The presence of many college-educated
residents changes the local economy in profound ways, affecting both the kinds of
jobs available and the productivity of all workers.”36 This is why, he notes, high school
graduates living in the most educated cities in the United States often make more
than college graduates in the least educated cities. Looking at a variety of quasi-
experimental evidence, Moretti concludes that a 1 percentage point increase in the
supply of college graduates causes wages for low-skilled workers to go up by 1.6% to
1.9%, and skilled workers by 0.4%.
High school graduates living in the most educated cities in the United
States often make more than college graduates in the least educated cities.
The effects of human capital on the labor market are important, but they are not
the end of the story. Economist Garrett Jones lays out some of the additional
ways in which places benefit from having an educated populace, including higher
savings rates, greater cooperation, better governance, and more effective business.37
And growing up around adults with high human capital, high social capital, and
inventive propensities matters for children. Skilled individuals provide role models,
networks, and mentors, and have significant effects on lifetime earnings. This
fortifies places with high average levels of human capital and the people who live in
them. Conversely, low average human capital handicaps struggling places and their
residents today and into the future.
*
And yet, despite these socioeconomic challenges, many declining counties still have
strong economic foundations. Nearly one in five counties that lost residents on net
between 2007 and 2017 have median household incomes comparable to or higher
than the national level.38 As a group, these declining counties still generate 11% of
GDP—nearly equivalent to Canada’s GDP. One in five are part of metropolitan areas.
And together they are home to 9.2 million children who deserve access to economic
opportunity. Surely it is a worthy goal to seek policy levers to help these communities
build bridges to future prosperity.
36. Moretti, 2012.
37. See Jones, 2015. For other examples of the importance of social spillovers, Chetty and Hendren (2018) show that where
someone grows up has profound effects on later life outcomes. Growing up in a one standard deviation “better county”
for upward mobility causes later life income to increase by 10%. Importantly, their research demonstrates that income
segregation is an important determinant of how good a place is for upward mobility, demonstrating that growing up
near higher income families creates positive peer effects for low-income children. Bell et al (2017) also demonstrate that
growing up near more inventors makes a child much more likely to be an inventor when they grow up.
38. “Comparable to” defined as within $5,000 of the national median, which was $57,652 in 2017.
Economic Innovation Group | 27Could better skilled
immigration policy help?
There are few policy options to address seismic demographic changes and the
socioeconomic problems they cause. One is available and can have a direct impact:
immigration. Could a better federal skilled immigration policy be harnessed as an
economic development tool for rekindling opportunity in left-behind places? We now
turn to exploring this provocative question.
To be sure, a host of complementary longer-term policies are needed to rebalance the
map of U.S. prosperity, including ones that address the human capital of the domestic
workforce and immigrants already here. Yet, the data presented here outline a clear
supply problem for struggling places—one that upskilling efforts or training programs
alone would do little to address.
Skilled (bachelor’s degree-holding) foreign-born workers share of the 25+ population by county, 2017
Less than 1% Between 1% and 3% More than 3% (national average)
Source: U.S. Census Bureau, Moody’s Analytics
28 | Economic Innovation GroupSkilled immigration is an important driver of overall U.S. productivity growth.
However, it currently serves to increase the regional disparities highlighted above: the
fastest-growing decile of counties has proportionally more skilled immigrants than
the slowest-growing one by a factor of eight. What is more, the 20 most populous U.S.
counties currently contain 37% of the country’s skilled immigrants compared to only
19% of the country’s total population. Thus, the flow of human capital from abroad is
one more way in which struggling, shrinking parts of the country are falling further
behind. In contrast and as complement to existing policy, a new place-based visas
(PBVs) program that encouraged foreign talent to locate in struggling corners of the
heartland for a period of time would help to spread the benefits of skilled immigration
across the country.
Let’s examine how human capital inflows from abroad might counteract the profound
demographic challenges that shrinking communities face in their housing markets,
municipal finances, entrepreneurial ecosystems, and labor markets.
Bolster housing markets
The potential for skilled immigrants to boost local housing markets is clear. Notably,
economist Albert Saiz (2007) found a 1% increase in population from immigration
causes housing rents and house prices in U.S. cities to rise commensurately, by 1%.
In places currently experiencing low or weak population growth, such a boost to the
housing market from an increase in skilled immigration would provide a welcome
stimulus.
These housing market effects illustrate an important point that economists, who
tend to emphasize the effects of skilled immigration on productivity growth in large,
dense, educated cities like San Francisco and New York City, often miss. In many high
productivity cities, housing markets are crowded and expensive, and the addition of
new housing supply is constrained by already dense development and/or restrictive
zoning. For example, half of the cities in Trulia’s top 10 U.S. markets with the lowest
housing supply elasticity contain 15% of the country’s immigrants with graduate
degrees.39 More broadly, the 5% of counties with the highest home prices have over
half of the country’s skilled immigrants, and 90% of skilled immigrants live in the top
one-third of counties with the highest housing prices.40
The 20 most populous U.S. counties currently contain 37% of the country’s
skilled immigrants, but only 19% of the country’s total population.
Because cities with the most expensive housing markets tend to also be the most
productive areas, national-level productivity is likely enhanced when a skilled
immigrant moves to them. However, these cities are also where a marginal skilled
immigrant is most likely to crowd an existing native out of the housing market. To
overgeneralize a bit, a new immigrant moving to San Francisco means someone
else has to move out. In contrast, a new immigrant to Akron means one more vacant
39. Ralph McLaughlin, “Is Your Town Building Enough Housing?” Trulia, July 19, 2016.
40. Moody’s analysis of American Community Survey data.
Economic Innovation Group | 29You can also read