Taking stock the development of retail centres in emerging economy areas impact on local consumers, local businesses and the local economy - Urban ...
←
→
Page content transcription
If your browser does not render page correctly, please read the page content below
taking stock
the development of retail centres
in emerging economy areas
impact on local consumers, local businesses and the local economy
acknowledgements
Photo credits (Jabulani Mall): Kevin James

Many useful inputs have been received in the compilation of this report. However, specific thanks are given to
Hein du Toit, Mark Souris, Geci Karuri-Sebina, Alistair Clacherty, Vallery Groenewald and the participants of the
Training for Township Renewal Initiative Colloquium on Retail-led Township Development.

Rob McGaffin and Lucille Gavera have developed this resource.
taking stock
the development of retail centres
in emerging economy areas
impact on local consumers, local businesses and the local economy

                            July 2011
about urban landmark
     Established in May 2006 with funding from the UK’s Department for International Development
     (DFID), Urban LandMark works to find remedies to the problems that have made urban land
     markets dysfunctional, and hence land unaffordable.

     Our initiatives aim to shift policies and practice to improve access to well-located urban land
     by making markets as well as land planning and management systems work better for poorer
     people, giving meaning to the idea of people having a right to land.

     Urban LandMark plays a catalytic role by using research to inform policy, and by promoting
     dialogue between key stakeholders – government, the private sector and civil society – to
     foster a common understanding of and find effective solutions to prevailing obstacles in urban
     land markets.

     Our work in South Africa, which shares common problems with cities and towns in many other
     developing countries, such as rapid urbanisation, rising land prices, unequal access to services,
     uneven legal protection and limited state resources, has been broadened to include a Southern
     African regional focus.

                        T A K I N G S T O C K T H E D E V E L O P M E N T O F R etail
iv                          centres I N E M E R G I N G E C O N O M Y A R E A S
supply-side trends

  about the study
  The last decade has seen a significant increase in the number of retail centres being developed in ‘emerging
  economy’ areas1 in South Africa. In Soweto, for example, arguably South Africa’s best-known township, at least
  six shopping centres have opened their doors since 2005,
  and the township now hosts several well-known retail
  complexes, including Maponya, Jabulani and Bara malls. In      objectives of the study
  the townships adjacent to Cape Town, residents are able
  to shop at Nyanga Junction,Westgate, Liberty Promenade,      • obtain a basic understanding of the functioning
  and Khayelitsha malls, and in Durban, township residents          of township economies and land markets
  can visit Umlazi Mega City and Dube Mall.
                                                                           •    develop a dynamic market perspective and trend
  Even in the townships of smaller South African cities,                        analysis of shopping centre developments in
  such as Port Elizabeth and Polokwane, shopping centre
                                                                                South Africa’s ‘emerging economy’
  developments have sprung up, changing the face of
  commercial transactions for many residing in these areas.                     markets over the past 10 to 15 years
                                                                           •    develop an understanding of shopping centre
  Since retail centres are usually the first non-residential
  type of development to occur in a developing node,                            hierarchies, and the emergence and evolution of
  they are seen to play an important role in the growth                         commercial nodes in ‘emerging economy’ areas
  of an area. However, the trend has been met with mixed
                                                                           •    determine the impact of ‘emerging economy’
  reactions.
                                                                                centres on the local consumer market
  Some argue that these centres have a negative impact
                                                                           •    determine the impact of malls in ‘emerging economy’
  on the local economies by out-competing local small
  businesses. Others say that retail centres bring a                            areas on small formal and informal businesses
  wider range of goods and services closer to the local                    •    identify critical success factors – centre location,
  population at better prices, reducing the need to travel
                                                                                design and tenanting considerations, critical mass
  and the associated costs. Still others think these centres
  can play an important catalytic role in generating urban                      requirements, and transport considerations
  agglomerations, thereby initiating urban renewal and the                 •    identify the challenges / opportunities for the industry
  development of vibrant town centres.
                                                                           •    identify clear, concrete intervention options and
  The reality is that these retail centres have been and are                    recommendations in terms of
  being developed; they are part of the changing landscape
  of ‘emerging economy’ areas in South Africa – the role of                     •    negative impact mitigation and positive
  stakeholders in such developments is to ensure the retail                          impact optimisation strategies
  models fit better within the context of these areas.                          •    addressing identified blockages in the system

  To enable us to understand this market better, Urban
  LandMark in 2009 appointed Demacon Market Studies to carry out a study to determine the nature and
  impact of shopping mall developments in South Africa’s ‘emerging economy’ areas, and explore ways in which
  the positive impact of these centres can be maximised and the negative impacts minimised.

  The aim is to assist in the development of effective leverage mechanisms to improve the role of commercial
  markets in ‘emerging economy’ areas, and help developers and investors to refine their approaches to servicing
  consumer demands in these areas. More broadly, through an improved understanding of the economic, spatial and
  social characteristics of ‘emerging economy’ areas, development practitioners should be enabled to formulate
  appropriate solutions to the challenges that face these areas in terms of regeneration and development, and
  residents in terms of access to economic opportunity.

  This resource begins by looking at supply-side trends, including changes in the national consumer landscape and
  in the actual supply of retail centres in ‘emerging economy’ areas.The next section explains the logic and drivers
  of each of the role-players involved in the development of a shopping centre, while the third section details the
  project approach and selection of the case study sites. In the fourth section, we share some of the findings of
  the local consumer and local small business surveys carried out in each of the case study sites – in terms of the
  impact the development of retail centres have had in these particular ‘emerging economy’ areas. Finally, we look
  at some key issues to consider when developing retail centres in South Africa’s ‘emerging economy’ areas, and
  some of the factors that potentially ensure their success.
  1
      Townships and rural areas
                      I M PAC T O N L O C A L C O N S U M E R S , L O C A L B U S I N E S S E S
                                       AND THE LOCAL ECONOMY
                                                                                                                                           v
supply-side trends

                                                                                                                                                                                            contents
      About Urban LandMark.............................................................................................................................................................................. iv
      About the study............................................................................................................................................................................................. v

  supply-side trends....................................................................................................................................................................................... 4
    changes in the consumer landscape........................................................................................................................................................... 4
           increases in income and living standards mean expenditure and shopping patterns change................................................................................4
      changes in the actual supply of retail centres in ‘emerging economy’ areas..................................................................................... 7
           national development trends for ‘emerging economy’ retail centres...............................................................................................................................7
           provincial development trends for ‘emerging economy’ retail centres......................................................................................................................... 14
      general supply trends .................................................................................................................................................................................17
           emerging retail boom............................................................................................................................................................................................................... 17
           retail centre performance in ‘emerging economy’ areas................................................................................................................................................. 18
           national grocers move into ‘emerging economy’ areas.................................................................................................................................................... 19
           tenant mix shields centres from losses................................................................................................................................................................................ 20
      supply trends summarised..........................................................................................................................................................................21
  understanding shopping centre dynamics........................................................................................................................22
    investor position: retailers and shareholders .......................................................................................................................................22
    investor position: property........................................................................................................................................................................23
    developer position.......................................................................................................................................................................................23
    financier position..........................................................................................................................................................................................24
    tenants............................................................................................................................................................................................................25
    centre owners...............................................................................................................................................................................................26
    consumers.....................................................................................................................................................................................................27
    alternative retail models? ..........................................................................................................................................................................27
  case study selection and methodology.............................................................................................................................28
    approach to the project..............................................................................................................................................................................28
           case study selection.................................................................................................................................................................................................................. 28
           case study methodology........................................................................................................................................................................................................... 30
  impact on local consumers, businesses and the economy.....................................................................................32
    investigating the findings.............................................................................................................................................................................32
           a closer look at the positive and negative consequences of mall development in ‘emerging economy’ areas.................................................. 32
              Jabulani Mall, Soweto – Gauteng.........................................................................................................................................................................................................................33
              Central City, Mabopane – Gauteng...................................................................................................................................................................................................................36
              Thula Plaza, Bushbuckridge – North West....................................................................................................................................................................................................38
              Liberty Promenade, Mitchell’s Plain – Western Cape.............................................................................................................................................................................41
              Umlazi Mega City, Umlazi – KwaZulu-Natal.................................................................................................................................................................................................42
              NkowaNkowa Tzaneen – Limpopo..................................................................................................................................................................................................................43
           what were the key impacts across all survey areas?....................................................................................................................................................... 44
              impact on consumers: consumer perceptions.............................................................................................................................................................................................44
              impact on local small businesses: consumer perceptions......................................................................................................................................................................45
              impact on local small businesses: local small business perceptions..................................................................................................................................................46
              impact on local small businesses: local small business perceptions..................................................................................................................................................47
           summary of the impacts of formal retail centre development on local consumers and local small businesses, by category...................... 48
  key discussion points, success factors and possible interventions................................................................52
    investment.....................................................................................................................................................................................................53
    financing.........................................................................................................................................................................................................53
    land ownership.............................................................................................................................................................................................53
    facilitating development..............................................................................................................................................................................53
    leveraging developmental outcomes........................................................................................................................................................54
    planning and broader nodal development..............................................................................................................................................54
    size and number of centres.......................................................................................................................................................................55
    location and design......................................................................................................................................................................................55
    tenants and rentals.......................................................................................................................................................................................56
    incorporation of local small businesses and the community in formal retail centres..................................................................57
    management and operations.....................................................................................................................................................................58
    conclusions: the retail model.....................................................................................................................................................................59
  appendix a: consumer and local small business survey findings – selected malls...............................60

                                                                   I M PAC T O N L O C A L C O N S U M E R S , L O C A L B U S I N E S S E S
                                                                                                 AND THE LOCAL ECONOMY
                                                                                                                                                                                                                                                                           1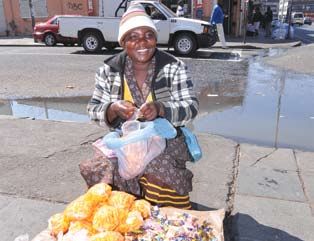
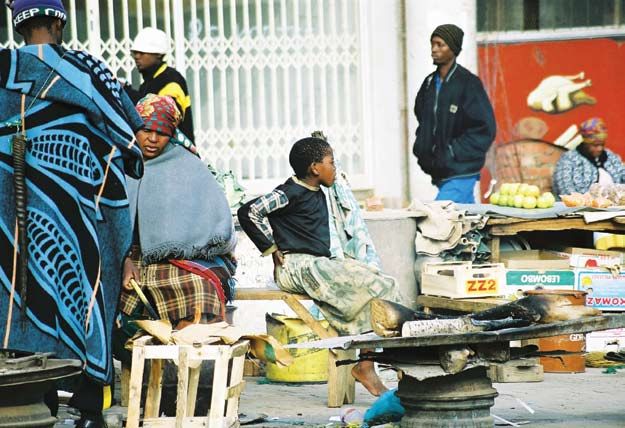
undermining the
                          survival and growth
                         of local enterprises...
    ...the first of a series of boycotts against the new Pan Africa Mall in Alexandra, north of
    Johannesburg, will start on Thursday, the Greater Alexandra Chamber of Commerce and
    Industry has said.

    Spokesperson of the chamber’s youth wing, John Makgoka, said the body would embark on
    a protest this week to discourage consumers from shopping at the mall until it was “fully-
    owned” by locals.

    “The people of Alexandra will fight for what belongs to them. We will cripple the tenants
    until they leave.”

                              15 June 2009 – www.bizcommunity.com/Article/196/344/36935.html

    ...the Bureau for Market Research at Unisa has found that shopping mall developments
    create heightened competition for small township businesses, with a potential risk of
    considerable consumer expenditure displacement away from them to national chains and
    franchise businesses in the new shopping complexes.

                                                         1 February 2010 – www.iolproperty.co.za/

    ...in Soweto, two big malls – Maponya Mall in Klipspruit and Jabulani Mall in Jabulani – have
    been developed to accommodate the shopping needs of more than 2 million residents.

    Although both projects were welcomed by the Soweto community at first, including small
    business owners, the malls are now regarded as a threat to the development of small and
    medium-sized enterprises in the area.

    Local customers have deserted the traditional township supermarkets, opting to shop at
    bigger and more established mall chain shops.

    “I have lost many customers to the nearby Jabulani Mall. People are buying their groceries
    in that mall and I was forced to close some of my grocery shops, leaving behind only a
    hardware,” says Reggie Makhetha, owner of Roots Restaurant in White City.

    Sibusiso Tapera, MD of Toby’s Ford and Service Station in Diepkloof’s oldest business centre,
    Black Chain, says the malls, including the nearby mini Bara Mall, forced him to think twice
    about renovating his old business, to keep his long-time client database intact.

    “Because of the new malls, we are forced to renovate our businesses to look modern in
    order to keep the existing or attract new clients,” he says.

    He says proper financial support from well-established businesses and the government is
    needed to enable entrepreneurs to expand their operations, as they create jobs for young
    people.

    The rapid increase in consumer expenditure by residents in townships and the fact that most
    dwellers do not want to move out of their townships create substantial market potential in
    these areas.

    But the trend of building big malls in the townships is making it hard for local entrepreneurs
    to compete, because most cannot afford to pay the high monthly rentals.

                          3 February 2010 – www.businessday.co.za/articles/Content.aspx?id=9274

                       T A K I N G S T O C K T H E D E V E L O P M E N T O F R etail
2                          centres I N E M E R G I N G E C O N O M Y A R E A S
or...
  stimulating development
in South Africa’s townships
...only months after the high-profile launch of the Pan Africa Shopping Centre, its anchor
tenant, a 2 800 m2 Pick n Pay franchise, is celebrating better-than-anticipated sales. Franchise
owner, Tshepho Ndlovu, attributes this to the taxi-retail node bringing valuable footfall and
disposable income to the mall.

“The people of Alexandra deserve a mall of this standard and they’re doing their shopping
here, instead of travelling long distances by taxi to other areas.”

Pan Africa Shopping Centre is fully let, with over 95% of its stores open for trading and
reporting good support from consumers. The taxis are operating from a 50 000 m2 taxi rank,
creating a vibrant synergy with the retailers – testament that the vision for the development
has translated into a resounding success.

Ndlovu believes the shopping centre is a valuable asset for Alexandra and he is confident that
community support for the centre will continue its upward trend. The Pick n Pay franchise
is actively involved in the Alexandra community, and Ndlovu says their recruitment policy
favours residents of Alexandra, with 71% of staff members coming from the community.

Some 80% of tenants comprise national retailers, of which a large number are represented
in Alexandra for the first time in the centre.

                                                                    18 August 2009 – www.eprop.co.za

...Mduduzi Nkosi, who owns the Bath House Hair & Beauty Spa shop, says he was forced by
business conditions to move from Dube, where he started his business four years ago, to
the new, classy Maponya Mall.

“I wanted my business to grow beyond the level that it was before. It’s much easier to make
a turnover of R10 0000 a month at Maponya Mall compared to where I was before in Dube,
because here I see many clients.”

                        3 February 2010 – www.businessday.co.za/articles/Content.aspx?id=9274

...the developer behind the R300 million expansion of Liberty Promenade Shopping Centre
hopes the work will not only benefit national and local retailers but businesses and residents
in the surrounding community. Situated in South Africa’s fourth largest township, Mitchell’s
Plain, the centre has proved an unmitigated success since opening in 2003.

Caswell Rampheri, MD of developer Liberty Property Development, said the addition of
some 24 000 m2 will make Liberty the biggest shopping centre in a previously disadvantaged
area in South Africa.

“The new development has been designed with the local community in mind. Our plans
demonstrate our commitment to bolster development in the area, be it entrepreneurship
or job creation. It will be a requirement for major contractors to include local suppliers in
the project wherever possible.”

It is believed about 33% of the project’s current workforce come from Mitchell’s Plain,
Khayelitsha and Phillipi. Among the retailers to benefit from the expansion will be small
business traders, who will be able to sell their goods from purpose-built units close to the
main entrance.

                   1 February 2010 – www.bus-ex.com/article/liberty-promenade-shopping-centre

                 I M PAC T O N L O C A L C O N S U M E R S , L O C A L B U S I N E S S E S
                                  AND THE LOCAL ECONOMY
                                                                                                       3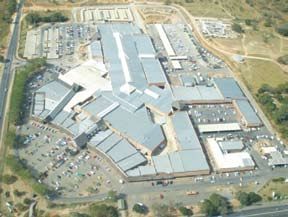
supply-side trends

                                                                        changes in the
                                                                   consumer landscape
                                                                              increases in income and living
                                                                           standards mean expenditure and
                                                                                  shopping patterns change

                                                            Between 2000 and 2008, there has been an upward
                                                            movement amongst black South Africans in terms of per
                                                            capita income – with average income increasing by 180%
    the research report upon which                          over the decade since 1998 – and in terms of movement
    this resource is based, called                          into higher tiers of the economic pyramid. It is anticipated
                                                            that this rising middle-income segment will increase to
    Impact of Township Shopping                             about 22 million people over the next 20 years.
    Centres: Market Research
    Findings and Recommendations,                           In addition, social grants, which represent a major monthly
    by Demacon Market Studies, is                           income source for more than 12 million people, have been
    available at                                            playing an increasingly important role in reducing poverty
                                                            and inequality in South Africa since 2000.The social security
    www.urbanlandmark.org.za.                               system has stimulated the upward movement of about
                                                            500 000 households from the bottom to higher tiers
                                                            of the economic pyramid. For example, in 2009, social
                                                            grants reduced the number of households that make up

                            T A K I N G S T O C K T H E D E V E L O P M E N T O F R etail
4                               centres I N E M E R G I N G E C O N O M Y A R E A S
supply-side trends
figure 1: per capita income per day and race: 2000 and 2008
per capita income and race: 2000 (‘000s) per capita income and race: 2008 (‘000s)
(percentage of adults) (percentage of adults)
100% 43 100% 45
725 548 1 478
1 802
519
80% 543 80% 1 882
1 560
1 500
1 016
Percentage adults
1 548
60% 719 60%
187
13 196 265
9 868 11 815
40% 40%
88 83
7 333 64
167 1 494
17
20% 27 20%
438
557
148
0% 0%
< R20 [R20, R140) [R140, R280) R280+ < R20 [R20, R140) [R140, R280) R280+
Black Coloured Indian White Black Coloured Indian White
source: Demacon ex-Eighty20, 2009
data based on All Media and Products Study (AMPS®), 2000 and 2008
midpoints of household monthly income bands used as average household income in calculation of per capita income
important note: household monthly income band sizes are not exactly the same in AMPS 2000 and 2008 – the
data are therefore not directly comparable; 2000 income values are inflated to 2008 values using CPIX
the lowest layer of the income per capita grouping – work activities – the remainder, over one-third, was
those earning less than R20 per day – from 5.3 million from social grants and other income. So even though
households to 4.4 million households. Further, the March 18 million South Africans still live on less than R20/day,
2008 Income and Expenditure Survey (IES) showed a noticeable and relatively stable shift has occurred in
that just more than 64% of the estimated annual gross the economic pyramid. This has resulted in an upward
income of all South Africans in 2005/06 came from movement along the national living standards profile
between 2006 and 2008, as measured by the Living
Standards Measure (LSM).
figure 2: growth in social grant recipients: 1996-2009
16,000,000
14,000,000 y = 2E+06e0.1685x
R2 = 0.96476
12,000,000
10,000,000
People
8,000,000
6,000,000
4,000,000
2,000,000
-
1996/97
1997/98
1998/99
1999/00
2000/01
2001/02
2002/03
2003/04
2004/05
2005/06
2006/07
2007/08
2008/09
source: Demacon ex-South African Social Security Agency (SASSA), 2008/09, Annual Statistical Report on Social Grants
I M PAC T O N L O C A L C O N S U M E R S , L O C A L B U S I N E S S E S
AND THE LOCAL ECONOMY
5figure 3: LSM trends, 2006-2008
20
17.9
percentage of national population 18
14.9 14.6 15.5
16 14.4
13.5
14 12.2 12.6
12
9.4 9.4
10 8.7
7.8 8.1
8 6.9 6.7
6.1 5.7 6 6.1
6
3.4
4
2
0
SU-LSM 1 SU-LSM 2 SU-LSM 3 SU-LSM 4 SU-LSM 5 SU-LSM 6 SU-LSM 7 SU-LSM 8 SU-LSM 9 SU-LSM 10
2006RA 2007B 2008A
note: RA, B and A refer to the specific SAARF AMPS® data sets used in the compilation of LSM trends
The shift of large numbers of people up the income
scale is creating a change in the country’s consumer
base. This positive trend, supported by the impact of the South African Advertising
social grants, has increased the financial stability within
Research Foundation’s (SAARF) Living
previously less well-off consumer environments, which
now appear more resilient to economic changes. Standards Measure is an internationally
recognised instrument designed to
The improvement in the national consumer landscape profile a market along a continuum
– with the emphasis on an emerging black middle of progressively more developed and
class that since 1994 has grown at about 50% per
sophisticated market segments.
year and now makes up 59% of South Africa’s middle-
income group – of which about 53% live in townships
– has resulted in higher levels of retail demand within it groups consumers according to their
previously disadvantaged areas. standard of living, using criteria such as
degree of urbanisation and ownership
And although a relatively large portion (47%) of this
of assets (mainly luxury goods such
market segment now live in suburbs, they maintain
strong linkages with the townships – which further as cars, and major appliances).
increases such demand.
When the national LSM profile is combined with retail
demand densities to indicate potential areas for retail The March 2008 IES shows that between 2000 and
investment, we see that although, and as we would 2005/06, black households’ share of consumption
expect, retail demand density is highest in the traditional expenditure rose from 42.9% to 44.3%.
economic nodes within South Africa’s provinces, high
retail demand densities are also found in rural and During this period, expectations, demands and shopping
township areas. preferences have also changed. The middle-income
market segment has a strong drive to acquire household
This reflects scope for retail investment in most of the appliances, cars and aspirational assets. In addition,
provinces’ ‘emerging economy’ areas. changing lifestyles are resulting in higher frequency visits
to retail centres and smaller shopping baskets per visit
The economic and social upward mobility of black – which in turn result in higher demand for, and greater
South Africans is further evidenced by spending power. variety of, convenience centres.
That of the black middle class – excluding access to
credit – stands at R180 billion a year, representing 26% Progressively more well-off consumers are increasingly
of the country’s total spending power. seeking a ‘shopping experience’ rather than visiting
stores to buy only basic essentials.
T A K I N G S T O C K T H E D E V E L O P M E N T O F R etail
6 centres I N E M E R G I N G E C O N O M Y A R E A Ssupply-side trends
changes in the actual supply of retail centres in ‘emerging economy’ areas
Turning now to the development trends around retail supply within ‘emerging economy’ areas of South Africa, we
describe the changes which have occurred between 1962 and 2009 – both nationally and provincially.
national development trends for ‘emerging economy’ retail centres
Nationally, between 1962 and 2009, 160 retail centres2 have been developed in ‘emerging economy’ areas – both
in township and rural areas – constituting about 2 million m2 of retail floor space. 35.1% of these centres were
developed pre-1994, while 64.9% were developed post-1994.
figure 4: number of retail centres developed in ‘emerging economy’ areas: 1962-2009
35
32
30
26
25
number
20 19 18
15
15
10
6
5
0
1962-1984 1985-1989 1990-1994 1995-1999 2000-2004 2005-2009
The majority (75.5%) of total retail floor space was developed post-1994, especially in the 1995-1999 period,
with 22.8% of total retail floor space developed, and between 2005 and 2009, when 37.6% of such space was
developed.
figure 5: total retail floor space developed in ‘emerging economy’ areas: 1962-2009
700 000
627,866
600 000
retail GLA (m2)
500 000
380 782.4
400 000
300 000 253 206
196 508
200 000 172 923
100 000 39 417
1962-1984 1985-1989 1990-1994 1995-1999 2000-2004 2005-2009
2
Only 117 of these retail centres (representing about 1.6 million m2 of retail floor space) are used to discuss the national development trends
detailed here, as these are addressed in terms of time line trends and development dates could not be obtained for the remaining 43 centres.
I M PAC T O N L O C A L C O N S U M E R S , L O C A L B U S I N E S S E S
AND THE LOCAL ECONOMY
7Over the 1962-2009 period, the average size of retail centres increased from a mere 6 500 m2 to nearly 20 000 m2
gross lettable area (GLA), with the smallest retail centres increasing from 2 200 m2 to 4 300 m2 retail GLA, and the
largest retail centres increasing from about 11 000 m2 to an impressive 65 000 m2 retail GLA.
figure 6: average size of retail centres in ‘emerging economy’ areas: 1962-2009
20 000 19 026.2
18 000
16 000
13 599.4 14 067.0
retail GLA (m2)
14 000
12 000 11 528.2 10 917.1
10 000
8 000 6 569.5
6 000
4 000
2 000
-
1962-1984 1985-1989 1990-1994 1995-1999 2000-2004 2005-2009
figure 7: smallest versus largest retail centres in ‘emerging economy’ areas: 1962-2009
70 000 65 000
60 000 54 500
53 581
50 000
retail GLA (m2)
41 447
40 000
30 115
30 000
20 000
11 000
10 000 4 278
2 276 2 873 2 158 3 000 2 774
-
1962-1984 1985-1989 1990-1994 1995-1999 2000-2004 2005-2009
smallest largest
Pre-1990, mostly local convenience and neighbourhood centres were developed. Post-1990, a stronger trend of
building community centres developed, while regional centres became part of the mix post-1994. (See table 1
for a classification of the different types of shopping centres, while figures 8 and 9 detail the periods during which
different types of centres were mostly developed.)
T A K I N G S T O C K T H E D E V E L O P M E N T O F R etail
8 centres I N E M E R G I N G E C O N O M Y A R E A Ssupply-side trends
table 1: shopping centre hierarchy3 - classifying different types of centres and their defining elements
size, no of shops,
type & example defining elements main tenant type
regional centre trade area ± 50 000 m2 - 100 000 m2
large region of city / whole city
Maponya Mall, Soweto, Gauteng access requirements 150 - 250 stores
major arterial road, usually a provincial main road
linking to a national road large supermarket / hyper
2 or more large clothing anchors
no. of households and socioeconomic groups
small clothing or boutiques
28 600 - 57 150; all - LSM 4-10
entertainment, restaurants
average radius services
8 km convenience
median travel time
14-20 minutes
minor regional centre trade area ± 25 000 m2 - 50 000 m2
specific sub-region of city (can be large, self-
Liberty Promenade, Khayelitsha, contained community, e.g. Chatsworth) 75 - 150 stores
Western Cape access requirements
major suburban arterial road linking to large supermarket
Jabulani Mall, Soweto, Gauteng
provincial highway 1 or 2 large clothing anchors
Central City, Mabopane, Gauteng strong national tenant comparison
no. of households and socioeconomic groups
goods component
17 800 - 35 700; all - LSM 4-10
boutiques
average radius restaurants
5 km entertainment
median travel time services
10-16 minutes
community centre trade area ± 12 000 m2 - 25 000 m2
strategically located to serve suburban community
Thula Plaza, Bushbuckridge, Mpumalanga access requirements 50 - 100 stores
Soshanguve Plaza, Soshanguve, major arterial road
large supermarket
North West no. of households and socioeconomic groups
convenience
8 500 - 17 800; all - LSM 4-10
Nyanga Junction, Manenberg, small national clothing
average radius restaurant and takeaways
Western Cape
3 km services
median travel time
6-14 minutes
neighbourhood centre trade area ± 5 000 m2 - 12 000 m2
strategically located for a group of suburbs
Tzaneen Crossing, Tzaneen, Limpopo access requirements 25 - 50 stores
Lenasia Square, Johannesburg, Gauteng major collector roads
supermarket
no. of households and socioeconomic groups
Station Plaza, Mitchell’s Plain, convenience
2 400 - 5 700; all - LSM 4-10
Western Cape some small, specialised stores
average radius
2 km
median travel time
4-9 minutes
local convenience centre trade area ± 1 000 m2 - 5 000 m2
one suburb / parts of a suburb(s)
Mabopane Sun Plaza, Mabopane, access requirements: 5 - 25 stores
North West minor collector road
supermarket
Oasis Mall, Tzaneen, Limpopo no. of households and socioeconomic groups
a few convenience stores
700 - 3 600; all - LSM 4-10
Meadow Point, Soweto, Gauteng average radius
1.5 km
median travel time
3 minutes
3
The applicability of this retail hierarchy in ‘emerging economy’ areas where the market is largely immature is debatable. There are, however, an increasing
number of examples of successfully competing developments in ‘emerging economy’ markets characterised by higher consumer demand thresholds, for
instance Soshanguve, Soweto, Orange Farm and Sebokeng, where multiple centres have emerged in recent years and coexist synergistically. These examples
mainly represent urban township areas where markets are maturing more rapidly due to a growing middle class and the increased safety net of social grants.
I M PAC T O N L O C A L C O N S U M E R S , L O C A L B U S I N E S S E S
AND THE LOCAL ECONOMY
9figure 8: functionality of retail centres in ‘emerging economy’ areas – number: 1962-2009
16
14
14 13
12
10
10 9
number
8
8 7 7
6
6 5 5 5
4
4 3 3 3 3
2 2 2 2
2 1 1
0
1962-1984 1985-1989 1990-1994 1995-1999 2000-2004 2005-2009
regional minor regional community neighbourhood local convenience
figure 9: functionality of retail centres in ‘emerging economy’ areas – percentage: 1962-2009
100 6.5
7.4
90 16.7
26.7
33.3
80 32.3
50.0
70
percentage (%)
38.9 51.9
60
50 27.8
46.7
40 41.9
30
50.0 33.3 27.8
20 44.4
20.0
10 16.1
6.7 7.4 11.1
0 3.2
1962-1984 1985-1989 1990-1994 1995-1999 2000-2004 2005-2009
regional minor regional community neighbourhood local convenience
As figure 10 shows, the average number of shops within retail centres developed in ‘emerging economy’ areas in
South Africa between 1962 and 2009 increased to just over 50 during the pre-1994 period, from which it declined
to fewer than 45 between 1995 and 1999, rising again to nearly 60 between 2005 and 2009.
The map in figure 11 illustrates the geographic location, total retail floor space and date of development of the
main retail centres developed in ‘emerging economy’ areas in South Africa between 1962 and 2009, while figures
12 and 13 provide a time line of retail centre development in ‘emerging economy’ areas for the pre-1994 and post-
1994 periods, respectively. The 1995-2009 period reflects an increase in both the number and functionality of malls
developed, over the earlier period, suggesting a maturing of the retail market.
T A K I N G S T O C K T H E D E V E L O P M E N T O F R etail
10 centres I N E M E R G I N G E C O N O M Y A R E A Ssupply-side trends
figure 10: average number of shops in retail centres in ‘emerging economy’ areas: 1962-2009
70
58.4
60
50.3 50.2 49.4
50
42.3
number
40
30
22.5
20
10
0
1962-1984 1985-1989 1990-1994 1995-1999 2000-2004 2005-2009
figure 11: main retail centres developed between 1962 and 2009
LIMPOPO Twin City
54 500 m2
developed: 1998
Central City Trade Route Mall
52 000 m2 42 550 m2
Bafokeng Plaza developed: 1996 developed: 2006
27 000 m2
developed: 1987 Maponya Mall Tsakane Mall
refurbished: 2008 65 000 m2 33 616 m2
developed: 2006 developed: 2008
NORTH WEST GAUTENG
MPUMALANGA
Jabulani Mall
44 355 m2 Setsing Plaza
developed: 2006 26 154 m2
Mega City Mmabatho developed: 1989
46 846 m2 refurbished: 2002
developed: 1986
refurbished: 2004
FREE STATE KWAZULU NATAL
NORTHERN CAPE
Chatsworth Centre
41 447 m2
developed: 1988
EASTERN CAPE
Liberty Promenade Westgate Mall
53 581 m2
developed: 2003 30 115 m2 Mdantsane City
refurbished: 2005 developed: 1990 35 849 m2
WESTERN CAPE developed: 2008
I M PAC T O N L O C A L C O N S U M E R S , L O C A L B U S I N E S S E S
AND THE LOCAL ECONOMY
11figure 12: retail centre development in ‘emerging economy’ areas: 1962-1994
retail GLA (m2)
- 5 000 10 000 15 000 20 000 25 000 30 000 35 000 40 000 45 000
Renckens Centre, KwaZulu-Natal 11 000
Stanger Spar Centre, KwaZulu-Natal 3 800
Westridge Centre, Western Cape 4 278 Pre-1984
Umlazi Mall, KwaZulu-Natal 10 850
Opera Place - Sonata Lane, Western Cape 2 276
Shoprite Centre - Westonaria, Gauteng 7 213
Darklight City Centre, Gauteng 5 000
Pick ‘n Pay Town Centre - Mitchell’s Plain, Western Cape 5 142
Gamaphuteng Shopping Centre, Gauteng 3 700
Ithala Centre - Ulundi, KwaZulu-Natal 14 903
Taung Forum Centre, North West 10 091
Protea Point, Gauteng 2 873
27 000 1985 - 1989
Bafokeng Plaza, North West
Foro Shopping Complex, North West 3 500
Lenasia Square, Gauteng 8 441
Mtuba Plaza, KwaZulu-Natal 7 527
Chatsworth Centre, KwaZulu-Natal 41 447
The Mall 7 544
Pimville Square, Gauteng 3 651
Shoprite Centre - Sibasa, Limpopo 5 950
Setsing Shopping Centre, Free State 26 154
Kagiso Shopping Centre, Gauteng 8 297
Westgate Mall, Western Cape 30 115
Sundumbili, KwaZulu-Natal 13 809
Sonata Lane, Western Cape 2 158
Ixopo Mall, KwaZulu-Natal 3 500
Nongoma Plaza, KwaZulu-Natal 10 238
Giyani Plaza, Limpopo 9 442
Siyabuswa Shopping Centre, Mpumalanga 7 375
Taxi City, Eastern Cape 4 930
12 179 1990 - 1994
Acornhoek Plaza, Mpumalanga
Acornhoek Plaza, Mpumalanga 14 680
Metropolitan Gateway, Gauteng 6 439
Nyanga Junction, Western Cape 10 071
Circus Triangle, Eastern Cape 16 157
Bushbuckridge Centre, Mpumalanga 14 640
Acornhoek Centre, Mpumalanga 5 363
Kwagga Plaza, Mpumalanga 21 267
Metropolitan Centre, Mpumalanga 5 848
T A K I N G S T O C K T H E D E V E L O P M E N T O F R etail
12 centres I N E M E R G I N G E C O N O M Y A R E A Ssupply-side trends
figure 13: retail centre development in ‘emerging economy’ areas: 1995-2009
retail GLA (m2)
- 10 000 20 000 30 000 40 000 50 000 60 000 70 000
Rhino Plaza, KwaZulu-Natal 7,552
OK Bazaars, Western Cape 10,428
Masingita Centre, Limpopo 5,430
Kopanong Centre - Hammanskraal, Limpopo 8,661
Sheshego Plaza, Limpopo 9,500
Twin City - Blue Haze Shopping Centre, Mpumalanga 54,500
The North West Mall, North West 13,859
Dobson Point, Gauteng 3,063
King Williams Town Market Square, Eastern Cape 13,264
Jane Furse Plaza, Mpumalanga 15,178
Central City Shopping Centre, Gauteng 52,000
Rhino Plaza - Umzimkhulu, KwaZulu-Natal 5,410
Metlife Mall, Eastern Cape 17,719 1995 - 1999
Motherwell Shopping Centre, Eastern Cape 11,127
Mvusuludzo, Limpopo 19,292
Thula Plaza, Mpumalanga 11,404
Twin City - Bushbuckridge, Mpumalanga 22,306
Game Centre Mafikeng, North West 5,218
Mabopane Sun Plaza, Gauteng 3,000
Kuyasa Shopping Centre, Eastern Cape 7,513
Kuyasa Shopping Centre, Eastern Cape 9,100
Bochum and Blouberg Plaza, Limpopo 7,188
Kamaqhekeza Plaza, Mpumalanga 14,480
Komati Spar Centre, Mpumalanga 6,482
Ra-A-Hola Centre, Free State 14,745
Mafikeng Plaza, North West 5,500
Ithala Centre Makhatini, KwaZulu-Natal 4,256
Cofimba Shopping Centre, Eastern Cape 4,496
Twin City, Mpumalanga 18,029
Morone Shopping Centre, Mpumalanga 13,482
Ithala Centre - Mbazwana, KwaZulu-Natal 2,865
Idutywa, Eastern Cape 4,403
Mamelodi Crossing, Gauteng 23,000
Sebokeng Plaza, Gauteng 5,778
Kopanong Shopping Centre, Gauteng 3,994
Shoprite Centre - Makhaza, KwaZulu-Natal 9,942 1999 - 2004
Liberty Promenade, Western Cape 53,581
Matsamo Plaza, Mpumalanga 7,577
Galeshewe Plaza, Northern Cape 2,774
Tembisa Plaza, Gauteng 18,248
Mkhulu Plaza, Limpopo 8,252
Mafikeng Station, North West 7,370
Mega City - Mmabatho, North West 46,846
Temba City Shopping Centre, North West 18,313
Protea Gardens, Gauteng
17,400
Palm Springs Mall, Gauteng 15,760
Khayelitsha Mall, Western Cape 19,254
Zihyabuya Shopping Centre, Eastern Cape 10,659
Lephalale Square, Limpopo 7,000
KaNyamazane Shopping Centre, Mpumalanga 14,000
Maponya Mall, Gauteng 65,000
Jabulani Mall, Gauteng 44,355
Atlyn Centre, Gauteng 28,000
Trade Route Mall, Gauteng 42,550
Dube Village Mall, Gauteng 7,346
Umlazi Mega City, KwaZulu-Natal 28,000
Shoprite Centre, Limpopo 4,278
Moutse Mall, Mpumalanga 13,500
The Crossing Centre, Mpumalanga 28,500
Diepsloot Mall, Gauteng 11,345
Thabong Centre, Gauteng 18,071 2005 - 2009
Shoprite Centre - Mfuleni, Western Cape 4,539
Masingita Mall, Limpopo 11,342
Hubyeni Shopping Centre, Limpopo 12,868
Moratiwa Crossing, Limpopo 12,359
Nzhelele Shopping Centre, Limpopo 5,395
Kabokweni Plaza, KwaZulu-Natal 14,861
Rainbow Village Centre, North West 5,000
Phumulani Mall, Gauteng 17,500
Tsakane Mall, Gauteng 33,616
Mdantsane City, Eastern Cape 35,849
Kings Mall, Eastern Cape 10,000
Kwantu Shopping Centre 5,163
Maake Plaza, Limpopo 15,856
Nkomazi Plaza, Mpumalanga 20,000
The Crescent Shopping Centre, Free State 18,500
Gugulethu Square, Western Cape 30,000
I M PAC T O N L O C A L C O N S U M E R S , L O C A L B U S I N E S S E S
AND THE LOCAL ECONOMY
13provincial development trends for ‘emerging economy’ retail centres
The following figures illustrate the trends for retail centre development in ‘emerging economy’ areas in South Africa
between 1962 and 2009, on a provincial basis.
The first ‘emerging economy’ retail centres were developed in KwaZulu-Natal in 1962, followed by the Western
Cape in 1978 and Gauteng in 1984. North West Province saw its first retail centre development in 1986, followed
by the Eastern Cape in 1988 and Limpopo Province and the Free State both in 1989. Mpumalanga, in 1992, had
the most recent development.
At 32, Gauteng has the highest number of retail centres in ‘emerging economy’ areas, followed closely by KwaZulu-
Natal with 28. Limpopo has 21 centres, the Eastern Cape and Mpumalanga both 18, Limpopo 17 and the Western
Cape 15. The Free State has only 5 centres, while no retail developments have taken place in the Northern Cape’s
‘emerging economy’ areas
figure 14: total number of ‘emerging economy’ retail centres per province
35 32
30 28
25
21
number
20 18 18
17
15
15
10
5
5
0
Free State
Western Cape
North West
Eastern Cape
Mpumalanga
Limpopo
KwaZulu-Natal
Gauteng
figure 15: percentage provincial contribution to total national retail floor space in ‘emerging economy’ areas,
plus total retail floor space contributed by ‘emerging economy’ retail centres per province
494 300
30
25.5
25
203 625
201 278.8
percentage (%)
20
223 557.9
286 197
265 334
14.8
13.7
73 989
15
11.5
10.4 10.5
9.7
10
188 141
3.8
5
-
Eastern Cape
KwaZulu-Natal
Free State
Mpumalanga
Limpopo
North West
Western Cape
Gauteng
total retail floor space - retail GLA (m2)
T A K I N G S T O C K T H E D E V E L O P M E N T O F R etail
14 centres I N E M E R G I N G E C O N O M Y A R E A Ssupply-side trends
Where total retail floor space is concerned (see figure 15), Gauteng ranks first, with 494 300 m2 gross lettable retail
area, followed by Mpumalanga with 286 197 m2 and KwaZulu-Natal with 265 334 m2.. Limpopo has 223 557.9 m2
retail GLA, the Western Cape 203 625 m2, North West province 201 278.8 m2 and the Eastern Cape 188 141 m2.
The Free State exhibits a fairly low figure of 73 989 m2 retail GLA in its ‘emerging economy’ areas.
Figure 15 also shows that Gauteng accounts for 25.5% of the total national ‘emerging economy’ retail floor space,
Mpumalanga for 14.3%, North West province for 13.7% and KwaZulu-Natal for 13.2%. Limpopo contributes 11.1%
to such retail floor space, while the Western Cape contributes 10.1%, the Eastern Cape 9.4% and the Free State
a mere 3.7%.
figure 16: average ‘emerging economy’ retail centre size per province
18 000
16 000 15 446.9
14797.8 15 063.0
14 377.1
14 000
12 726.6
12 000
9 902.2 10 161.7
retail GLA (m2)
10 000 9 149.4
8 000
6 000
4 000
2 000
-
KwaZulu Natal
Eastern Cape
Limpopo
Western Cape
North West
Free State
Mpumalanga
Gauteng
In terms of average centre size (see figure 16), Gauteng has the largest average size of almost 15 500 m2, followed by
Mpumalanga with just over 15 000 m2 and the Free State with just under 15 000 m2. North West’s average centre
size is somewhat above 14 000 m2, while the Western Cape comes in at slightly below 13 000 m2, and Limpopo
at just above and the Eastern Cape at just below 10 000 m2. KwaZulu-Natal’s average centre size is a little over
9 000 m2.
Figure 17 shows that Gauteng has both the smallest and the largest centre sizes, with 2 000 m2 and 65 000 m2 retail
GLA, respectively. In general, in South Africa, the smallest shopping centres vary between 2 000 m2 and 5 848 m2,
while the largest vary between 19 292 m2 and 65 000 m2 retail GLA.
From figure 18 it is clear that Gauteng reflects the most diverse functionality – including regional, minor regional,
community, neighbourhood and local convenience centres – followed by KwaZulu-Natal, the Western Cape, North
West province and Mpumalanga. The Eastern Cape, Limpopo and the Free State reflect less diverse functionality
profiles, with only community, neighbourhood and local convenience centres. (Refer to table 1 for a classification of
these different types of centres and their defining elements.)
An increase in average retail centre size and more diverse functionality are reflections of the increasing maturity of
the retail market, which is a result of the changing size of the economy and demand conditions in each of these
areas.
I M PAC T O N L O C A L C O N S U M E R S , L O C A L B U S I N E S S E S
AND THE LOCAL ECONOMY
15figure 17: smallest versus largest ‘emerging economy’ retail centres per province
70 000 65 000
60 000 54 500
53 581
50 000 46 846
retail GLA (m2)
41 447
40 000 35 849
30 000 26 154
19 292
20 000
10 000 5 848 2 774
5 034 2 923
2 803 2 050 2 158 2 000
-
Limpopo
Free State
Eastern Cape
KwaZulu-Natal
North West
Western Cape
Mpumalanga
Gauteng
smallest largest
figure 18: functionality of ‘emerging economy’ retail centres by province: percentage distribution
100 4.5 5.3
11.8
90
28.1 31.3 31.6
80 34.5
31.6
50.0
70
percentage (%)
41.2
60 63.6
31.1
50
37.5 42.1
40 51.7
57.9 29.4
30 21.9
50.5
20 25.0 31.8
10 12.5 26.3
6.9 17.6
0 6.3 6.9 6.3 5.3
Gauteng
KwaZulu-Natal
Western Cape
Eastern Cape
Limpopo
Mpumalanga
Free State
North West
regional minor regional community neighbourhood local convenience
Table 2 illustrates that supermarkets represent the top anchors in ‘emerging economy’ retail centres in the provinces,
except for KwaZulu-Natal, where Ithala Bank is the top anchor, and the Eastern Cape, where it is Pep. Shoprite and
Spar supermarket chains dominate, followed by Score and Pick ‘n Pay. Pep dominates as the main clothing anchor,
followed by Jet and Woolworths.
Ithala Bank, Standard Bank and FNB are amongst the top five anchor tenants in KwaZulu-Natal, the Eastern Cape
and Limpopo, respectively, while Boxer and Rhino Cash ‘n Carry are also amongst the top five anchor tenants in
KwaZulu-Natal and Eastern Cape.
T A K I N G S T O C K T H E D E V E L O P M E N T O F R etail
16 centres I N E M E R G I N G E C O N O M Y A R E A Ssupply-side trends
table 2: dominant anchor tenants by province
Western Eastern Mpuma- North
Gauteng KZN Limpopo langa Free State West
Cape Cape
Shoprite Ithala Bank Shoprite Pep Spar Score Pep Shoprite
1
15.4% 12.2% 21.9% 14.1% 12.9% 11.5% 9.4% 18.4%
Score Pep Jet Shoprite Pep Pep Shoprite Score
2
10.3% 11.3% 9.4% 8.5% 9.7% 8.2% 9.4% 13.2%
Boxer Cash ‘n
Pep Shoprite Pep Jet Shoprite Spar
3 Carry
6.4% 6.1% 9.4% 8.1% 8.2% 10.5%
5.6%
Spar Spar Pick n Pay Spar Shoprite Spar Edgars
4
6.4% 6.1% 9.4% 5.6% 8.1% 8.2% 7.9%
Diskom
Ellerines
Ackermans
Rhino Cash & Jet FNB
Woolworths Spar Edgars Jet
5 Carry Pick n Pay Score
5.1% Woolworths 6.6% 7.0%
5.2% Standard Bank 6.5%
6.3%
Woolworths
4.2%
PIC spearheads investments
general supply trends in townships
There are also some general trends underlying retail PIC head of properties Wayne van der
centre development in ‘emerging economy areas’, Vent says when the PIC started investing in
which further explain the growth of a retail footprint in townships in 1997, not much was happening.
previously under-serviced areas of South Africa. “In Soweto it is only in the last five to six
years that everything started to explode.”
emerging retail boom
The PIC’s portfolio consists of 26 retail centres in
For more than a decade now, an increasingly strong townships, with 350 000 m2 GLA. Van der Vent
focus has been placed on the development of high- says 11 years ago there was not even 50 000 m2
density commercial nodes in ‘emerging economy’ areas GLA in total. This indicates the retail growth taking
– predominantly located in areas characterised by high place in these areas.
levels of accessibility – which frequently incorporate
However, he emphasises that this phenomenon
public transport nodes and stations.
was largely only true for the retail market, with
In general, these commercial developments consist of investment in the office and residential markets
retail centres, supported by office space (private and limited due to supply and demand aspects.
public sector focus) and community facilities, surrounded In addition, Van der Vent notes the importance
by higher density residential developments. of government commitment and investment
to assist in the development of these
Originally these nodes were strongly based on public ‘emerging economy’ markets.
sector investment; however, since the late 1990s, private
sector-led investment in these nodes has become source: www.thepropertymag.co.za
evident, and South African townships have emerged Township Investments, 2009
as the new market for national retailers, especially
supermarket chains.
This trend emerged as a result of changed perceptions
The progressive movement of retailer chains into regarding the consumer market in ‘emerging economy’
previously untapped middle- and lower- income markets areas, with retailers starting to acknowledge after 1994
has resulted in a substantial increase in shopping mall that consumer expenditure is related to the level of
development. consumer income (LSM profile).
I M PAC T O N L O C A L C O N S U M E R S , L O C A L B U S I N E S S E S
AND THE LOCAL ECONOMY
17Changes in the general income profile in ‘emerging retail centre performance in
economy’ areas have also led to the rise of a prosperous ‘emerging economy’ areas
middle class, with high aspirational values and a demand
for luxury items. The success of shopping centres in ‘emerging economy’
areas is evident from their growth in retail sales and trading
Due to the high level of developments in the more densities. For example, retailers at Umlazi Mega City in
established middle-income suburbs and the stagnation Durban were achieving high turnovers into 2008 despite
of these markets, developers started to shift their focus the series of interest rate hikes implemented during the
to underdeveloped ‘emerging economy’ and rural global economic downturn and the introduction of the
areas. National Credit Act in June 2007. Another indication of
growth there was evident in the request by the local taxi
This resulted in the creation of a retail footprint in association for additional rank space6.
previously under-serviced areas, especially townships
– a trend which is clearly prompted by burgeoning
township economies. The proliferation of retail outlets
township shopping centres
in townships in the vicinity of South Africa’s major towns
and cities is proof of this. and the global financial crisis
The first modern township mall was built in Dobsonville, Des de Beer, MD of the Resilient
Soweto, in 1994, for less than R10 million. Since then Property Group, says township shopping
the rise of township shopping centres has forced centres have generally weathered
marketers to consider them a real force in the retail the consumer downturn better than
industry. Shopping centres like Maponya Mall in Soweto4 their suburban counterparts.
are now developed at costs of up to R700 million. “However, retail sectors such as some
takeaway chains, and stores selling
In the townships adjacent to Cape Town one can now non-essential items, such as homeware
find Nyanga Junction Mall, Vangate Mall, Westgate Mall, and furniture, have taken strain.”
Mitchell’s Plain Town Centre and Khayelitsha Mall.
Director of Zenprop Adam Blow also
Durban has Umlazi and Dube Village malls, while says they are satisfied with performance
Gauteng boasts Maponya Mall, Jabulani Mall, Dobsonville under current economic conditions.
Mall, Protea Gardens and Bara Mall, amongst others.
“About 7% of our stores are trading below
Areas such as Port Elizabeth’s Motherwell township par – but we are comfortable with this level,
(Motherwell Mall) and Polokwane’s Seshego township since a number of those tenants have never
(Zone 4 Plaza Mall) are all catching up with the trend of traded in a formal retail environment.”
mushrooming township malls5. source: Finweek. J Muller. Township trade:
pumping or slumping? October 2009
The sudden surge of demand for space over the past few
years is indicative of how well these centres are trading.
table 3: retail centre performance – Umlazi Mega City, Maponya Mall and Vangate Mall
Umlazi Mega City
Umlazi, Durban • 17% growth in retail sales between end-2006 and end-2007
• retailers achieving trading densities > R20 000 / m2 per year
35 000 m2
Maponya Mall
Soweto, Johannesburg • R80 million turnover / month
• R930 million gross turnover for 1st year of operation – only 3% below target
66 000 m2
Vangate Mall
Athlone, Cape Town • average trading density of R27 000 / m2 per year; the industry average is
R20 000 - R22 000 / m2 per year
33 000 m2
4
Creative Intelligence. The rise of township shopping malls. April 2009.
5
S. Mabotja. Retail footprint: developers are making strides in the townships. May 2008. www.cms.privatelabel.co.za.
6
Eprop. SA Corporate Real Estate Fund. Umlazi residents set to buy 25% stake in township mall. January 2008.
T A K I N G S T O C K T H E D E V E L O P M E N T O F R etail
18 centres I N E M E R G I N G E C O N O M Y A R E A SYou can also read