The age of choice:developing countries in the new aid landscape
←
→
Page content transcription
If your browser does not render page correctly, please read the page content below
The age of choice:developing
countries in the new aid
landscape
A synthesis report

Romilly Greenhill, Annalisa Prizzon and Andrew Rogerson

                                              Working Paper 364
                                 Results of ODI research presented
                                  in preliminary form for discussion
                                               and critical comment

          Shaping policy for development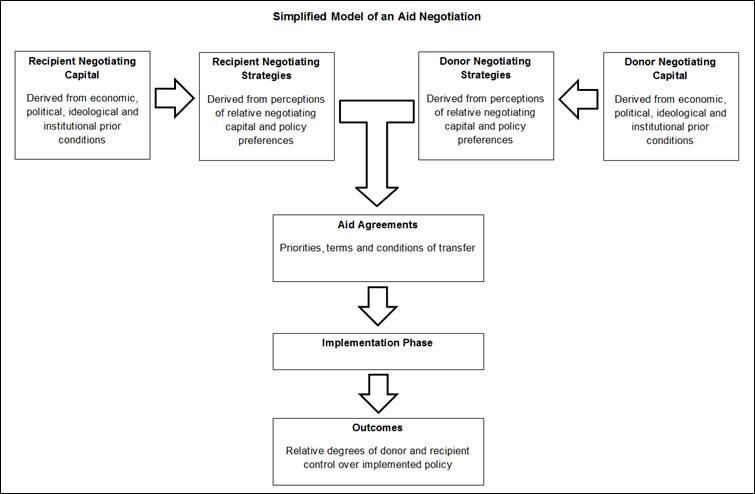
Working Paper 364

               The age of choice:
  developing countries in the new aid landscape
                                    A synthesis report

 Romilly Greenhill, Annalisa Prizzon and Andrew Rogerson

                                        January 2013

ODI
203 Blackfriars Road,
London
SE1 8NJ
www.odi.org.uk

* Disclaimer: The views presented in this paper are those of the author(s) and do not necessarily
represent the views of ODI, DFID or AusAid
ISBN 978 1 909464 07 0
Working Paper (Print) ISSN 1759 2909
ODI Working Papers (Online) ISSN 1759 2917

© Overseas Development Institute 2012

Readers are encouraged to quote or reproduce material from ODI Working Papers for their own publications, as long as they are not
being sold commercially. For online use, we ask readers to link to the original resource on the ODI website. As copyright holder, ODI
requests due acknowledgement and a copy of the publication.

ii
Contents

1  Introduction and rationale behind the study                                                  1
2  The new aid landscape: trends in TDA and NTDA                                                4
    2.1 Defining TDA and NTDA                                                                   4
    2.2 A first-cut global estimate of development assistance flows                             9
3 Case study theoretical framework and methodology                                             14
4 Introduction to the country case studies                                                     18
    4.1 Why these countries? Case study selection                                              18
    4.2 Contextual information about the case study countries                                  19
5 Case study findings                                                                          22
    5.1 All countries are receiving flows from NTPs, and the volume has increased significantly
         over the past decade                                                                  22
    5.2 Partner countries welcome more choice and more finance                                 24
    5.3 Ownership, alignment and speed are key priorities                                      26
    5.4 Ethiopia and Cambodia are taking a strategic approach to the division of labour between
         traditional and non-traditional providers                                             28
    5.5 Ethiopia and Cambodia show limited interest in including NTPs in aid coordination
         mechanisms; this is less true for Zambia                                              29
    5.6 Philanthropic and social impact investment flows are small and not yet changing the aid
         landscape significantly                                                               31
    5.7 Countries’ ability to attract and manage climate finance appears to depend heavily on
         their own strategy                                                                    31
6 Conclusions and policy recommendations                                                       33
    6.1 Key findings on government priorities                                                  33
    6.2 Policy recommendations                                                                 35
References                                                                                     37
Annex 1: Comparing economic and governance contexts in Cambodia, Ethiopia,
and Zambia                                                                                     41
Annex 2: TDA and NTDA, by country ($ millions, current)                                        44

iii
Tables and figures Table 1: A taxonomy of development assistance 8 Figure 1: Mapping traditional and non-traditional development assistance flows 9 Figure 2: Trends in development assistance flows, 2000 and 2009 ($ billions) 10 Figure 3: Share of overall NTDA by main actor, 2000 and 2009 11 Figure 4: Simplified model of and aid negotiation 15 Figure 5: Traditional and non-traditional flows in the three countries, 2002-2009 ($ millions) 23 Figure 6: Composition of non-traditional flows in the three countries, 2007-2009 average 24 iv
Acknowledgements
The authors would like to thank Matthew Geddes, who provided excellent background data analysis
to inform the global and country-level estimates, and Maia King, who contributed to the Cambodia
case study and conducted the in-country research. Thanks are also owed to interviewees in
Cambodia, Ethiopia and Zambia, who generously gave up their time to contribute to this report. We
would also like to thank the Council for the Development of Cambodia, which facilitated interviews
and helped frame the research in Cambodia; and Mohammed Mussa and Chrispin Matenga, who
provided very valuable research support in Ethiopia and Zambia, respectively. Finally, we would
like to thank Andrew Norton and Edward Hedger at the Overseas Development Institute, who
provided very valuable peer review comments on the report.

This report was generously funded by the UK’s Department for International Development and the
Australian Agency for International Development. The usual disclaimers apply.

v
Acronyms
ADB        Asian Development Bank
AfDB       African Development Bank
Afrodad    African Network on Debt and Development
ASEAN      Association for South-east Asian Nations
BRICS      Brazil, Russia, India, China and South Africa
CCM        Country Coordinating Mechanism
CPA        Country Programmable Aid
CPI        Climate Policy Initiative
CRS        Creditor Reporting System
CSO        Civil Society Organisation
CSR        Corporate Social Responsibility
DAC        Development Assistance Committee
DAG        Development Assistance Group
DCI        Development Cooperation Ireland
DFI        Development Finance Institution
DFID       Department for International Development
ECOSOC     Economic and Social Council
EITI       Extractive Industries Transparency Initiative
EoDB       Ease of Doing Business
EPRDF      Ethiopian People's Revolutionary Democratic Front
ERR        Economic Rate of Return
ESCAP      Economic and Social Commission for Asia and the Pacific
EU         European Union
FDI        Foreign Direct Investment
FDRE       Federal Democratic Republic of Ethiopia
GAVI       Global Alliance for Vaccines and Immunisation
GDP        Gross Domestic Product
GEF        Global Environment Facility
GNI        Gross National Income
GTP        Growth and Transformation Plan
HDI        Human Development Index
HIPC       Heavily Indebted Poor Countries
IAD        Institutional Analysis and Development
IADB       Inter-American Development Bank
IBRD       International Bank for Reconstruction and Development
IDA        International Development Association
IFC        International Finance Corporation
IMF        International Monetary Fund
IPEA       Institute for Applied Economic Research (Brazil)
LIBOR      London Inter-bank Offered Rate
LIC        Lower-income Country
MDB        Multilateral Development Bank
MDG        Millennium Development Goal
MDRI       Multilateral Debt Relief Initiative
MIC        Middle-income Country
MoFED      Ministry of Finance and Economic Development (Ethiopia)
MoFNP      Ministry of Finance and National Planning (Zambia)
NGO        Non-governmental Organisation
NSDP       National Strategic Development Plan
NTDA       Non-traditional Development Assistance
NTP        Non-traditional Provider
ODA        Official Development Assistance
ODI        Overseas Development Institute
OECD       Organisation for Economic Co-operation and Development
vi
OOF     Other Official Flow
PFM     Public Financial Management
PPP     Public–private Partnership
RGC     Royal Government of Cambodia
TDA     Traditional Development Assistance
UK      United Kingdom
UN      United Nations
UNDP    UN Development Programme
UNECA   UN Economic Commission for Africa
US      United States

vii
Executive summary
The aim of this paper is explore the implications of the new and complex aid landscape for
developing country governments. In 2000, development assistance was overwhelmingly provided
by traditional bilateral and multilateral donors, which provided aid in specific ways and according to
a particular set of norms. Today, this is being complemented by the growth of other forms of
development assistance, including from non-Development Assistance Committee (DAC) donors,
climate finance funds, social impact investors, philanthropists and global funds, as well as less
concessional flows.
This study explores the challenges and opportunities this new landscape presents to developing
country governments. It does this in three ways:
First, it provides a provisional taxonomy of the various forms of development assistance, including
the less traditional flows.
Second, it uses this taxonomy to provide a first-cut estimate of the volume, composition and recent
trends in development assistance.
Third, it summarises the findings of three country case studies in Cambodia, Ethiopia and Zambia.
These studies seek to understand:
The volume and composition of flows at country level;
The priorities governments have in managing them;
The fora in which governments seek to engage with different groups of providers 1; and
The extent to which governments have been successful in meeting their objectives.
The taxonomy we present defines total development assistance as all flows that are cross border,
channelled to developing countries, have some level of concessionality and are provided with a
public interest purpose. This includes traditional official development assistance (ODA). It also
includes elements considered more innovative, newer or less traditional, and which may not meet
strict ODA definitions (although some do.) This includes non-DAC assistance, philanthropy, social
impact investment, global funds, climate finance, and, in our ‘upper-bound’ estimates, other official
flows (OOFs). We present this taxonomy not as a definitive product, but as a first-cut estimate for
further feedback and discussion. In particular, lack of information on concessionality levels of much
non-traditional development assistance means it is difficult to track exactly which flows might fit into
this category.
Second, we provide a provisional estimate of the total volume and composition of traditional
development assistance (TDA) and non-traditional development assistance (NTDA) at global
level, including trends since 2000. We find that development assistance flows grew substantially
between 2000 and 2009, and their composition has shifted heavily towards what we here call ‘non-
traditional’ sources. We find that:
According to our more conservative, or ‘lower-bound’, estimate, which excludes OOFs, total
development assistance grew from $64.8 billion to $173.3 billion between 2000 and
2009. In 2000, the ‘non-traditional’ component of these flows was only $5.3 billion, or 8.1%
of the total. By 2009, non-traditional flows had increased tenfold to $53.3 billion, making up
30.7% of total development assistance.
Our less conservative, or ‘upper-bound’, estimate, which includes OOFs, suggests that total
development assistance grew from $77.1 billion to $213.5 billion between 2000 and
1 We use the word ‘provider’ in this report to refer to all those actors providing development assistance, including DAC
and non-DAC donors, philanthropists, social impact investors and global funds. We deliberately do not use the word
‘donor’, as many of these providers do not see themselves as donors in the traditional sense.
viii2009. In 2000, NTDA was $17.6 billion; by 2009 it had grown to $93.5 billion,2 a fivefold
increase. NTDA by this expanded definition rose from 22.8% of total development
assistance in 2000 to 43.8% in 2009.
Third, we draw on country case studies in Cambodia, Ethiopia and Zambia to explore the
challenges and opportunities developing country governments experience in managing this new
complex aid landscape. The study finds that:
All three countries are receiving increasing volumes of development assistance, with a
greater share accounted for by non-traditional sources, although this varies by country. Data
challenges mean our analysis is likely to underestimate the current volumes of flows,
particularly from less traditional providers.
This growth is leading to more choice and more finance, and developing country
governments welcome this.
Governments identified ownership, alignment and speed as key priorities when it comes to
the ‘terms and conditions’ of development assistance. Non-DAC donors were found to score
well against this set of criteria; this was less true for global funds in Cambodia and Zambia.
Ethiopia and Cambodia were found to be taking a strategic approach to the division of
labour between different groups of development assistance providers. This was less true for
Zambia, possibly because the country has better access to domestic and private sources of
finance and is less dependent on development assistance.
Governments in Cambodia and Ethiopia show limited interest in including the less traditional
providers in aid coordination mechanisms; the Zambian government displayed more
interest.
Philanthropic and social impact investment flows are small at country level and are not yet
changing the aid landscape significantly.
Countries’ ability to attract and manage climate finance appears to depend heavily on their
own strategies.
In conclusion, we note that:
The volume of development assistance has grown dramatically since 2000, and the
composition has changed significantly, with a much larger share being accounted for by
non-traditional providers.
Countries are welcoming this additional choice and see these trends as more positive than
negative. The benefits of greater choice were found to outweigh the potential costs of the
additional fragmentation.
The growth in the variety of providers of development assistance, particularly the non-
traditional, is helping strengthen the negotiating power of governments, and may make it
more difficult for traditional donors to influence policy.
The ability of countries to benefit from the changed landscape depends heavily on their
ability and willingness to manage these flows strategically, and also on their economic and
political context.
The changed landscape will lead to different ‘ways of working’ for governments, traditional
donors and the international aid effectiveness community. We include detailed policy
recommendations for each of these groups at the end of the report.
2 Note that OOF figures are a three-year moving average of 2002-2004 for 2000, the closest available, and 2008-2010 for
2009, to smooth out potential fluctuations from the financial crisis.
ix1 1 Introduction and rationale behind the study Development cooperation is changing rapidly. There are both demand- and supply-side pressures, which suggest that ‘traditional’ donor aid from Organisation for Economic Co-operation and Development Development Assistance Committee (OECD-DAC) donors is becoming less important as a source of development finance. There is now a myriad of ‘non-traditional’ sources of development finance, including from non-DAC donors such as China and India, philanthropists such as the Bill and Melinda Gates Foundation and ‘social impact investors’ such as the Shell Foundation and Acumen Fund. Development cooperation is also being affected by changes in the global context. These include fiscal austerity in OECD countries, which is putting downward pressure on donor aid; the graduation of a number of lower-income countries (LICs) to middle- income country (MIC) status; greater access to international capital markets on the part of many fast-growing LICs and MICs; and a desire in many developing countries to reduce dependency on aid. The growth of the less traditional actors within this changed context has led to changes in the global architecture in terms of reaching agreement on aid effectiveness issues. From the 2005 Paris Declaration, primarily involving DAC donors, a new, broader ‘Busan Partnership for Effective Development Cooperation’ has emerged, including a larger number of players. This study explores the implications of this more complex global landscape for partner country governments and traditional donors, and examines the challenges and opportunities governments experience in managing development assistance from traditional and non-traditional providers. Definitions of ‘traditional’ and ‘non-traditional’ are inherently controversial and subjective, as many actors labelled ‘new’ or ‘non-traditional’ have been operating for many years. For the purposes of this paper, we define ‘traditional development assistance’ (TDA) to mean assistance provided by traditional bilateral and multilateral donors that are members of the DAC and that conform to DAC norms and rules to varying degrees, and which meets standard official development assistance (ODA) definitions. By ‘non-traditional development assistance’ (NTDA), we mean cross-border sources of finance provided with some public or philanthropic interest purpose, which have some associated level of concessionality but also have funding or delivery mechanisms that differ from those of traditional donors and may not meet ODA definitions – although some do. We include within this category development assistance from non-DAC donors; philanthropic and institutional giving; social impact investment; global vertical funds; and climate finance. We also include other official flows (OOFs) in our upper range estimates because, although many OOF providers are traditional donors (e.g. the International Bank for Reconstruction and Development, IBRD), their assistance does not meet usual ODA thresholds of concessionality. The study does not cover domestic resource mobilisation or purely private sector flows, which either are not cross-border or are not provided with an explicitly public interest purpose. There are two reasons for limiting the study in this way: 1) we wanted to make the scope more manageable; and 2) we believe governments are more likely to consider NTDA as a complement or substitute to ODA, and to manage it in comparable ways, something the case studies explore in more detail. The study explores this new complexity in three ways. First, it provides a provisional taxonomy of sources of development assistance, including from both traditional and less traditional providers. This is not intended to be a definitive taxonomy or to create new categories or definitions; rather, it provides a first-cut estimate for feedback and discussion and a framework to inform the subsequent analysis. Second, we analyse trends in the volume and composition of total flows of development assistance to all developing countries (low and middle income). This will help us understand how the aid landscape has changed over the past decade and the impact this might be expected to have at country level. Finally, we draw on three country case studies
2
(Cambodia, Ethiopia and Zambia) to explore the challenges and opportunities developing
country governments face in managing this changing landscape.
The main purpose of this analysis is to help developing countries, donors and those involved in
international dialogues around aid effectiveness to better understand the implications of this new
complex landscape for partner country aid management strategies. We aim to help countries
understand how they can adapt their strategies to make the best use of the sources of
development assistance available to them and to access new sources. Post-Busan, the debate on
aid effectiveness is intended to take place primarily at country level, through ‘country compacts’.
Understanding the changed landscape from the view of partner country governments is therefore
critical. The analysis also aims to help donors understand how their own role at country level may
be changing.
The study aims to complement existing work in two main ways. First, by focusing on the country-
level perspective, it seeks to complement the large volume of existing literature on new flows,
particularly on non-DAC donors (Davies, 2010; Manning, 2006; OECD, 2010a; 2010b; Reality of
Aid, 2010; Woods, 2008; Zimmermann and Smith, 2011). Much of the existing literature highlights
the potential benefits of non-DAC support to countries, and some assesses the quality of aid
against standard aid effectiveness indicators. However, it is in general focused on the view from
the global level and the perspective of donors and funders; there is currently very little published
literature that discusses countries’ own views and priorities. Those studies that do exist, for
example Grimm et al. (2010), focus on only a few countries or providers.
The existing literature is fairly clear on the need for additional work to fill current gaps in our
understanding of the country perspective. Zimmermann and Smith (2011), for example, note that
‘the most pressing question ahead of the 2015 MDG [Millennium Development Goal] deadline is
[…] whether developing countries will be able to take full advantage of [non-DAC donors’] new
sources of funding and ideas’ (12). Similarly, Kharas (2007) notes that ‘The new reality of aid is
one of enormous fragmentation and volatility, increasing costs and potentially decreasing
effectiveness. A key challenge for the new era of development assistance will be to understand
how coordination, information sharing and aid delivery will work in the new aid architecture’ (1).
Second, the study diverges from the existing literature by remaining agnostic on what is meant by
‘aid effectiveness’. Other studies on new flows have taken the Paris Declaration interpretation of
aid effectiveness as the ‘lens’ through which they examine new providers, asking to what extent
flows from non-traditional providers (NTPs)3 are consistent with the Paris principles (Grimm et al.,
2010; UNDP Cambodia, 2010). While focusing on aid effectiveness as a key priority, this study
takes a neutral starting point with regard to the appropriateness of the Paris Declaration
interpretation of aid effectiveness. Instead, one of its guiding questions is to better understand
country priorities when it comes to the volume and quality of the aid they receive and to assess
flows against their own criteria.
The paper proceeds as follows:
In Section 2, we provide a provisional taxonomy of development assistance, including both
traditional and less traditional sources. We then provide a first-cut estimate of recent trends
in the volume and composition of these flows at a global level.
Section 3 presents the theoretical framework that guides the three country case studies and
a brief introduction to the case study methodology.
3. By NTPs, we mean those actors providing NTDA, including non-DAC donors and Korea; philanthropists; social impact
investors; global vertical funds; and climate finance providers.3
Section 4 provides an introduction to the case studies and describes the key contextual
factors that might be expected to shape country engagement with donors and NTPs.
Section 5 presents the main case study findings, including the volume and key
characteristics of the various forms of development assistance at country level.
Section 6 concludes and summarises the policy recommendations.4
2 The new aid landscape: trends in TDA and NTDA
As noted in the introduction, one of the aims of this paper is to better understand recent trends in
the volume and composition of development assistance flows within the new aid landscape, and in
particular the breakdown between TDA and NTDA. This is the focus of Section 2.
In Section 2.1, we present a provisional taxonomy of development assistance flows, defining our
understanding of both TDA and NTDA, and the component parts of each. This is not intended as a
definitive taxonomy or to create new categories or definitions, but to present a first-cut estimate for
discussion and a framework to inform the subsequent analysis. We first provide a summary
(Section 2.1.1) and then a more technical exposition (Section 2.1.2): those less interested in the
technical details can skip over Section 2.1.2 and move straight to Section 2.1.3, which lists the
components of TDA and NTDA and provides a visual mapping.
In Section 2.2, we draw on our taxonomy to present provisional estimates of trends in the volume
and composition of development assistance flows at global level. Given data limitations, which are
noted in the text, this is an imprecise estimate, and probably underestimates the volume of less
traditional flows.
2.1 Defining TDA and NTDA
2.1.1 A summary methodology
Our main interest is in charting the impact at country level of a rapidly changing landscape, or
‘aidscape’, of development assistance providers, with an emphasis on the less traditional (and
outright new) ones, and how they interact with governments and other providers. We accept that
these phenomena are not best measured solely in terms of financial flows, in isolation from trade
links, skills transfers and other critical attributes often bundled together with finance. We are
nonetheless using finance here as a crude but simple yardstick.
The distinction between TDA and NTDA in this paper is at best a useful approximation, inevitably
involving a degree of subjective judgment. There is constant innovation and experimentation within
the traditional subset; conversely, ‘non-traditional’ does not imply a blank sheet in terms of history
and values.
Defining development assistance involves three basic steps:
1. Consider all cross-border resource flows into developing countries;
2. Apply a public (and philanthropic) interest test, using financial subsidy as a proxy;
3. Exclude purely market-based (for-profit) external finance.
What is now left is all development assistance: that is, TDA plus NTDA. We apply a further filter to
distinguish between these, although we recognise that this distinction is not perfect and the
boundaries will sometimes be blurred. We define TDA as assistance provided by traditional
bilateral and multilateral donors that are members of the DAC and that conform to DAC norms and
rules to varying degrees, and which meets standard ODA definitions. By NTDA, we mean-cross
border sources of finance that meet the three criteria above, but which have funding or delivery
mechanisms that differ from those of traditional donors and which may not meet the ODA
definitions.5 Some NTDA flows are scored as ODA, but we included them in our ‘non-traditional’ category because they present new or ‘complex’ management issues and opportunities, mostly because their allocation/coordination processes fall outside well-established DAC approaches and, in some respects, may resemble non-DAC flows more than DAC ones. This includes global funds, climate finance and Korea, as the next section explains in more detail. The categories included in the definition of NTDA are: financial flows from non-DAC countries; private philanthropy; flows to developing countries from non-governmental organisations (NGOs), net of ODA these NGOs receive; social impact investment; global vertical health funds; climate finance; and Korean assistance. We identify separately, in an upper-bound estimate, OOFs, including from the so-called non-concessional windows of multilateral banks. Remaining ODA is classified as TDA for the purposes of this report. We exclude from development assistance altogether forms of finance that do not clearly meet the criteria set out above: domestic resource mobilisation (taxation and domestic financial markets) and private investments; private remittance flows; foreign direct investment (FDI); international commercial bank and bond market funding; and export credits on market terms. 2.1.2 An expanded methodology More specifically, defining development assistance and its component parts involves the following three steps. First, we consider all development finance flows into any developing country, that is, countries on the DAC list of eligible ODA recipients4 (including all LICs and MICs), and potentially from any origin, public or private, including other LICs and MICs. Domestic resource mobilisation is the largest financing source in developing countries, especially in MICs (see Greenhill and Prizzon, 2012). However, we look instead at how governments perceive and manage external sources. We also focus in principle only on transfers of real resources. As in ODA, we do not include un- disbursed forms of support, like guarantees that have not yet been called. We differ from ODA treatment (but follow, e.g., country programmable aid (CPA) practice), by counting bilateral and multilateral loan disbursements on a gross, not net, basis. This is because, for government departments in the destination country looking for funding for investment needs, what matters most is the gross flow. Second, our main interest is in external sources of finance that operate largely for a public (or philanthropic) interest purpose. This is not always a clear-cut distinction. It could be based on achieving a national or global public good (say disease control), on international welfare goals such as the MDGs, on recognising the special status of an intended beneficiary (low income, least developed, fragile, marginalised groups etc.) or on similar priorities. It could also simply be because of a mutual interest in promoting economic ties between two countries, less altruistic but still plausibly in the public interest of the recipient (as well as the provider). This lens, however, excludes all purely market-based finance, whether equity or loan financed, short or longer term. We also exclude all private remittances. This is a necessary shortcut, 4. A small number of countries graduated from the DAC list of recipients between 2000 and 2009, including Aruba, the British Virgin Islands, French Polynesia, Gibraltar, Korea, Libya, Macao, Netherlands Antilles, New Caledonia and the Northern Marianas. However, these countries are small and should not have an impact on the overall figures. Moreover, ODA estimates measure effort from the donor side, not inflows from the recipient side, and so these small changes should not have an impact on the estimates to any great degree. See www.oecd.org/dac/aidstatistics/historyofdaclistsofaidrecipientcountries.htm#Chronology
6

absent much more information on their use at destination. Philanthropic diaspora flows are largely
impossible to separate out from much larger volumes of private remittances directed within families
and for their principal benefit, rather than the wider collective interest.

We exclude official export credits meeting minimum (e.g. OECD discipline) international market
reference rate guidelines, or their equivalent (e.g. Chinese export credits to Ethiopia at 3% above
the London Inter-bank Offered Rate, LIBOR). For instance, Berne Union (2009) estimates official
export credit at an average of between $55 and $60 billion per year. The attractiveness of such
‘assistance’ to borrowers can transcend its financial terms for partner countries, because there are
no better alternatives for raising finance on a comparable scale and/or because other attributes
(speed, non-conditionality) are felt to outweigh purely financial costs. The changing role of this
intermediate type of finance needs further investigation.

We also exclude from our definition of development assistance most semi-official assistance to the
private sector on market terms (without sovereign guarantees), via so-called development
finance institutions (DFIs). Although some net equity purchases by bilateral DFIs already score
as ODA, these are liabilities conferring substantial claims on future profits, so scarcely
concessional in their effect. An argument could also be made that the intervention of the DFIs
catalyses private investments that would not otherwise have materialised, leveraging implicit
subsidies for public as well as private benefit. We do not have good enough data to explore this
distinction further. Therefore, we include only those DFIs that are reported under OOFs.

Third, as underlying motives are usually not revealed, we use a cruder test of what is and what is
not a market-based transaction, and that is simply whether there is a clear element of financial
subsidy involved, as further defined below. Ideally, this should capture both explicitly subsidised
terms and constructs that allow preferential terms compared with standard market access, such as
public guarantees. Grants are obviously in, as pure market terms are out, as above. Official loan
terms (beyond well-established concessional formulas such as that of the International
Development Association, IDA) are trickier. In practice, the boundary between ODA and other
official finance, OOFs, is hard to define conclusively. The ODA test of concessionality (minimum
25% grant element at 10% discount rate) is itself ambiguously applied, at least according to some
DAC members.

We believe more work is needed to clarify this boundary. A strong case can be made that,
especially in the current financial environment, there is little reason not to treat most OOFs,
particularly those from multilateral development bank windows, as development assistance. Such
loans are mostly on better terms than those available to the same sovereign borrowers from
international commercial lenders and bond markets, thanks to implicit subsidies such as non-
remuneration of equity, tax exemptions and un-priced guarantees from the multilateral
development banks’ (MDBs’) more creditworthy owners.

However, we do not have enough information, which would need to be laboriously disaggregated
by instrument and sometimes borrower, to be sure of this, and even less to make accurate
comparisons with bilateral loans on less concessional terms, including from NTPs. We also
recognise that the decision to include OOFs from longstanding providers (e.g. IBRD) within our
definition of non-traditional may be controversial. We have therefore included all long-term
lending (three-year average disbursement of OOFs)5 by the MDBs’ non-concessional
windows and equivalent institutions in our upper-bound estimates only.

5. This attempts to smooth fluctuations caused by sudden surges in gross flows, for example from the World Bank and
the International Monetary Fund (IMF) during the recent global crisis, that are bound to fall back in outer years.
7
2.1.3 Components of TDA and NTDA
Using the criteria outlined in summary form in Section 2.1.1, and in more detail in Section 2.1.2, we
reach the following definitions of TDA and NTDA.
We define as TDA cooperation from longstanding bilateral and multilateral donors that are
members of the DAC and that conform to DAC norms and rules to varying degrees. All such
assistance meets standard ODA definitions. In practice, we measure TDA as total ODA minus the
‘non-traditional’ elements of ODA outlined below (constituting about 11% in 2009), although
recognising that this is an imperfect measure.6
We define as NTDA:
ODA-like flows from non-DAC donors. These flows clearly meet the criteria as outlined
above, in the sense that they are cross border, reach developing countries and have a
public interest purpose – often of ‘mutual interest’ to provider and recipient. Estimates of
ODA-like flows from non-DACs tend to include only those flows that meet the strict DAC
concessionality thresholds. A large volume of flows from these providers is likely to meet
our looser concessionality threshold (in the sense of having some element of
concessionality) but not ODA-equivalent criteria. However, we do not have sufficient
information to include these ‘OOF-equivalent’ non-DAC flows.
Philanthropic and institutional giving (from grant givers such as the Bill and Melinda
Gates Foundation) and non-government foreign donations administered by international
and local NGOs. The international players, in turn, have many funding arrangements with
local civil society organisations (CSOs), which makes a consolidated assessment harder.
We do net out, however, NGO aid flows funded directly by ODA, as reported by DAC
donors, to avoid double counting with traditional assistance.
Social impact investment (support to social enterprises on non-strictly market terms),
where information is available on this separately from other philanthropy. There is some
possible overlap with OOFs here, as multilateral institutions are also sources of funds for
social enterprises.
Global funds, egregiously the Global Fund to Fight AIDS, Tuberculosis and Malaria7 and
the Global Alliance for Vaccines and Immunisation (GAVI), even though most flows through
these agencies are funded by DAC donors and score as ODA. Global funds have
innovative and non-traditional funding mechanisms, and in GAVI’s case innovative funding
sources too. Funding mechanisms often follow a cross-country challenge format, and
execution is vested in various local entities, including government departments; the
underlying ‘donor’ has no country presence.
Public climate finance, much of which follows similar funding mechanisms to those of
global funds. Public climate finance comprises elements that are scored as ODA and
elements that are not. For reasons of data availability and certainty, we include here only
the components of climate finance that are scored as ODA and reported to the DAC. Future
iterations should include other non-ODA elements of publicly funded climate finance
(although these are likely to be included in our OOF estimates).
We also include Korea as non-traditional, which joined the DAC in November 2009. Korea
is frequently cited as following distinctive approaches at the local level, preferring project-
6. In particular because some of what is currently able to score as ODA does not actually cross borders into developing
countries, e.g. refugee and student costs, and debt cancellation.
7. The Global Fund Board has recently decided to change its financing approach, to one based on more predictable
support to country health strategies, centred on cross-country allocation criteria including income, disease burden and
performance. These criteria are still being worked out in detail. In the case studies, interlocutors were as yet familiar only
with the proposal- or ‘round’-based challenge grant financing model.8
specific to programmatic interventions and as not participating in intensive aid coordination
mechanisms at the country level. Given that this is perceived by recipient governments as a
different aid model, and that it has not simply converged with DAC practice, the distinction
is valuable.8 Korean assistance is now scored as ODA.
OOFs from DAC donors are included in our upper-bound estimates. The inclusion of
OOFs within NTDA is not to suggest development practitioners, or the MICs in which they
operate, are not familiar with these windows. At the institutional level, moreover, there is
little practical difference between say IDA and IBRD approaches to development, or their
respective management. Rather, these flows are often conventionally left out of global
discussions on ‘aid’ on the narrow grounds of their (relatively) harder financial terms.
Moreover, for many newly graduating MICs, dealing with OOF flows (e.g. from IBRD) will
be a new experience, and this class of providers is in any case also diversifying with the
rapid growth of bilateral official finance. OOFs also fit in our category of development
assistance as outlined above, although, as noted, there is some uncertainty about the
concessionality of all such flows. For this reason, and because we recognise that inclusion
of longstanding OOF providers such as the IBRD as ‘non-traditional’ assistance may be
somewhat controversial, we include it in our ‘upper-bound’ estimates only.
Table 1: A taxonomy of development assistance
Development assistance flows Other flows (not considered)
TDA NTDA
Traditional bilateral cooperation Non-DAC flows Domestic resource mobilisation
Traditional multilateral Philanthropic and institutional Export credits
cooperation giving DFIs (excluding those covered in
Social impact investment OOFs)
Global vertical funds Private remittances
Public climate finance FDI
Korea Other private flows
OOFs
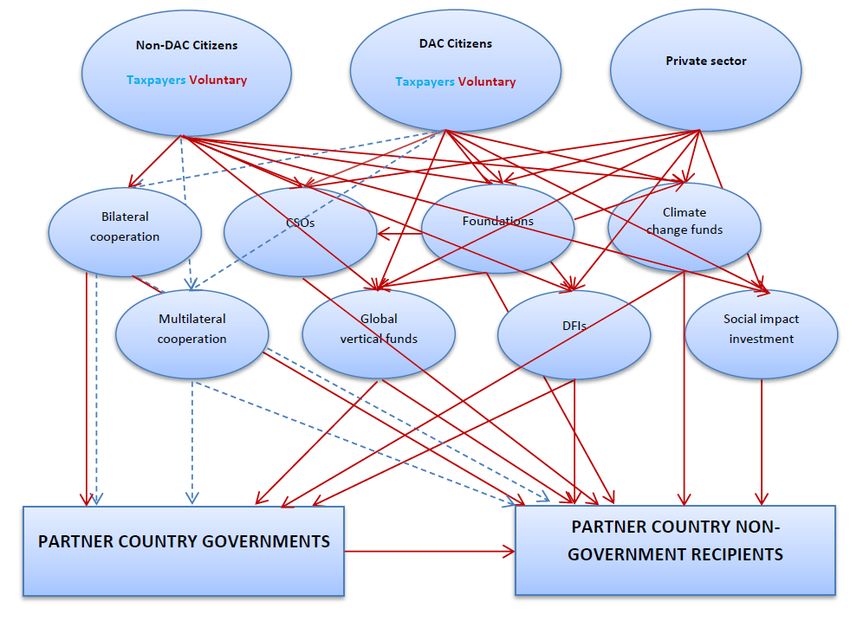
Figure 1 illustrates the diversity of cross-border development assistance flows towards the ultimate
partner country governments and non-government recipients. We distinguish between three
primary sources of international development finance (taxpayers in DAC and non-DAC countries,
able to give through voluntary channels also, and the private sector) and eight intermediate
channels, which broadly map to the flows shown in Table 1, including ‘mainstream’ bilateral and
multilateral assistance agencies, many of which fund each other as well as the ultimate
beneficiaries.
The blue dashed lines represent traditional ODA flows the partner country is probably used to
managing within traditional aid management frameworks, that is, mainly bilateral assistance from
DAC countries and multilateral cooperation. The red straight lines outline main relationships
between non-traditional sources/actors, intermediaries and partner country governmental and non-
governmental recipients.
8. A case can be made that this difference in operating approach is not limited to Korea, but should include, for example,
Japan, despite its significantly longer track record of DAC membership. We have not taken this route, but the scoring
could be adjusted to accommodate such variants in subsequent iterations.9
Figure 1: Mapping traditional and non-traditional development assistance flows
Notes: Traditional flows are shown by a dashed (blue) line.
2.2 A first-cut global estimate of development assistance flows
2.2.1 Estimating global development assistance flows
In this section, we provide a provisional estimate of recent trends in the volume and composition of
development assistance flows, particularly the breakdown between TDA and NTDA. This helps us
better understand the new aid landscape and the impacts it may have at the country level. These
figures are necessarily provisional, given challenges in data availability, and are very likely to
underestimate NTDA flows in particular. Estimates are based on 2009 data, as for some of the
flows this is the latest information available.9 They are based mostly on gross disbursements10 and
are expressed in current terms.11
As noted above, uncertainty about the concessionality of OOF flows, and their inclusion in the
NTDA category, mean we have provided two sets of estimates. Our ‘lower-bound’ estimate
9. As mentioned above, we apply a different approach to measure OOFs – a three-year moving average – to smooth the
volatility around the 2008/09 financial and economic crises. We use a three-year moving average of 2002-2004, the
closest available, for our 2000 figures.
10. However, in some cases, information was available on a commitments basis only, for instance for climate financing.
11. Some flows from NTPs at aggregate level are available in current prices only. This particularly affects comparisons
between 2000 and 2009, which should ideally be in real terms.10
includes only the core elements of TDA and NTDA as defined above, whereas our ‘upper-bound
estimate’ also includes OOF. Our upper-bound estimate is likely to be an underestimate, insofar as
there is no systematically collected, comparable information on semi-concessional (OOF) flows
from non-DAC member countries. This becomes particularly important in comparing alternative
financing offers at country level.
Figure 2 provides overall estimates in the volume and composition of development assistance
flows in 2000 and 2009, and Figure 3 provides a more detailed breakdown of the composition of
NTDA in the same years. In each case, separate charts are provided for upper and lower bounds.
Figure 2: Trends in development assistance flows, 2000 and 2009 ($ billions)
Lower bound
250 Climate finance
Social impact investment**
200
Global health funds
150
Official concessional assistance
100 from NTPs
Philanthropic assistance and
private giving
50
Traditional development
assistance*
-
2000 2009
Upper bound
250
Other official flows***
200 Climate finance
Social impact investment**
150
Global health funds
100
Official concessional
assistance from NTPs
50 Philanthropic assistance and
private giving
Traditional development
- assistance*
2000 2009
Note: * net of NTDA; ** 2011 figures from E.T. Jackson and Associates (2012); *** three-year moving average: 2002-2004 for 2000
figures and 2008-2010 for 2009 figures.
Source: Authors’ elaboration on the basis of CPI (2011); E.T. Jackson and Associates (2012); Hudson Institute (2012); OECD (2003);
OECD.stat website (accessed 2012); GAVI and Global Fund websites (accessed 2012).11
Figure 3: Share of overall NTDA by main actor, 2000 and 2009
Lower bound
2000: total NTDA $5.3 billion 2009: total NTDA $53.3 billion
0.1%
6.5%
20.9%
34.6%
2.9% 47.5%
58.8% 7.1%
21.7%
Philanthropic assistance and private giving
Official concessional assistance from NTPs
Global health funds
Social impact investment
Climate finance
Upper bound
2000: total NTDA $17.6 billion 2009: total NTDA $93.5 billion
17.7%
27.0%
10.4%
43.0%
0.03%
70.0% 12.3%
2.0%
11.9%
Philanthropic assistance and private giving
Official concessional assistance from NTPs 4.0%
1.7%
Global health funds
Social impact investment
Climate finance
Other official flows
Notes: See Notes in Figure 2.
Source: Authors’ elaboration on the basis of CPI (2011); E.T. Jackson and Associates (2012); Hudson Institute (2012); OECD (2003);
OECD.stat website (accessed 2012); GAVI and Global Fund websites (accessed 2012).
The component elements of the data presented in Figures 2 and 3 are calculated as follows:
We estimate NTDA from official sources (non-DACs plus Korea) to be approximately $11.5
billion in 2009. The figures presented in this paper include assistance from non-DAC members
countries reporting to the DAC12 and the BRICS (Brazil, Russia, India, China and South Africa);13
12. On the basis of OECD Creditor Reporting System (CRS) database data accessed on 25 October 2012. Countries
included are Chinese Taipei, Cyprus, Czech Republic, Estonia, Hungary, Iceland, Israel, Kuwait (Kuwait Fund for Arab
Economic Development), Latvia, Liechtenstein, Lithuania, Malta, Poland, Romania, Saudi Arabia, Slovak Republic,
Slovenia, Thailand, Turkey and United Arab Emirates. Values are reported as gross disbursements of flows that are
classified as ODA.12 they come in between those provided in Economic and Social Council (ECOSOC, 2008), Park (2011) and Prada et al. (2010), ranging between $9.5 billion and $15 billion for 2008 (see also Greenhill and Prizzon, 2012, for a review), that is, between 10% and 12% of ODA- eligible external assistance from DAC donors. ODA-equivalent flows from non-DAC members reporting to the DAC were $2.4 billion in 2000 (see Greenhill and Prizzon, 2012). Second, we estimate philanthropic and private giving at $25.3 billion in 2009,14 based on Hudson Institute (2011) data. This includes assistance from foundations and corporations as well as private giving and voluntary contributions. These figures are underestimates, as they refer to US data only (we have no robust comparative information for non-US philanthropy); they also differ substantially from global estimates of philanthropic assistance flows of $56-75 billion per year, as in Kharas and Rogerson (2012). We followed a more conservative approach, as in Prada et al. (2010), deducting in particular the imputed value of volunteering and similar elements that do not appear to fit our present definition of development assistance. In 2000, philanthropic assistance – still for US foundations only – was estimated at $3.1 billion (OECD, 2003), which gives a rough indication of this segment’s probable high rate of growth, despite likely definitional problems (e.g. Hudson Institute considers the earlier OECD estimate overly conservative). Third, we estimated the amount of social impact investment to developing countries at $1.6 billion. These figures are based on estimates for developing regions in a report prepared for the Rockefeller Foundation (E.T. Jackson and Associates, 2012) and are based on 2011 data.15 Fourth, total disbursements from the Global Fund and GAVI were $3.8 billion in 2009, $3.1 billion16 and $0.7 billion,17 respectively. Total flows in 2000 were $329.5 million, attributed exclusively to GAVI (of which $325 million from private sources). The first grant from the Global Fund was disbursed in March 2002.18 Fifth, we scored $11.1 billion for climate finance in 2009, which is entirely ODA. Figures are based on CPI (2011) data: $9.5 billion from bilateral donors (Rio-markers classification) and multilateral assistance (grant and concessional loans from the IDA, the European Union, EU, the Asian Development Bank, ADB, the Inter-American Development Bank (IADB) and the African Development Bank, AfDB). In 2000, climate finance – on the basis of the contributions to the Global Environment Facility (OECD data) – was $343 million. Finally, included in the upper-bound estimates are OOFs, to a total amount of $40.2 billion in 2009. We estimated these by considering a three-year average for 2008-2010, as 2009 was characterised by a spike in IBRD flows (during the financial and economic crisis). These figures most likely include significant amounts of climate financing, over and above ODA, that we have not been able to disaggregate. We do not have a direct disbursements-based comparison for 2000, but we do have the three-year average of $12.3 billion for 2002-2004. 13. On the basis of Zimmermann and Smith (2011) – gross development cooperation flows – with the exception of Brazil, where we consider the primary source in 2009 constant price values (IPEA, 2009). Volumes are gross of relatively small contributions from these NTPs to vertical health funds (Global Fund and GAVI, $ 71 million in 2009). 14. These figures do not include contributions to GAVI and the Global Fund but they include climate finance ($450 million). 15. Some flows classified as social impact investment in E.T. Jackson and Associates (2012) might be included in philanthropic assistance figures. 16. http://www.theglobalfund.org/en/about/donors/ 17. http://www.gavialliance.org/funding/donor-contributions-pledges/ 18. See Radelet (2004).
13
2.2.2 Summary findings on development assistance flows
The detailed analysis presented in Section 2.2.1 demonstrates the following overall trends in
development assistance flows:
According to both our lower-bound and upper-bound estimates, development assistance
flows grew substantially between 2000 and 2009, and their composition has shifted
heavily towards what we here call ‘non-traditional’ sources.
Our lower-bound estimate (i.e. excluding OOFs) suggests that total development
assistance grew from $64.8 billion to $173.3 billion between 2000 and 2009. In 2000, the
‘non-traditional’ component of these flows was only $5.3 billion, or 8.1% of total
development assistance. By 2009, non-traditional flows had increased tenfold to $53.3
billion, making up 30.7% of total development assistance.
Our upper-bound estimate (including OOFs) suggests that total development assistance
grew from $77.1 billion to $213.5 billion between 2000 and 2009. In 2000, NTDA was
$17.6 billion, while by 2009 it had grown to $93.5 billion,19 a fivefold increase. NTDA by this
expanded definition rose from 22.8% of total development assistance in 2000 to 43.8% in
2009.
The composition of flows within our ‘non-traditional’ category has also changed. Within
NTDA, the share of both philanthropic and official concessional assistance fell between
2000 and 2009 (although within a rapidly expanding pie), with the share of global health
funds, social impact investment and climate finance all increasing.
For all the imprecisions inherent in the data, and especially the wide fluctuations inherent in OOFs,
this underlines that non-traditional flows are already very significant and have been growing very
rapidly over the past decade.
19. Note that OOF figures are a three-year moving average of 2002-2004 for 2000, the closest available, and 2008-2010
for 2009, to smooth out potential fluctuations from the financial crisis.14 3 Case study theoretical framework and methodology As we have just seen, development assistance has been growing rapidly over the past decade, and a growing share of it is now accounted for by what we call ‘non-traditional’ flows. Non- traditional flows are inherently unevenly distributed and are likely to be concentrated most heavily in MICs and resource-rich countries, meaning that not all countries will benefit from them evenly. Nevertheless, the global figures suggest that such flows are a potentially significant source of finance at the country level. In addition to the global mapping presented above, this study seeks to better understand the challenges and opportunities developing country governments experience in this new complex landscape. It does this by conducting a comparative analysis of three country case studies. The aim of the case studies is twofold: to validate the significance of the global trends at local level; and to explore how countries, primarily governments, experience flows from traditional and non- traditional providers and manage them to meet national development needs. In this section, we present an overview of the case study selection process and the methodology and theoretical framework for the studies. We have conducted three exploratory case studies in what we understand to be typical cases. We took a case study approach because of the complexity of the phenomena being studied, and the need to examine in some depth government priorities when it comes to the different forms of development assistance; this makes a case study approach by far the most appropriate. Three case studies were selected: further studies may be considered in future to gain a better understanding of the relevance of these findings for different categories of countries (MICs/LICs/fragile, more or less aid dependent etc.). Each case study was conducted over a two-week visit during June-September 2012. The methodology comprised a mixture of desk-based research on country context and of key aid management documents, and a series of semi-structured, mostly face-to-face, interviews with 30- 35 key informants in country, and, where needed, follow-up phone interviews. Key informants interviewed were drawn from governments (including aid management units and line ministries), DAC donors, non-traditional providers, civil society and parliaments. Key informants were identified according to their position, by reputational sampling or, where needed, through snowball sampling. Full lists of interviewees for each country can be found in the individual case study reports. The theoretical framing informing the case studies combines elements of the framework used by Fraser and Whitfield in their 2008 study ‘The Politics of Aid: African Strategies for Dealing with Donors’ and the Institutional Analysis and Development (IAD) framework developed by Ostrom et al. (2001). The key insight from Fraser and Whitfield (2008) lies in seeing the process of engagement between governments and donors or NTPs as one of negotiation. This is in contrast with much of the other literature on the political economy of aid. Some of this literature assumes donors and recipients have a shared set of objectives (e.g. the MDGs or human rights), and thus that there is a cooperative relationship or ‘partnership’ between donor and recipient, with no divergences of objectives (Fraser and Whitfield, 2008). Other literature uses principal agent theory to examine the relationships between donor countries (principals), contractors and donor agencies (agents) and potentially ultimate recipients (also principals) (Bertens et al., 2001). This study follows Fraser and Whitfield in seeing aid agreements (with any provider) as the result of aid negotiation, in which both sides have a set of (potentially divergent) interests and priorities they need to negotiate in order to reconcile.
15

Fraser and Whitfield present a simplified model of an aid negotiation (see Figure 4), in which
recipient negotiating capital (derived from context) leads to certain negotiating strategies (derived
from perceptions of relative negotiating capital and policy preferences). Development assistance
providers also have negotiating capital, derived from the same set of prior conditions, which lead in
turn to provider negotiating strategies. A combination of these strategies leads to aid agreements,
which involve priorities and ‘terms and conditions’ of the aid transfer. Implementation follows these
agreements. Fraser and Whitfield determine outcomes as the relative degrees of provider and
recipient control over implemented policy.

Figure 4: Simplified model of aid negotiation

Source: Fraser and Whitfield (2008).

As is clear from Figure 4, another key insight from Fraser and Whitfield is the focus on context in
shaping country and provider negotiating capital. As a simplified example, countries that are less
aid dependent are likely to have a stronger position in negotiating with development assistance
providers than those that are heavily so, while those with weaker governance environments may
find it more difficult to negotiate. Countries with strong and sustained performance on economic
growth or human development may also find themselves more attractive recipients of aid,
strengthening their bargaining power. The context does not determine the outcome of negotiations
in a mechanistic sense, but it presents providers and recipients with a set of constraints to consider
in deciding what they think can be achieved through negotiation. The authors focus on four
elements of context: economic conditions; political conditions; ideological factors; and institutional
conditions. Each of these (e.g. degree of aid dependency, growth rate, geostrategic importance,
domestic political legitimacy and so on) will have an impact on a country’s relative negotiating
power.

The other theoretical framework used to inform this study is the IAD framework developed by
Ostrom et al. (2001). Like Fraser and Whitfield, Ostrom et al. stress the importance of context in
shaping behavioural interactions. The IAD framework goes further to identify the units of analysis
that must be examined in assessing any situation, which include context, action arena, incentives,
You can also read


