ECONOMIC DEVELOPMENT 2021 2025 - Simcoe County ...
←
→
Page content transcription
If your browser does not render page correctly, please read the page content below

2021
              2025

ECONOMIC
DEVELOPMENT
STRATEGY

Table of Contents
1.0 Executive Summary									5
2.0 Introduction											10
2.1 Background											10
2.1.1 Who is the County of Simcoe Economic Development Office			 10
2.1.2 Development of the Strategy								10
2.2 Current Economic Development Ecosystem						10
2.2.1 Member Municipalities									11
2.2.2 Regional Economic Development							12
3.0 Understanding the Simcoe County Economy Today				       13
3.1 Strategic Location										13
3.2 Provincial Growth Regulations								14
3.3 Demographic Attributes									16
3.3.1. Educational Attainment									18
3.4 Economic Sectors										19
3.4.1 Manufacturing										21
3.4.2 Tourism											22
3.4.3 Professional, Scientific, and Technical Services					 22
3.4.4 Agriculture											23
3.5 Key Regional Assets										24
3.5.1 Lake Simcoe Regional Airport								24
3.5.2 Georgian College										25
3.5.3 Lakehead University									26
3.6 Regional Issues to Consider								27
3.6.1 Talent												27
3.6.2 Investment Attraction Activities								29
3.6.3 Business Development									30
3.6.4 Entrepreneurship and Innovation							32
3.6.5 Regional Economic Development Leadership					         32
4.0 Global and National Trends Impacting the Regional Economy		 33
4.1 Workforce											34
4.2 Technology											35
4.3 Global Trade											36
4.4 Climate Change										38
4.5 COVID-19											38
4.5.1 COVID-19 Looking Forward								40
4.5.2 The County’s Response to COVID-19							42
4.6 Other Considerations									43

                         ECONOMIC DEVELOPMENT STRATEGY 3
5.0 An Economic Development Strategy for Simcoe County			                43
5.1 A Vision for Sustainable Growth								43
5.2 Goal: Simcoe County will be recognized as a premier
destination for investment in Ontario.							44
       5.2.1 Objective 1										45
       5.2.2 Objective 2										45
       5.2.3 Objective 3										46
5.3 Goal: Through an excellent quality of life, education and careers,
Simcoe County attracts and retains talent to support the needs of
its thriving business community.								46
       5.3.1 Objective 1										47
       5.3.2 Objective 2										47
       5.3.3 Objective 3										47
       5.3.4 Objective 4										48
5.4 Goal: Businesses stay and grow in this region, supported by a strong
and innovative business development environment.				                     48
       5.4.1 Objective 1										49
       5.4.2 Objective 2										49
       5.4.3 Objective 3										50
       5.4.4 Objective 4										50
       5.4.5 Objective 5										50
       5.4.6 Objective 6										51
5.5 Goal: The County of Simcoe’s Economic Development Office
is a leader in facilitating and building effective and collaborative
relationships that creates a strong ecosystem for regional
economic development.									51
       5.5.1 Objective 1										52
       5.5.2 Objective 2										52
       5.5.3 Objective 3										53
       5.5.4 Objective 4										53
5.6 Goal: Advocate for and support the delivery of infrastructure
to meet the needs of a competitive business community.				               53
       5.6.1 Objective 1										54
       5.6.2 Objective 2										54
       5.6.3 Objective 3										54

                            ECONOMIC DEVELOPMENT STRATEGY 4
1.0 Executive Summary
  In December 2019, the County of Simcoe’s Economic Development Office (EDO) began the process to update
the County’s Economic Development Strategic Plan. The original Plan was approved by County Council in 2009 and
resulted in the creation of the Economic Development Office. Since the initial inception of the Plan to present, the EDO
has taken a leadership role in facilitating regional economic development, and successfully implemented many key
goals and objectives from the original strategy. This document represents the first official update to the EDO’s Strategic
Plan since the Office’s inception. This Strategic Plan update outlines where partners and stakeholders see regional
opportunities existing and what actions the EDO can take to support these opportunities.
  This Strategy was originally drafted in March 2020, incorporating interviews with 56 key stakeholders, a regional
business survey, a review of partner municipalities’ economic development strategies, and a literature review of current
regional, national and global trends. Since this Strategy was developed in draft form, the global economy experienced
one of the most significant shocks in modern history with the onset of the COVID-19 pandemic. The pandemic has
had a significant impact on business operations and confidence. The EDO immediately focused on development
and delivery of a COVID-19 Business Support Action Plan, and recently developed a COVID-19 Recovery Plan involving
consultation with local businesses through sector focus groups and a review of on-going business trends.

Brief Overview of Simcoe County’s Economy
  The County of Simcoe is comprised of 16 member municipalities and have the separated Cities of Barrie and
Orillia, CFB Borden, and two First Nation communities located within the geographic boundaries of the region.
Simcoe County is strategically located just north of the Greater Toronto Area (GTA) and is serviced by a strong
transportation network including 400 series highways, rail and a regional airport. With the Growth Plan for the
Greater Golden Horseshoe projecting a population of 336,415 in 2019,1 the County’s growth rate over the last eight
years has been 20%, which is significantly higher than the provincial growth rate of 13% over the same period.2 The
population of the County is on average older than the rest of the province and will likely see a wave of retirement in
the coming years. Simcoe County also has higher rates of college and trade certificates and lower levels of university-
based education when compared to the provincial average.

1
    Environics Analytics, 2020
2
    Statistics Canada, 2011 Census of the population, National Housing Survey (NHS)

                                              ECONOMIC DEVELOPMENT STRATEGY 5
The County of Simcoe has several critical infrastructure amenities that makes for an attractive place to locate a
business including:
    •   The Lake Simcoe Regional Airport
    •   Georgian College
    •   Lakehead University
  Overall Simcoe County has a diverse employment base, with employment data showing that there is a high
concentration of people employed in the manufacturing and the arts, entertainment and recreation sectors. Sectors
that experienced the highest growth of jobs in the period from 2013 to 2018 included, accommodation and food
services, health care and social assistance, construction, educational services, and professional, scientific and
technical services. These sectors represent population-serving industries and their growth is consistent with the rapid
growth in population in the region.
  The County EDO, through a review of labour market data and feedback from regional stakeholders, focuses on
several key sectors in this Strategy to support the region including, manufacturing, tourism, professional, scientific
and technical services, and agriculture. This strategy involved a deeper dive into sector trends, summarized below.

Why Focus on These Sectors:
  Manufacturing
  One of the largest employers in 2018, with approximately 23, 259 employees. The sector has slowed in growth
realizing approximately 1% growth in the past 5 years and many stakeholders believe this is related to a shortage
of talent, particularly in skilled trades. While the manufacturing sector is a traditional strength, it requires additional
focus to ensure it remains competitive in the region and is further diversified. Several sub-sectors of opportunity
were identified through this strategy including aerospace, automotive, health and wellness, food and beverage and
cleantech.
   Tourism
   Tourism was frequently noted as a sector of opportunity in the stakeholder interviews and many comments
focused on the strength and importance of the tourism sector regionally. Employment in the arts, entertainment
and recreation; and accommodation and food services sector totaled 24,981 or 11% of the workforce in 2018, making
it a significant regional employer. Of particular interest, the accommodation services sub-sector experienced 49%
growth over the past 5 years. Agri-tourism was also frequently noted as an opportunity, aligning the region’s rich
agricultural tradition, with the growing demand for local food and related experiences.
   Professional, scientific and technical services: This sector, and more broadly the business cluster categorized
as entrepreneurs, was highlighted by stakeholders a key potential opportunity for diversification. While not a
top employer in the region with 10,928 jobs the professional, scientific and technical services has experienced a
moderate 11% job growth over the last 5 years.
                                          ECONOMIC DEVELOPMENT STRATEGY 6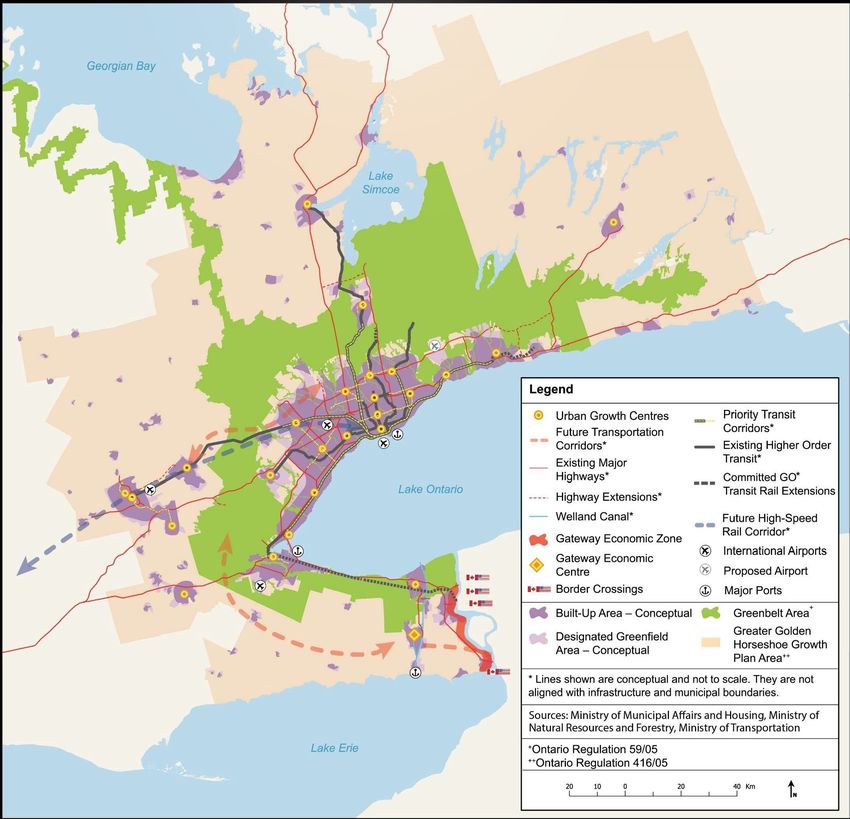
Agriculture
  The agricultural sector has a rich history in Simcoe County however in the past 5 years the farms sub-sector has
lost approximately 23% of its workforce and the region now has a lower concentration of employment in the sector
compared to the provincial average. Stakeholder interviews indicated the biggest opportunity for the growth of the
sector linked to value-added production and agri-tourism. The sector was experiencing challenges related to access
to appropriate infrastructure, managing red tape, and public perceptions regarding the sector.
  Economic development stakeholder interviews alluded to several critical issues and opportunities facing regional
economic development where the County EDO could have an impact.

Prominent Issues and Opportunities
  Talent
  The majority of stakeholders and almost half of business survey respondents identified access to skilled labour as
one of the most significant barriers to economic development in the region. Stakeholders saw a key opportunity for the
EDO to be involved in the attraction of new workers to the region, including newcomers, the development of employer
resources on hiring a diverse workforce, and promotion of regional career opportunities to youth and residents.
  Housing
  A lack of attainable and available housing was identified by stakeholders as a critical barrier in attracting necessary
talent to the region. Stakeholders noted there were low residential vacancy rates for both rental and purchase, and
ultimately there was not a suitable mix of diverse housing options regionally. Stakeholders indicated the EDO could play
a greater role in supporting the development of solutions by providing a business lens to housing strategy.
  Transportation
  Access to transportation was also identified as a barrier to attracting talent. While the County LINX public
transportation program has been well received, gaps in transit remain, in particular to get employees from the LINX
to their place of employment, known commonly as first/last mile solutions. Recommendations on the role of the EDO
centered around applying a business lens to transit decisions where possible.
  Investment Attraction
  Most stakeholders continue to see a critical role for the EDO to support regional investment attraction initiatives, as
the County is ideally positioned to capitalize on investment opportunities given its strategic location and identified
employment lands. In order to further facilitate investment attraction, stakeholders recommended addressing red tape/
inconsistencies at municipal level planning departments, advocating for new infrastructure and ensuring all partners
meet a minimum threshold of readiness to participate in these activities. Infrastructure was noted as especially critical,
as a number of stakeholders identified constraints in regards to available serviced employment lands.
  Business Development
  Stakeholders felt the EDO has a role to play working with other business development partners to support further
existing business growth in the region. This involves partnering on business education and connection initiatives,
supporting activities that enable further diversification of the economy, and assisting with the promotion of existing
services.
  Entrepreneurship and Innovation
  Several stakeholders identified entrepreneurs as a key target for their investment attraction efforts. Others
highlighted the need for businesses to explore automation and innovation to remain competitive, consistent with
the secondary research. They saw a role for the EDO to promote existing resources, to include entrepreneurs as a
sector of interest, and to help the regional business community understand the value of innovation and automation
in remaining competitive.
  Regional Economic Development Leadership
  The EDO, as noted by stakeholders, is ideally positioned to play a regional leadership role related to economic
development. Activities stakeholders indicated would be of interest included continued shared education and
benchmarking opportunities, opportunities to be involved in and provide feedback on EDO initiatives, on-going
information sharing, and the continuation of the economic development funding program.

                                         ECONOMIC DEVELOPMENT STRATEGY 7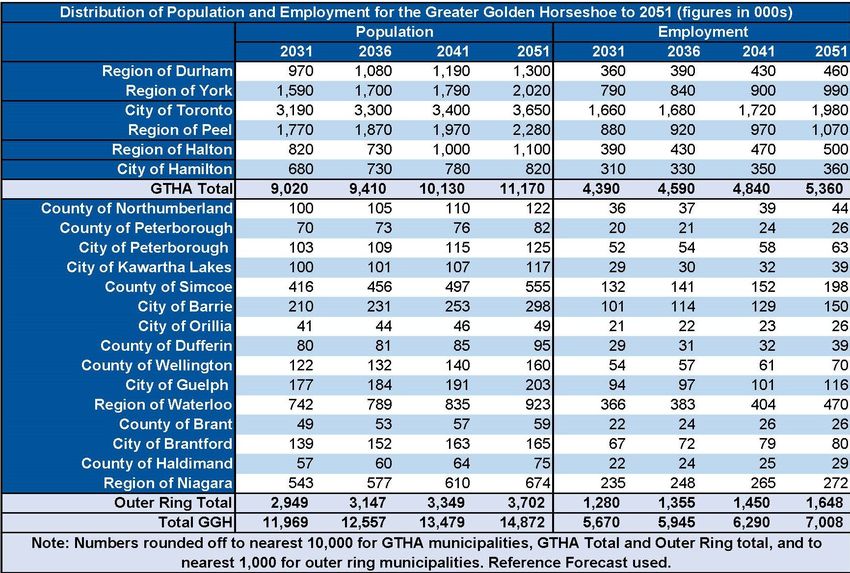
Global and National Trends Impacting the Regional Economy
 A number of trends are unfolding at the regional, national, and global scale that are impacting the opportunities
and challenges facing the regional business community. In particular, workforce, technology, global trade, climate
change and COVID-19 have been noted as key factors.

Trends
  Workforce
  The Business Development Bank of Canada (BDC) identified workforce as one of the biggest barriers to future
business growth. As Canada’s population ages, the working age population will only grow by 0.2%, which highlights
the significant shortfall already being experienced is anticipated to get worse. This shortage is perpetuating some
significant business challenges including employees working more hours, limited business growth, inability to fulfill
contracts or work orders, decreased competitiveness and deteriorating product quality.
  Technology
  The BDC also noted technology was one of the biggest barriers to future business growth. Ultimately, many
Canadian businesses were not adopting technology into their front or back end processes. This presents a
significant challenge, as early adopters of technology have the potential to double their cash flow, where those
who are lagging will likely fall behind their technologically advanced counterparts in                       terms of
competitiveness.
  Global Trade
  Over the past five years Canada has been privy to a number of new/updated
trade agreements. These include the Comprehensive Economic and Trade
Agreement (CETA), opening access to the European Union, the Comprehensive
and Progressive Agreement for Trans-Pacific Partnership (CPATPP), opening
access to markets in the Asia-Pacific and South American regions, and the
updated Canada-US-Mexico Free Trade Agreement.
  Climate Change
  Climate change should remain a consideration as it continues to impact
weather patterns globally and could have wide ranging impacts from a decrease
in tourism, disrupted transportation networks, and challenges related to agriculture
production.
  COVID-19
  The global pandemic has caused the most significant
economic shock in modern recorded history, as its onset led
to mandated temporary business closures, new health and
safety guidelines for operating a business, unprecedented
job losses and loss of consumer and business confidence.
To date there have been over 90 million cases and over 1.9
million deaths worldwide. Social distancing and other virus
control measures are likely to remain in place until a vaccine
has been widely distributed, setting the stage for an on-going
period of uncertainty for business operations.
  This current situation has highlighted the critical need
for businesses to rapidly adopt digital technology and be
innovative to remain relevant at times of business closure and
social distancing. It has also presented a potential investment
attraction opportunity, as manufacturers impacted by related
supply chain disruptions explore how to make their supply
chain more resilient, by creating local clusters of component
manufacturers.
  As noted, the EDO undertook additional research with
business owners to understand the key challenges and
opportunities presented by the pandemic and developed
a Covid-19 Recovery Plan.
                                        ECONOMIC DEVELOPMENT STRATEGY 8
The Strategy
  This Economic Development Strategy merges research on trends in the economy to data collected from key
economic development stakeholders, and the business community, to set forth a path for economic growth and
sustainability within Simcoe County. The overall goals and related objectives are as follows:
1. Simcoe County will be recognized as a premier destination for investment in Ontario.
     a. Build awareness of Simcoe County’s value proposition to investment prospects.
     b. Be a leader in coordinating regional investment attraction activities and events.
     c. Work with partners to promote and leverage key regional assets and opportunities.
2. Through an excellent quality of life, education and careers, Simcoe County attracts and retains talent to
support the needs of its thriving business community.
     a. Actively work to strengthen linkages between educational providers, industry and students.
     b. Build awareness of the region as a great place to live and build a career to people who are skilled in
        sectors that are experiencing key shortages.
     c. Support employers to better attract and retain the talent they need to stay in business and grow.
     d. Strive to create a welcoming community that can attract and retain newcomer talent.
3. Businesses stay and grow in this region, supported by a strong and innovative business development
environment.
     a. Assist local businesses by providing supports to help businesses remain competitive and grow in today’s
        evolving global marketplace.
     b. Enhance communication regarding the resources, events and education available to support the business
        community.
     c. Strengthen and support the entrepreneurship ecosystem.
     d. Working in partnership with regional stakeholders, determine the needs of the regional business community
        and address critical issues and opportunities.
     e. In partnership with Tourism Simcoe County, ensure the spectrum of business support available for tourism
        sector businesses is understood by Economic Development partners and the business community.
     f. Support the local economy through the COVID-19 pandemic and its post recovery in partnership with
        Tourism Simcoe County.
4. The County of Simcoe’s Economic Development Office is a leader in facilitating and building effective and
collaborative relationships that creates a strong ecosystem for regional economic development.
     a. The County’s Economic Development Office will facilitate strong communications, connections and
        relationships with and between economic development stakeholders in the region to support the delivery of
        economic development goals.
     b. Play a leadership role in facilitating cross-departmental and cross-regional solutions related to policy
        development where there are direct links to barriers and opportunities in economic development.
     c. Strengthen engagement and collaboration with the regional economic development network to expand
        economic development knowledge and skills and foster alignment and strategic value.
     d. Assist economic development partners in capacity building through providing funding or other supports
        to undertake and implement projects that directly align with and benefit the desired outcomes of the
        County’s economic development strategy.
5. Advocate for and support the delivery of infrastructure to meet the needs of a competitive business
community.
     a. Expand the capacity and connectivity of the Lake Simcoe Regional Airport.
     b. Increase the supply of shovel-ready employment lands.
     c. Play a significant role working with stakeholders and advocating to other levels of government regarding
        the need to support and enhance infrastructure and transportation networks to facilitate development.
 The Update provides several objectives and action items that the EDO and their partners plan to undertake in the
next five years to make Simcoe County a stronger community and premier destination for future economic growth.

                                       ECONOMIC DEVELOPMENT STRATEGY 9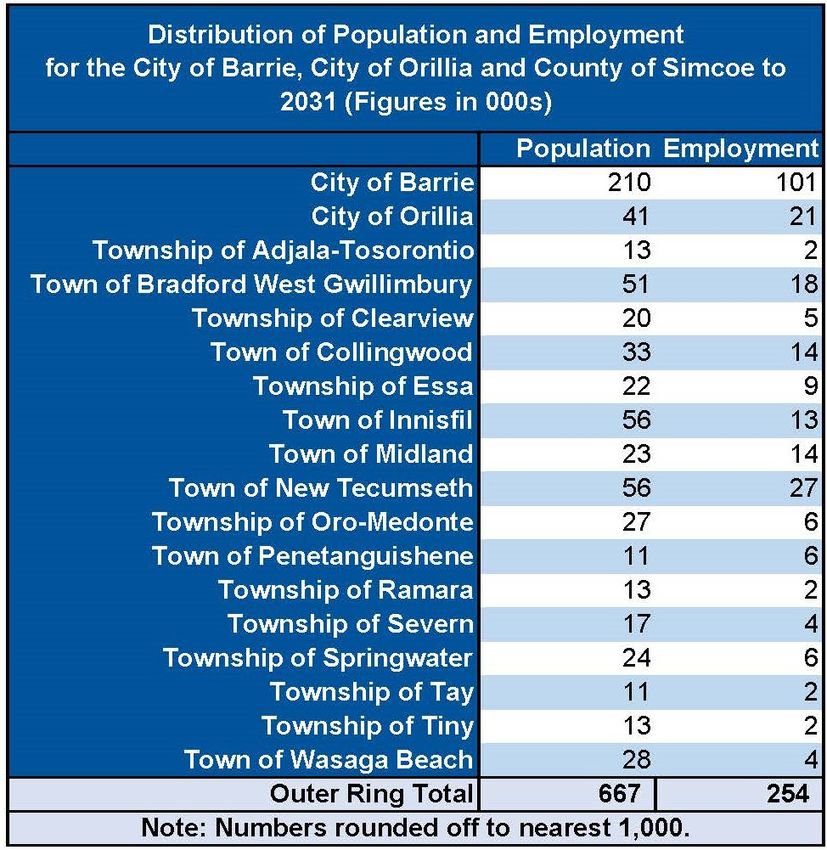
2.0 Introduction
2.1 Background
2.1.1 Who is the County of Simcoe Economic Development Office
  The County of Simcoe’s Economic Development Office (EDO) works to foster and build capacity for a regional
approach to economic development activities. The EDO works collaboratively with the County of Simcoe’s 16
member municipalities, the Cities of Barrie and Orillia, their First Nation partners and service providers to help
businesses in the region thrive and grow.
  The EDO was established in 2009 following the County of Simcoe’s approval of a 10-year economic development
strategic plan. From its introduction in 2009 to present, the Office has grown from a single staff member to a team
of 6 staff members. Responsibilities have evolved and changed, as the Office has been able to expand their capacity
over 10 years.
  County Council established an Economic Development Sub-Committee, which is comprised of the Warden and 4
members of County Council representing the north, south, east and west regions of Simcoe County. The Economic
Development Sub-Committee meets on a monthly basis and provides recommendations on strategic direction to
Council relating to economic development.

2.1.2 Development of the Strategy
  Developing an updated strategic plan allows the EDO to re-evaluate how opportunities and challenges have
shifted and identify strategic responses. With this in mind, the EDO engaged the services of the local Ontario Ministry
of Agriculture, Food and Rural Affairs (OMAFRA) advisor to support the development of the updated economic
development strategic plan. The process involved an extensive economic base analysis a survey with the regional
business community and interviews with 56 stakeholders. The stakeholders consulted included municipal staff
from member municipalities, members of the economic development sub-committee, key business development
organizations, industry associations, post-secondary institutions, commercial and industrial realtors, and
representatives of other key assets that support the economic development ecosystem. Initial data collection was
completed in February 2020. In mid-March 2020, a state of emergency was declared in Ontario due to the COVID-19
pandemic. The EDO in partnership with local municipalities, Cities of Barrie and Orillia and regional business support
agencies conducted three business impact surveys related to COVID-19 to gather information on the impact of the
pandemic on the business community and identify the supports needed. In response to the surveys, the EDO, with
input from area partners, created an action plan for business support and economic stimulus, and a COVID-19
Recovery Plan. Additionally, the County EDO and Tourism Simcoe County in partnership with regional municipalities
hosted a series of 15 focus groups with businesses to understand their immediate and long-term opportunities and
challenges in the current climate. The results from the business impact surveys and focus groups are incorporated
into the COVID-19 Recovery Plan (Appendix A).

2.2 Current Economic Development Ecosystem
  The EDO plays an important role in facilitating economic development at the regional level. Working regionally
and collaboratively is vital for supporting the County’s economic development efforts in an efficient and effective
way. It dramatically enhances all partners’ capacity to create awareness about the region and undertake initiatives
to help regional businesses start and scale up. For example, a local municipality may currently have a small
workforce, no post-secondary institutions, limited transportation assets, and business supports. By being part of the
broader region, partners can market themselves as having access to a much larger pool of talent, an airport, strong
transportation networks and two post-secondary institutions. Furthermore, businesses can benefit from broader
access to business development organizations from around the region. Businesses and talent do not distinctly
recognize municipal boundaries, thus taking a regional approach to economic development makes for a stronger
economy for all. Today the concept of cooperative competition has risen to prominence, where municipalities
collaborate to create awareness about the region and strengthen the economic development ecosystem. In order
to sustain a model of cooperative competition it is best to have economic development presence at both local
and regional tiers. The regional tier typically takes on higher level, regionally impactful initiatives, where the local
municipalities strive to maintain a favourable strong environment for the local business community, as well as
assistance for incoming investment.

                                        ECONOMIC DEVELOPMENT STRATEGY 10
2.2.1 Member Municipalities
Simcoe County has 16 member municipalities whose populations, as of the 2016 Census, range from 8,962 in the
Town of Penetanguishene, to 36,566 in the Town of Innisfil. For the purposes of the Strategic Plan, the County has
been divided in to four quadrants to more accurately reflect market conditions and trends. Economic development
capacity of individual municipalities varies, as some have no dedicated staff and others have small teams.
South Simcoe
Municipalities in South Simcoe include the Towns of Innisfil, Bradford West Gwillimbury and New Tecumseth and
Townships of Adjala-Tosorontio and Essa.
Due to its proximity to the Greater Toronto Area (GTA), this region is experiencing the most rapid population growth
and interest from an investment perspective. New Tecumseth and Bradford West Gwillimbury currently have strength
in manufacturing, while Adjala-Tosorontio and Essa are pursuing agricultural sectors and Innisfil is looking to attract
entrepreneurs, particularly from the technology sector. Innisfil and Bradford West Gwillimbury have provincially
designated strategic settlement employment areas, along the HWY 400 corridor. The Town of New Tecumseth has
a provincially significant employment zone in the vicinity of the Honda of Canada Manufacturing facility. Bradford
West Gwillimbury, and the broader region, will be able to benefit from the impending development of the 400-404
Connecting Link highway that will be built in the Town.
West Simcoe
Municipalities in West Simcoe include the Townships of Springwater and Clearview and Towns of Collingwood and
Wasaga Beach.
Collingwood is pursuing the development of a technology cluster, Clearview and Springwater are focused on the
agricultural sector and downtown revitalization, and Wasaga Beach, while known for tourism, is looking to pursue
future diversification in the economy in appropriate sectors of focus.
North Simcoe
Municipalities in North Simcoe County include the Towns of Midland and Penetanguishene and Townships of Tay and Tiny.
The North Simcoe municipalities have partnered together to develop an economic development corporation to
manage related activities for the region which is run by a small team. There are four sectors of focus in North Simcoe,
manufacturing, agriculture, tourism and healthcare.
East Simcoe
Municipalities of East Simcoe County include the Townships of Oro-Medonte, Ramara and Severn.
The region is focused on manufacturing and tourism sectors. East Simcoe collaborates with Rama First Nation
and the City of Orillia to support the tourism sector. East Simcoe has two provincially significant employment areas
as identified in the Growth Plan for the Greater Golden Horseshoe along Rama Road in Ramara Township focused
on tourism development, while the Township of Oro-Medonte has lands associated with the Lake Simcoe Regional
Airport designated as an Economic Employment District.
Cities of Barrie and Orillia
There are two separated cities located within the geographical boundaries of Simcoe County, Barrie and Orillia.
The City of Orillia’s economic development team has a strong focus on the manufacturing and tourism sectors
and have been focused on a significant waterfront revitalization project. Brownfield remediation in the downtown
has been a significant challenge and focus. The City is also home to Lakehead University – Orillia Campus.
The City of Barrie’s economic development team also has a strong focus on the manufacturing sector and are
currently looking towards how to support more innovation and entrepreneurship, both within manufacturing and
across other sectors. Barrie is home to a number of key economic development assets, including the main campus
of Georgian College which houses a Research and Innovation department and the Henry Bernick Centre for
Entrepreneurship. The City is also home to the Sandbox Centre, a business development support centre focused on
driving innovation and entrepreneurship.
ECONOMIC DEVELOPMENT STRATEGY 112.2.2 Regional Economic Development
In recent years the EDO has focused on investment attraction and foreign direct investment; business supports for
the manufacturing and agriculture sectors; supporting talent attraction; advocating on issues relating to business
retention/attraction; and supporting local members municipalities with their priorities. Key projects are developed by
the EDO in conjunction with member municipalities. Select specific examples are included below:
Made in Simcoe County - many manufacturers in Simcoe County are primed to grow, however, the lack of
both skilled and unskilled labour is impeding the sector’s ability to expand, an issue that will be exacerbated as
the workforce ages. In response, the Made in Simcoe County marketing campaign was launched to promote the
world-class products and career opportunities created in the region. The campaign supports labour market needs
by shifting existing stigmas of the sector (i.e. dirty, unsafe, underpaid) and modernizes the image as cutting edge,
vibrant, and innovative.
Foreign Direct Investment Strategy - forming the basis of the region’s investment attraction activities, this
strategy advocates for the development of relationships with existing businesses, including those with global
headquarters, and strategic partners to help facilitate interest in regional investment.
Agriculture and Agri-Food Value Chain Business Retention & Expansion Study - in 2018, the EDO, with
partners, completed an in-depth interview-based study on the needs of the agri-food value chain in the region. The
study was used to create a multi-year work plan supporting the sector that focuses on enhancing business supports,
improving municipal processes and planning, building agri-tourism assets, advocates for improved infrastructure
and strengthens the workforce.
Simcoe Muskoka Skilled Trade Expo - as an additional tactic to address the lack of skilled labour, the EDO has
worked with partners to develop an annual event designed to showcase skilled trade professions to regional youth.
The event connects youth and employers in a one-day showcase on the types of occupations that exist in the skilled
trades within the region.
ECONOMIC DEVELOPMENT STRATEGY 123.0 Understanding the Simcoe County
Economy Today
3.1 Strategic Location
Simcoe County is located north of
the Greater Toronto Area (see Figure
1). There are 16 member municipalities
in the County, along with the Cities Hope Island Giant's
Tom b
of Barrie and Orillia, Beausoleil Island
Beausoleil
of Christian Island First Nation,
Gloucester
Pool
Beckwith Island
Christian Island
Chippewas of Rama First Nation, and Island Sparrow
Lake
the Canadian Forces Base Borden (CFB 26 PENETANGUISHENE
Severn Sound
17
52
Borden). Simcoe County is the largest TINY 93
MIDLAND
Little
16
SEVERN
County in Ontario by population, and
Lalligan Lake
Lake 400
25 Wye
TAY
Georgian Bay
Marsh
58 Lake
23 44
the third largest by area (Statistics
St.
12 Joh n
6 Dalrymple
Lake
93 169
46
Lake Couchiching
Canada 2016 Census). Its location 11
RAMARA
presents a strategic advantage 29
Tiny
Marsh
Orr
Lake
19
ORO - MEDONTE
Bass
Lake
ORILLIA 12
as being connected to provincial 92 11
47
highway 400, and arterial highways COLLINGWOOD
27 400
11, 12, 26, 27, 88 and 89 facilitates 34 Nottawasaga Bay
WASAGA
BEACH
22 93
transport across Canada and to the 32
26
Lake Simcoe
Thorah
U.S. markets. These highways provide 64 10 SPRINGWATER
96 11
Island
26 Little
Lake
53
access to a large network of goods, 91 Minesing
Wetland
40 20
Georgina
services and potential customers. A
42 Kempenfelt Bay
95
Island
Edward 28 90
Lake
BARRIE
main north-south line of Class 1 railway CLEARVIEW
9 Fox Island
runs through Simcoe County and it
124
400
54
Snake
CANADIAN Island
9
is also home to a short line railway, FORCES 10
INNISFIL
56
BASE 21
BORDEN 53
the Barrie Collingwood Railway ESSA 3
(BCRY), which directly connects into
27 89
4
89
15
the national line. The County is home BRADFORD WEST
GWILLIMBURY
to, and 90% shareholder of, the Lake 89
NEW TECUMSETH
Simcoe Regional Airport, a 24/7 ADJALA -
TOSORONTIO
operation with on-site Canada Border 1
Services Agency services for both 50
passenger and freight.
The geographic breadth of the
County is also an asset, as seen in
Figure 1. It has significant shorelines
on Lake Simcoe and Georgian
Bay, connecting the County to
Figure 1: Location of Simcoe County in South-Central Ontario
the Great Lakes system and Source: Simcoe County Geographic Information System, 2019
creating opportunities for business
development in tourism and other
recreational industries. The County’s
size also allows it to encompass
both rural and urbanized areas that
provide a basis for diverse economic
activity, amenities, and lifestyles,
ultimately responsible for the region’s
high quality of life.
ECONOMIC DEVELOPMENT STRATEGY 13Figure 2: Places to Grow Policy Implications mapped over south-central Ontario.
Source: Schedule 2: https://www.ontario.ca/document/growth-plan-greater-golden-horseshoe/schedules
3.2 Provincial Growth Regulations
A Place to Grow - The Growth Plan for the Greater Golden Horseshoe lays out a vision and policies designed to
manage growth, plan for complete communities and protect the natural environment, directly impacting Simcoe
County. Figure 2 displays the policy area for the Growth Plan for the Greater Golden Horseshoe. The County of Simcoe
is subject to provincial-level regulation governing the allocation of population and jobs within the region to ensure
sustainable growth. Figure 3 details the population and job projection to 2051 for the County and Cities of Barrie and
Orillia. These projections indicate the significant and steady growth that is anticipated in the region that will allow
the region’s ability to attract investment and talent. These polices and projections are to be incorporated into the
Simcoe County Official Plan and the Official Plan of individual municipalities.
The Growth Plan also identifies a number of strategic economic and employment areas: Bradford West
Gwillimbury Industrial Strategic Employment Area, Alliston Provincially Significant Employment Zone, Innisfil Heights
Strategic Industrial Employment Area, Lake Simcoe Regional Airport Economic Employment District, and Rama Road
Economic Employment District.
ECONOMIC DEVELOPMENT STRATEGY 14Figure 3 (top): Population and job allocation for upper
and single tier municipalities in the Greater Golden
Source: https://www.ontario.ca/document/growth-
plan-greater-golden-horseshoe/schedules
Figure 4 (left): Population and job allocation for the
Simcoe Sub-Area
Source: Schedule 7 https://www.ontario.ca/document/
growth-plan-greater-golden-horseshoe/schedules
ECONOMIC DEVELOPMENT STRATEGY 153.3 Demographic Attributes
Simcoe County’s member municipalities have experienced pronounced population growth over the last eight
years. As shown in Figure 5, they added an estimated 56,991 people between 20113 and 2019,4 for a 20% growth rate.
This is projected to have outpaced the provincial growth rate of 13% over the same time period. This rapid growth
represents opportunities for new investment, business and talent development.
Within the County, population is most heavily concentrated in South Simcoe, followed by the West, North, and East
regions of the County. Between 2011 and 2019, population growth has been most heavily concentrated in the South
(29%), with slowest growth in the North (6%). The largest (and fastest growing) portions of the County continue to lie
in areas to the South and West, which will have implications for the allocation of services and investment across the
County.
Growth in the County can also be compared to the two separated cities within the County region, Barrie and
Orillia. The City of Barrie grew at a rate of 11% between 2011 and 2019. South, West and East Simcoe experienced a
higher growth rate than the City of Barrie between 2011 and 2019. Conversely the City of Orillia, has grown more
slowly than anywhere else in the County over both time periods.
While population growth is a meaningful driver of economic growth and development, like the rest of the province,
the County is faced with an aging population. The proportion of its population over the age of 45 increased from
49% (32% for those aged 45-64 and 17% for those aged 65+) in 20115 to 50% (31% for those aged 45-64 and 19% for
those aged 65+) in 2016.6 For the Province, the 2011 share of the population 45 and older was 44% (29% for 45-64 and
16% for 65+) and the 2016 share of the population was 45% (28% for 45-64 and 17% for 65+). While both the County
and the Province saw growth in the 45+ age cohort by 1%, the proportion of the 45+ population is approximately 5%
larger in Simcoe County than the Provincial average.
While Simcoe County had a slightly older population than the province did in 2016, the most notable change is the
number of retirement aged7 residents projected for Simcoe County, which as of 20188 is projected to represent 18.2%
of the population. This number is projected to increase over the next few decades, peaking in 2041 at 27.2%.
8 Year Net 8 Year 3 Year Net 3 Year
2031 Growth Growth (%) Growth Growth (%)
2006 2011 2016 2019 Forecast (2011-2019) (2011-2019) (2016-2019) (2016-2019)
Province of Ontario 12,160,285 12,851,821 13,448,494 14,483,929 16,795,039 1,632,108 13% 1,035,435 8%
Simcoe County +
Barrie + Orillia 421,581 446,072 479,642 520,123 667,000 74,051 17% 40,481 8%
Barrie 128,430 136,063 141,430 151,473 210,000 15,410 11% 10,043 7%
Orillia 30,255 30,585 31,165 32,235 41,000 1,650 5% 1,070 3%
South Simcoe 110,510 120,156 138,188 154,798 197,000 34,642 29% 16,610 12%
West Simcoe 63,870 68,735 75,678 82,475 104,600 13,740 20% 6,797 9%
North Simcoe 46,185 47,933 48,302 50,715 57,400 2,782 6% 2,413 5%
East Simcoe 42,331 42,600 44,879 48,427 57,000 5,827 14% 3,548 8%
Simcoe County 262,896 279,424 307,047 336,415 416,000 56,991 20% 29,368 10%
Figure 5: Population and Growth Rates, 2011-2031 Projections
Source: Ontario Growth Plan for the Greater Golden Horseshoe, 2017, Statistics Canada (Census of Population, 2011 & 2016) & Environics, 2020
3
Statistics Canada, 2011 Census of the population, National Housing Survey (NHS)
4
2019 figures are adapted from Environics Analytics DemoStats. A product that builds off the most recent census (2016) and uses a
combination of econometric, demographic and geographic models to create projections for data in between census collections.
Data sources include Census data, current economic indicators, postcensal estimates from the federal and provincial govern-
ments, immigration statistics, and economic data such as building permits. Environics uses sources such as Statistics Canada, the
Canada Revenue Agency, the Canada Mortgage and Housing Corporation, Oxford Economics, Bank of Canada and Canada
Post in their modelling.
5
Statistics Canada, 2011 Census of the population, National Housing Survey (NHS)
6
Statistics Canada, 2016 Census of the population
7
Retirement age in Ontario is 65 years or older.
8
Ontario Ministry of Finance “Ontario Population Projections”, 2018-2046
ECONOMIC DEVELOPMENT STRATEGY 16Posing an additional challenge, Canada’s 2017 fertility rate was 1.5 births per woman9 – well below the 2.1 births per
woman replacement rate to sustain current levels of population through natural increase. This highlights the stark
nature of the current talent challenge – in the near future we will not be able to fill the gap retirements are expected to
create in the marketplace.
The large wave of retirements along with the low fertility rate, means the labour force will likely shrink significantly.
As seniors continue to transition out of the labour force it will create a need for skilled and educated workers across
a range of occupations and in a variety of industries to both replace their exit and service their needs as they age.
Without a focused strategy to develop and attract these replacement workers, parts of the County – particularly to
the North and East – are at risk of losing their employment base, and a key element of their ability to attract business
investment.
Further, it is important to look at the kinds of jobs that residents will be trained to do. There will be an increased need
for certain occupations as the population ages but that need will not be permanent. Professions like personal support
workers will see a sharp increase in supply of jobs, followed by a decrease in the supply, as mortality rates increase.
This change will occur beyond the scope and needs of the strategic plan. However, strategic policy and investments
must be made with the future in mind. This means that the County should be pursuing the support of the shift already
being seen from a model where one studies, works, and then retires, to one which includes the possibility and flexibility
of re-training for an alternative career.
While it is still critical to focus on developing and attracting youth, enhanced efforts to attract newcomers to the
region is an opportunity. The Conference Board of Canada, in its 2018 report, Canada 2040: No Immigration vs. More
Immigration indicates that immigration’s share of annual population growth is currently at 71%. However, according
to Environics Analytics, as of 2019, Simcoe County’s immigrant population as a share of total population was only 13%
(43,658 residents) – well below the province’s immigrant population share of 30%. Within the County, this share was
highest in South Simcoe at 17% (25,932 residents), and lowest in East Simcoe at 8% (4,102 residents). Immigration is
a significant driver of the labour force – and thus the competitiveness of regions across the province. The economic
development strategy of the County should continue to promote the attraction and support of immigrants throughout
Simcoe County.
A further challenge is a high rate of commuting within the County. While North Simcoe retains about 77% of their
workforce in the region, West Simcoe retains 51% of their workforce, South Simcoe retains 39% of their workforce and
East Simcoe retains just 16% of their workforce for jobs within their respective regions.10 With COVID-19 driving an
increase in work-from-home opportunities, it will be interesting to see how commuting patterns may change over time.
9
World Bank (2019)
10
Statistics Canada Commuting Flow Tabulations, 2016
ECONOMIC DEVELOPMENT STRATEGY 173.3.1. Educational Attainment
As noted in Figure 6, compared to the province, Simcoe County has higher rates of college and trade certificates
and lower levels of university-based education. According to the 2016 Census the working age population has
achieved a lower proportion of university certificate, diploma or degree education at 16.6% versus the Provincial
average of 28.2%. However, a higher proportion of the working age population have obtained a college/non-
university diploma at 24.5% versus the Provincial average of 20.8%. 19.4% of the population has no certificate,
diploma or degree, and 30.9% has achieved a secondary school diploma or equivalency certificate, indicating the
majority of the population, and a higher proportion than the province, has not obtained any education beyond
secondary school. This signals the need to evaluate efforts to increase transitions from high school to post-
secondary education and training within the County.
Finally, of those in Simcoe County that have attained some post-secondary education there is a higher level of
expertise than the province in industries such as:
• Architecture, engineering and related technologies (11.7% or 29,380 workers)
• Health, and related fields (8.4% or 21,265 workers)
• Personal, protective and transportation services (4.1% or 10,380 workers)
Conversely, the County lags the province in skilled areas such as business and management, social sciences and
law, and computer and information sciences. Despite having a high concentration of architecture, engineering and
related technology expertise in the region,11 employers and key economic development stakeholders still noted a
significant shortage of skilled labour regionally.
Secondary College; CEGEP University
(high) school Apprenticeshi or other non- University certificate;
No certificate; diploma or p or trades university certificate or diploma or degree
diploma or equivalency certificate or certificate or diploma below at bachelor level
degree certificate diploma diploma bachelor level or above
Province of Ontario 17.5% 27.4% 6.0% 20.8% 2.2% 26.0%
Simcoe County 19.4% 30.9% 8.7% 24.5% 1.8% 14.8%
City of Barrie 17.6% 31.0% 6.4% 26.3% 1.5% 17.2%
City of Orillia 22.3% 30.8% 7.1% 23.3% 1.4% 15.0%
South Simcoe 20.0% 32.1% 8.6% 23.8% 1.7% 13.8%
West Simcoe 17.9% 30.6% 8.1% 24.3% 2.0% 17.1%
North Simcoe 21.0% 30.6% 8.8% 25.2% 1.4% 12.9%
East Simcoe 18.1% 28.2% 9.7% 25.8% 2.1% 16.1%
Simcoe County +
Barrie+ Orillia 19.0% 30.9% 7.9% 24.9% 1.7% 15.5%
Figure 6: POPULATION BY EDUCATIONAL ATTAINMENT, 2016
Source: Statistics Canada Census of Population, 2016
11
Statistics Canada 2016 Census
ECONOMIC DEVELOPMENT STRATEGY 183.4 Economic Sectors
In order to better understand in which sectors Simcoe County may have an advantage, this strategy examines
the location quotient and growth rates of regional industry sectors. A location quotient greater than 1.0 indicates
that the region has a higher than average concentration of employment in that sector than the national average.
Conversely, a location quotient of less than 1.0 indicates a lower concentration of employment in a particular sector
than the national average. Due to accuracy issues with employment data, we consider a region to have a “high”
location quotient if it is over 1.25. A location quotient between 0.75 and 1.25 is considered “average”, as it is considered
close to 1.0, and a location quotient below 0.75 is considered to be “low.”
Based on Figure 7, the sectors in Simcoe County showing the highest labour force concentrations relative to
Canada in 2016 are:
• Arts, entertainment and recreation (1.34) • Manufacturing (1.27)
The ranking of the top two location quotients has remained steady over the past six years, and given their strong
local concentrations, both manufacturing and tourism warrant important consideration in terms of how to maintain
and grow these sectors.
Though the two sectors discussed above have the highest location quotients, the County has a number of sectors
that perform near or above the national average in terms of local labour force concentration. Of the 21 major sector
groups, 13 show average labour force concentrations, spread across both goods and services-producing sectors.
Location quotients in these sectors remained rather static between 2014 and 2019, though the real estate, rental and
leasing sectors saw a notable decrease in its location quotient beginning in 2015.12
Six sectors had low location quotients in the County. Except for mining and oil and gas extraction – for which there
is little to no resource base to support employment in the region – those sectors were:
• Professional, scientific and technical service • Finance and insurance
• Information and cultural industries • Management of companies and enterprises
• Transportation and warehousing
2018 Location
Location Quotient Industry Quotient
Arts, entertainment and recreation 1.34
High (≥1.25)
Manufacturing 1.27
Retail trade
1.20
Accommodation and food services 1.18
Administrative and support, waste management and remediation services 1.18
Construction 1.14
Public administration 1.10
Health care and social assistance 1.10
Average (0.76-1.24)
Unclassified 1.00
Utilities 0.95
Other services (except public administration) 0.95
Wholesale trade 0.92
Educational services 0.87
Real estate and rental and leasing 0.83
Agriculture, forestry, fishing and hunting 0.80
Professional, scientific and technical services 0.70
Information and cultural industries 0.64
Transportation and warehousing 0.62
Low (≤ 0.75)
Finance and insurance 0.51
Management of companies and enterprises 0.28
Mining, quarrying, and oil and gas extraction 0.19
Figure 7: LOCATION QUOTIENTS, SIMCOE COUNTY,* 2019
Source: EMSI Analyst, 2019.1 Note: Includes Barrie, Orillia, Mnjikaning First Nation 32, Christian Island 30, and Christian Island 30A*Includes Barrie
and Orillia
12
Analyst Dataset 2019.1
ECONOMIC DEVELOPMENT STRATEGY 192013 - 2013 -
2013 2018
2018 2018 %
Jobs Jobs
Industry Change Change
11 Agriculture; forestry; fishing and hunting 4,318 3,423 -895 -21%
21 Mining; quarrying; and oil and gas extraction 430 482 52 12%
22 Utilities 1,409 1,326 -82 -6%
23 Construction 15,589 18,078 2,488 16%
31-33 Manufacturing 22,967 23,259 293 1%
41 Wholesale trade 8,635 9,103 468 5%
44-45 Retail trade 26,380 29,176 2,796 11%
48-49 Transportation and warehousing 7,406 6,667 -739 -10%
51 Information and cultural industries 2,355 2,548 192 8%
52 Finance and insurance 4,399 4,625 225 5%
53 Real estate and rental and leasing 4,072 3,996 -76 -2%
54 Professional; scientific and technical services 9,854 10,928 1,073 11%
55 Management of companies and enterprises 434 327 -108 -25%
56 Administrative and support; waste management
13,505 13,298 -207 -2%
and remediation services
61 Educational services 12,049 13,665 1,617 13%
62 Health care and social assistance 23,820 28,097 4,277 18%
71 Arts; entertainment and recreation 6,163 6,165 2 0%
72 Accommodation and food services 14,980 18,815 3,835 26%
9,726 9,346 -380 -4%
81 Other services (except public administration)
91 Public administration 13,808 14,932 1,124 8%
Figure 8: Simcoe County Jobs by Industry and Change between 2013 and 2018
Source: EMSI Analyst 2019.113
Taking into account sector growth and decline is also important. Figure 8 shows the growth in jobs from 2013
compared to 2018, by industry. The sectors which experienced the highest growth of jobs in the County are:
• Accommodation and Food Services • Educational Services
(Increase of 3,835 workers or 26%) (Increase of 1,617 workers or 13%)
• Health care and social assistance • Professional; scientific and technical services
(Increase of 4,277 workers or 18%) (Increase of 1,073 workers or 11%)
• Construction
(Increase of 2,488 workers or 16%)
Figure 8 also shows that the sectors with the largest negative growth are:
• Management of Companies and Enterprises • Transportation and Warehousing
(Decrease of 108 workers or 25%) (Decrease of 739 workers or 10%)
• Agriculture; Forestry; Fishing and Hunting
(Decrease of 895 workers or 21%)
There is a predictable proportion of service-based jobs that are associated with population growth.14
Through both the location quotient and growth analysis, as well as considering feedback from key stakeholder
interviews, the EDO has identified several sectors of interest to help sustain, grow, or explore. These sectors
include the manufacturing, tourism (arts, entertainment and recreation; and accommodation and food service),
professional, scientific and technical services, and the agricultural sector.
13
Emsi Analyst’s Canadian dataset incorporates and harmonizes labour market data from SEPH, LFS, CBP, Census, and PSIS, pro-
viding it in a format that is easy to understand, access, and use. By combining these disparate datasets into one master set, the
strengths of each can compensate for the weaknesses of the others. The data reaches back to 2001 and is projected forward to
2026. The Canada Analyst tool is updated twice a year with new data from various sources, providing access to the most current
information. Figures pulled from EMSI Analyst is considered a projection.
14
Hemson Consulting study “York Region Future Employment Trends Study Report” (2019)
ECONOMIC DEVELOPMENT STRATEGY 203.4.1 Manufacturing
Manufacturing was one of the region’s largest employers in 2018, with approximately 23,259 employees. While a
major employer, the sector only realized about 1% growth over the past 5 years. Based on the data collected, the
sector is experiencing a significant shortage in talent, particularly in skilled trades. There is also a need to support
the sector in planning for future competitiveness, which includes becoming more equipped to implement innovative
processes and technologies and succession planning. The EDO’s foreign direct investment (FDI) strategy recognizes
the manufacturing sector as a traditional strength, one that needs to be retained and further diversified. While key
stakeholders felt there was a strong need to continue to support and grow the manufacturing sector, there was
also an acknowledgement that the region may have a strong reliance on it in terms of economic development and
exploring opportunities to diversify the economy is important. Several areas of interest within the manufacturing
sector were identified by Simcoe County stakeholders. These included aerospace, automotive, health and wellness,
food and beverage and cleantech.
Taking a closer look at recent opportunities and challenges in the sector, Figure 9 highlights sub-sectors of the
manufacturing NAICS and their related change in employment in Simcoe County between 2013 and 2018. These
sub-sectors are worth further investigation to determine what the EDO can do to better assist those sub-sectors
with growth or help them address challenges. Of particular note, jobs in the paper manufacturing sub-sector
grew by 73% between 2013 and 2018, albeit, its location quotient is still only 0.80. As well, jobs in the miscellaneous
manufacturing sub-sector increased 68% and it has a strong location quotient of 1.83. In both cases there may be
a possibility to expand on the competitiveness of those sub-sectors, given their considerable growth in the past two
years. Alternatively, plastics and rubber products manufacturing, fabricated metal product manufacturing and
machinery manufacturing have all hosted an 11-22% decrease in the size of their workforce. This warrants further
investigation as they have a moderately sized workforce and both plastics and rubber product manufacturing and
machinery manufacturing have location quotients above 1.25.
2018
2013 2018 2013 - 2018 2013 - 2018 %
Description Location
Jobs Jobs Change Change
NAICS Quotient
311 Food manufacturing 1,152 1,184 32 3% 0.43
312 Beverage and tobacco product manufacturing 474 599 125 26% 1.20
313 Textile mills 120 114 (6) (5%) 1.33
314 Textile product mills 145 124 (21) (14%) 0.95
315 Clothing manufacturing 57 16 (41) (72%) 0.07
316 Leather and allied product manufacturing 25 0 (25) (100%) 0.00
321 Wood product manufacturing 467 612 145 31% 0.55
322 Paper manufacturing 284 490 206 73% 0.80
323 Printing and related support activities 569 635 66 12% 0.96
324 Petroleum and coal product manufacturing3.4.2 Tourism
Employment in the arts, entertainment & recreation; and accommodation & food services sectors totaled 24,980
or 11% of the workforce employed in a classified industry sector in 2018, making it a significant regional employer,
although not all of these jobs may have a direct link to tourism. Figure 10 provides detail on sub-sectors of interest
such as amusement, gambling and recreation with its high location quotient, and accommodation services, which
experienced 49% job growth in the last five years.
2018
2013 2018 2013 - 2018 2013 - 2018 %
Description Location
Jobs Jobs Change Change
NAICS Quotient
711 Performing arts, spectator sports and related industries 1,128 951 (177) (16%) 0.57
712 Heritage institutions 180 202 22 12% 0.67
713 Amusement, gambling and recreation industries 4,854 5,012 158 3% 1.90
721 Accommodation services 1,846 2,751 905 49% 1.13
722 Food services and drinking places 13,135 16,064 2,929 22% 1.19
Figure 10: Sub-sectors of interest under the arts, entertainment and recreation, and accommodation and food services NAICS, change in jobs
over time and 2018 location quotient.
Source: EMSI Analyst 2019.1
3.4.3 Professional, Scientific, and Technical Services
While not a top employer in the region with 10,928 jobs and a location quotient of 0.70, the professional, scientific
and technical services has experienced a moderate 11% job growth over the last 5 years. Several stakeholders have
highlighted this as a potential area of diversification, particularly when it comes to attracting entrepreneurs to the
region. Figure 11 details some trends in the sub-sector to give insight on shifts that have been experienced between
2013 and 2018 in Simcoe County. Of particular interest is the specialized design services sub-sector which experienced
employment growth of 125% between 2013 and 2018. Also, of interest, employment in engineering services, a specific
labour need that came through the business survey, shrunk, in conjunction with architectural services, by 8% over the
same period.
2018
2013 2018 2013 - 2018 2013 - 2018 %
Description Location
Jobs Jobs Change Change
NAICS Quotient
541 Professional, scientific and technical services 9,854 10,928 1,074 11% 0.70
5411 Legal services 1,099 1,321 222 20% 0.85
5412 Accounting, tax preparation, bookkeeping and payroll services 1,670 1,763 93 6% 0.89
5413 Architectural, engineering and related services 2,013 1,843 (170) (8%) 0.66
5414 Specialized design services 327 737 410 125% 1.14
5415 Computer systems design and related services 1,291 1,613 322 25% 0.42
5416 Management, scientific and technical consulting services 1,558 1,752 194 12% 0.85
5417 Scientific research and development services 64 61 (3) (5%) 0.10
5418 Advertising, public relations, and related services 641 614 (27) (4%) 0.64
5419 Other professional, scientific and technical services 1,190 1,224 34 3% 1.01
5511 Management of companies and enterprises 434 327 (107) (25%) 0.28
5611 Office administrative services 828 635 (193) (23%) 0.92
Figure 11: Sub-sectors of interest under the manufacturing NAICS, change in jobs over time and 2018 location quotient.
Source: EMSI Analyst 2019.1
ECONOMIC DEVELOPMENT STRATEGY 22You can also read