2018 Montana Economic Report - An analysis and assessment of Montana's Economic Performance - Bureau of Business and Economic Research
←
→
Page content transcription
If your browser does not render page correctly, please read the page content below
2018 Montana
Economic Report
An analysis and assessment of Montana’s Economic Performance   BUREAU OF BUSINESS AND
                                                               ECONOMIC RESEARCH
                                                               U N I V E R S I T Y O F M O N TA N A
About The Montana ECONOMIC Report
The Montana Economic Report is an annual assessment of economic activity in the state of Montana produced by the Bureau of Business and Economic Research at the University
of Montana. Contributors to this report include presenters in the Economic Outlook Seminar. For more information about the bureau and to access this report online, visit www.
bber.umt.edu.

About the Bureau of Business and Economic Research
The Bureau of Business and Economic Research is the main research unit of the College of Business at the University of Montana. Established in 1948, its mission is to inform Montanans
about the economic climate in which they live and work. In addition to conducting its Economic Outlook Seminar across the state at the beginning of each year, BBER researchers
are engaged in a wide range of applied research projects that deal with different aspects of the state economy, including survey research, economic analysis, health care research,
forecasting, wood product research and energy research. Contact us at (406) 243-5113 or bber@business.umt.edu if we can be of any help to you or your business.

2018 Montana Economic Report                                                                   Advisory Board
Christopher Shook                                                                              Julia Altemus                                Allison Johnston
Dean, College of Business                                                                      Montana Wood Products Association            Payne West Insurance
University of Montana                                                                          Missoula                                     Missoula

Patrick M. Barkey                                                                              Dennis Beams                                 Matt Jones
Director                                                                                       Glacier Bank                                 BNSF Railway
Bureau of Business and Economic Research                                                       Kalispell                                    Bozeman

Scott Hawk                                                                                     Kathy Boelter                                Paddy Fleming
Publications Director, Editor                                                                  Arrow Solutions Group, Inc.                  Montana Manufacturing Extension
Bureau of Business and Economic Research                                                       Billings                                     Center
                                                                                                                                            Bozeman
Rob Van Driest                                                                                 Diana Holshue
Marketing Director                                                                             Federal Reserve Bank of Minneapolis          Bill Whitsitt
Bureau of Business and Economic Research                                                       Helena                                       Executive in Residence

   2                                                                                                                                                      2018 Montana Economic Report
Table of Contents
The Year In Review                                                      Assessing Montana’s Key Industries
Statewide Economic Performance: Unraveling the Mystery             4    Farming and Ranching: Low Prices Hit Home                              26
The Performance of the BBER Forecast: Improving Numbers            5    Forest Products: Wildfires Present Opportunities                       27
Montana’s Regions and Cities: Western Growth Dominates             6    Oil, Natural Gas and Coal: How Bad is Montana’s Oil Bust?              28
State Revenue Report: A Year of Slow Growth                        8    Manufacturing: Diverse and Growing                                     30
Major Economic Events of 2017: Trump, Wildfires and Medicaid       9    Travel, Tourism and Recreation: Season of Wildfires                    31
                                                                        Health Care: Recent Trends in Health Care Spending                     32
                                                                        Transportation and Logistics: Worldwide Expansion Revives Growth       33
The U.S. Economic Outlook                                               Technology and Innovation: Montana’s Tech Hub Gains Visibility         34
The U.S. and Global Economies: Is Stagnation Behind Us?            12   Real Estate and Construction: Housing Starts Leveling Off              34

The Montana Economy In Depth
Behind the Malaise in Montana Revenue Collections                  14
The Future of Higher Education in Montana                          17
Affordable Housing in Montana: Are We Pricing Out Our Residents?   20
Investments in Montana’s Young Children Yield High Returns         23

  2018 Montana Economic Report                                                                                                             3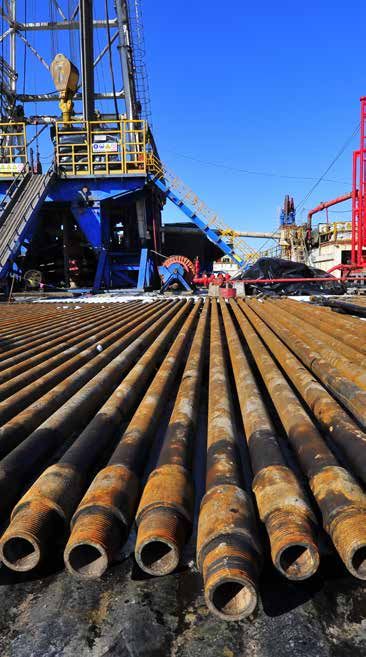
THE YEAR IN
REVIEW
Statewide Economic Performance                                                              The biggest contributor to wage growth in fiscal 2017 was health care, where payrolls
                                                                                            expanded by $180 million (Figure 1). Expansion has been fueled in part by the Medicaid
Unraveling the Mystery                                                                      expansion in Montana, which reduced the uninsured population statewide. Other
                                                                                            highlights of 2017 growth include:
By Patrick M. Barkey
Bureau of Business and Economic Research at the University of Montana                       • Slightly faster growth in financial activities and professional business services, led
                                                                                              by strong tech-related expansions in western Montana, as well as robust real estate
The economy contains a lot of moving parts and the economic performance of the state          performance.
of Montana over the past year suggests that not all of those pieces are moving in sync.     • Slightly slower growth in construction and manufacturing, due to a wind down of
                                                                                              industrial construction projects in Billings and the continued restraint in single family
2017 was a year of reasonably good wage growth and continued gains in employment              home building.
for the state as a whole. Wages paid to payroll workers in fiscal year 2017, which ended    • A sharper growth slowdown in retail and wholesale trade as competition from online
on June 30, were more than $800 million higher than in the previous fiscal year. On an        merchants takes its toll on brick and mortar retailers across the state.
inflation-corrected basis, wage growth has remained between 3.2 and 3.5 percent for         • A modest improvement in mining industry wages with declines moderating in the
each of the past three years. This is a very respectable performance.                         face of very modest improvements in prospects for both coal and oil.
                                                                                            • Rail and transportation remain down significantly from three years ago, but have
But wages only make up about two-thirds of total earnings and the other pieces that           made a very modest recovery from a down year in 2016. And the expansion in
make up the total – most notably business owner income – have not fared as well. This         government payrolls experienced in 2016 has moderated in 2017.
business proprietor income – the production-related income of sole proprietorships,
partnerships and tax-exempt cooperatives – sharply contracted by 6.6 percent in calendar    Largely missing from these statistics on performance is the state’s agriculture industry.
year 2016 (data for 2017 are not yet available). With income from royalties, interest and   Montana farmers and ranchers, already suffering from the global grain glut and lower
rent also posting a disappointing 0.2 percent growth in 2016, the overall income perfor-    cattle prices, were hit with drought and in some cases wildfires in 2017. Their plight
mance of the state was less robust than wage growth.                                        does not show up in analyses of wage growth because their payroll workforce is small,

   4                                                                                                                                                     2018 Montana Economic Report
Figure 1. Growth in real covered wages, fiscal year 2016 and 2017. Source: U.S. Bureau of Labor into account the prerecession boom years, the unanticipated Great Recession and the
Statistics, Quarterly Census of Employment and Wages. complications presented by continuous data revisions, this approximation performance
has been relatively good. Moreover, since the end of the Great Recession in 2010, our
Millions projections have come within 1.1 percentage points on average.
-$150 -$100 -$50 $0 $50 $100 $150 $200
Our forecast for 2017 was 2.5 percent growth in inflation-adjusted nonfarm earnings.
Construction and manufacturing
Thus far into the year it seems that this forecast over-projected economic growth in the
state, which has been most recently reported as 1.5 percent growth. Our forecasted
Retail and wholesale trade figure of 2.5 percent was based in part on the reported growth in 2016, which has since
been revised from 2.5 percent to 1.6 percent.
Finance and business services
Health care The latest economic reports have revised the data as far back as 2012. One primary item
of interest in the revisions is that the actual economic growth in both 2014 and 2015
Accommodations and food services
was 0.1 percentage points higher than reported last year. This revision inched us closer
Public administration to our original forecast in 2014 and further from that of 2015. As previously stated,
growth in 2016 has been revised to be 0.9 percentage points lower than last reported.
Mining This moved us even further from our 2016 forecast to become the second largest gap
between projected and actual growth since 2009. This gap – 1.3 percentage points in
Other
2016 – is still lower than average over the time span since 2002.
2016 2017 Bearing all of this in mind, the current estimated difference between projected and
actual growth in 2017 of 1 percentage point is both lower than the average difference
but the losses suffered by owners and families promises to be substantial when the
data arrive. Figure 1. Actual and project change in real nonfarm earnings, Montana, 2002-17. Source: Bureau of
Business and Economic Research, U.S. Bureau of Economic Analysis.
The labor market continued to perform well in 2017, with FY17 payroll jobs up by nearly
5,000 and continued low unemployment rates across the state. It was a good year for 6%
6
wage and salary workers, less so for business owners, especially farmers and ranchers. 5.1
5.3
4.9
5%
4.3 4.2 4.1 4
4% 3.7
The Performance of the BBER Forecast 3%
3
2.6 2.8
3.1
2.6
3 2.7
2.3
3.1
2.8 2.9
2.5
Percent
2
Improving Numbers
1.6
2% 1.4 1.5
1.2 1.4 1.3
0.8
1% 0.5
By Brandon Bridge 0%
0
2002 2003 2004 2005 2006 2007 2008 2009 2010 2011 2012 2013 2014 2015 2016 2017
Bureau of Business and Economic Research at the University of Montana -1%
-2%
Since 2002, the Bureau of Business and Economic Research (BBER) forecast has approx- -1.8
imated Montana’s economic growth within 1.7 percentage points on average. Taking
Actual Projected
2018 Montana Economic Report 5
over the entire time span since 2002 and lower than the average difference since the                    Figure 1. Growth in wages, FY16 and FY17, millions of 2009 dollars. Sources: U.S. Bureau of Labor
end of the Great Recession.                                                                             Statistics and Bureau of Economic Analysis.

While these data are likely to undergo continued revisions as more accurate source data                  $200
are reported, the performance of the BBER forecast continues to improve.

                                                                                                         $150

Montana’s Regions and Cities

                                                                                             Millions
Western Growth Dominates                                                                                 $100

By Patrick M. Barkey
Bureau of Business and Economic Research at the University of Montana                                     $50

Even before a severe drought spread across all but the northwest corner of the state
last summer, the economic fortunes of Montana’s agricultural dominated communities                         $0

were waning. Shifts in the marketplace sent ag prices and revenues falling. Meanwhile,                           Cascade    Flathead   Gallatin   Lewis &   Missoula    Silver   Yellowstone Rest of
                                                                                                                 County      County    County      Clark    County      Bow        County    the state
the economies of Montana’s traditionally faster growing urban areas in the west and                                                               County               County
southwest were catching fire. Key industries such as health care, tourism and tech-re-
lated businesses broke out in faster growth.
                                                                                                                                                     2016       2017

That pattern of growth solidified in 2017. Most urbanized parts of the state managed to
                                                                                                        Wage growth also picked up in the balance of the state, for reasons almost as varied as
at least tread water or register some growth last year. But there was no question that
                                                                                                        the 49 counties that go into the total. Counties near the state’s urban centers in the west,
the pattern of growth continued to tilt westward with places like Missoula and Ravalli
                                                                                                        such as Ravalli, Lake and Madison counties, enjoyed strong in-migration and growth.
counties joining the likes of the already high-flying Flathead and Gallatin counties.
                                                                                                        The oil patch counties on the eastern border saw an end to the declines they have
                                                                                                        suffered since the oil price bust of 2014. Central and eastern counties saw declines.
The time lag before complete information on the economic performance of the state’s
counties and regions becomes available makes this assessment more tentative than
                                                                                                        Payroll job growth cooled slightly across the state in the fiscal year 2017 – using the data
we would like. There is evidence from national data that suggests that the second half
                                                                                                        on payroll jobs from employer unemployment insurance filings as a basis for comparison.
of 2017 – where we lack county-level data – was slightly stronger than the first. But the
                                                                                                        This covered employment was up by just under 5,000 jobs in 2017, compared to 8,100
most recent data do tell an interesting and valuable story about how regions and cities
                                                                                                        jobs the previous fiscal year.
are faring.

                                                                                                        Cascade County (Great Falls)
Growth in Payroll Employment and Wages

                                                                                                        The Great Falls economy has been on a slower growth trajectory for most of the post-re-
The growth in wages – the total paid to all payroll workers – was stronger statewide
                                                                                                        cession period. Impressive gains in manufacturing and construction are the exception.
than the growth in income. Comparing total wages paid out during the fiscal year 2017,
                                                                                                        Led by expansions at companies like Lowenbro and ADF, growth in these areas has been
which ended on June 30, to those paid out in the preceding fiscal year shows Gallatin
                                                                                                        above the state average. The declining fortunes of agricultural producers and more
County once again at the top of the growth rankings, adding $138 million to total payrolls

   6                                                                                                                                                                     2018 Montana Economic Report
Figure 2. Growth in jobs, FY16 and FY17. Sources: U.S. Bureau of Labor Statistics and Bureau of     Gallatin County (Bozeman)
                         Economic Analysis.
                                                                                                                             Gallatin continues to be the growth leader statewide by a large margin with steady,
                          $3,000                                                                                             inflation-corrected wage growth in the neighborhood of 7.5 percent in recent years. The
                                                                                                                             boom is perhaps best exemplified in construction industries, which are growing payrolls
                          $2,500
                                                                                                                             at almost twice that rate. For a smaller community its economic drivers are surprisingly
                                                                                                                             diverse with the presence of Montana State University and Yellowstone National Park
Hundreds and thousands

                          $2,000
                                                                                                                             as a base, and with robust expansions in tech-related services and manufacturing adding
                          $1,500                                                                                             fuel to the growth engine. Congestion and affordability have emerged as pressing issues
                          $1,000
                                                                                                                             for the community, but many other parts of the state would wish to have those problems.

                            $500                                                                                             Lewis and Clark (Helena)

                              $0
                                                                                                                             Slower growth in the Helena economy was a godsend when the rest of the state suffered
                           $-500                                                                                             through the Great Recession. But eight years later the continued lower trajectory of
                                    Cascade   Flathead     Gallatin   Lewis &   Missoula    Silver   Yellowstone Rest of     economic growth – wages grew by 1.8 percent in 2016 – has been less welcome. Visible
                                    County     County      County      Clark    County      Bow        County    the state   success stories in manufacturing, including the Boeing facility, have more than offset
                                                                      County               County
                                                                                                                             downturns, such as the Drumlummon mine closure in the recent past. Most of the area’s
                                                                                                                             more important industries – with the most important by far being state and federal
                                                                         2016      2017                                      government – saw growth in line with the overall average in 2017. The exception was
                                                                                                                             construction, which grew more slowly.
                         restrained demographic trends have been a detriment to growth in high employing
                         sectors like retail trade, professional business services and health care. The latter saw           Missoula
                         reasonably strong growth in 2017, but no more than the state average.
                                                                                                                             The Missoula economy has quietly emerged from underperforming in the immediate
                         Flathead County (Kalispell)                                                                         aftermath of the Great Recession to growth in the past two years that is on par with
                                                                                                                             Flathead County. It was the only urban area in the state to see growth accelerate in 2017.
                         Strong growth in Kalispell has been propelled by major infrastructure improvements                  Much of that surge was due to strong construction activity, particularly commercial and
                         (especially the completion of the U.S. 93 bypass), some major expansions in health care             multifamily residential structures. Professional business companies, such as technology
                         and its rising prominence as a retail center. The area also benefited from the heavy                consultants ATG, also played an important role in boosting wages faster than jobs. The
                         traffic of visitors to Glacier National Park. Recently completed and continuing expansions          falloff in University of Montana enrollment has been partially offset by increased research
                         in health care, such as the new pediatric facility, accounted for more than half of total           activity, although reductions appear to be coming. To the immediate south, Ravalli
                         growth in wages in fiscal year 2017.                                                                County has enjoyed faster growth, which led to a rebound in real estate and construction
                                                                                                                             activity.
                         Construction growth has also been healthy with wage growth at the state average.
                         Columbia Falls has suffered more turbulence, but improvements in the wood products                  Silver Bow (Butte)
                         market have raised hopes of gaining back some of the losses.
                                                                                                                             An unheralded, but very real improvement in copper prices was felt in the Silver Bow
                                                                                                                             economy in 2017. Home to the Montana Resources mine, the county is one of the few

                            2018 Montana Economic Report                                                                                                                                                           7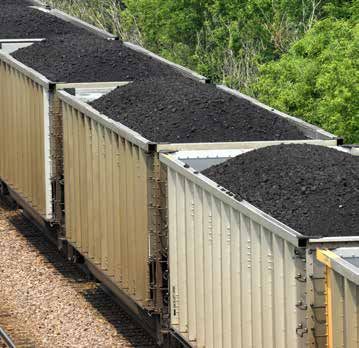
in the state that saw an increase in mining earnings. Visitor related businesses in the                   Figure 1. State general fund revenue collections, year over year change. Source: Legislative Fiscal
area also enjoyed a successful year, as did Montana Tech. Some of those brighter stories                  Division.
were offset by weaker performances in construction, utilities and manufacturing
employers. Health care was another sector that saw growth, but less than in other parts                     $250
of the state. Butte has experienced consistent growth – except during the recession – for                   $200
the better part of 15 years, although at a rate that is lower than the state average.                       $150
                                                                                                            $100
Yellowstone (Billings)
                                                                                                             $50

                                                                                               Millions
                                                                                                              $0
As the distribution and warehousing hub for a four-state area, the state’s largest local
economy has borne the brunt of the downturn in transportation and wholesale trade                           ($50)

that has beset the national economy as a whole. Since 2014, it has faced the added                        ($100)
challenge of the slump in the Bakken due to low oil prices. 2016 was a particularly                       ($150)
challenging year with total wages inching up just 0.3 percent. But its economic vitality                  ($200)
is better than the figure suggests, owing to the ups and downs of construction activity                                  FY08      FY09       FY10       FY11     FY12      FY13       FY14         FY15          FY16      FY17

at the refineries that can distort the totals. Its health care employers have grown signifi-              Change       $123.668 ($145.572) ($180.823) $155.413   $88.396   $206.668   ($0.578)     $122.609 ($78.365)      $20.191

cantly, due in part to Medicaid expansion. Trend growth across the entire economy
remains in line with the overall state average.
                                                                                                          There are seven categories of revenue that contribute 86.6 percent of the receipts to
                                                                                                          the state general fund. The remaining categories make up the difference of 13.4 percent.
State Revenue Report                                                                                      Figure 2 shows the seven major categories, plus all the remaining sources lumped
                                                                                                          together.
A Year of Slow Growth

By Terry Johnson                                                                                          Figure 2. State general fund revenue collections, change from FY16 to FY17, in millions. Source:
Bureau of Business and Economic Research at the University of Montana                                     Legislative Fiscal Division.

                                                                                                                                                                                       Millions
Montana’s general fund revenue collections are a benchmark for total state government
                                                                                                                                             ($20)       ($15)   ($10)       ($5)          $0            $5          $10       $15         $20
revenues. There are many other state receipts, such as federal and dedicated revenues,
but the general fund is the account that provides a significant portion of revenue that                             Individual income tax    ($16.603)
supports many general government operations. General fund revenues are a mix of
                                                                                                                             Property tax                                                            $3.124
fees, taxes and investment earnings that are highly dependent on national and state
economic conditions, as well as global market trends.                                                           Corporation income tax                                                                                               $15.605

                                                                                                                    Vehicle taxes and fees                                                      $0.717

Figure 1 shows the year-over-year change in collections since FY08. From FY16 to FY17          Oil and natural gas production tax                                                                                 $7.251
general fund revenue increased only $20 million or 1 percent. Slow or negative growth
                                                                                                          Insurance tax and license fees                                                                      $6.303
patterns usually occur during economic downturns like the Great Recession of 2008-09.
Montana did not experience a recession in 2017.                                                                      Video gambling tax                                         ($0.598)

                                                                                                                    Remaining categories                                                                 $4.393

   8                                                                                                                                                                                       2018 Montana Economic Report
Individual income tax receipts were below the FY16 amounts by $16.6 million or 1.4
     percent. All other categories were above 2016 amounts except for video gambling taxes.             Major Economic Events of 2017
     These revenues were below 2016 by a minimal amount.                                                Trump, Wildfires and Medicaid
     Individual income taxes were negatively impacted by slow wage growth influenced by                 By Patrick M. Barkey
     low commodity prices. Figure 3 shows the year-over-year change in withholding tax                  Bureau of Business and Economic Research at the University of Montana
     receipts. Withholding collections represent a proxy for underlying wage growth in
     Montana. Withholding growth slowed in 2016 and 2017 compared to the higher rates                   Montana experienced one of the most severe and prolonged fire seasons in recent
     observed from 2011 to 2015. Low commodity prices for oil, natural gas, coal and agricul-           history during the summer of 2017. Approximately 1.3 million acres burned in more
     tural products impacted employment levels and thus corresponding wage growth                       than 2,100 fires across the state. The largest fire, the Lodgepole Complex fire, started
     (withholding receipts).                                                                            on July 19 and consumed 270,000 acres of grazing land in eastern Montana, causing
                                                                                                        devastating losses for farmers and ranchers.
     The 65th Legislature assumed an individual income tax growth rate of 4.5 percent from
     FY16 to FY17. The Legislature adjourned before the final collections were known for                The estimated $74.2 million in costs to state government overwhelmed the $32.3 million
     FY17. Since actual collections were below the FY16 amount by 1.4 percent, the individual           set aside by the Legislature for the 2018-19 biennium.
     income tax budget shortfall for FY17 was 5.9 percent (1.4 percent + 4.5 percent). This
     difference, combined with significant 2017 wildfire costs, explains why the executive              The surprisingly poor performance of Montana general fund revenue collections, together
     and Legislature negotiated budgetary solutions to the general fund financial condition             with the substantially higher fire suppression costs incurred during the summer of 2017,
     during the November special legislative session.                                                   necessitated a special session of the Legislature called by the governor in November
                                                                                                        2017. Income tax revenues, which account for nearly half of total general fund revenues,
     Figure 3. Withholding growth rates, year-over-year percent change. Source: Statewide Accounting,   were especially weak.
     Budgeting & Human Resource System.
                                                                                                        A severe drought that began in northeastern Montana spread across most of the state
                                                                                                        by late summer, drastically affecting crop yields and grazing land. Montana pulse crop
            8%
                                  7.36                                                                  production, which had been growing strongly, was particularly affected.
                                                                   6.56
            7%                              6.43
                       6.11                                                                             The Trump administration began the year with a series of cabinet appointments and
            6%                                                                                          administrative actions that promised a break with the land and environmental policies
                                                       4.64                                             of the past. These included the approval of the Keystone XL pipeline project, a termi-
            5%
                                                                                                        nation of the moratorium on coal leases and the suspension of the Clean Power Plan.
Percent

                                                                                         3.84
            4%
                                                                                                        The reimbursement model for health care in general and Montana’s Medicaid expansion
            3%                                                                                          in particular, remained uncertain as the U.S. Senate considered, but did not pass, a
                                                                              2.38
                                                                                                        series of bills that would have substantially dismantled the Affordable Care Act’s insurance
            2%
                                                                                                        expansion. Growth in insurance premiums continued for many Montana health plans,
            1%                                                                                          putting pressure on households and employers.

            0%                                                                                          Lumber prices quietly rose nearly 50 percent over year-ago levels, as steady increases
                      FY11       FY12      FY13        FY14       FY15        FY16       FY17           in construction spending created more pressure on supply. The first expansion in nearly

                                                    Fiscal Year

          2018 Montana Economic Report                                                                                                                                                         9
a decade, which would add about 70 jobs to the SmartLam mill in Columbia Falls, was announced in the fall. Other facilities report added shifts with the prospect of salvage logging in wildfire areas lending hope for better access to supply. Friesen Foods, an Alberta-based food products company, filed a special use permit for a large slaughterhouse and food processing facility on the outskirts of Great Falls. If put into operation, it would employ up to 3,000 workers and represent the largest investment in value-added agriculture in state history. Despite wildfire smoke, 2017 was another year of surging visitors to Montana parks. Glacier National Park saw more than a million visitors in the month of July, the first time any national park has hit that milestone. Modest recovery in Bakken oil drilling activity in 2017 put an end to the steep economic declines suffered by Montana’s oil patch counties. Richland, Dawson and Custer counties registered economic growth for the first time since the end of 2014. 10 2018 Montana Economic Report
The U.S. Economic
Outlook
The U.S. and Global Economies                                                                 has averaged nearly 3 percent. With strong momentum at the end of the year, IHS Markit
                                                                                              expects growth in calendar year 2018 to be 2.6 percent, above the 2.3 percent in 2017
Is Stagnation Behind Us?                                                                      and well above the 1.5 percent in 2016.

By Patrick M. Barkey                                                                          2. Europe’s expansion will slow a little, but remain solid.
Bureau of Business and Economic Research at the University of Montana
                                                                                              3. Japan’s growth spurt will fade. The debt ridden government is unlikely to renew
Economics has been living up to its old moniker as the “dismal science” lately. The slow      stimulus in fiscal year 2018.
growth in many of the world’s largest economies, including our own, has been dismal
enough, but depictions of the slowdown by some renowned economists as a secular               4. China’s momentum will weaken. Structural problems in the world’s second largest
stagnation that is likely to persist for many years hasn’t been uplifting news either.        economy – excess industrial capacity, debt overhang and a housing glut remain unsolved.

So the announcement that during the second half of 2017 economies around the world            5. The performance of the emerging world will improve gradually. The external environment
recorded their best growth performance since 2011 comes as welcome relief from a              shows modest improvement, but governance and growing debt problems will restrain
steady diet of disappointing economic news. This sets the stage for a pickup in growth        the improvement.
in 2018 in the United States. Growth in the economies of our largest trading partners
looks even more certain.                                                                      6. The rally in commodity prices is over. Prices going forward will show volatility, but
                                                                                              the prospects for a sustained rally are dim.
Here are the top 10 predictions for the economy in 2018, courtesy of our friends at IHS
Markit, a national forecasting firm:                                                          7. Upward pressures on inflation will remain muted. While inflation is spiking in basket
                                                                                              case economies like Venezuela and Zimbabwe, the developed world continues to struggle
1. The U.S. economy will sustain above-trend growth. The U.S. economy began 2017 on           to surpass the 2 percent target of central banks.
a weak note, with a paltry 1.2 percent growth rate in the first quarter. Since then, growth

  12                                                                                                                                                        2018 Montana Economic Report
Table 1. A quick look at the numbers (annual rates). Source: IHS Markit.
Annual rates 2017Q2 2017Q3 2017Q4 2018Q1 2018Q2 2016 2017 2018 2019 2020
Real GDP (% ch.) 3.1 3.3 2.7 2.2 2.5 1.5 2.3 2.6 2.3 1.9
Real consumer spending (% ch.) 3.3 2.3 2.8 2.7 2.3 2.7 2.7 2.5 2.3 2.1
Federal funds rate (%) .95 1.15 1.21 1.44 1.72 .40 1.00 1.76 2.33 2.84
10-yr. T-note yield (%) 2.26 2.24 2.38 2.55 2.76 1.84 2.33 2.84 3.38 3.60
Brent crude price ($/barrel) 50.94 52.17 60.08 57.67 54.67 44.24 54.47 55.71 57.58 67.03
CPI (year/year % ch.) 1.9 2.0 2.1 1.7 1.9 1.3 2.1 1.8 2.1 2.7
Housing starts (millions) 1.167 1.164 1.237 1.223 1.251 1.177 1.201 1.269 1.393 1.440
Unemployment rate (%) 4.4 4.3 4.1 4.0 4.0 4.9 4.4 3.9 3.8 4.0
Figure 1. Estimates of recession probability. Source: Wells Fargo. 8. The Federal Reserve will keep raising interest rates – some other central banks may
follow. The Fed is on track for another three interest rate hikes in 2018, with some chance
100% that they will do more if concerns over tight labor markets justify it.
90%
9. The U.S. dollar will be pushed up a little more. After the roller coaster ride of 2017,
80% the dollar is likely to get nudged higher in 2018 – although depending on political
developments, volatility could also remain high.
70%
60% 10. With global growth momentum strengthening, the risks of a recession remain low.
Percent
Since growth is now stronger and more synchronized across the world, derailing it would
50%
require a large shock.
40%
30%
20%
10%
0%
1980
1982
1984
1986
1988
1990
1992
1994
1996
2000
2002
2004
2006
2008
2010
2012
2014
2016
1998
2018 Montana Economic Report 13The Montana
Economy in Depth
Behind the malaise in Montana Revenue because the July-October period of 2016, which was used as a basis of comparison for
this calculation, was extraordinarily weak. If we compare recent collections to two years
ago, the growth is just 1 percent.
Collections This stark reality has led to a new kind of confusion. Why aren’t revenues coming in as
By Patrick M. Barkey they should be? Behind this question is the premise that the economy is strong and
Bureau of Business and Economic Research at the University of Montana thus the underperformance of revenue collections reveals a flaw in our tax system, not
weakness in the base. As a matter of logic this is certainly possible, but calling a forecast
There has always been a lot of confusion in discussions about tax revenues in Helena. right and the data wrong is not something that forecasters commonly do.
More accurately, there is confusion when these discussions are circulated outside the
political community in our state capital – most of which is language. A spending “cut” The Heart of the Matter: The Personal Income Tax
in budget speak usually means a lower rate of growth than previously planned. Revenues
which grow less than forecasted are referred to as “down.” Thus, the news about revenues, There are 32 taxes, fees and other sources of revenue that account for about 98 percent
which ultimately required a special legislative session last November, requires some of all Montana general fund revenue. Of those, the personal income tax accounts for
interpretation. more than half. In some years, big swings in more volatile taxes have made general fund
revenues surge and wane. But the story behind this recent sluggish revenue performance
The discussion of declines and shortfalls in Montana tax revenues is more than semantics. has been stagnation in the receipts of Montana’s most important tax.
General fund revenues are extraordinarily weak. On a fiscal year basis, general fund
collections – encompassing the entire suite of state taxes and fees not earmarked for Are personal income collections tracking the economy? A glance at Figure 1, which
specific use – managed to grow by just $20 million in 2017. On a base of $2.1 billion, displays income tax collections and personal income for each fiscal year 2002-17 along
that’s roughly a tenth of a percentage point growth. The first four months of the new a regression line, reveals that tracking is less than perfect. While there is a close fit
fiscal year have been a bit better with revenues up about 2.4 percent. That’s mostly between income growth and tax collections, there have been some significant departures
from what you might expect at different points in history.
14 2018 Montana Economic ReportFigure 1. Income tax receipts vs. personal income. Sources: U.S. Bureau of Economic Analysis and The Changing Composition of Income Growth
Montana Department of Revenue.
This finding suggests that the root of the issue for personal income tax collections lies
2016 in the trends in the base. For this analysis it is preferable to deal with annual personal
1,200 Parameter estimates 2015 2017 income data from the U.S. Bureau of Economic Analysis, rather than quarterly infor-
Intercept = -115.9
Slope = 0.0283 mation, because it has already undergone some revision and is based on more complete
2014
source information. This necessitates focusing on calendar years, which do not exactly
2013
correspond to the state’s fiscal year data.
1,000
Income tax collections
Personal income, in the main, consists of three components: 1) earnings, which is income
2012
derived from employment; 2) unearned income, consisting of dividends, interest, rent
2008
2011 and royalties; and 3) transfer payments, which are largely payments from government
800
2007 2009 programs, such as social security, disability or unemployment insurance. There are
2006 other pieces as well, but these are less important. Of the three, the most important is
2005 2010
earnings, which comprises about 60 percent of the total.
600 2004
After surging in 2015, earnings growth in Montana fell to 1.2 percent in 2016 (Figure 2).
2003 There was also a steep decline in growth of unearned income in Montana in 2016 after
2002
$25,000 $30,000 $35,000 $40,000 $45,000
Figure 2. Percentage change in Montana personal income, 2014-16. Source: U.S. Bureau of Economic
Personal income (seasonally adjusted) Analysis.
In the prerecession years of 2005-07, income tax receipts were stronger than income
growth would seem to support. There was a run of errors in the opposite direction 8%
following the recession, when in 2010-12 revenues fell substantially short of what
7%
personal income growth would predict. And at the upper right edge of the graph, you
can see that 2017 collections lay exactly on the line. By this measure 2017 revenues 6%
were exactly consistent with the historical relationship between taxes and the economy.
5%
Percent
This is hardly the last word, of course. The considerable deviations from the tax/income 4%
trend relationship over recent years calls into question exactly why departures that
3%
cause revenue to over- or underperform take place.
2%
With the increasing importance of the retired population, this undoubtedly reflects the
1%
significance of taxable retirement account drawdowns, which are not considered current
personal income. Also, the 2017 data on personal income are preliminary estimates, 0%
subject to future revisions that could substantially change the story told above. Earnings Dividends Transfers Personal income
2014 2015 2016
2018 Montana Economic Report 15Figure 3. Percent change in Montana earnings, 2014-16. Source: U.S. Bureau of Economic Analysis. It has been the other components of income tax collections – estimated payments,
refunds, final payments – which led to overall declining revenues in 2017. The big surprise
10% for Montana generally comes in the spring, when most taxpayers settle up on their
previous tax year liabilities. For both the U.S. as a whole, as well as in Montana, both
8%
final payments and refunds, which are negative revenue for the treasury, were bad in
6% the spring of 2017 compared to the spring of the preceding year (Figure 4).
4% Other Explanations for Revenue Stagnation
2%
Percent
While there is a consistency between income growth and income tax receipts for fiscal
0% year 2017, the far from perfect relationship between the two measures over the past 15
Wages Other labor income Earnings years leaves room for other explanations for stagnant receipts. These include:
-2%
-4% • The Trump effect. Since business owners do have discretion in deciding what year
to record their income, the expectation of lower tax rates tomorrow could make
-6%
Proprietors income
-8% Figure 4. Percent change in income tax collections, Jan.-May 2017 vs. Jan.-May 2016. Source:
Rockefeller Institute.
2014 2015 2016
Percent
two years of heady increases. This may reflect declines in energy-related royalty payments.
-15% -10% -5% 0% 5% 10%
Only the transfer payment category, which accounts for about 18 percent of personal
income, saw a surge in growth. Many pieces of the latter category are not subject to tax.
Overall, personal income growth was just 2.1 percent in 2016. Withholding
A closer look at the factors behind slow earnings growth reveals more that can explain
the trends in income tax collections. Earnings can also be broken down into three Estimated tax
components: 1) wages and salaries; 2) other labor income, consisting primarily of benefits
and pension fund contributions made by employers; and 3) business proprietor income. Final payments
Of the three the largest, wages and salaries has been performing best (Figure 3), regis-
tering 3.1 percent in the calendar year 2016. This is roughly consistent with Montana Refunds
income tax withholding, the sole bright spot in the income tax collection reports, which
grew by 2.8 percent in the same year. The most volatile component of earnings has been
business proprietor income, which turned from strong growth in 2015 to a decline of Total personal income tax
5.6 percent in 2016.
Montana U.S.
16 2018 Montana Economic Reportwealthier individuals reduce their tax liabilities today. Past tax law changes at the
federal level, such as changes in the tax treatment of capital gains, have produced The Future of Higher Education in
dramatic changes around the tax change dates. The implication is that the recent
weakness will be offset by unexpectedly higher revenues next year. Montana
• Shifts in retirement disbursements. Not much is understood about the timing and By Robert Nystuen
behavior of disbursements from retirement accounts, which can cause changes in Montana University System, Office of the Commissioner of Higher Education
tax collections independent of other economic activity. Since there is withholding
on many disbursements, this explanation is not entirely consistent with the observed Much has been written lately about the merits of higher education. Is a college degree
behavior of tax receipts. really worth the investment of dollars and time? More specifically, do Montana’s colleges
and universities offer a compelling value proposition to sufficiently add to a person’s
• The new economy. In an economy with increasing higher rates of mobility, telecom- financial future?
muting and online commerce, higher income households have more freedom to
declare income in lower or zero income taxes. The implication is that Montana should From both personal experience and data on our performance, I believe it is worth every
be considering whether its tax system can adapt to this change to prevent the erosion dollar and every hour invested in furthering your education beyond a high school degree.
of its base. But let’s take a look at the data that support that conclusion.
One last explanation is perhaps the most conventional one. That is to examine the People with more education do better. Figure 1 shows median earnings for Montanans
income tax base. over age 25 by educational attainment. Earnings rise with education. One recent estimate
found that, on average, people with college degrees earn more than $1 million more
The end of the oil boom in the Bakken affected state revenues in ways beyond the oil than those with a high school degree over the course of their careers.
and gas severance tax. The loss of high wage jobs, reduced hours, reduced royalties and
closures of business as the oil business contracted were all factors in Montana’s revenue People with more education are also less likely to be unemployed. In 2016, the
woes. The current situation for Montana’s farmers and ranchers, beset by drought, unemployment rate for Montanans with at least a bachelor’s degree was less than 2
wildfires and low prices, is another challenge that will certainly show up in the state’s percent, but it was 4.4 percent for Montanans with only a high school diploma.
bottom line.
People with more education also tend to have healthier and more educated children.
There is no escaping the fact that the revenue forecast adopted by the Legislature Women with a college education have healthier babies, as measured by birth weight
overshot the actual trajectory of revenues. There is no shame in the error either – and gestational age, and children with more educated parents tend to do better in
forecasting is a tough business and the events that produced the weaker revenue school and earn more as adults. Thus, additional years of schooling generate a wide
trajectory are still not fully understood. But the big picture descriptions of economic variety of benefits.
activity – personal income, earnings and wages – get us most of the way there.
Attending more school is expensive though. Students must pay tuition and fees, forgo
job opportunities and may need to pay for room and board – these costs add up. The
average in-state tuition and fees for a full-time enrolled student at a flagship campus
(University of Montana and Montana State University) is $7,047 per year, approximately
$5,900 at a smaller four-year regional campus and nearly $3,500 at a two-year college.
Add in the additional costs of attending college – room and board, books, etc. – and it
costs approximately $20,000 per year for Montana residents to attend UM or MSU.
2018 Montana Economic Report 17Figure 1. Median earnings for Montanans over age 25 by educational attainment. Source: American Over one’s lifetime, an individual with college credentials should expect to earn more,
Community Survey 2016 (1-year). have brighter prospects for career growth, personal advancement and family prosperity.
$60,000 Higher education also benefits our economy and society. Montanans contribute over
$52,319 $186 million to higher education via state appropriations to the Montana University
System. This amounts to roughly $7,000 per resident student. This spending helps keep
$50,000
tuition and fees for Montanans low and affordable tuition helps ensure that Montana’s
$39,650 kids have access to the ladders of opportunity provided by higher education.
$40,000
$30,816 This spending also helps to ensure that Montana’s economy remains competitive.
$26,475 College-educated workers are an essential component of a modern economy. Economists
$30,000
have found that regions with more college-educated workers have performed better
$18,782 over the past several decades. They grow faster – experiencing faster population, wage
$20,000
and housing price growth.
$10,000 Consistent with these findings, demand for college-educated workers is expected to
remain strong. The Bureau of Labor Statistics forecasts that nationally 51 percent of job
$0 growth over the next decade will require some level of postsecondary education and
Less than High school Some college Bachelor’s Graduate or 37 percent will require at least a bachelor’s degree.
high school graduate or associate’s degree professional
graduate (includes degree degree
In 2017, the Montana Department of Labor and Industry collaborated with the Office of
equivalency)
the Commissioner of Higher Education and the Montana University System to study the
labor market outcomes for Montana’s colleges (Meeting State Worker Demand, 2017).
This does not include financial aid and most students receive some amount of financial The study focused on these three questions:
aid. Once financial aid is accounted, the annual cost for attending a Montana University
System (MUS) four-year school is around $15,000 per year. This number represents 1. Do colleges produce enough graduates in the right programs to fill the types of jobs
out-of-pocket costs and does not include opportunity costs (i.e., the earnings students required by Montana employers?
forgo while they attend school), which are substantial. 2. Do graduates find jobs in Montana, thus helping meet statewide worker demand?
3. Does the geographical distribution of the graduates match the distribution of worker
The cost of attending an MUS school tends to be low relative to other states. For instance, demand in Montana?
the cost of attendance for in-state residents is $27,500 at the University of Oregon,
$26,500 at the University of Washington and $30,100 at the University of Colorado-Boulder. MUS awards over 9,000 degrees and certificates to students annually. By matching
However, some of this cost advantage disappears once Montana’s lower household education records with labor force information, we can determine that 80 percent of
incomes are taken into account. resident students find employment in Montana in the year following graduation. Thus,
their earnings and spending help support the state’s economy. Indeed, the economic
There is a distinct difference between incurring an expense versus making an investment. impact of all MUS activities – including research, visitor spending, as well as the earnings
While both will diminish your initial cash balance, the investment is intended to provide of graduates – indicate that nearly $2 billion of after-tax income received by Montanans
a long-term financial return. Obtaining a college degree or certificate is an investment. can be traced to higher education institutions.
18 2018 Montana Economic ReportUnderstanding Enrollment Trends the highest impediments to students enrolling and persisting through to college gradu-
ation, especially in non-STEM programs.
When it comes to high school students attending college, the Montana University System
has seen little growth largely due to demographics. Over the past five years, Montana In aggregate, 28 percent of Montana’s college-bound students start with a remedial
has graduated 1,000 fewer high school students per year than it did in 2008. The class, rather than a college gateway writing class or math, which is required for their
demographics suggest we will maintain this level until 2022 when we will finally see desired certificate or degree. As a result, our campuses need to dedicate considerable
more high school graduates. resources to remedial classes to prepare students for their college gateway courses.
Approximately 62 percent of high school seniors choose to attend college immediately Here’s the next dilemma: Approximately one in 10 students who place in remedial
following graduation and 49 percent of the graduates attend in-state schools. Given the algebra go on to earn a postsecondary degree or certificate. In other words, if you must
positive outcomes from obtaining more schooling, this percentage should be higher. enroll in college remedial math, you have a 10 percent chance of graduating. For too
many students a remedial class is their first and last college experience.
A number of barriers prevent students from pursuing higher education, some are infor-
mational. Many parents and students overestimate the cost of college and are unaware Solutions
of their eligibility for financial aid or do not understand how to apply. Other barriers are
personal – some students are more reluctant to incur debt, some do not feel that they How can we reverse the trajectory of remedial education requirements for our colleges
have adequate resources and others might lack confidence in their ability to succeed and universities?
in college.
1. Teamwork between the K-12 schools, the Office of Public Instruction, the Office of
College-level math and English are also barriers that pose challenges for both tradition- Commissioner of Higher Education and the Montana Board of Regents. Montana’s
al-age students (recent high school graduates) and nontraditional students (high school high schools are only required to provide two years of math to meet graduation
graduates leaving the workforce to attend college). requirements, although some high schools are requiring three years. In reality, if a
high school student takes no additional math beyond their freshman and sophomore
Could you solve this algebraic equation? Find the slope of the line 5x–5y=7. years, they will likely require college remedial math and their success in college is
at risk.
Years ago, I took high school math and struggled all four years – especially the last two.
Then I headed to North Dakota State University to pursue a Bachelor of Science degree 2. Recognize that college algebra and calculus are not for everybody. If you are in a
in agricultural economics. It required taking college algebra and calculus. College algebra STEM field, you will need that knowledge. However, if you are enrolled in the human-
was fairly easy, but calculus – over 40 years later – was difficult and I don’t know how I ities, certain health care fields or technical programs, there are different college math
passed the class.
Table 1. Remediation rates of Montana high school graduates attending MUS campuses. Source:
Admittedly, as a community banker for 42 years, I use math all day long, but not algebra
Montana University System, Office of the Commissioner of Higher Education.
or calculus. While I understand the importance of rigor and critical thinking for college
graduation, returning to high school or college math classes would require the humility
MUS institutions Percentage of high school graduates taking remedial courses.
of attending a remedial class.
Four-year flagships 18%
That’s precisely what is happening with prospective college students enrolling at Four-year regional 39%
campuses throughout the Montana University System (Table 1). College math is one of Two-year institutions 42%
2018 Montana Economic Report 19courses for proficiency in your field. Flathead Valley Community College offers a
variety of math courses, including three sections of remedial math. One is entitled, Affordable Housing in Montana
“Math for the Liberal Arts.” It covers a variety of mathematics, including linear, Are We Pricing Out Our Residents?
quadratic and exponential functions, basic trigonometry, geometry, financial mathe-
matics, probability, statistics and calculus. By Bryce Ward
Bureau of Business and Economic Research at the University of Montana
3. The Montana Math Pathways + Math Corequisite Model has been launched across
Montana University System campuses with the primary goal of teaching mathematics Housing discussions in Montana frequently start with the premise that housing is
that will be of value to students in their lives and careers. Corequisite students are unaffordable. A recent Gallup study found evidence consistent with this premise. Forty
treated as college students on day one. Students complete gateway courses and percent of Montanans were dissatisfied with the availability of good, affordable housing.
enter programs of study in their first academic year. Corequisite students learn This tied Montana with Maryland and Oregon for eighth worst in the country. But how
college-level content with additional instructional time and course hours. unaffordable is housing in Montana?
These solutions are working: Montana State University-Billings has seen great success Does Montana have a housing affordability problem?
from Montana Corequisite with higher student test scores, higher completion rates and
reduced attrition. Flathead Valley Community College in Kalispell has also embarked The brief answer is yes – sort of, but it’s complicated. People who claim that housing is
on a similar program. unaffordable may be making one of three comparisons. First, they might be comparing
across place – asking, “Is housing here more or less expensive than housing elsewhere?”
When it comes to costs discouraging prospective students from enrolling in college, Second, they may be comparing the cost of housing to income – asking, “Do people
Jane Karas, president of Flathead Valley Community College said, “If our students can spend too much of their income on housing here?” Third, they might be comparing the
plan ahead, we can find a way to help them through loans, scholarships and payment price of housing to the cost of building it – asking, “How much higher is the price of a
plans. For our two-year students, one of the biggest challenges is they attend college house relative to the cost (e.g., the labor and material costs) of replacing it?
part-time. Work and family responsibilities often compete with their focus on education.
Students who receive support to attend college full-time are more likely to be successful.” Each of these comparisons reveals something different about the health of the local
economy. Comparing prices across place helps illuminate attractiveness and identifies
The campuses of the Montana University System solidly understand that student success the set of people who might be able to save money by living in Montana. Comparing
and student attrition is at the heart of the matter. prices to income shows the extent to which housing costs are a burden. It helps to
identify when housing costs may squeeze out spending on other important items (e.g.,
I remember my mother telling me when I was an elementary school student that I’d food, health care or education). Comparing prices to income helps clarify Montana’s
better work hard and get good grades or I wouldn’t go to college and go on to find a attractiveness relative to competing regions. Comparing prices to the cost of building
good job. Fifty years later, I can assure you my investment was worth the time and highlights how well the local housing market is operating and helps to identify places
financial resources I dedicated to obtaining a college degree. I have reaped an untold that have a greater difficulty building new housing.
amount of personal and professional successes because of it, even though I can’t
remember how to solve for the slope of the 5x–5y=7 algebraic equation. Is the cost of housing in Montana high or low relative to elsewhere?
Relative to other places rent in Montana is cheap, but home prices are not (Table 1). In
markets across Montana, median gross rent tends to be 15-25 percent below the U.S.
median and 30-35 percent below the Western states median. Montana’s median home
20 2018 Montana Economic ReportTable 1. Housing costs in Montana relative to the U.S. and other Western states. Source: BBER analysis Table 2. Housing costs relative to income. Source: BBER analysis of 2016 American Community
of 2016 American Community Survey (1-year). Survey (1-year).
Median % of U.S. % of West Median % of U.S. % of West Share renters Share selected monthly ownership Median home value/median
home value gross rent >30% costs (w/ mortgage) >30% household income
Billings $220,900 108% 66% $829 85% 69% Billings 37% 31% 3.81
Bozeman $347,900 170% 103% $925 94% 77% Bozeman 45% 29% 5.68
Great Falls $169,500 83% 50% $710 72% 59% Great Falls 44% 22% 3.76
Helena $227,900 111% 68% $787 80% 66% Helena 32% 23% 3.65
Kalispell $247,800 121% 73% $831 85% 69% Kalispell 52% 31% 4.94
Missoula $270,300 132% 80% $818 83% 68% Missoula 47% 32% 5.81
Montana $217,200 106% 64% $741 76% 62% Montana 39% 30% 4.34
U.S. $205,000 - - $981 - - U.S. 46% 28% 3.56
West $337,200 - - $1,200 - - West 49% 33% 5.34
values though tend to exceed the U.S. median; however, Montana’s median home values Nationally, the median home is worth 3.56 times the median household’s income. In
fall below the Western states median, except for Bozeman. Montana though, this ratio is 4.32 and in Bozeman and Missoula it is 5.68 and 5.81,
respectively (Table 2). Bozeman and Missoula fall in the 95th percentile among all metros.
Do Montanans spend too much of their income on housing? Their ratios are higher than those found in Denver (4.85), Seattle (4.98), Portland (5.02)
and Miami (5.07).
Sort of. While no absolute standard for what constitutes too much income exists, a 30
percent threshold is common. That is, when housing consumes more than 30 percent Is the cost of housing in Montana high relative to the cost of building houses?
of income, it is unaffordable. By this metric, housing is unaffordable for a large proportion
of renters. Forty-six percent of renters nationally are rent burdened, spending more While precisely measuring construction costs across place poses challenges, various
than 30 percent of income on rent. In the West, this percentage rises to 49 percent, but attempts to quantify construction costs across the U.S. do not suggest that Montana
it is only 39 percent in Montana. While the share of rent burdened households varies has unusually high construction costs. For instance, a recent analysis by Issi Romem of
across Montana, generally the share of rent burdened households is higher than ideal, BuildZoom found that land values per home in and around Billings and Missoula were
but lower than the U.S. and the West (Table 2). high. Average land values per home exceed $300,000 in places around Condon and Red
Lodge. This is on par with the land values found in some parts of major metro areas like
For homeowners, the story is more complicated. Thirty percent of Montana homeowners New York, LA and Chicago. Land values are not only high in high amenity vacation areas,
with a mortgage spend more than 30 percent of their income on selected monthly some parts of Missoula and Billings proper have average land values per home that
ownership costs, which include mortgage payments, real estate taxes, insurance and exceed $290,000. This suggests that the value of the land sitting beneath many Montana
utilities. This is slightly higher than the U.S. share (28 percent), but below the Western homes is relatively high. It also suggests that land value and not structure value, drives
share (33 percent). Again, it varies across markets (Table 2). This metric includes people high housing prices in Montana.
who purchased homes many years ago. As such, it fails to capture the burden faced by
recent buyers or those looking to buy. The ratio of home values to household incomes
provides an alternative affordability metric.
2018 Montana Economic Report 21You can also read