Socioeconomic Integration of Venezuelan Migrants and Refugees - The Cases of Brazil, Chile, Colombia, Ecuador, and Peru
←
→
Page content transcription
If your browser does not render page correctly, please read the page content below
Socioeconomic Integration of Venezuelan
                 Migrants and Refugees
           The Cases of Brazil, Chile, Colombia, Ecuador, and Peru

Diego Chaves-González
Jordi Amaral
María Jesús Mora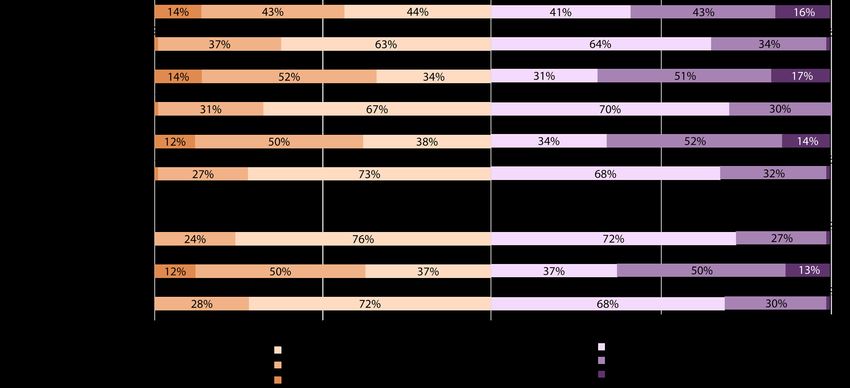
LATIN AMERICA INITIATIVE

 Socioeconomic Integration of Venezuelan
                  Migrants and Refugees

              The Cases of Brazil, Chile, Colombia, Ecuador, and Peru

                                                       Diego Chaves-González
                                                                 Jordi Amaral
                                                             María Jesús Mora

                                                                    July 2021
Contents
Executive Summary........................................................................................................................................ 1

1        Introduction............................................................................................................................................... 4

2        A Sociodemographic Profile of Venezuelan Migrants and Refugees........... 6

3        Economic Inclusion............................................................................................................................ 15

4        Education................................................................................................................................................... 22

5        Health........................................................................................................................................................... 26

6        Social Cohesion..................................................................................................................................... 30

7        Reflections and Recommendations..................................................................................... 34
         A.       Gaps in the Research.............................................................................................................................................. 35

         B.       Recommendations for Regional Governments..................................................................................... 36

Appendices......................................................................................................................................................... 39

About the Authors........................................................................................................................................ 48

Acknowledgments....................................................................................................................................... 49
SOCIOECONOMIC INTEGRATION OF VENEZUELAN MIGRANTS AND REFUGEES

Executive Summary
Venezuelan migrants and refugees have moved in large numbers across Latin America since 2015. As of
June 2021, the Regional Inter-Agency Coordination Platform for Refugees and Migrants from Venezuela
(R4V), co-led by the UN High Commissioner for Refugees (UNHCR) and the International Organization for
Migration (IOM), estimated that 5.6 million Venezuelans were living abroad, at least 4.6 million of whom
were in other Latin American and Caribbean countries. The arrival of so many migrants and refugees within
a few years has created both challenges and opportunities for countries in the region, and the COVID-19
pandemic has added another layer of complexity to the situation.

As it has become clear that many displaced Venezuelans will remain abroad for an extended period, if not
permanently, focus has begun to shift from the provision of humanitarian aid for new arrivals to include
facilitating their integration into receiving-country labor markets, healthcare and education systems,
and local communities. Such measures hold the potential to benefit both migrants and refugees and the
communities in which they live by strengthening economic development, public health, and social equity
and by reinforcing social cohesion.

To examine the socioeconomic integration of                As it has become clear that many
Venezuelan migrants and refugees in the region, this
report analyzes nonrepresentative, nonprobabilistic
                                                           displaced Venezuelans will remain
data from IOM Displacement Tracking Matrix (DTM)           abroad for an extended period, if
studies, as well as a variety of data from other surveys,  not permanently, focus has begun
reports, and additional research resources. The report     to shift from the provision of
explores five key dimensions of socioeconomic
integration (sociodemographic profile, levels of
                                                           humanitarian aid for new arrivals to
economic inclusion, education, access to health care,      include facilitating their integration.
and social cohesion) across five South American
countries that together host more than 70 percent of the total Venezuelan migrant and refugee population
worldwide. These are: Brazil, Chile, Colombia, Ecuador, and Peru.

This study also examines the progression of integration experiences over time, considering three periods:
(1) 2017 to June 2018, when Venezuelan emigration began to accelerate; (2) July 2018 to 2019, when
an increasingly coordinated and responsive regional approach to Venezuelan displacement emerged;
and (3) 2020 to 2021, marked by the COVID-19 pandemic and changing migration dynamics, including
travel restrictions. While the data presented in this report are nonrepresentative, they provide a valuable
indication of trends and insights to support effective policymaking in the region.

Over the studied periods, the Venezuelan share of the total population has increased in each of the
five studied countries. In Colombia and Peru, the countries in the region that have received the largest
aggregate number of Venezuelan migrants and refugees, Venezuelans now make up more than 3 percent
of each country’s total population. DTM data show that the profile of surveyed Venezuelan migrants and
refugees across the region is relatively young and more likely to be of working age than receiving-country
populations. While men were over-represented among Venezuelan migrants and refugees in the initial

                                               MPI and IOM | 1
SOCIOECONOMIC INTEGRATION OF VENEZUELAN MIGRANTS AND REFUGEES

study period, migration of Venezuelan women has become more prominent, and migration flows are now
more equally distributed by gender. The profile of Venezuelans on the move in the region has also changed
as more are traveling with family members and fewer heads of household are traveling alone. The greatest
change was seen in Chile, where surveys indicate that the share of Venezuelans migrating with family
increased from 27 percent in the second period to 42 percent the third period.

With the exception of Chile, these South American countries were long used to being countries of origin
and not destination; all five initially faced the influx in Venezuelan migrants and refugees with outdated or
limited migration and integration policies. For this reason, states have relied on creative and largely ad hoc
migration policies and structures to regularize and—to a lesser extent—integrate Venezuelans. Colombia,
Ecuador, and Peru have created regularization programs to register and grant Venezuelans legal status, and
the new administration in Ecuador has publicly expressed interest in a new process for regularizing the
country’s Venezuelan population. Brazil has maintained flexible and accessible regularization processes and
has by far granted asylum to the greatest number of Venezuelans of any country in the region. But despite
these efforts, and with the exception of Brazil, large shares of Venezuelans in these countries are without
a regular migration status—40 percent or more in almost all periods. And while the rate of irregularity has
been relatively consistent in Colombia, it has continued to increase throughout the studied periods in both
Ecuador and Peru.

Employment rates are an important indicator of economic integration. In all five countries, Venezuelan
migrants and refugees have experienced unemployment at higher rates than the receiving-country
population, and many have lost jobs during the COVID-19 pandemic. In Colombia and Peru, unemployment
rates had decreased between the first and second study periods but rose once again following the onset of
the pandemic and its economic fallout. By contrast, unemployment rates in Brazil and Ecuador have risen
throughout each of the three studied periods. Data on unemployment in Chile are varied and inconclusive.

While securing employment is important to families’ financial health, the type and quality of employment
is crucial, too. Informal employment is common in the region, but Venezuelan migrants and refugees
work in the informal market at even higher rates than their counterparts in receiving countries. High
levels of informality and independent work render the population more vulnerable to exploitative
working conditions and poverty. And in fact, the International Labor Organization has documented poor
working conditions among Venezuelans throughout the region, and in DTM surveys Venezuelans have
reported working longer hours and earning less income than receiving-community counterparts, with
underemployment common.

Significant shares of Venezuelan migrants and refugees earn less than the legal minimum wage. DTM
data from Colombia for the second period show 87 percent of Venezuelans were earning below the legal
monthly minimum wage. Gender gaps in both employment and income mean that Venezuelan women are
employed at lower rates and earn less than their male counterparts. As it has for many around the world, the
pandemic has taken a toll on the income of many Venezuelan migrants and refugees: in an October 2020
survey by Equilibrium CenDe, Venezuelans in Colombia, Ecuador, and Peru reported a more than 50 percent
drop in their income since March 2020.

                                               MPI and IOM | 2
SOCIOECONOMIC INTEGRATION OF VENEZUELAN MIGRANTS AND REFUGEES
In addition to a lack of regular migration status, difficulties getting academic and professional credentials
recognized have hindered many Venezuelans’ access the formal labor market. Venezuelan migrants and
refugees—and particularly those who arrived in the first period or prior and, in some countries, women—
tend to have high levels of educational attainment, and in some countries, they have higher tertiary
education rates than the receiving-country population. Yet, bureaucratic barriers and the high costs of the
recognition process can inhibit them from having their credentials validated and accessing formal work in
their fields—a situation that both limits their economic opportunities and prevents receiving communities
from fully benefitting from newcomers’ skills. Only 10 percent of Venezuelans in Chile, Colombia, and Peru
reported having had their credentials recognized as of October 2020. Thus, many migrants and refugees
who worked in the professional sector in Venezuela are now experiencing underemployment by working in
low-skilled and poorly paid jobs in their receiving countries.
Venezuelan migrants and refugees—and As more families are migrating together and
settling down in receiving countries, securing
particularly those who arrived in the first access to the education system for Venezuelan
period or prior and, in some countries, children is becoming increasingly critical. The
women—tend to have high levels of legal frameworks of these countries generally
educational attainment. guarantee the rights of all children to access an
education. Nonetheless, several barriers (such as
families’ lack of the standard documents needed for enrollment, limited familiarity with national education
systems, and classroom capacity constraints) have resulted in a significant number of out-of-school children
in the region. Chile is the country with the highest rates of school enrollment: in the second and third
study periods, between 85 percent and 93 percent of Venezuelan children and adolescents were enrolled
in school. In other countries, school enrollment rates have been much lower among Venezuelans, generally
hovering between 40 percent and 80 percent.
Access to health care, while already an important dimension of integration, has taken on new urgency
during the COVID-19 pandemic. Chile and Brazil have universal health-care systems, but barriers such as fear
of deportation and discrimination can limit accessibility in practice. Ecuador guarantees the right to free
health care, regardless of immigration status, but similar barriers limit access to services, and participation in
public, contributory social security insurance is low. In Colombia and Peru, health care is not universal. In the
latter, less than 10 percent of Venezuelans have reported accessing the subsidized public health insurance
regime throughout all three periods. Access has been limited in Colombia, too, with a 2019 DTM survey
showing that just 12 percent of Venezuelan respondents had any form of health insurance.
Social cohesion between Venezuelan migrants and refugees and longer-standing residents of receiving
communities is a key (if difficult to measure) dimension of integration. Many Venezuelans have reported
experiencing discrimination. Although rates of discrimination have remained relatively static in Brazil,
they have grown steadily over time in each of the other four study countries. Reducing discrimination is
imperative, as it can have negative effects on immigrants’ livelihoods, employment opportunities, and
access to essential services such as education and health care, as well as harming community cohesion and
at times leading to anti-immigrant violence. Although public opinion polling on views toward Venezuelan
immigration tends to be limited—with Colombia as the exception to this—the data that are available
suggest that public opinion of Venezuelan migrants and refugees has generally soured over time, with some
MPI and IOM | 3SOCIOECONOMIC INTEGRATION OF VENEZUELAN MIGRANTS AND REFUGEES
members of receiving communities expressing the desire to limit their access to essential services and/or
the view that they increase insecurity.
With more Venezuelan migrants and refugees reporting in surveys their intention to stay in their receiving
countries, it is important that governments transition from humanitarian, short-term responses to
Venezuelan displacement to longer-term integration policies. The sociodemographic and educational
characteristics of the population and information about the obstacles to economic inclusion, access to
services such as health care and education, and challenges to social cohesion presented in this report can
help inform policymaking in this regard. Among the priority areas for focus suggested by this analysis are:
redoubling efforts to ensure Venezuelan migrants and refugees can access regular immigration status,
improving credential recognition processes, addressing capacity in systems ranging from health care to
education, and supporting robust research through data collection and transparency.
1 Introduction
Large-scale emigration from the Bolivarian Republic of Venezuela has played a preeminent role in South
America’s migration landscape since 2015, creating new challenges and opportunities for receiving-country
governments and communities and for migrants and refugees alike. As of June 2021, the Regional Inter-
Agency Coordination Platform for the Response for Refugees and Migrants from Venezuela (R4V), co-led
by the UN High Commissioner for Refugees (UNHCR) and the International Organization for Migration
(IOM), estimated that 5.6 million Venezuelan migrants and refugees were living abroad, at least 4.6 million
of whom resided in countries across Latin America and the Caribbean.1 The COVID-19 pandemic has added
an additional layer of complexity to these movements by exacerbating economic drivers of migration and
political tensions, and by creating new public-health risks and policy conundrums.
One of these sets of policy conundrums
centers around the socioeconomic integration
of Venezuelan migrants and refugees. It
Ensuring that they can find their footing
has become abundantly clear that many in receiving-country labor markets,
Venezuelans will remain in other countries in health-care and education systems, and
the medium to long term, if not permanently,
local communities promises to benefit
and ensuring that they can find their footing in
receiving-country labor markets, health-care
both these migrants and refugees and
and education systems, and local communities the societies in which they live.
promises to benefit both these migrants and
refugees and the societies in which they live. This report utilizes data and resources shared by IOM with
Migration Policy Institute (MPI) researchers and additional data and analysis identified during a literature
review, including resources from a wide range of organizations showcased in MPI’s Latin America and the
Caribbean Migration Portal.2
1 Regional Inter-Agency Coordination Platform for Refugees and Migrants from Venezuela (R4V), “Refugees and Migrants from
Venezuela,” updated June 5, 2021.
2 Launched in February 2020, the Migration Policy Institute (MPI) Latin America and the Caribbean Migration Portal is the first
comprehensive, curated online resource for data, research, and analysis on immigration policy in the region. It features a selection
of literature, including reports, briefs, surveys, and government regulations, from various organizations as well as original research
and analysis from leading experts and MPI analysts. It can be found at: www.migrationportal.org.
MPI and IOM | 4SOCIOECONOMIC INTEGRATION OF VENEZUELAN MIGRANTS AND REFUGEES
A key source for this analysis is the IOM’s Displacement Tracking Matrix (DTM), which follows and monitors
displacement and mobility across the globe, recording critical information about the demographics,
characteristics, and socioeconomic status of migrant and refugee populations. As part of the regional
response to the situation of Venezuelan migrants and refugees in Latin America and the Caribbean, the
DTM is being used in conjunction with the R4V platform, which was established in 2018 to coordinate
the response to Venezuelan displacement, together serving as rich sources of information on this rapidly
changing situation.
This report explores five dimensions that are important for understanding the socioeconomic integration
of Venezuelan migrants and refugees: (1) their sociodemographic profile, (2) levels of economic inclusion,
(3) education, (4) access to health care, and (5) social cohesion (see Box 1 for details). While there are some
similarities across receiving countries in Latin America and the Caribbean, there are also notable differences.
To examine these trends, this analysis spans five South American countries—Brazil, Chile, Colombia,
Ecuador, and Peru—that together host more than 70 percent of the total Venezuelan migrant and refugee
population worldwide.3 Although the aggregated data discussed in this report are nonrepresentative, with
varying methodological approaches, they provide valuable insights and an indication of trends, which are
key for effective policymaking in the region. A more in-depth explanation of the methodology used in this
report can be found in Appendix A.
BOX 1
Dimensions and Indicators of Venezuelans’ Socioeconomic Integration
Within the five key dimensions of socioeconomic integration, this report considers the following:
► Sociodemographic profile: Venezuelan share of the total population, gender and age distribution,
migration status and regularization pathways, share who migrated with family, share who intend to
transit to a different country, and housing
► Economic inclusion: unemployment rate, types of employment, participation in the informal
economy, credential recognition, sectors of employment, income, and remittances
► Education: educational attainment and school enrollment
► Health care: access to health insurance and health coverage, types of health insurance, women’s
health care, and access to COVID-19 vaccines
► Social cohesion: share reporting experiencing discrimination, public opinion of Venezuelans and their
access to services, and perceived criminality
Through a disaggregation of data, this report assesses the five dimensions over three periods in each
country: (1) 2017 to June 2018, characterized by the beginning of accelerated emigration from Venezuela;
(2) July 2018 to 2019, characterized by an increasingly coordinated and attentive regional response to
high levels of Venezuelan displacement, shortly after the launch of the R4V platform; and (3) 2020 to 2021,
characterized by the outbreak of the COVID-19 pandemic and new migration dynamics, including travel
restrictions.
3 Authors’ calculation using data from R4V, “Response for Venezuelans: RMRP 2021 Dashboard,” accessed May 31, 2021.
MPI and IOM | 5SOCIOECONOMIC INTEGRATION OF VENEZUELAN MIGRANTS AND REFUGEES
The data in this report are often presented in ranges, including an upper and a lower bound, so as to present
the full array of data for each indicator. Given the diversity in values for data points for several indicators, as
well as varying degrees of comparability between studies, it is often more valuable and accurate to assess
ranges of data than averages.
The final section of this report reflects upon the data findings, identifying data gaps as well as opportunities
for new policies to increase the socioeconomic integration of Venezuelans across the region. Improving
the economic inclusion of migrants and refugees can create added value by assisting broader communities
in their recovery from the COVID-19 pandemic, while taking measures to ensure access to health care and
education are vital to strengthening public health, economic development, and social equity across the
region. Finally, tackling xenophobia and reinforcing social cohesion are important for ensuring newcomers’
successful integration and inclusion in receiving communities.
2 A Sociodemographic Profile of Venezuelan Migrants
and Refugees
Since 2017, Venezuelans have made up an increasing share of the total population in the five studied
countries, although the absolute number of migrants and refugees in each country has varied. Colombia
and Peru have received the largest numbers of Venezuelan migrants and refugees, with 1.7 million and 1
million respectively,4 and in 2020 these Venezuelans made up more than 3 percent of the total population
in both countries (see Figure 1). Chile and Ecuador have also had comparable experiences, both receiving
almost half a million Venezuelan migrants and refugees, who have made up more than 2 percent of the
total population in each country since 2019. Brazil, meanwhile, has received about 260,000 Venezuelans,
who as of 2020 represented 0.12 percent of the country’s total population. However, it should be noted
that the distribution of Venezuelans in Brazil is lopsided, as the greatest share live in the border state of
Roraima, Brazil’s least populous state. The University of
Campinas found that 54,902 Venezuelans were registered as
active residents of the state in 2019, representing 9 percent of Since 2017, Venezuelans have
Roraima’s total population at the time.5 It is likely that an even made up an increasing share of
greater number are actually present in the state, as 71,919
Venezuelans were registered as active residents of the state
the total population in the five
in October 2020, representing more than 11 percent of the studied countries.
state’s total population. 6
According to a June 2020 survey by Equilibrium CenDE, Venezuelans who migrate to Colombia and
Peru are more likely to be moving for employment reasons, whereas those who migrate to Chile and
Ecuador are more likely to do so as a result of violence and insecurity, despite the consistent prevalence
of economic factors in all four countries.7 This suggests that Venezuelans in Colombia and Peru may be
more economically vulnerable than those who arrive in Chile and Ecuador. Similarly, a round of DTM data
4 The population figures in this paragraph are from R4V, “Refugees and Migrants from Venezuela,” updated June 5, 2021.
5 Rosana Baeninger, Natália Belmonte Demétrio, and Jóice de Oliveira S. Domeniconi, Atlas temático (Campinas, Brazil: Núcleo de
Estudos de População “Elza Berquó,” 2020).
6 Federal Police of Brazil data provided to the authors by IOM.
7 Equilibrium CenDE, “Encuesta Regional Trimestral: Migrantes y Refugiados Venezolanos” (fact sheet, July 24, 2020), 121.
MPI and IOM | 6SOCIOECONOMIC INTEGRATION OF VENEZUELAN MIGRANTS AND REFUGEES
collected in Colombia in 2017, which surveyed Venezuelans, Colombian returnees, and mixed families,
noted that 74 percent migrated to Colombia for economic reasons.8
FIGURE 1
Venezuelan Share of Total Population, by Country, 2017–21
5%
4%
Colombia
Peru
3%
Chile
Ecuador
2%
1%
Brazil
0%
2017 2018 2019 2020 2021
See Appendix B for a full list of data sources used in this figure.
Venezuelan migrant and refugee populations are generally young and have a roughly equal distribution
by gender. Although men were slightly over-represented during the initial period of migration, gender
distributions have achieved greater parity over time, as shown in Figure 2. For example, while 60 percent
of migrants and refugees in Ecuador were male during the first period of study (2017 to mid-2018), the
male share of migrants and refugees dropped to 54 percent by the third period (2020–21). The data show
that Chile, Colombia, and Peru have followed similar patterns. In Brazil, the data are more varied, though
increased female migration and gender parity also appear to be the case there.
Venezuelan migrants and refugees are generally younger and more likely to be of working age compared to
the population of their receiving countries (see Figure 3). According to MPI’s tabulation of 2019 DTM data,
in Colombia, Peru, and Ecuador, about three out of four Venezuelan adult male migrants and refugees were
between the ages of 18 and 35. The male Venezuelan population was a bit older in Chile and Brazil, albeit
still younger than the Chilean and Brazilian populations. Venezuelan women are similarly younger than
the female population in at least four out of the five countries.9 Brazil has the lowest share of adult female
Venezuelan migrants in the young working-age range, at 64 percent, though that is still markedly higher
than the 41 percent of the Brazilian female population; in the other studied countries, the percentage of
female Venezuelan migrants and refugees in that age range is several points higher.
8 International Organization for Migration (IOM), “DTM Colombia: Resultados fase II. Implementado en zona de frontera con
Venezuela y ciudades intermediarias” (presentation, IOM, November 2017).
9 Recent data disaggregated by gender and age for Ecuadorians could not be found.
MPI and IOM | 7SOCIOECONOMIC INTEGRATION OF VENEZUELAN MIGRANTS AND REFUGEES
FIGURE 2
Gender Distribution of Venezuelan Migrant and Refugee Populations (% male), by Country, 2017–21
65%
60% 60% 60%
60% 58% 58%
57% 60%
55%
54% 54% 54%
55% 56% 52%
51% 51% 54% 51%
54% 54%
50% 52% 52%
51% 51% 51%
49% 45% 49%
48%
45%
45% Period 1: 2017 - mid-2018
Period 2: Mid-2018 - 2019
40% 41% Period 3: 2020 - 2021
35%
Period Period Period Period Period Period Period Period Period Period Period Period Period Period Period
1 2 3 1 2 3 1 2 3 1 2 3 1 2 3
Brazil Chile Colombia Ecuador Peru
See Appendix B for a full list of data sources used in this figure.
FIGURE 3
Age Distribution of Adult Venezuelan Migrant and Refugee Populations and Receiving-Country
Populations, by Country and Gender, 2017–19*
* This figure presents the most recent comparable data available for each population. Data are from 2019, except for those for the
Colombian population (2018) and the Chilean and Peruvian populations (2017). Comparable recent data disaggregated by gender and
age for Ecuadorians could not be found.
Note: The exact age bands in each of the data sources used to create this figure varied slightly. The following groups were devised
based on data available: Venezuelans in all five countries (Younger Working Age [18–35 years old], Older Working Age [36–65 years
old], Elderly [over 65 years old]); Colombians, Chileans, and Peruvians (Younger Working Age [20–34 years old], Older Working Age
[35–64 years old], Elderly [over 64 years old]); and Brazilians (Younger Working Age [20–39 years old], Older Working Age [40-64 years
old], Elderly [over 64 years old]).
See Appendix B for a full list of data sources used in this figure.
MPI and IOM | 8SOCIOECONOMIC INTEGRATION OF VENEZUELAN MIGRANTS AND REFUGEES
In all of the studied countries, the percentage of adult Venezuelans between 36 and 45 years old (a subset
of the older working-age category) hovered between 16 percent and 21 percent in 2019. Venezuelans
older than age 65 made up no more than 1 percent of the adult population across the five countries, and in
Colombia, almost 40 percent of all Venezuelans are minors.10 In comparison, the elderly make up a notable
share of the populations of these receiving countries. Thus, elderly people in receiving communities are
likely to be retiring at the same time that many young Venezuelans are entering the labor force.
The first step towards sustainable socioeconomic integration is for migrants and refugees to have a regular
immigration status. Generally, legal status opens a door to the formal labor market and to improved access
to essential services such as health care and education. High regularity rates are also beneficial for the
receiving country’s government and broader population. Generating effective public policies requires
knowledge of the target population, which in the case of Venezuelan migrants and refugees may be
achieved through state registries of those with a regular status. Additionally, regularity allows migrants and
refugees to pay taxes and contribute to the social welfare system of the country.
For these reasons, some receiving countries have found
creative ways to regularize their Venezuelan migrant and Some receiving countries have
refugee populations. Brazil has extended opportunities found creative ways to regularize
for regular status through temporary residence and
maintained flexible entry requirements. Moreover, Brazil has
their Venezuelan migrant and
extended asylum to the greatest number of Venezuelans refugee populations.
in the region, with more than 45,000 granted asylum in
the country as of May 2021, and more than 100,000 currently seeking asylum.11 By contrast, less than 1,000
Venezuelans were granted refugee status in Chile, Colombia, and Ecuador combined between 2017 and
2020, and just slightly more than 1,100 were recognized as refugees during the same period in Peru.12
As a result of robust residence and asylum opportunities, irregular status has been relatively rare among
Venezuelans in Brazil, with just 7 percent irregular during the first period of study (2017 to mid-2018), as
shown in Figure 4.
In 2017, Colombia created a pathway to regularization with the Permiso Especial de Permanencia (PEP), a
temporary permit that granted two years of regular status, a work permit, and access to social services.13
The exercise has been positive, and 762,857 Venezuelans were registered as of June 2020, according to a
report by the Colombian Presidency.14 Despite this achievement, however, a large and relatively consistent
10 Proyecto Migración Venezuela, “Caracterización de la niñez y adolescencia migrante en Colombia” (issue brief, Proyecto Migración
Venezuela, April 2021), 4.
11 United Nations High Commissioner for Refugees (UNHCR) and Brazilian Ministry of Justice and Public Security, “Projeto de
cooperaçao para análise das decisões de refúgio no Brasil,” accessed May 24, 2021.
12 Chilean Department of Foreign Affairs and Migration, “Estadísticas Migratorias,” accessed May 25, 2021; UNHCR, “Refugee Data
Finder—Country of Asylum: Colombia,” accessed May 25, 2021; UNHCR, “Refugee Data Finder—Country of Asylum: Ecuador,”
accessed May 25, 2021; Government of Peru, Special Commission for Refugees, “La figura de los refugiados y la situación actual:
Presentación ante la Comisión de Relaciones Exteriores Congreso de la República” (presentation, March 2021); Mirelis Morales
Tovar, “Solicitar refugio en Perú: un trámite que toma hasta 4 años,” Proyecto Migración Venezuela, accessed May 25, 2021.
13 Stephanie López Villamil and Helen Demster, “Why Colombia Granted Full Rights to Its 1.7 Million Venezuelans, and What Comes
Next,” Center for Global Development, January 26, 2021.
14 Colombian Presidency, Acoger, integrar y crecer: Las políticas de Colombia frente a la migración proveniente de Venezuela (Bogotá:
Colombian Presidency, 2020).
MPI and IOM | 9SOCIOECONOMIC INTEGRATION OF VENEZUELAN MIGRANTS AND REFUGEES
share of the Venezuelan population has remained irregular throughout the three studied periods, ranging
from 41 percent to 57 percent. As of May 2021, Colombia had started a new regularization process in which
the government aims to grant regular status to Venezuelans who entered the country before January
31, 2021.15 The status lasts up to ten years and creates a pathway to residency, importantly emphasizing
durability, long-term inclusion, and pathways to permanence. In contrast with other countries in this study,
Venezuelans are less likely to apply for asylum in Colombia.
Peru also implemented a temporary stay permit in 2017 (Permiso Temporal de Permanencia, or PTP). PTP
granted Venezuelans regular status and access to some services for a year, and created legal pathways for
permanent residence.16 While the program was effective in promoting regularization, irregularity has risen
with time, as the PTP lapsed in late 2018, more restrictive entry requirements have been put in place, and
migration has continued. Between the second and third periods of study, irregularity rates jumped from
less than 10 percent to more than 50 percent. As a result of dwindling pathways to legal status, asylum
applications have started to rise.17 While 34,300 asylum applications were filed in Peru in 2017, the next year
saw a 446-percent increase, with a total of 187,300 applications filed. Peru was unprepared to manage this
sharp increase in asylum claims and has faced severe backlogs, which has made humanitarian visas and
asylum hard to access. The rate of acceptance is notably low, as less than 1 percent of Venezuelan applicants
are granted asylum. Most claims have not been processed yet, and the asylum system has been suspended
since October 2020.18 However, a decree from that same month is meant to increase regularization by
granting irregular immigrants a Temporary Permit of Permanence Card (Carné de Permiso Temporal de
Permanencia, or CPP), which would include work authorization.19
Following regional patterns, the percentage of Venezuelans in an irregular status has increased in Ecuador
over time. Around 44 percent of Venezuelans were in the country irregularly between 2017 and mid-2018,
but by 2020, the share had reached up to 72 percent. According to the World Bank, Venezuelans who
arrive in Ecuador have had fewer financial resources in recent years. This increased economic vulnerability
could be partially contributing to the rise in irregularity levels, and it is reflected in the ways Venezuelans
are migrating to the country: while 72 percent of Venezuelans registered their arrival at an airport in
2014, 86 percent of Venezuelan migrants and refugees entered the country through the land border in
Rumichaca in 2018.20 Following Colombia’s announcement of its new regularization process in 2021, the
new Ecuadorian administration has been vocal about its desire to introduce a regularization program in
Ecuador.21 This would build upon the previous administration’s efforts in 2019 and 2020, which regularized
40,407 Venezuelans in Ecuador through the Exceptional Visa for Humanitarian Purposes (Visa de Excepción
15 Colombian Ministry of Foreign Affairs, “Decreto 216: ‘Por medio del cual se adopta el Estatuto Temporal de Protección para
Migrantes Venezolanos Bajo Régimen de Protección Temporal y se dictan otras disposiciones en materia migratoria’” (decree no.
216, March 1, 2021).
16 Peruvian Presidency, “Aprueban lineamientos para el otorgamiento del Permiso Temporal de Permanencia para las personas de
nacionalidad venezolana,” El Peruano (decree no. 002-2017-IN, January 3, 2017).
17 Andrew Seele and Jessica Bolter, An Uneven Welcome: Latin American and Caribbean Responses to Venezuelan and Nicaraguan
Migration (Washington, DC: MPI, 2020), 25.
18 UNHCR, “Refugee Data Finder,” accessed May 25, 2021; Mirelis Morales Tovar, “Solicitar refugio en Perú: un trámite que toma hasta 4
años,” Proyecto Migración Venezuela, accessed May 25, 2021.
19 Peruvian Presidency, “Decreto Supremo que aprueba medidas especiales, excepcionales y temporales para regularizar la situación
migratoria de extranjeros y extranjeras,” El Peruano (decree no. 010-2020-IN, October 22, 2020); R4V, “GTRM Peru - Situation Report
(SitRep) March 2021” (fact sheet, R4V, May 5, 2021).
20 World Bank, Resumen ejecutivo: Retos y oportunidades de la migración venezolana en Ecuador (Washington, DC: World Bank, 2020).
21 Milenio, “Presidente electo de Ecuador promete regularizar estatus a migrantes venezolanos,” Milenio, April 12, 2021.
MPI and IOM | 10SOCIOECONOMIC INTEGRATION OF VENEZUELAN MIGRANTS AND REFUGEES
por Razones Humanitarias, or VERHU).22 Although data on the irregularity of Venezuelans in Chile are scarce,
a forthcoming DTM survey with a small sample size near the northern border showed high rates of irregular
entry into the country among Venezuelans, potentially complicating their regularization.23
FIGURE 4
Share of Venezuelan Migrants and Refugees in an Irregular Migratory Status, by Country, 2017–21
100%
Period 1: 2017 - mid-2018
90% Period 2: Mid-2018 - 2019 83%
Period 3: 2020 - 2021
80%
72%
70%
60% 55% 57% 57% 65% 56%
50% 55% 44% 56%
50%
40% 44%
41% 40%
30%
20%
10% 7% 7%
0% 7%
4%
Period 1 Period 1 Period 2 Period 3 Period 1 Period 2 Period 3 Period 2 Period 3
Brazil Colombia Ecuador Peru
See Appendix B for a full list of data sources used in this figure.
The share of Venezuelan migrants and refugees who travel with family members has increased over time,
albeit more so in some countries than others. At the same time, migration by heads of households traveling
alone has become less prevalent. The biggest increase in family migration was seen in Chile: a 2018 DTM
survey found that 27 percent of Venezuelans travelled to the country with family members in the second
period, while Equilibrium CenDe found that 42 percent did so in the third period (2020–21).24 In Peru,
migration with family members has also increased over time, particularly between the first and second
periods. The share of Venezuelans travelling with family has increased marginally in Brazil across the three
periods, but it has mostly hovered around 50 percent. Migration with family members has not changed
much over time in Ecuador, where the share doing so has generally stayed between 41 percent and 47
percent, though the lower bound of the rate in the second period dropped to 33 percent. A 2018 survey
of 283 Venezuelans conducted by the Norwegian Refugee Council in the Venezuelan border state of Zulia
22 Ecuadorian Foreign Ministry, “Plan Integral para la Atención y Protección de la Población Venezolana en Movilidad Humana en
Ecuador 2020 – 2021,” accessed June 21, 2021, 24.
23 IOM Displacement Tracking Matrix (DTM), Quinta DTM: Estudio migración venezolana encuesta frontera (Santiago: IOM,
forthcoming).
24 IOM DTM, Encuesta de monitoreo de flujo de población venezolana: Chile (Santiago: IOM, 2018); Equilibrium CenDE, “Segunda
Encuesta Regional: Migrantes y Refugiados Venezolanos” (survey, Equilibrium CenDE, December 2020).
MPI and IOM | 11SOCIOECONOMIC INTEGRATION OF VENEZUELAN MIGRANTS AND REFUGEES
showed that many potential migrants and refugees already have family waiting for them in a receiving
country; just 24 percent reported intending to migrate alone.25
A greater prevalence of families, especially those with children, has increased the interest among
Venezuelan migrants and refugees in setting down roots in their receiving communities. It has also
increased the importance of assessing indicators of inclusion such as employment, income, school
enrollment, and health-care access.
FIGURE 5
Share of Venezuelan Migrants and Refugees Who Migrated with Family Members, by Country, 2017–21
65%
Period 1: 2017 - mid-2018 61%
60% Period 2: Mid-2018 - 2019 58%
Period 3: 2020 - 2021
55% 53%
50% 53%
48% 47%
47% 46%
48% 44% 48%
45% 42%
45% 40% 44%
43% 39%
40% 42% 41%
39%
35%
33%
30%
25% 27%
20%
Period 1 Period 2 Period 3 Period 2 Period 3 Period 1 Period 2 Period 3 Period 1 Period 2 Period 3
Brazil Chile Ecuador Peru
See Appendix B for a full list of data sources used in this figure.
With the passage of time, Venezuelan migrants and refugees are increasingly settling down in receiving-
country communities, as their intention to transit to another country is decreasing. In Ecuador, almost one-
third of Venezuelans showed interest in traveling to another country during the first period examined, but
this figure dropped to around 10 percent during the second period and has continued to decrease during
the pandemic (see Figure 6). The intention to stay has persisted despite the difficult economic circumstances
some Venezuelans are experiencing, and 27 percent of Venezuelans in a 2020 survey by the Grupo de
Trabajo para Refugiados y Migrantes in Ecuador reported they are waiting for the arrival of even more family
members or friends.26
In Peru, even though the intention to transit to another country decreased from the first to the second
period, it increased again during the pandemic, reaching 28 percent. Chile—and Argentina to a lesser
extent—has been the principal destination country for those transiting through Peru or intending to move
on from Peru. In Brazil, rates of intention to transit have generally remained quite low. In a 2017 study,
25 Norwegian Refugee Council, Identificación de necesidades de protección de la población venezolana, en el territorio colombiano y
otros países de acogida (N.p.: Norwegian Refugee Council, 2019).
26 R4V, Ecuador: Evaluación Conjunta de Necesidades, Julio – Agosto 2020 (N.p.: R4V, 2020).
MPI and IOM | 12SOCIOECONOMIC INTEGRATION OF VENEZUELAN MIGRANTS AND REFUGEES
29 percent reported intending to return to Venezuela, although almost half said they would return after
more than two years in Brazil.27 But over time, Brazil’s interiorization program—which relocates Venezuelan
migrants and refugees on a voluntary basis from the Brazil-Venezuela border to locations across Brazil—has
grown in popularity, due to the economic opportunities and chances for family and social reunification
found elsewhere in the country.28 As a result, interest in transiting to another country has dropped. As of
May 2021, 51,735 Venezuelan migrants and refugees had taken part in the interiorization process.29
FIGURE 6
Share of Venezuelan Migrants and Refugees Who Intend to Transit to a Different Country, by Country,
2017–21
50%
Period 1: 2017 - mid-2018
40% Period 2: Mid-2018 - 2019
Period 3: 2020 - 2021 34%
29% 28%
30%
29% 28%
20% 17%
10%
10% 8% 7% 7% 7%
5% 10%
7% 7% 7%
5% 5% 5%
0% 2%
Period 2 Period 3 Period 2 Period 3 Period 1 Period 2 Period 3 Period 1 Period 2 Period 3
Brazil Chile Ecuador Peru
See Appendix B for a full list of data sources used in this figure.
Homeownership rates are relevant to the measurement of integration and sociodemographic status. A
2019 DTM survey in Chile indicated that only 0.4 percent of Venezuelans were homeowners, while the vast
majority (95 percent) rented a home.30 Similarly, a November 2019 DTM survey in Colombia found that 86
percent of surveyed Venezuelans were renting a home.31 Venezuelans in Brazil are more likely to experience
homelessness, with a 2020 study by Caritas showing one in five Venezuelan migrants and refugees living on
the street in Porto Velho, Roraima, as were 34 percent in Boa Vista, the capital of Roraima.32 Unfortunately,
with depleting income sources and little job security during the pandemic, many Venezuelan migrants
and refugees have become more vulnerable to eviction and homelessness.33 According to a 2020 study by
27 Gustavo de Frota Simões, Perfil Sociodemográfico e Laboral da inmigração venezuelana no Brasil (Curitiba, Brazil: Editora CRV Ltda.,
2017).
28 Jordi Amaral, “The Brazilian Government’s Mixed Response to Venezuelan Migration,” Venezuelan Politics and Human Rights,
December 3, 2020.
29 R4V, “Estratégia de Interiorização,” updated April 2021.
30 IOM DTM, Monitoreo de flujo de población venezolana en el Chile DTM Ronda 3 (Santiago: IOM, 2019).
31 IOM DTM, “Un entendimiento del desplazamiento para una mejor respuesta humanitaria y responsable” (presentation, IOM,
Bogotá, June 2020).
32 Caritas, Avaliação de necesidades de migrantes e refugiados venezuelanos no Brasil (N.p.: Caritas, 2020).
33 R4V, Encuesta regional de desalojos de las personas refugiadas y migrantes de Venezuela: Análisis de los principales impactos y
necesidades (N.p.: R4V, 2021).
MPI and IOM | 13SOCIOECONOMIC INTEGRATION OF VENEZUELAN MIGRANTS AND REFUGEES
Equilibrium CenDe, 72 percent of Venezuelan migrants and refugees surveyed during the pandemic in Chile,
Colombia, Ecuador, and Peru reported being at risk of homelessness.34 And in another study, conducted in
Ecuador in October 2020, 13 percent of Venezuelans reported having to move from their home because
they were evicted.35
BOX 2
Migration Typologies from Venezuela to Colombia
Colombia and Venezuela share a 2,219-kilometer-long border with only seven formal border crossing
checkpoints, which has made Colombia a crucial transit corridor for displaced Venezuelan migrants and
refugees. However, migration between the two countries has several different typologies: (1) pendular
migration, (2) migration with intention to settle, (3) transit migration, and (4) Colombian returnees.
Due to Colombia’s half-century-long civil conflict, many Colombians migrated to Venezuela decades ago.
Now, given the political and economic crises in Venezuela, many Colombians and their descendants have
opted to return to Colombia. Additionally, in 2015, Venezuela prompted further return migration when it
closed the border with Colombia and expelled more than 22,000 Colombians who were living in Venezuela.
According to a 2017 DTM survey in Colombia, while 52 percent of migrants surveyed were Venezuelans, 19
percent were Colombian Venezuelans, and 28 percent were Colombian returnees. Through an extraordinary
procedure, the Colombian state has granted birth certificates to 528,332 Venezuelans with Colombian
parents who entered the country between January 2015 and March 2020. Similarly, the Colombian state has
granted nationality to Venezuelan children born in Colombia to Venezuelan parents if the children are at
risk of statelessness. According to official sources, as of June 2020, 45,467 minors have received Colombian
nationality.
In addition, there are an estimated 5 million pendular Venezuelan migrants. These Venezuelans do not
enter Colombia with an intention to stay; rather, they move across the border to shop, work, and study.
After the Venezuelan government closed the border, the Colombian government created a humanitarian
corridor for students in Venezuela who study in Colombia and for those who need to access health-care
services. In August 2016, Colombia launched the Tarjeta Migratoria de Tránsito Fronterizo (Border Transit
Card). A 2017 DTM survey found that 55 percent of Venezuelans interviewed at border crossing checkpoints
were planning to return to Venezuela within the day or the week. However, it also recorded notable transit
migration: 20 percent of respondents said neither Colombia nor Venezuela was their final destination.
Sources: Colombian Presidency, Acoger, integrar y crecer: Las políticas de Colombia frente a la migración proveniente de Venezuela (Bogotá:
Colombian Presidency, 2020); Ana María Tribín-Uribe et al., Migración desde Venezuela en Colombia: caracterización del fenómeno y
análisis de los efectos macroeconómicos (Bogotá: Banco de la República de Colombia, 2020); International Organization for Migration
(IOM), “DTM Colombia: Resultados fase II. Implementado en zona de frontera con Venezuela y ciudades intermediarias” (presentation,
IOM, November 2017).
34 Equilibrium CenDE, “Segunda Encuesta Regional: Migrantes y Refugiados Venezolanos.”
35 R4V, Ecuador: Evaluación Conjunta de Necesidades.
MPI and IOM | 14SOCIOECONOMIC INTEGRATION OF VENEZUELAN MIGRANTS AND REFUGEES
3 Economic Inclusion
The DTM has collected useful information on the socioeconomic inclusion of Venezuelan migrants and
refugees in the region. Unemployment rates for Venezuelans decreased in Colombia and Peru between
the first and second periods, but then rose following the onset of the pandemic. In Brazil and Ecuador,
unemployment rates for Venezuelans have generally risen over time, whereas in Chile they have varied.
In all of the studied countries, the unemployment rates of Venezuelan migrants and refugees have been
significantly higher than those of the receiving-country population and/or local community, as shown in
Figure 7. As Venezuelans spend longer periods of time in these communities, however, their opportunities
for integration and employment typically improve. This is exemplified in Colombia, where data from the
Colombian National Administrative Department of Statistics show that unemployment rates for Venezuelans
who left their home county five years ago are more similar to those of the national population than to those
of newly arrived Venezuelans.36
FIGURE 7
Unemployed Share of Venezuelan Migrant and Refugee Populations and Receiving-Country Populations, by
Country, 2017–21
80%
Period 1: 2017 - mid-2018
Period 2: Mid-2018 - 2019
70%
Period 3: 2020 - 2021 64% 65%
: Receiving-country populations
59%
60%
59% 52% 51% 52%
50%
45% 52% 45%
40% 35% 35%
31%
35% 35% 28%
30%
31%
20%
20%
21% 21% 21%
Roraima: 15% 11%
16% 17%
10% Brazil: 12% Colombia: 14% 15% 7%
11% Lima: 6%
Chile: 7% 11%
Ecuador: 5% 8% Peru: 4%
0% 4%
Period 1 Period 2 Period 3 Period 1 Period 2 Period 3 Period 1 Period 2 Period 3 Period 1 Period 2 Period 3 Period 1 Period 2 Period 3
Brazil Chile Colombia Ecuador Peru
See Appendix B for a full list of data sources used in this figure.
36 Colombian National Administrative Department of Statistics (DANE), “Gran Encuesta Integrada de Hogares, Publicación del
módulo de migración: Resultados y análisis del módulo” (survey presentation, DANE, September 2019).
MPI and IOM | 15SOCIOECONOMIC INTEGRATION OF VENEZUELAN MIGRANTS AND REFUGEES
The data show a disparity in job security between Venezuelan migrants and refugees and other members
of the communities in which they live, which is further exacerbated by gender gaps. Venezuelan men
are employed at higher rates than Venezuelan women. In fact, a January 2021 DTM survey found that 31
percent of Venezuelan women in Chile lost their jobs due to the COVID-19 pandemic, compared to 19
percent of Venezuelan men.37 And among the 17 percent of Venezuelans in Lima who reported being
unemployed during a November 2020 study by the UN Development Program, more than 70 percent were
women.38 Legal status has great bearing on one’s chances of employment, with 30 percent of Venezuelans
in Peru identifying documentation as their principal barrier to work in a 2021 report by the Danish Refugee
Council.39 Regularization is thus critical to helping bridge these employment gaps and ensure Venezuelan
migrants and refugees are able to work and integrate successfully into receiving communities.
While gaining employment is a fundamental indicator of integration, assessing the type and quality of
employment is important as well. Working independently or informally can have a considerable impact on
one’s job security during times of economic crisis or health problems, and it can lead to unstable incomes.
In addition, such working arrangements can increase vulnerability to exploitation and poor working
conditions.40 In many cases, as documented by the DTM and other sources, Venezuelans are underemployed
and work longer hours than receiving-community members, yet make less money. Cases have also been
recorded in which they are paid less than agreed upon, or not at all.41
Since 2017, the share of Venezuelan workers in Peru who work directly for an employer has fallen as
the share working independently has risen (see Figure 8). Although the split between employed versus
independent workers has varied in Brazil and Ecuador, significant shares have consistently worked
independently there as well. In Colombia, meanwhile, working Venezuelan migrants and refugees have
increasingly been employed and become less likely to work independently over the course of the three
assessed periods.
Latin America already has notably high rates of labor informality, and Venezuelan migrants and refugees
have found it even more difficult to access formal job opportunities. A sizeable majority of Venezuelan
migrants and refugees in Brazil are working informally, as illustrated by a 2020 IOM study of 958 Venezuelan
adults living in shelters in Boa Vista, of whom only one individual reported having a formal job.42 And
during government labor sweeps conducted in Roraima from 2017 to 2019, 47 percent to 65 percent of
Venezuelans inspected were found to be working informally, and among those working informally, 45
percent held jobs in construction, a sector in which Venezuelan employment is growing in the country.43
37 IOM DTM, Encuesta de población venezolana en Chile Ronda 4 (Santiago: IOM, 2021).
38 United Nations Development Program (UNDP), Conociendo a la población refugiada y migrante en Lima Metropolitana (Lima: UNDP,
2020).
39 Danish Refugee Council, Protection Monitoring Report (Jan-Feb) (Copenhagen: Danish Refugee Council, April 2021).
40 International Labor Organization (ILO), “OIT destaca la labor de trabajadores migrantes venezolanos en la primera línea frente a la
COVID-19 en América Latina,” updated May 24, 2021.
41 World Bank, Resumen ejecutivo: Retos y oportunidades.
42 IOM DTM, Brazil — Situaçāo dos refugiados e migrantes venezuelanos desabrigados em Boa Vista (Brasilia: IOM, 2020).
43 Franknauria Guilherme da Silva Lima and Geson Muniz Rabelo, “O reflexo da migração de venezuelanos no mercado de trabalho
formal e informal no estado de Roraima,” Multidisciplinary Scientific Journal Núcleo do Conhecimento, no. 37202 (2019).
MPI and IOM | 16SOCIOECONOMIC INTEGRATION OF VENEZUELAN MIGRANTS AND REFUGEES
FIGURE 8
Share of Working Venezuelan Migrants and Refugees Who Work Independently, by Country, 2017–21
100%
90% 81% 83%
78% 79%
80% 74%
70% 74% 62%
60% 53% 50% 51%
46% 62%
50% 57% 58%
53% 39%
40% 46% 49%
29%
30% 39% 39%
35%
20% Period 1: 2017 - mid-2018 29%
10% Period 2: Mid-2018 - 2019 18%
Period 3: 2020 - 2021
0%
Period Period Period Period Period Period Period Period Period Period Period Period
1 2 3 1 2 3 1 2 3 1 2 3
Brazil Colombia Ecuador Peru
See Appendix B for a full list of data sources used in this figure.
FIGURE 9
Share of Venezuelan Migrant and Refugee Populations and Receiving-Country Populations Working
Informally, by Country, 2017–21
100% 97% 93% 94% 93% 92% 94%
90% 91%
87% 88%
90%
90% 89%
80% 87% 85% 87%
72%
70% 73%
72% 73%
69%
60%
61% 60%
50% 57%
48% 47%
40% 41%
30%
Period 1: 2017 - mid-2018
20% Period 2: Mid-2018 - 2019
Period 3: 2020 - 2021
10%
: Receiving-country populations
0%
Period 1 Period 2 Period 1 Period 2 Period 3 Period 1 Period 2 Period 3 Period 1 Period 2 Period 3
Brazil Colombia Ecuador Peru
See Appendix B for a full list of data sources used in this figure.
MPI and IOM | 17You can also read