Misallocation of State Capacity? Evidence from Two Million Primary Schools - American Economic ...
←
→
Page content transcription
If your browser does not render page correctly, please read the page content below
Misallocation of State Capacity?
               Evidence from Two Million Primary Schools∗

                                         Torsten Figueiredo Walter†

       PRELIMINARY UPDATE OF JMP - PLEASE DO NOT CIRCULATE OR CITE
                                              December 30, 2019
                                                Latest version here

                                                  Abstract
      It is well known that average pupil-teacher ratios (PTRs) are higher in poorer countries. This
      paper shows that PTR variation is also higher, and this helps explain cross-country differences
      in educational outcomes. I build a new global school-level data set that comprises nearly two
      million schools and represents the public primary education sector in 91 countries. This allows
      me to document that variation in school-level PTRs is negatively correlated with per capita
      income across countries. I further show that in the developing world, (a) PTR variation is a
      local phenomenon, in the sense that even within second-tier administrative units differences
      in PTRs between schools are large, (b) PTRs are higher in rural areas, but PTR differences be-
      tween schools within both urban and rural areas are much larger than differences in average
      PTRs between urban and rural areas, (c) PTRs are higher in areas where adult literacy is low,
      and (d) PTRs are higher at schools that also lack other resources, such as classrooms. To assess
      the relevance of these facts, I build a model of education production. Simulations suggest that
      test score gains from implementing counterfactual teacher allocations would be substantial in
      many lower income countries, but only marginal in high-income countries. In contrast, ob-
      taining equivalent gains through reductions in aggregate PTRs, while holding relative PTRs
      between schools fixed, would require large teacher workforce increases.

      Keywords: Development; Education; Inequality; Misallocation; State capacity
      JEL Codes: I25, H52, O15

  ∗ I thank Nava Ashraf, Oriana Bandiera, Gharad Bryan, and Robin Burgess for extensive advice and support.     I thank
Shan Aman Rana, Juan Pablo Atal, Michel Azulai, Pierre Bachas, Clare Balboni, Andres Barrios, Simon Galle, Kelsey
Jack, Felix Koenig, Rocco Macchiavello, Niclas Moneke, Alessandro Sforza, Frederik Thenee, Sven Walter, Guo Xu,
Celine Zipfel, and seminar participants at LSE, Cornell and Oxford University for valuable comments. I thank Dylan
Knaggs and Anton Heil for excellent research assistance. I am also thankful to Diego Battiston, Svetlana Chekmasova,
Joshua Chipman, Andreas Ek, Luiza Figueiredo Walter, Amgalan Amgaa Ganbat, Hanwei Huang, Dana Kassem, Sevim
Kosem, Panos Mavrokonstantis, Chimgee Mongol, Daniel Morales, Abhiroop Mukhopadhyay, Bupe Musonda, Stefan
Nippes, Vesall Nourani, Tsogsag Nyamdavaa, Thomas O’Keeffe, Ka Phaydanglobriayao, Giulio Schinaia, Ella Spencer,
Yegor Stadny, Junichi Yamasaki, and Celine Zipfel for help with data collection. Special thanks to Benjamin Chibuye,
Miljan Sladoje and Twivwe Siwale at IGC Zambia as well as Alberto da Cruz, Novella Maugeri and Jorrit Oppewal at
IGC Mozambique for their support of my in-country work. Finally, thanks to all the helpful employees at the Ministries
of Education and Statistical Agencies in the countries that are part of this study. Financial support from ESRC and the
IGC is gratefully acknowledged. All errors remain my own. † Department of Economics, New York University (AD).
Email: t.f.walter@nyu.edu.

                                                          1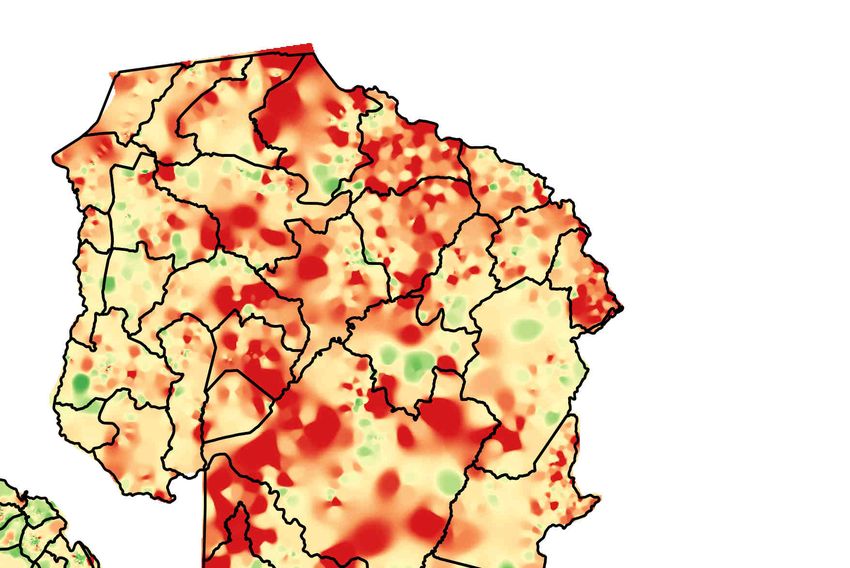
1 Introduction
The formation of human capital through education is key for development.1 For this reason, a
large share of government resources and development aid worldwide is dedicated to education.
Nonetheless, education systems in developing countries are characterized by lack of resources,
and a large literature documents how this constrains human capital formation.2
This paper considers inefficiency of resource allocation within education systems as a com-
plementary explanation of low learning levels in developing countries. In particular, it examines
how the allocation of teachers across public primary schools varies between countries and the
extent to which this explains differences in educational outcomes. Due to its universality, public
primary education provides an ideal setting to study factor allocation within education systems
across countries. After all, in nearly every country, primary education is free and compulsory,
and public institutions account for the large majority of enrollment.3 The focus on teachers is
founded on their key role for primary education, as highlighted by a long literature emphasizing
their importance for pupil achievement, both at school and later in life.4
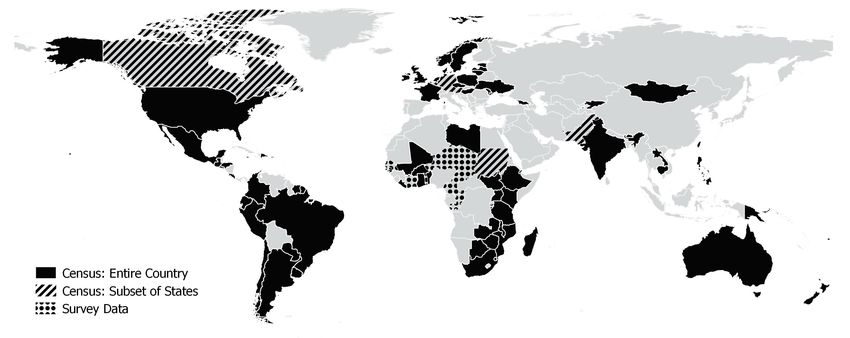
I build a new global school-level data set comprising 1.85 million schools, representing the
public primary sector in 91 countries that cover all continents and income levels. I construct this
data set from administrative government data on the universe of public primary schools in 77
countries and subsamples in 14 countries. Total enrollment at the contained schools amounts to
314 million pupils, corresponding to one fourth of the global population aged between 5 and 14,
who are taught by 13 million teachers.
This data set enables me to uncover large inequalities in access to teachers, as measured by
school-level pupil-teacher ratios (PTRs), both across and within countries. In line with existing
evidence, I document that aggregate PTRs are higher in poorer countries. Additionally, I reveal
that variation in PTRs is negatively correlated with per capita income across countries. For ex-
ample, in the US, 90% of public primary schools have PTRs between 10 and 25. In Ethiopia, 10%
of public primary schools also have PTRs in this range, but at the same time 10% of schools have
PTRs above 84.5
1 See the seminal contributions by Becker (1964), Schultz (1960), and Sen (2000) on the importance of human capital
formation through education for development.
2 See Glewwe and Muralidharan (2016) for a recent summary of the literature.
3 See figures A.1 and A.2 for the number of years of free and compulsory primary education by country. See figure
A.3 for the share of public enrollment in primary education across countries by per capita income.
4 See for example Araujo et al. (2016), Bau & Das (2017), and Chetty et al. (2014b). The importance of teachers is also
reflected by the large share of government education expenditure that teacher compensation accounts for. In a typical
country almost two thirds of government education expenditure on public primary schools go to teacher compensation.
See figure A.5 for details. Moreover, teachers may be the only common input across all income levels - from a rural
school under a tree in Mozambique to a modern school in Finland.
5 Work by international organizations such as the World Bank, UNESCO, and UNICEF has repeatedly drawn at-
tention to imbalances in school staffing across districts and schools within specific African countries (e.g. IIEP Pole de
Dakar 2016, Mingat et al. 2003, Mulkeen 2010, UNESCO 2006). In recent years, awareness of this issue has increased
and a few studies have examined implications and causes in selected countries (Agarwal et al. 2018 and Pelkonen &
Fagernas 2017 in India, Asim et al. 2017 in Malawi).
2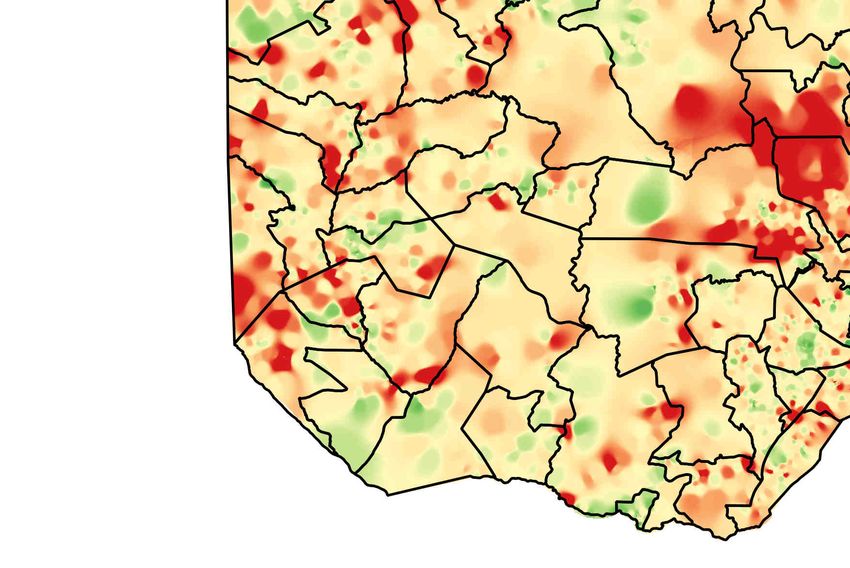
I further show that in the developing world, (a) PTR variation is a local phenomenon, in the
sense that even within second-tier administrative units (e.g. districts or municipalities) differences
in PTRs between schools are large, (b) PTRs are higher in rural areas, but PTR differences between
schools within both urban and rural areas are much larger than differences in average PTRs be-
tween urban and rural areas, (c) PTRs are higher in areas where adult literacy is low, and (d) PTRs
are higher at schools that also lack other resources, such as classrooms. The former two facts sug-
gest that in many developing countries a substantially more balanced distribution of PTRs could
be achieved by reallocating teachers locally, without transferring teachers between administrative
units or rural and urban areas. The latter two facts raise the concern that a more equal distribu-
tion of teachers could come at the expense of aggregate learning. If teachers and other inputs into
education production are complements, then transferring teachers to schools that do not only lack
teachers but also other inputs could lead to a decline in aggregate learning.
    To assess the relevance of these facts, I build a stylized model of education production and
simulate educational outcomes under counterfactual teacher distributions. In the model, a social
planner maximizes aggregate learning of public primary school pupils, as measured by the sum
of their scores at national primary school exams, by allocating the existing stock of teachers across
public primary schools. Schools produce education using two complementary inputs, teachers
and total factor productivity, where the relative importance of teachers (relative to the number of
students) is determined by a model parameter.
    While the empirical evidence on the importance of school-level PTRs for learning supports
the common intuition that a lack of teachers affects pupil achievement negatively, the magnitude
of this effect is less clear. Therefore, I conduct all simulations for a set of different values of the
aforementioned model parameter. Given the production function and a parameter value, I back
out the productivity of each school from the joint variation of exam scores and PTRs across schools,
characterizing schools as highly productive if they exhibit a high average score at national primary
school exams relative to their PTR.
    I simulate two counterfactual teacher distributions. First, I ask how large gains in aggregate
learning of public primary school pupils from implementing the optimal allocation of teachers as
determined by the model would be. Second, I ask how large gains (or losses) would be if gov-
ernments were to equalize PTRs using a simple rule-based approach. Specifically, I consider the
case where countries set a maximum school-level PTR. In each country, this maximum is chosen
such that it is the smallest maximum that can be achieved given the distribution of pupils across
schools and the total stock of teachers.
    I project that teacher reallocation would only lead to small changes in aggregate learning in de-
veloped countries. In many developing countries, however, gains from implementing the optimal
allocation given by the model would be significant. Moreover, even simple rule-based teacher
reallocation aiming to equalize PTRs across schools would be effective at improving aggregate
learning in most of these contexts. For comparison, I show that teacher workforce increases re-
quired to obtain equivalent achievement gains through reductions in aggregate PTRs, holding the

                                                  3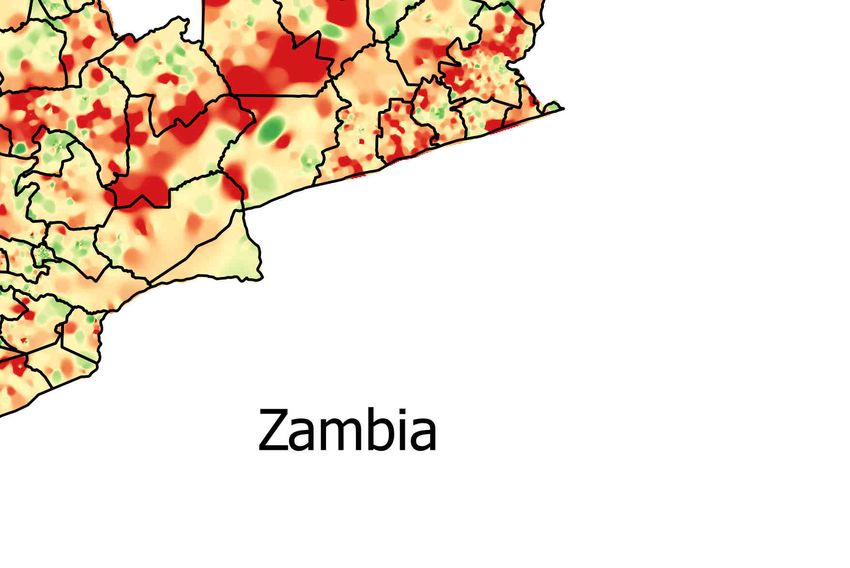
relative distribution of teachers between schools fixed, would be substantial.
    These findings suggest that teacher misallocation by the state is an important obstacle to ed-
ucation in low- and lower-middle-income countries. With 61% of children between the ages of 5
and 14 worldwide living in these countries, the implications for development are far-reaching.6
Additionally, these results raise the question how important factor misallocation in the public sec-
tor is more generally. After all, the state also plays a central role in other important domains, such
as health or law enforcement.
    This paper makes three contributions. First, by explaining cross-country differences in ed-
ucational performance as the result of differential input allocation within education systems, it
contributes to the education literature, complementing a plethora of micro-economic studies on
the causal effects of specific inputs to education on pupil achievement. Second, it contributes to a
growing literature on the importance of factor misallocation for aggregate productivity and devel-
opment. While the existing literature focuses on misallocation in the private sector where factors
are allocated across individual decision makers through markets, this paper documents the im-
portance of misallocation in the public sector where factors are allocated by the state.7 Third,
it contributes to the literature on state capacity, demonstrating how comparable administrative
government data can be harnessed to study state capacity across a large set countries.
    The remainder of this paper is organized as follows. Section 2 describes the data collection
process and the resulting data set. Section 3 documents the global inequality in access to public
primary school teachers. Section 4 builds a model of education production and Section 5 presents
the simulations of counterfactual teacher distributions. Section 6 concludes.

2     Data

2.1   Data collection

Data collection was carried out in three steps as detailed below.
    First, I visited the website of the Ministry of Education of every country in the world to look
for school census data. In most countries, the Ministry of Education collects this data at least
once a year from head teachers and records it in their Education Management Information System
(EMIS). It contains basic information on the universe of schools, including enrollment and the
number of teachers. If a Ministry of Education did not have a website or I could not find school
census data on their website, I visited the website of the Central Statistical Agency. In countries
with a decentralized administration of the education system (e.g. Canada), I also visited websites
of subnational education authorities. Whenever school census data was publicly available online,
    6 Figure based on 2015 data from the UNESCO Institute for Statistics and World Bank International Comparison

Program Database.
    7 Restuccia and Rogerson (2017) provide a recent summary of the literature examining factor misallocation across

firms since the seminal papers by Restuccia & Rogerson (2008) and Hsieh & Klenow (2009). Other work has focused on
the misallocation of people across sectors and space (Bryan et al. 2014, Gollin et al. 2014, Munshi & Rosenzweig 2016).

                                                          4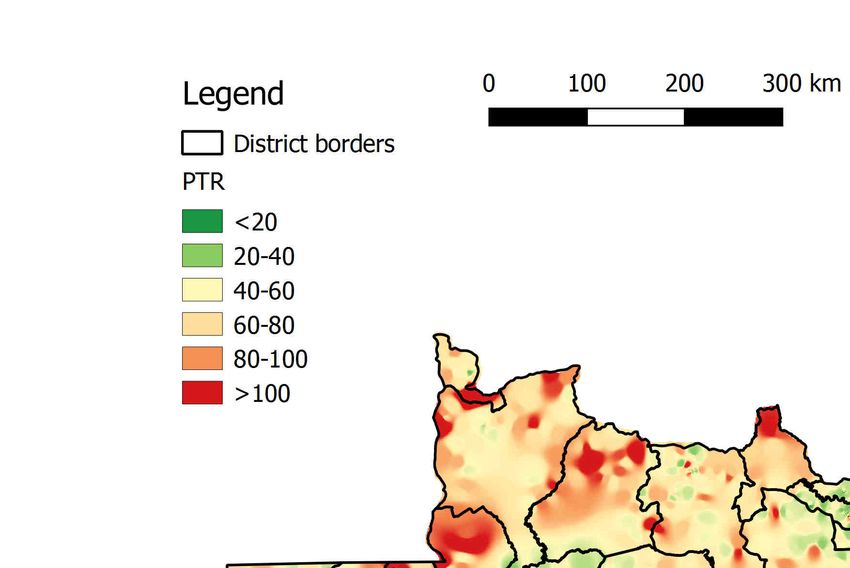
I downloaded or scraped it.
     In a second step, I sent a data request letter to the Ministry of Education and/or Central Sta-
tistical Agency of all remaining countries as long as a point of contact could be found. In some
countries with decentralized education systems, data requests were sent to state- or province-
level authorities. Overall, I sent out more than 250 data requests in five different languages and
followed up extensively on many of these, both in person and through a network of personal
contacts, to obtain the requested data.
    Third, for all countries where neither of the two previous approaches had been successful,
I checked the availability of nationally representative school survey data with information on
school-level PTRs.
    Overall, I obtained data from 91 countries in 14 different languages and many different for-
mats. At last, I synchronized language and format of the data across countries. Table A.1 gives a
detailed overview of the all the data sources and the following subsection provides a description
of the resulting data set.

2.2      Data Set

The final data set contains school-level PTR data from 91 different countries across all continents
and income levels. Countries can be subdivided into three categories. First, for 77 countries, school
census data for the national universe of public primary schools was obtained.8 Second, for six
countries, school census data was only obtained from a subset of states or provinces (covering the
universe of public primary schools within those). Third, nationally representative school survey
data from eight African countries was added to the data set from PASEC 2014.9
    The final data set contains information on 1.85 million public primary schools attended by a
total of 314 million primary school pupils. Given a total world population between the ages of 5
and 14 of 1.24 billion in 2015, this means it covers 25% of all primary school pupils worldwide.
The total number of teachers working at these schools adds up to 13 million. Figure 1 provides an
overview of the geographical coverage of the data set.
    For each country, the year of the data corresponds to the latest available year at the time of data
collection. The majority of the data is from the time period between 2013 and 2017. Only 7 out
      8 It is difficult to assess whether the school census data indeed covers all public primary schools in each of the sample

countries and states. However, data on school census return rates from public schools across 49 African countries from
the UNESCO Institute for Statistics and World Bank International Comparison Program Database suggests that even
in low-income countries data is fairly complete. Return rates are on average 97.3% and only in a handful of countries
they are below 90%. See figure A.7. For an additional check, I collect school census time series data from 23 countries.
Using data from the last three consecutive years, I check what share of public primary schools reported in year t − 2 is
missing from the data in t − 1, but reported in t. While it is possible that schools temporarily close and then re-open,
such a pattern is highly suggestive of missing schools. Figure A.8 shows that only in South Sudan and Uganda, two
countries affected by conflict in recent years, this is common.
     9 PASEC (Programme d’Analyse des Systemes Educatifs de la Conference des ministres de l’Education des Etats et

Gouvernements de la Francophonie) regularly conducts representative school surveys in French-speaking Africa. As
in the case of the Annual School Censuses, school-level information is reported by school principals.

                                                               5
of 91 country-level data sets are from before 2013, with the earliest data from Botswana in 2009.10
Table 1 specifies the year of the data for each country and provides basic summary statistics for
each country. Further details are documented in table A.1.
While the data is generally restricted to public primary schools, in five countries the data
also contains private primary schools as these cannot be differentiated from public schools in the
source data. However, in all of these countries the number of private primary schools is negligibly
small.11
The age at which children start primary education varies little across countries, and is always
between 5 and 7.12 Primary education is most commonly provided through primary schools, but
in some countries other school types also provide primary education. For example, in Mongolia
primary education is mainly provided at comprehensive schools that run from grade 1 to 12. In
order to maintain comparability across schools within each country, the data set is restricted to
the types of school that are the primary providers of primary education. Table 1 lists the included
types of schools for each country.13 The number of grades taught in these schools varies substan-
tially across countries and is also indicated in the table. It reaches from 4 to 12 grades. Primary
schools with 6 grades are the most common type.14
For each school, the data set contains three key pieces of information: number of pupils, num-
ber of teachers and school location. PTRs are computed as the ratio of pupil headcount over
teacher headcount.15 While it would be desirable to use full-time equivalents instead of head-
counts, such data is rarely available. Hence, for the sake of comparability, headcounts are used
whenever possible. However, in ten countries teacher headcounts were not available. In seven
of these, teacher full-time equivalents are used instead.16 In the remaining three countries, the
total number of school staff (teachers plus management/administration personnel) is used as the
denominator.17
I harmonize school location information across countries by defining a region as the highest
administrative division of a country (e.g. state or province) or the statistical division that is closest
to it (e.g. NUTS-2). A subregion is analogously defined as the second highest administrative
10 Figure A.9 shows the number of data sets by year.
11 The respective countries where the data also contains private primary schools are Cape Verde (0.97%), Fiji (0.86%),
Saint Vincent and the Grenadines (10.57%), Swaziland (1.55%), and Ukraine (0.58%). The percentage of enrolment in
primary education in private institutions in 2015 is given in brackets (source: World Bank International Comparison
Program Database). The information for Swaziland is from 2014 as 2015 data was not available.
12 Figure A.10 shows the distribution of primary school entrance age across all sample countries. The underlying
data is from 2015 and was extracted from the website of the UNESCO Institute for Statistics on 13/07/2017.
13 Apart from the indicated grades, schools may also include pre-primary education.
14 Figure A.11 shows the distribution of the maximum number of grades taught at included school types across
sample countries.
15 Note that school-level teacher headcounts imply that teachers are counted repeatedly if they work in several
schools simultaneously.
16 The respective countries where teacher full-time equivalents are used to compute school-level PTRs are Brazil,
Canada, Ireland, Puerto Rico, Sweden, the UK, and the US.
17 The respective countries where school staff headcounts were used instead of teacher headcounts are Belgium
(Flanders), Fiji, and France.
6division of a country (e.g. district) or the statistical division that is closest to it (e.g. NUTS-3).
For all but three countries with census data, information on the region in which each school is
located was obtained. For 56 countries, subregions are also available. Table A.2 provides further
details including the definition of a region and a subregion used throughout this paper for each
country. In addition, for 51 countries GPS coordinates of schools were gathered. These were either
downloaded or requested from the corresponding Ministry of Education. For 34 countries, GPS
coordinates were readily available, for 17 countries school addresses were transformed into GPS
coordinates using Google Maps Geocoding API. For few countries, coordinates for all schools
could be obtained, but overall the coordinate data is fairly complete. The share of schools for
which coordinates are available is on average 94%. Table A.3 provides detailed information on the
data source for each country and the completeness of the data.18
3 Stylized facts
3.1 PTR variation across countries
It is well-known that national aggregate PTRs are higher in low-income countries. Figure 2(a)
illustrates this using UN data. It shows a significant negative correlation between GDP per capita
and aggregate PTRs across countries. While aggregate PTRs in primary education are below 30
in all high-income and most upper-middle-income countries, they are above 40 in many low- and
lower-middle-income countries. In the poorest parts of the world, they sometimes even reach
values above 50.
I replicate this result for the public primary school sector using the data set assembled in this
paper.19 As most primary schools worldwide are public, it is not surprising that Figure 2(b) shows
a similarly negative correlation between national aggregate PTR in public primary education and
per capita income.20
3.2 PTR variation across schools within countries
In this section, I document that there is also a negative correlation between PTR variation and
per capita income. Figure 3 shows the PTR distribution across public primary schools in four
18 In a few countries, a relatively large share of schools has identical coordinates as at least one other public primary
school. Table A.3 provides details. In such cases, there may either be several schools within the same building or
coordinates do not reflect the actual location of the school, but rather the centroid of the administrative division within
which a school is located. Without additional information, it is not possible to differentiate between these two cases.
Therefore, I replicate all subsequent results using GPS coordinates excluding schools that share identical coordinates
with other schools and show that they are robust. The results from this exercise are available upon request.
19 For a given country, the national aggregate PTR is computed as the total number of pupils over the total number
of teachers in all public primary schools contained in the data. The total number of teachers is computed as the sum of
teacher headcounts over all schools. To the extent that teachers work in several schools simultaneously and are counted
repeatedly, computed national aggregate PTRs will underestimate actual national aggregate PTRs.
20 Figure ?? plots the share of primary school pupils enrolled in public institutions across countries by per capita
income.
7different countries - a low-income country (Mozambique), a lower-middle-income country (India),
an upper-middle income country (Peru) and a high-income country (US).21 A comparison of these
four distributions yields three observations. First, in line with the results presented in the previous
section, the average PTR in the low-income country Mozambique is substantially higher than in
the other countries. While the mean PTR is 59.8 in Mozambique, it is only 24.9 in India, 14.2 in Peru
and 16.5 in the US. Second, cross-school PTR variation is large in the lower income countries, but
small in the higher income countries. The cross-school PTR standard deviation amounts to 27.4
and 18.2, respectively, in Mozambique and India, but it measures only 6.8 and 4.1, respectively, in
Peru and the US. Third, the poorer a country, the longer is the right tail of schools with high PTRs.
These observations hold more generally. Figure 4(a) shows the cross-school PTR standard de-
viation within each country against per capita income. Evidently, cross-school PTR variation in
the public primary education sector is negatively correlated with per capita income across coun-
tries. In high- and upper-middle income countries the standard deviation ranges between 1 and
10. In the majority of low- and lower-middle-income countries, it is larger than 15.
Figure 4(b) confirms that there is a long right tail of schools with high PTRs in lower income
countries which does not exist in higher income countries. The length of the tail of the distribu-
tion is measured by the difference between the 90th and the 50th percentile of the cross-school
PTR distribution. The long right tail in many developing countries implies that a lot of children
attend schools with few teachers - even in countries where aggregate PTRs in the public primary
education sector are not extremely high. In India, for example, 35% of public primary education
pupils attend schools with a PTR above 40 despite a national PTR of 26. Across all sample coun-
tries with census data, 9% of children are enrolled in schools with PTRs above 80 while this could
be entirely avoided in all countries but Mali if teachers were more evenly distributed across public
primary schools within countries.
It is important to note that the negative association between PTR dispersion and per capita
income is not simply a consequence of high aggregate PTRs in low-income countries. While it can
be shown through simulations that the indivisibility of teachers causes PTR variation to increase in
aggregate PTR even if the objective is to equalize PTRs across schools, this effect is quantitatively
small relative to the PTR variation observed in low- and middle-income countries (see appendix
section A.1 for details). Hence, the overall lack of teachers per se does not inhibit a much more
equal distribution of teachers across schools in developing countries.
3.3 The spatial distribution of PTRs within countries
This section examines the spatial disparities in PTRs within countries. First, I show that PTR vari-
ation is a local phenomenon in many developing countries, in the sense that even across schools
within the same subregion PTRs differ substantially. Second, I document that PTRs are higher in
rural areas of developing countries, but PTR differences between schools within both urban and
21 The data for each country are trimmed at bottom and the top. The 1st and the 99th percentile of the PTR distribu-
tion are excluded.
8rural areas are much larger than differences in average PTRs between urban and rural areas.
Figure 5 shows the spatial variation of PTRs across public primary schools in Zambia. The
map indicates areas around schools with high PTRs in increasingly dark shades of red and ar-
eas around schools with low PTRs in increasingly dark shades of green. It stands out that the
heat map is relatively spotty, i.e. there is a lot of variation even within districts. A similar pat-
tern can be observed in other developing countries.22 A PTR variance decomposition shows that
both between- and within-region and -subregion variations are larger in lower income countries.
But while within- and between-variation are of similar magnitude in higher income countries, in
lower income countries the within-variation is substantially larger than the between-variation. As
shown in Figures 6(a) and 6(b), in many developing countries the within-region and the within-
subregion standard deviation in PTRs exceeds 10 while the corresponding between-variation is
considerably smaller.
To assess differences in PTRs between urban and rural areas, I construct three distinct measures
of school remoteness for all schools for which coordinates were obtained:
1. Population density within a circle of 3km radius around the school based on Global Human
Settlement (GHS) data23
2. Nighttime luminosity within a circle of 3km radius around the school based on 2015 data
from the Earth Observation Group, NOAA National Geophysical Data Center24
3. Travel time to closest city based on the accessibility to cities dataset from the Malaria Atlas
Project at Oxford University (Weiss et al. 2018)
Then I run a separate regression of the following form for each country with available school
coordinates:
PTRs = α + βremotes + es
where remotes stands for the remoteness of school s as measured by one of the three measures
listed above.
Figure 7 plots the estimated regression coefficients and the adjusted R2 for each country against
per capita income. I find that remoteness is weakly positively correlated with PTRs in most low-
and lower-middle-income countries, but it can only explain a very small share of the overall vari-
ation in PTRs as indicated by the low R2 in these countries. So, while PTRs are higher in rural
areas of developing countries, PTR differences between schools within both urban and rural areas
are much larger than differences in average PTRs between urban and rural areas.25
22 PTR heat maps from other countries where school coordinates were obtained are available upon request.
23 Subsequent results are robust to setting the radius of the circle around the school to 1km or 5km instead.
24 Subsequent results are robust to setting the radius of the circle around the school to 1km or 5km instead.
25 A corresponding analysis using rural/urban indicators as provided in the school census data in a subset of 30
countries also leads to the same conclusion. See figure A.18. Since the underlying rural/urban indicators are not
comparable across countries, results should be interpreted with care.
9One implication of the facts documented in this section is that in many developing countries
a substantially more balanced distribution of PTRs could be achieved by reallocating teachers
locally, without transferring teachers between administrative units or rural and urban areas.
3.4 PTRs and other inputs to education
In this section, I assess the correlation between PTRs and other inputs to education in developing
countries. I show that schools with less teachers also tend to have less classrooms and toilets
(relative to pupils). Moreover, the parents of pupils at these schools tend to be less educated.
To examine the correlation between the supply of teachers and other school inputs, I exploit
information on classrooms and toilets provided in various school surveys and annual school cen-
suses as shown in Table A.4. Then I run a separate regression of the following form for each
country and input factor:
PTRs = α + βPIRs + es
where PIRs stands for the pupil-input ratio at school s.
Figure 8 shows the resulting regression coefficients across countries. In all examined countries,
PTRs are positively correlated with pupil-classroom and pupil-toilet ratios, although to different
extents. Thus, schools with less teachers tend to be less well- equipped more generally.
To understand the relationship between school-level PTRs and parental education, I carry out
two complementary analyses. First, I correlate PTRs with the literacy of pupils’ mothers as given
in various school surveys, as given in Table A.6. Second, I spatially match schools to DHS (latest
survey)26 and Afrobarometer (Round 6) clusters and correlate average PTRs with adult literacy
rates at the cluster level. In all countries where school coordinates as well as DHS and/or Afro-
barometer data are available, I assign all schools within a 10km radius to a given cluster.
The results displayed in Figures 9 and 10 show that in most developing countries, pupils’
mothers’ literacy and local adult literacy are negatively correlated with school-level PTRs. In other
words, the unequal distribution of teachers across schools tends to aggravate existing educational
inequalities even further.
The findings from this section also raise the question to what extent a more equal distribution
of teachers could come at the expense of aggregate learning. If teachers, classrooms and other
school infrastructure as well as parental education are complementary inputs into the production
of education, then transferring teachers to schools that do not only lack teachers but also these
other inputs could lead to a decline in aggregate learning.
26 Table A.5 provides an overview of the utilized DHS waves.
104 Model
The previous section has highlighted that teachers are distributed very unequally across public
primary schools in many developing countries. However, local teacher reallocation could go a
long way towards a more balanced distribution since a large share of cross-school PTR variation is
within second-tier administrative units. The fact that the availability of other inputs to education,
such as classroom and parental education, is positively correlated with the presence of teachers,
though, raises the question whether teacher reallocation could lead to losses in aggregate learning.
In this section, I build a simple model of education production to formalize this concern. In the
following section, I then use this model to simulate the effects of alternative teacher allocations on
pupil achievement.
The setup is as follows. A social planner allocates homogeneous teachers across public primary
schools subject to a budget constraint. The objective of the social planner is to maximize total
learning, as measured the sum of pupil test scores in the country:
Ps
max ∑∑ Hs ( Ts , .)
Ts s j Pj
s.t. Hs = As ( Ps /Ts ) β
−1 < β < 0
∑ w(1 + τs )Ts ≤ B
s
where Ps indicates the number of pupils in school s and Ts the number of teachers. Hs is the
average test score which is weighted by the enrollment at the school Ps relative to the enrollment
in the entire public primary school sector ∑ j Pj . The education production function features two
complementary inputs: teachers Ts (relative to the number of pupils) and a school-specific pro-
ductivity term As which does not only capture productivity in the conventional sense, but also
absorbs school-specific demand factors, such as household preferences, returns to education and
opportunity costs. The parameter restriction on β ensures diminishing marginal returns to teach-
ers. The cost of having a teacher at school s is set to w(1 + τs ) and the budget constraint says that
the total cost for teachers cannot exceed the budget B. τs captures differences in teacher allocation
costs across schools.
The model makes several stark assumptions. First, teachers are assumed to be homogeneous.
Treating teachers as perfect substitutes to each other is supported by the fact that there is typically
very limited subject specialization among primary school teachers. Teachers frequently teach all
subjects to a given class. However, quality differences between teachers certainly exist. Empiri-
cally these are difficult to measure, though. Usually, they are quantified using teacher value-added
models (Chetty et al. 2014a, Rothstein 2016), but these require detailed panel data on pupils and
teachers which is not available in many of the countries I study. Hence, I restrain from incorporat-
ing teacher quality differences in my analysis.
11Second, the model does not consider out-of-school children. This is motivated by the fact that
even in low-income countries “most children today enroll in primary school” (World Bank 2018).
Using data from Afrobarometer 2016 on school enrollment across 36 African countries, I confirm
that among the youngest cohort participating in the survey (born in 1997) less than 5% never
enrolled in school. Moreover, the share of adults that has never enrolled in school has declined
steadily since 1950 (see figure A.6 for details). Therefore, today the share of children that never
enroll is likely to be even smaller.
5 Simulations
5.1 Counterfactuals
To quantify the potential gains and losses from teacher reallocation, I simulate the effects of two
distinct counterfactuals. First, I ask how large gains from implementing the nationwide optimal
allocation of teachers as determined by the model would be. Second, I ask how large gains (or
losses) in learning of public primary school pupils would be if countries distributed teachers ac-
cording to a rule that aims to equalize PTRs across schools subject to indivisibility of teachers.
Specifically, I assume countries set a maximum PTR that cannot be exceeded at any school, where
this maximum is chosen such that it is the smallest maximum that can be achieved given the
distribution of pupils across schools and the total stock of teachers in the country.
5.2 Data
For the simulation of the above counterfactuals, I use school-level average scores at national pri-
mary school examinations from ten countries. These ten countries are selected based on data
availability and stretch across four continents, from some of the poorest to some of the richest
countries in the world. Details on the examinations are available in Table A.8.
Within each country, I normalize scores such that they range between 0 and 100 by dividing
original scores by the maximum achievable score. Figure 12 shows the distribution of normalized
scores in each of the ten countries.27
5.3 Calibration
The key parameter in the presented model is β, the effect of school-level PTR on test scores. School-
level PTRs can affect learning through various channels. Most importantly, larger school-level
PTRs are associated with larger class sizes, as shown for six developing countries with available
class size data in Figure 11. Other potential channels include the increased use of multigrade
27 In countries where the lowest possible scores is above zero, I first subtract this minimum score. In countries where
exam scores are fitted to a given distribution, I set the minimum score to three standard deviations below the mean and
the maximum score to three standard deviations above the mean.
12teaching and shortened instruction time due to multishift teaching in response to the relative lack
of teachers.
The empirical evidence on these channels points to a negative effect of lack of teachers on pupil
achievement. The seminal papers on class size effects by Krueger (1999) and Angrist and Lavy
(1999) find that class size reductions in primary school lead to small, but statistically significant
increases in test scores in the short-run. Krueger (1999) estimates gains in standardized test scores
from marginal class size reductions of the magnitude of 0.048, Angrist and Lavy (1999) find effect
sizes between 0.017 and 0.071. Since then, many studies have applied the regression discontinuity
design pioneered by Angrist and Lavy (1999) in comparable settings all over the world. Many of
these studies have also found small, but statistically significant effects28 whereas a few have failed
to identify statistically significant effects.29
All of these studies identify class size effects from small changes in class size and none of them
consider settings with class sizes above 40. However, as Bandiera et al. (2010) show in the context
of course size at university, class-size effects are likely to be non-linear and could be significantly
larger as classes become very large. Therefore, the above estimates may underestimate average
class-size effects in low-income countries. On the other hand, for class size reductions to be ef-
fective the presence of complementary inputs is important, as shown by Duflo et al. (2015). In
an experimental study in Kenya, they find that the effectiveness of class size reductions crucially
depends on teachers incentives. Given weak teacher incentives in many developing countries, the
estimates from developed countries could thus also overestimate effects in developing countries.
While the evidence on class-size effects on test scores in the short-run is not definite, the avail-
able evidence on the long-run effects finds unambiguously large positive effects from class-size
reductions in kindergarten (Chetty et al. 2011) and primary school (Fredriksson et al. 2013). For
example, Fredriksson et al. (2013) find that reducing class size in primary school by one pupil
leads to an increase in educational attainment by 0.05 years at age 27, suggesting that even small
short-run test score gains from class size reductions in primary school can have important long-
run consequences.
Empirical evidence on the second channel, multi-grade teaching, is limited but the available
research finds that it is harmful to student performance (Checchi & De Paola 2017, Gerhardts et
al. 2016, Jacob et al. 2008, Sims 2008). Checchi and De Paolo (2017), for example, estimate that
learning in a multi-grade class until the 5th year of primary school in Italy leads to a 0.5 standard
deviation decrease in numeracy test scores compared to learning in a single-grade class. The
negative effects of multi-grade are likely to be even larger in low-income countries where unlike
in developed countries, multi-grade teaching is not necessarily restricted to adjacent grades, but
can also involve mixing pupils from several non-adjacent grades.
The literature on the third channel, instruction time, finds largely positive effects on pupil
28 See Bressoux et al. (2009) for results from France, Fredriksson et al. (2013) for results from Sweden, Hojo (2013) for
results from Japan, Nandrup (2016) for results from Denmark, and Urquiola (2006) for results from Bolivia.
29 See Hoxby (2000), Levin (2001), and Angrist et al. (2017).
13performance (e.g. Lavy 2015). However, it also points out that magnitudes depend on the quality
of instruction and children’s alternative time use (e.g. Rivkin and Schiman 2015) and therefore
estimates must be expected to vary across settings.30
It is not clear how to aggregate the effects of class size, multi-grade teaching and instruction
time to arrive at an estimate of the effect of school-level PTR on test scores. However, there is one
paper that directly investigates the effect of school-level PTRs on pupil performance. Muralid-
haran & Sundararaman (2013) conduct a randomized control trial across public primary schools
in rural Andhra Pradesh, India. Treatment schools obtain an extra contract teacher, inducing an
average PTR reduction by 10.814. The authors show that a one unit reduction in PTR leads to an
increase in standardized test scores by 0.0144 standard deviations after two years, thus confirm-
ing that a lack of teachers has negative implications for pupil learning.31,32 It is also noteworthy
that Muralidharan & Sundararaman fail to find evidence of heterogeneous effects with respect to
student and household characteristics, consistent with the model assumption that PTR effects do
not depend on individual characteristics.
In summary, the available evidence is line with the common intuition that a lack of teachers
affects pupil achievement negatively. The magnitude of this effect, however, is uncertain and
likely context-dependent. Therefore, I vary the model parameter β in the following simulations
and assess the sensitivity of my results to the magnitude of β.
For all simulations, I initially assume that teacher allocation costs are equal across schools
within a country: τs = 0 for all schools s. Afterwards, I use information on teacher salary differ-
ences between schools from two countries to assess the budgetary implications of the proposed
counterfactual teacher distributions (see Section 5.5). The model underlying the following simu-
lations can be summarized as follows:
Ps
max ∑∑ Hs ( Ts )
Ts s j Pj
s.t. Hs = As ( Ps /Ts ) β
−1 < β < 0
∑ Ts = T̄
s
where T̄ stands for the total number of teachers.
Since for each school, the average test score Hs and the pupil-teacher ratio PTRs are observed,
30 Seethe literature section in Barrios & Bovini (2017) for a short summary of the literature.
31 The authors do not directly report this estimates. Instead they report the average reduction in PTR induced by the
treatment and the average effect of the treatment on test scores. Dividing the latter (0.156 after two years) by the former
(10.814 after two years), I derive the reported estimates.
32 Chin (2005) also finds positive effects from adding teachers to small schools in India on school completion rates,
but does not report the induced reductions in PTRs.
14I can recover As for all schools s from the data as:
Hs
As = β
PTRs
Intuitively, this formulation characterizes schools with high PTRs and high exam scores as
productive and schools with low PTRs and low exam scores as unproductive.
5.4 Results
5.4.1 Counterfactual 1: Nationwide optimal allocation
In this subsection, I ask how large gains from allocating teachers optimally would be.33 With
−1 < β < 0, the below first-order condition is necessary and sufficient for optimality:
1+ β 1+ β
Pk Pm
Ak = Am ∀k, m
Tk Tm
β
Since As = Hs /PTRs , these marginal products can be rewritten and computed as
1+ β
Pk
Ak = Hk PTRk
Tk
Figure 13 shows the distribution of marginal products across public primary schools in the ten
examined countries. It is evident that marginal products vary substantially in poorer countries,
but are relatively similar between schools in high-income countries.
The gains from the optimal allocation are displayed in Figure 14. Figure 14(a) shows the per-
centage gain in the average exam score that could be achieved by implementing the optimal allo-
cation. The model projects only small gains in Brazil, Sweden, the UK and the US, independent
from the value of β. In all other countries, gains are projected to exceed 3% for large β, with es-
pecially large gains in India (7.6%) and Mexico (9.7%). For smaller values of β projected gains are
correspondingly smaller.
For comparison, I ask by how much the teacher workforce would have to be increased to
achieve equivalent gains if relative PTRs between schools were fixed. Figure 14(b) shows how
large these increases would have to be in the different countries. Even for small values of β these
would amount to close to 10% and more in all developing countries but Brazil. Thus, it appears
that teacher reallocation could be a cost-effective alternative to the hiring of additional teachers in
these contexts (see Section 5.5 for a discussion of reallocation costs).
Interestingly, the projected gains come at the cost of increased PTR inequality in some coun-
tries, but not in others. As Figure 15 shows the optimal PTR distributions in Tanzania, Zambia
33 For computational reasons, I allow for divisibility of teachers.
Solving this high-dimensional optimization problem
is computationally much more demanding when adding an integer constraint for each school.
15and the Dominican Republic are less dispersed than the actual ones. In India and Mexico, on the
other hand, the optimal distributions are more dispersed. Thus, gains in aggregate learning would
come at the expense of rising inequality in these countries.
5.4.2 Counterfactual 2: Nationwide rule-based PTR equalization
In many countries, the allocation of teachers to schools is based on rules that aim to equalize
school-level PTRs or class sizes. These rules can take the form of internal guidelines of Ministries
of Education or of explicit laws. Typically they set a maximum school-level PTR that cannot be
exceeded at any school (e.g. Right to Education Act in India) or a maximum class size (e.g. Mai-
monides’ rule in Israel).34
In this subsection, I simulate the distribution of teachers under the smallest achievable maxi-
mum PTR rule in each country. First, I compute the smallest threshold x that can be satisfied given
the current stock of teachers and the distribution of pupils across schools such that the PTR does
not exceed x at any school.35 Then, I distribute teachers based on this allocation rule, as shown
in Figure 16. Finally, I project the aggregate learning gains from this counterfactual distribution
using the education production function.
I find that according to the model, the proposed rule-based reallocation would not lead to
losses in aggregate learning in most countries. As Figure 17(a) illustrates, the model projects pos-
itive gains for all countries but Brazil and Sweden where reallocation would imply small losses.
In the high-income countries of the US and the UK, gains in average exam scores are projected to
be minimal, but in the developing countries apart from Brazil they range between 0.5% and 5.1%,
depending on the country and the magnitude of β. With equivalent teacher workforce increases
between 4% and 18% (see Figure 17(b)), these effects are not negligible, thus suggesting that a
more equal distribution of teachers across schools could not only improve equality of opportunity
among children, but also contribute to aggregate learning in developing countries.
5.5 Budgetary implications
How would the simulated teacher reallocation scenarios affect budgets for teacher compensation?
Many countries pay hardship allowances to teachers working in remote areas or under otherwise
difficult conditions (Pugatch & Schroeder 2014).36 If the simulated optimal allocation or the small-
est achievable maximum PTR rule implied a large shift of teachers from schools where teachers
34 Other countries with maximum PTR or maximum class size rules are for example Belgium, Germany, Italy, the
UK and Zambia.
35 To compute the smallest achievable threshold x, I use a simple algorithm that starts by simulating the implementa-
tion of a maximum PTR of 2. First, it calculates the number of teachers required for this at each school given enrollment.
Second, it checks whether the total number of teachers required in all schools is weakly smaller than the total stock of
available teachers. If this is not the case, the algorithm continues to the next step and simulates the implementation
of a maximum PTR of 3. From then on, the algorithm continues simulating the implementation of increasingly higher
maximum PTRs until the stock of available teachers is sufficient to implement the given maximum PTR.
36 See also World Bank SABER.
16are not paid hardship allowances to schools where they are, then they would lead to significant
increases in total teacher compensation costs. To understand the budgetary implications of the
simulated counterfactuals, I collect data on hardship allowance schemes in two countries, Tanza-
nia and Zambia, and simulate the budgetary effects of the alternative allocations. Tanzania does
not have a hardship allowance scheme and therefore, the teacher compensation budget would
not be affected by the counterfactual teacher distributions there. Zambia, on the other hand, has
a hardship allowance scheme, but I compute that the budget necessary to pay all teachers after
reallocation would only be marginally larger than the current budget - by 0.7% in the case of the
optimal allocation and by 0.1% in the case of the rule-based PTR equalization.37 Hence, the simu-
lated counterfactual teacher allocations would essentially be budget-neutral in the two examined
countries.
While it is unclear what the fixed costs of teacher reallocation would be, the simulation re-
sults underline that improving the efficiency of teacher allocation may be significantly more cost-
effective than hiring additional teachers.
6 Conclusion
I study the importance of factor misallocation by the state for development. Focusing on the al-
location of teachers across public primary schools, I provide evidence that learning gains from
implementing alternative teacher allocations could be substantial in many lower income coun-
tries. I project that average national primary school exam scores could be improved by up to 10%
by reallocating the existing stock of teachers optimally across schools within these countries. Even
simple rule-based teacher reallocation aiming to equalize PTRs across schools would be effective
at improving aggregate learning in most of these contexts. At the same time, it would decrease
inequality of opportunity, thereby limiting aggregate productivity losses due to ensuing misallo-
cation of talent.
For comparison, I show that teacher workforce increases required to obtain equivalent pupil
achievement gains through reductions in aggregate PTRs, holding the relative distribution of
teachers between schools fixed, would be substantial. Permanent salary costs of reallocation due
to hardship allowance payments at unattractive schools, on the contrary, are projected to be min-
imal. Hence, improving the efficiency of teacher allocation in lower income countries appears to
be more cost-effective at improving educational outcomes than augmenting the stock of teachers.
In conclusion, this paper suggests that teacher misallocation is an important obstacle to learn-
ing in developing countries. Thereby, it complements a large set of micro-level studies on the
importance of selection, training and incentives for teachers, highlighting that inefficient teacher
37 I use government payroll data for the universe of government employees in the education sector to determine at
which schools hardship allowances are paid and how much they are. I manage to match information from the payroll
system to 92% of public primary schools with exam score data and use only this subset of schools for the simulation of
the budget effects.
17allocation is an additional barrier to educational performance.38
With 61% of children between the ages of 5 and 14 worldwide living in low- and lower-middle-
income countries, the implications for development are far-reaching. Naturally, questions about
the reasons of the suboptimal allocation of teachers in these countries arise. My own work in Zam-
bia (Figueiredo Walter 2018) along with other available evidence points to a combination of polit-
ical patronage and lack of managerial capacity, and governments of many of the concerned coun-
tries have raised these issues themselves.39 For example, a government report from Cameroon
finds that “imprecise management, in particular with regards to the allocation of teachers across
schools, results in both an efficiency and an equity problem” (Ministere de l’Economie, de la Plan-
ification, et de l’Amenagement du Territoire, Republique du Cameroun 2013). A detailed explo-
ration of the underlying causes and potential remedies is therefore an important topic for future
research.
The implications of this paper also go beyond the issue of teacher allocation. It illustrates
how administrative government data from a large set of countries can be harnessed to study the
efficiency of public resource allocation across all stages of development. In doing so, it calls for
further research on the importance of factor misallocation in the public sector. After all, the state
also plays a central role in other important domains, such as health or law enforcement, and the
revealed patterns are unlikely to be constrained to the education sector.
38 See for example Muralidharan & Sundararaman (2011) and De Ree et al. (2018) on financial incentives for teachers,
Duflo et al. (2012) and Muralidharan et al. (2017) on the monitoring of teachers, Bold et al. (2017) on teacher training,
and Rockoff et al. (2011) on teacher selection. Work by Dal Bo et al. (2013) and Ashraf et al. (2018) on the selection of
state-employees is also related.
39 See Asim et al. (2017) for evidence from Malawi, Cummings & Tahirou (2016) for evidence from Niger, Diompy
(2014) for evidence from Senegal, and Ramachandran et al. (2018) for evidence from India.
18References
Agarwal, Siddhant; Kayina, Athisii; Mukhopadhyay, Abhiroop; Reddy, Anugula N. 2018. Redis-
tributing teachers using local transfers. World Development, Elsevier 110(C), 333-344.
Angrist, Joshua D.; Lavy, Victor. 1999. Using Maimonides’ Rule to Estimate the Effect of Class Size
on Scholastic Achievement. The Quarterly Journal of Economics 114 (2), 533-575.
Angrist, Joshua D. ; Lavy, Victor; Leder-Luis, Jetson; Shany, Adi. 2017. Maimonides Rule Redux.
NBER Working Paper No. 23486.
Ashraf, Nava; Bandiera, Oriana; Lee, Scott. 2018. Losing Prosociality in the Quest for Talent?
Sorting, Selection, and Productivity in the Delivery of Public Services. Working Paper.
Araujo, M. Caridad; Carneiro, Pedro; Cruz-Aguayo, Yyannu;Schady, Norbert. 2016. Teacher
Quality and Learning Outcomes in Kindergarten. The Quarterly Journal of Economics 131 (3),
1415-1453.
Asim, Salman; Chimombo, Joseph P. G.; Chugunov, Dmitry; Gera, Ravinder Madron Casley. 2017.
Moving teachers to Malawi’s remote communities: a data-driven approach to teacher deployment
(English). Policy Research Working Paper Series 8253. Washington, DC: World Bank Group.
Bandiera, O.; Larcinese, V.; Rasul, I. 2010. Heterogeneous Class Size Effects: New Evidence from
a Panel of University Students. The Economic Journal 120, 1365-1398.
Bau, Natalie; Das, Jishnu. 2017. The misallocation of pay and productivity in the public sector:
evidence from the labor market for teachers. Policy Research working paper no. WPS 8050. Wash-
ington, D.C.: World Bank Group.
Becker, Gary S. 1964. Human Capital: A Theoretical and Empirical Analysis, with Special Ref-
erence to Education. University of Illinois at Urbana-Champaign’s Academy for Entrepreneurial
Leadership Historical Research Reference in Entrepreneurship.
Bold, Tessa; Filmer, Deon P.; Martin, Gayle; Molina, Ezequiel; Rockmore, Christophe; Stacy, Brian
William; Svensson, Jakob; Wane, Waly. 2017. What do teachers know and do? Does it matter? Ev-
idence from primary schools in Africa. Policy Research Working Paper Series 7956. Washington,
DC: World Bank Group.
Bryan, G.; Chowdhury, S.; Mobarak, A. M. 2014. Underinvestment in a Profitable Technology: The
Case of Seasonal Migration in Bangladesh. Econometrica 82, 1671-1748.
Checchi, Daniele; De Paola, Maria. 2017. The Effect of Multigrade Classes on Cognitive and Non-
Cognitive Skills: Causal Evidence Exploiting Minimum Class Size Rules in Italy. IZA DP No.
11211. Bonn: Institute of Labor Economics.
Chetty, Raj; Friedman, John N.; Hilger, Nathaniel; Saez, Emmanuel; Schanzenbach, Diane Whit-
more; Yagan, Danny. 2011. How Does Your Kindergarten Classroom Affect Your Earnings? Evi-
dence from Project Star. The Quarterly Journal of Economics 126 (4), 1593-1660.
Chetty, Raj; Friedman, John N.; Rockoff, Jonah E. 2014a. Measuring the Impacts of Teachers I:
19You can also read