Below the Radar: Data, Narratives and the Politics of Irrigation in Sub-Saharan Africa
←
→
Page content transcription
If your browser does not render page correctly, please read the page content below
www.water-alternatives.org                                                                          Volume 14 | Issue 2
Venot, J.-P.; Bowers, S.; Brockington, D.; Komakech, H.;
Ryan, C.; Veldwisch, G.-J. and Woodhouse, P. 2021. Below the radar:
Data, narratives and the politics of irrigation in Sub-Saharan Africa.
Water Alternatives 14(2): 546-572

Below the Radar: Data, Narratives and the Politics of Irrigation in
Sub-Saharan Africa
Jean-Philippe Venot †
Institut de Recherche pour le Développement and University of Montpellier, Montpellier, France; jean-
philippe.venot@ird.fr

Samuel Bowers†
School of GeoSciences, University of Edinburgh, Edinburgh, UK; sam.bowers@ed.ac.uk

Dan Brockington
Sheffield Institute for International Development, University of Sheffield, Sheffield, UK;
d.brockington@sheffield.ac.uk

Hans Komakech
Nelson Mandela African Institute of Science and Technology, Arusha, United Republic of Tanzania;
hans.komakech@nm-aist.ac.tz

Casey M. Ryan
School of GeoSciences, University of Edinburgh, Edinburgh, UK; casey.ryan@ed.ac.uk

Gert Jan Veldwisch
Wageningen University, Wageningen, Netherlands; gertjan.veldwisch@wur.nl

Philip Woodhouse
Global Development Institute, University of Manchester, Manchester, UK; phil.woodhouse@manchester.ac.uk

ABSTRACT: Emerging narratives call for recognising and engaging constructively with small-scale farmers who have
a leading role in shaping the current irrigation dynamics in sub-Saharan Africa. This paper explores whether new
irrigation data can usefully inform these narratives. It argues that, for a variety of reasons, official irrigation data in
sub-Saharan Africa fail to capture the full extent and diverse nature of irrigation and its rapid distributed growth
over the last two decades. The paper investigates recent trends in the use of remote sensing methods to generate
irrigation data; it examines the associated expectation that these techniques enable a better understanding of
current irrigation developments and small-scale farmers’ roles. It reports on a pilot study that uses radar-based
imagery and analysis to provide new insights into the extent of rice irrigated agriculture in three regions of Tanzania.
We further stress that such mapping exercises remain grounded in a binary logic that separates 'irrigation' from
other 'non-irrigated' landscape features. They can stem from, and reinforce, a conventional understanding of
irrigation that is still influenced by colonial legacies of engineering design and agricultural modernisation. As
farmers’ initiatives question this dominant view of irrigation, and in a policy context that is dominated by narratives
of water scarcity, this means that new data may improve the visibility of water use by small-scale irrigators but may

†
 Jean-Philippe Venot and Sam Bowers are joint first authors. General comments and other correspondence should be addressed
to Jean-Philippe Venot. Correspondence on remote sensing radar analysis should be addressed to Sam Bowers.

Venot et al.: The politics of irrigation data in Sub-Saharan Africa                                                  546
Water Alternatives – 2021                                                                      Volume 14 | Issue 2

also leave them more exposed to restrictions favouring more powerful water users. The paper thus calls for moving
away from a narrow debate on irrigation data and monitoring, and towards a holistic discussion of the nature of
irrigation development in sub-Saharan Africa. This discussion is necessary to support a constructive engagement
with farmer-led irrigation development; it is also challenging in that it involves facing entrenched vested interests
and requires changes in development practices.

KEYWORDS: Irrigation, small-scale farming, water resource governance, remote sensing, data politics, narratives,
sub-Saharan Africa, Tanzania

INTRODUCTION
Since 2015, the establishment of 230 indicators for monitoring progress towards the 169 targets of the
17 Sustainable Development Goals has created new expectations of development data. These increased
expectations are due, in part, to the perception that data can now be compiled and analysed relatively
quickly, cheaply, and over larger areas than before thanks to new technologies, including remote sensing
and machine learning. Underlying these expectations is also the premise that policy makers in legislative
and executive branches of government are responsive to data. In practice, however, the inclusion and
interpretation of data in policy processes are mediated by narratives that are informed by pre-existing
beliefs and thinking. Data interpretation is also influenced by working habits that may be resistant to
alternative views, to new constellations of data or even criticisms of the empirical basis of existing
datasets (Leach and Mearns, 1996; Jerven, 2015).
    In this paper, we examine the interrelated issues of irrigation data, narratives and politics in sub-
Saharan Africa. The dominant narrative emphasises the low levels of development of irrigated areas
within sub-Saharan Africa, which are typically cited as being one-tenth of those in Asia (Svendsen et al.,
2009). It also stresses the inefficient performance of existing irrigation systems, to which is attributed the
lagging agricultural productivity across the continent. This narrative underpins an agenda of large-scale
intervention in pursuit of an 'African Green Revolution' that has re-emerged following the 2008 food price
rises. Conversely, however, an expanding literature highlights major discrepancies between the data that
are commonly used to estimate irrigated areas, and observations of rapidly changing agricultural
landscapes (see, for example, Beekman et al., 2014; Woodhouse et al., 2017) that suggest a need for new
understandings of irrigation and new data, which may have significant implications for irrigation
investment strategies.
    It is also clear that narratives about sub-Saharan Africa’s agriculture, irrigation and rural economy are
highly politicised, particularly where the use of natural resources such as water is concerned. This is
illustrated in studies critiquing questionable or unjustified accusations that smallholders waste water that
is needed by more 'efficient' or 'valuable' sectors such as wildlife conservation, power generation and
large-scale commercial agriculture (Richards, 1983; Lankford et al., 2004; de Fraiture et al., 2014; Harrison
and Mdee, 2017; de Bont et al., 2016).
    The recognition that data and narratives are constitutive of each other has implications for research
practices, namely the need to bring together people from a variety of disciplinary and professional
backgrounds. With this in mind, this paper is a product of an interdisciplinary engagement among
individuals with expertise in the development of remote sensing techniques, in irrigation engineering,
and in the politics of environment and development in sub-Saharan Africa. The experience of such
interdisciplinary engagement leads us to argue that irrigation data can indeed be improved, and numbers
that we think better characterise some irrigation practices observed in sub-Saharan Africa can be
generated. We also argue, however, that a critical perspective on new data generation efforts is needed
in order to recognise the limitations of these numbers and of their efficacy in supporting alternative
narratives and influencing policy.

Venot et al.: The politics of irrigation data in Sub-Saharan Africa                                             547
Water Alternatives – 2021 Volume 14 | Issue 2
We proceed in four stages. First, we review the data that are currently widely used at global level to
assess the extent of irrigation. We stress that these data derive from a definition of irrigation – centred
on the existence of hard infrastructure – that fails to grasp the current irrigation development trends in
sub-Saharan Africa. Second, we investigate whether remote sensing techniques can improve our
collective understanding of the extent and place of irrigation in sub-Saharan Africa. To do so we review
past international attempts at using remote sensing to map irrigation in sub-Saharan Africa. We then
present the results of a pilot study analysing radar-based images for three regions of Tanzania. Third, we
argue that the invisibility of farmers’ practices is not primarily linked to issues of data, but rather to the
working cultures, narratives and politics that dominate irrigation development in sub-Saharan Africa. We
stress that, in such context, putting smallholders’ water use 'on the radar' through the use of new
measurement techniques may create new difficulties for African irrigators. We conclude with a call to
shift from a debate that centres on data and monitoring to a discussion on the nature of irrigation in sub-
Saharan Africa and collective ways to engage differently with farmers’ practices.
COUNTING AND CONCEPTUALISING IRRIGATION: PROBLEMS WITH OFFICIAL SOURCES
The Food and Agriculture Organization of the United Nations (FAO) currently compiles data about
irrigation activity worldwide and publishes it through its AQUASTAT database (FAO, 2021). These data
are used by international research and policy organisations when discussing irrigation activity (see
Alexandratos and Bruinsma, 2012; FAO, 2011, 2017; Molden, 2007; World Bank, 2008a, 2008b, 2010,
2017; Svendsen et al., 2009; Wani et al., 2009; You et al., 2011). No other source provides such
comprehensive coverage and consistent methodology. However, this does not necessarily make these
data useful in all contexts. In order to understand why this is so, we need to explore how the data are
compiled and what sorts of irrigation the database recognises.
Among other types of information, AQUASTAT contains data on "areas equipped for irrigation" and
"harvested areas of irrigated crops". When first produced, its maps of irrigated areas showed for the first
time where irrigated crops were actually grown worldwide. Up to that point, state agricultural censuses
had recorded whether or not crops grown were irrigated but could not identify the precise location of
the irrigated fields. Seminal work by Döll and Siebert (1999, 2000) enabled the first global map of irrigated
areas, with subsequent iterations up to 2013 (Siebert et al., 2013). Their methodology digitises area and
location data for known irrigation schemes, using protocols to determine the most relevant and accurate
records among thousands of documents (Siebert and Döll, 2001; Siebert et al., 2005). Accuracy of
mapping and modelling is enhanced by collecting information at the subnational (rather than national)
scale. The digitised maps are then converted into rasterised maps with cells of 5 arc minutes which record
the proportion of each cell equipped for irrigation (called 'irrigation density').
When first drawn, these maps were innovative and unprecedented in their scope. They were also
primarily and deliberately not based on remote sensing, being described as "the only global database
that is not based on remote sensing information" (Siebert et al., 2005: 535-6). This was welcome, given
the poor spatial resolution and low temporal frequency of remote sensing at the time. 1 It is nevertheless
important to recognise that AQUASTAT data depends on two sources – existing maps or records that can
be digitised, and agricultural census statistics on irrigation – and that each of these introduces two
potential inaccuracies. First, AQUASTAT data can only be as accurate as the most recent agricultural
census figures. At the time of writing (2020), the current version of AQUASTAT is intended to be accurate
for 2005, or as close to that year as possible, and most data that supported its elaboration date back to
1 Comparisons with land cover databases then available (Global Land Cover Characterization and the Global Land Cover 2000)
show, for example, that 24 African countries with irrigation reported in AQUASTAT had no irrigation reported in either land cover
database. For Tanzania, the 2005 version of AQUASTAT recognised 150,000 hectares (ha) equipped for irrigation, whereas no
irrigation was reported by the (remote sensing based) land cover data (Siebert et al., 2005: 546). Later iterations of AQUASTAT
maps do use some remote sensing based land cover analysis to identify irrigated areas in arid regions.
Venot et al.: The politics of irrigation data in Sub-Saharan Africa 548Water Alternatives – 2021 Volume 14 | Issue 2
the period 2000 to 2008 (Siebert et al., 2013: 8). The current version of the database is thus at least a
decade old. Second, although AQUASTAT irrigation and drainage categories (Table 1) are, in principle,
inclusive of a broad range of techniques of water management, in reality they exclude many important
practices used by farmers. This is because many of the ways that farmers manage water are not
recognised as 'irrigation' by governments or by the FAO itself. These areas will therefore not appear on
maps of irrigation activity.
Table 1. Categories of irrigation and drainage recognised by AQUASTAT.
Categories Definition given in the AQUASTAT database
1A. Area equipped for full control Surface irrigation systems are based on the principle of moving water over
irrigation: surface irrigation the land by simple gravity in order to moisten the soil. They can be
subdivided into furrow, borderstrip and basin irrigation (including
submersion irrigation of rice). Manual irrigation using buckets or watering
cans is also included.
1B. Area equipped for full control A sprinkler irrigation system consists of a pipe network, through which
irrigation: sprinkler irrigation water moves under pressure before being delivered to the crop via sprinkler
nozzles. The system basically simulates rainfall in that water is applied
through overhead spraying. These systems are also known as overhead
irrigation systems.
1C. Area equipped for full control Localised irrigation is a system where the water is distributed under low
irrigation: localised irrigation pressure through a piped network, in a predetermined pattern, and applied
as a small discharge to each plant or adjacent to it.
2A. Area equipped for irrigation: The land equipped for irrigation in lowland areas includes: 1) cultivated
equipped lowland areas wetlands and inland valley bottoms (IVB) that have been equipped with
water control structures for irrigation and drainage (intake, canals, etc); 2)
areas along rivers where cultivation occurs making use of structures built to
retain receding flood water; 3) developed mangroves and equipped delta
areas.
2B. Area equipped for irrigation: Spate irrigation, also sometimes referred to as floodwater harvesting, is a
spate irrigation method of informal irrigation using the floodwaters of a normally dry water
course or riverbed (wadi).
3. Water harvesting Areas where rainwater is collected and either directly applied to the
(no data included on spatial extent) cropped area, and stored in the soil profile for immediate uptake by the crop
(run-off irrigation), or stored in a water reservoir for future productive use
(for example used for supplementary irrigation).
4A. Flood recession cropping area Areas along rivers where cultivation occurs in the areas exposed as floods
non-equipped recede (fadamas in north-east Nigeria). If the areas are equipped, they are
included under irrigated areas, if unequipped they are not. The special case
of floating rice is included in this category.
4B. Cultivated wetlands and inland Wetlands and IVBs that have not been equipped with water control
valley bottoms non-equipped structures but are used for cropping when covered with water. They are
often found in Africa and have limited (mostly traditional) arrangements to
regulate water and control drainage.
Source: FAO (2005, 2021) and www.fao.org/aquastat/en/databases/glossary/
The AQUASTAT database records four main categories of irrigation and drainage areas. These are largely
defined on the basis of technologies: 1) areas equipped for full control irrigation, 2) areas equipped for
partial control irrigation, 3) water harvesting areas, and 4) non-equipped cultivation in flood recession
areas, wetlands, and inland valley bottoms (Table 1). Farmer-led irrigation development commonly
Venot et al.: The politics of irrigation data in Sub-Saharan Africa 549Water Alternatives – 2021 Volume 14 | Issue 2
intersects with the last two categories identified in the AQUASTAT database, but it can also be found in
the vicinity of 'equipped areas' in the form of unplanned use of existing infrastructures (de Fraiture et al.,
2014; Woodhouse et al., 2017; Veldwisch et al., 2019).
These different categories are then aggregated into three different classes whereby the broad notion
of 'agricultural water management' is introduced to encompass irrigation categories (1A, 1B, 1C, 2A and
2B) and 'something else' (categories 4A and 4B) (Table 2). Those aggregations introduce the first
omission, for they deliberately exclude all forms of water harvesting (category 3 in Table 1 is NOT included
in category 3 of table 2).
Table 2. Aggregate classes of 'irrigation(s)' and 'agricultural water management' in AQUASTAT.
I. Area equipped for full control The sum of surface irrigation, sprinkler irrigation and localised
irrigation: total (1A+1B+1C) irrigation
II. Area equipped for irrigation: Area equipped to provide water (via irrigation) to crops; this
total (1A+1B+1C+2A+2B) includes areas equipped for full/partial control irrigation, equipped
lowland areas, and areas equipped for spate irrigation
III. Total agricultural water Sum of total area equipped for irrigation and areas with other
managed area forms of agricultural water management (non-equipped flood
(1A+1B+1C+2A+2B+4A+4B) recession cropping area and non-equipped cultivated wetlands and
inland valley bottoms)
Source: FAO (2005, 2021).
Further exclusions derive from the way the categories of Table 1 are interpreted and operationalised by
the national agencies that provide the FAO with their data. 'Equipping' for water control (hence
infrastructures and technologies) is central to the categorisation used in Table 1. The AQUASTAT glossary
defines water-control structures as "[a]nthropogenic modifications or controls set in place in order to
control water movement" (FAO, n.d.a). This potentially inclusive definition is, in practice, often
interpreted to exclude important forms of irrigation. For example, while definition 1A in Table 1 ('area
equipped for full control irrigation') states that bucket irrigation is included, such areas are not captured
in maps and statistics. As a result, category 1A is de facto limited to irrigation schemes served by
permanent infrastructure. Similarly excluded are the individual or collective pumping systems that have
mushroomed all over the continent over the last decades (de Fraiture and Giordano, 2014). Further, it
remains unclear whether the category of 'equipped for (partial control) irrigation' (categories 2A and 2B
in Table 1) includes traditional 'hill-furrow' irrigation systems. These entail stream diversions into earthen
canals via temporary weirs constructed from stones and branches. They are widespread in East Africa
and in some cases have existed for decades (Adams and Anderson, 1988), yet they are not well
documented at the national level (as they are often not recognised as irrigation) and they are also missing
from this AQUASTAT category.
Even in the broader assessment of irrigation and drainage practices through the category of 'total
agricultural water managed area', under-reporting is evident. Although categories exist for 'flood
recession agriculture' and 'non-equipped cultivated wetland areas and valley bottoms' (see categories 4A
and 4B in Table 1), these are seldom recorded. In the period 2008 to 2017, only 4 out of 49 countries in
sub-Saharan Africa reported on flood recession and only 6 reported on non-equipped cultivated wetlands
(FAO, 2021). The AQUASTAT categories thus formally provide space for documenting areas under farmer-
led irrigation development, but in practice the database reflects national statistics that tend to ignore
these activities and focus on donor- or government-funded initiatives.
These problems are well illustrated when considering the case of Tanzania more specifically. The
AQUASTAT database for Tanzania draws on two sources: the National Irrigation Master Plan of 2002 and
Venot et al.: The politics of irrigation data in Sub-Saharan Africa 550Water Alternatives – 2021 Volume 14 | Issue 2
the National Irrigation Census of 2003. These reported 184,000 and 193,000 hectares (ha) of irrigation
respectively, but with significant differences in regional distribution. AQUASTAT documentation notes
these discrepancies and observes that they could stem from differences in the definitions of irrigation
used, depending on whether or not rainwater harvesting is included (FAO, n.d.b). For the country as a
whole, this discrepancy is dealt with by taking the average of the two figures. A closer look at specific
regions, however, raises further questions. In Shinyanga, a major rice-growing region, AQUASTAT records
just 2,181 ha of land equipped for irrigation (FAO, n.d.b). The agricultural census for Shinyanga region,
however, registered 10,266 ha of irrigated land in 2002/2003 (United Republic of Tanzania, 2007: 41) and
29,783 ha in 2007/2008 (United republic of Tanzania, 2012b: 50), thus indicating a potential
underestimation of irrigation in the region by a factor of 5 and 15 respectively.
Beyond a mere battle of numbers, what is at stake here is the question of what constitutes 'irrigation'.
There are different interpretations even within Tanzania, depending on the administrative agency
considered. Critically, for the analysis we present below, there are no lands reported anywhere in
Tanzania under the AQUASTAT categories 4A ('Flood recession cropping area non-equipped') or 4B
('Cultivated wetlands and inland valley bottoms non-equipped') while we argue such areas are instances
of farmer-led irrigation development. The point here is not that these examples are representative of
systematic errors. We do not advocate multiplying current figures for irrigation by 5 or 15 to arrive at
true levels. We suggest, rather, that these examples are indicative of known problems with current
irrigation data that relate to the inadequate understanding of irrigation development currently observed
in sub-Saharan Africa. In the following section, we consider recent developments in the availability of
data based on remote sensing and investigate whether this can support new framings of irrigation
dynamics.
REMOTE SENSING ATTEMPTS TO DETECT IRRIGATION
A common application of remote sensing is quantifying the area of different land cover types through
satellite image classification techniques. By combining available field observations of irrigation with
satellite-derived attributes of the land surface, it is possible to produce maps that estimate irrigated area
at regional to continental scales. This is not easy. Downloading and processing hundreds of satellite
images requires a significant computing capacity and expertise. It also takes time. Teams at the
International Water Management Institute (IWMI) have taken several years to produce their maps
(Thenkabail et al., 2009). The technology and skills are not widely available and have generally been
beyond the reach of most research and government agencies in sub-Saharan Africa.
The past decade, however, has seen the emergence of new techniques aimed at mapping irrigated
area at global (Thenkabail et al., 2007, 2009), regional (Xiao et al., 2006), basin (Biggs et al., 2006; Cai and
Sharma, 2010), or even irrigation system scale (Conrad et al., 2007; Venot et al., 2010). In the early 2000s,
IWMI was at the forefront of such development and eventually published a Global Irrigated Area Map in
2009 (Thenkabail et al., 2009) with a resolution of 10 km2. Since then, remote sensing analysis has mostly
sought products with ever higher temporal and spatial resolution, as well as refining processing
techniques to improve the accuracy of detection.
In 2016, after several years of hard work, IWMI published irrigated area maps for Asia and Africa
(IWMI, n.d.), and further studies in Ethiopia, Ghana and the Limpopo Basin in South Africa. These were
presented as a major achievement, markedly improving earlier mapping exercises: "It’s a huge step
forward (…). IWMI pioneered the onerous task of mapping global irrigated areas back in 2006, but then
we only had resolution to 10 km. The new maps have improved that forty-fold" (IWMI, 2016). 2
2IWMI used MODIS image composites (with a spatial resolution of 250 m by 250 m) every 8 or 16 days to differentiate between
different types of crops (each crop having a different 'greenness' signal based on its growth) and combined these with higher
resolution Landsat (30 m) or even Sentinel (10 m) images and ground-truthing to estimate irrigated areas.
Venot et al.: The politics of irrigation data in Sub-Saharan Africa 551Water Alternatives – 2021 Volume 14 | Issue 2
Though remote sensing techniques may be able to capture some of the broad array of farmer-led
irrigation practices, they have caveats. First, much uncertainty and many blind spots remain. As those
involved in the most recent IWMI project put it (Ibid):
We need to acknowledge uncertainties in our products (…). Other approaches, such as using census data are
also important. This tool is designed to support and supplement other information systems rather than
replace or compete with them. There is a role for both. We will not always be able to be 100% accurate, and
accounting for informal irrigation and other new developments will remain a challenge (…). What maps like
this show is essentially a range of probabilities. That still makes it a useful tool, but it should not be taken as
precise mirror of ground conditions.
Second, for many years high-resolution image availability was an issue, as the best images were expensive
to obtain or were reserved for military use. Today, major space agencies have adopted open data policies,
with Landsat and MODIS – which are relatively easy to process and offer long-time series – being the
most-used data sources. These sensors, though, cannot see through clouds, and irrigation is often
practiced during cloudy rainy times of the year.
Open data policies, however, mean that new satellite products, and notably radar data that can 'see
through clouds', have become more easily available. The use of radar to monitor irrigated rice is well
established in parts of Asia (Ribbes, 1999; Chakraborty et al., 2005; Chen et al., 2007; Zhang et al., 2009,
Bouvet and Le Toan, 2011). However, it has rarely been used to explore irrigation activity in Africa. This
prompted us to undertake a pilot study in a number of sites in Tanzania to assess whether radar remote
sensing analysis could help to detect farmer-led irrigation development there.
The mapping method we report here uses data from the Sentinel-1 satellites of the European Space
Agency (ESA). The Sentinel-1 mission is a two-satellite constellation of C-band synthetic aperture radar
(SAR) instruments, which provides global coverage on a regular repeat cycle (Torres et al., 2012). Unlike
more commonly used optical sensors such as Landsat and MODIS, which measure sunlight reflected from
the earth’s surface, radar sensors operate by actively transmitting a microwave signal and measuring the
radiation that is reflected back to the sensor (Box 1). Accordingly, radar has advantages over optical
sensors because it can collect time series imagery of consistent quality regardless of weather, cloud cover
and illumination by the sun. A distinctive temporal pattern of returned radiation, or backscatter, is
expected due to a sequence of changing reflection responses characteristic of flooding and inundation of
vegetation (see Figure 1 in Box 1). This makes radar-based techniques particularly adapted to the
detection of irrigated rice fields. Other irrigated agrosystems and practices in which water is less visible
(because hidden by the canopy of agroforestry or because distributed through narrow furrows) may be
more challenging to detect. Radar also has disadvantages relative to optical remote sensing, such as the
noise-like interference inherent to this type of data and its relatively onerous pre-processing
requirements (see Appendix 1).
We piloted the use of radar data to map irrigation in three study regions in Tanzania where we also
have ground observations of farmer-led irrigation development. Shinyanga region is one of the most
important rice-producing regions in the country, with agricultural practices that have been described in
detail by Meertens (1999). Rukwa region has large areas of irrigated agriculture, and we have field
observations of rice farming near Lake Rukwa. Kilimanjaro region is a smaller producer of rice, though we
have detailed field information of farmer-led irrigation development from an area south of Moshi. Since
September 2016, both Sentinel-1 satellites have been acquiring dual-polarised (VV, VH) images every 12
days over Tanzania (IW mode, ground range detected). We acquired all ascending orbit images from the
ESA Copernicus Open Access Hub covering the three study regions from September 2016 to April 2017;
this totals 324 images and covers roughly one rice-growing season. 3 We pre-processed Sentinel-1 images
using Sentinel Application Platform (SNAP) software (see Appendix 1 for details on the procedure used).
3 Available from https://scihub.copernicus.eu/
Venot et al.: The politics of irrigation data in Sub-Saharan Africa 552Water Alternatives – 2021 Volume 14 | Issue 2 Time series of Sentinel-1 data comprises multiple features and the first step is to identify those that best capture the specificity of irrigated fields (see Box 2 and Appendix 2). Box 1. Principles of radar remote sensing The magnitude of backscatter recorded by a synthetic aperture radar (SAR) instrument is influenced by the properties of the transmitted radiation (such as its wavelength, polarisation [orientation], and incidence angle), the properties of the reflecting surface (such as its geometric structure, surface roughness and water content), and the interaction between the transmitted radiation and surface properties. Of importance to the detection of irrigation, 'rougher' surfaces such as bare soil or vegetation tend to result in more backscattered radiation than 'smoother' surfaces like still water, where less radiation is reflected back towards the sensor. Surfaces with higher moisture content, such as wet soil, tend to be more reflective to microwave energy than dry surfaces. The combination of a smooth reflecting surface such as wet soil with vertical elements such as flooded vegetation can result in a 'double-bounce' effect, where backscattered radiation is very high. Where a radar signal is reflected many times (such as by a plant canopy), it is common to find that the backscattered radiation does not return to the sensor with the same polarisation as was transmitted, an effect known as depolarisation. The polarisation of backscattered radiation thus also contains information about surface properties. Figure 1. Radio detection and radar satellites emit radio energy towards the earth’s surface and measure the energy reflected back to the satellite sensor (backscatter) Source: Authors. A Random Forest classifier is used to distinguish 'irrigated' from 'non-irrigated' areas. To do this we first needed to 'train' the classifier to recognise the seasonal pattern of radar reflection for locations known to be irrigated. 4 To supplement field observations from our three study regions, we generated a training dataset by identifying areas that we deemed 'irrigated' and 'non-irrigated' using high-resolution imagery from Google Earth. We notably considered geometric field shapes and earth 'bund' boundaries to be a sign of irrigation as these are common features of irrigated rice areas. Although there is an increased probability of error in this training dataset relative to one derived from purely field-based observations, this method allows the rapid generation of large reference datasets. We performed a separate 4 Random Forest is a widely used classifier for remote sensing data. It is considered to be robust to non-linearity and outliers, and generally produces good results without extensive tuning or computationally intensive processing. We trained it using scikit- learn software (Pedregosa et al., 2011). Venot et al.: The politics of irrigation data in Sub-Saharan Africa 553
Water Alternatives – 2021 Volume 14 | Issue 2
classification for each of the three study regions, employing independent training sites and accuracy
assessment data. This means that, in effect, we adopted a context-specific definition of 'irrigation' that
recognises that the form and timing of irrigated rice cultivation may be different across the three regions.
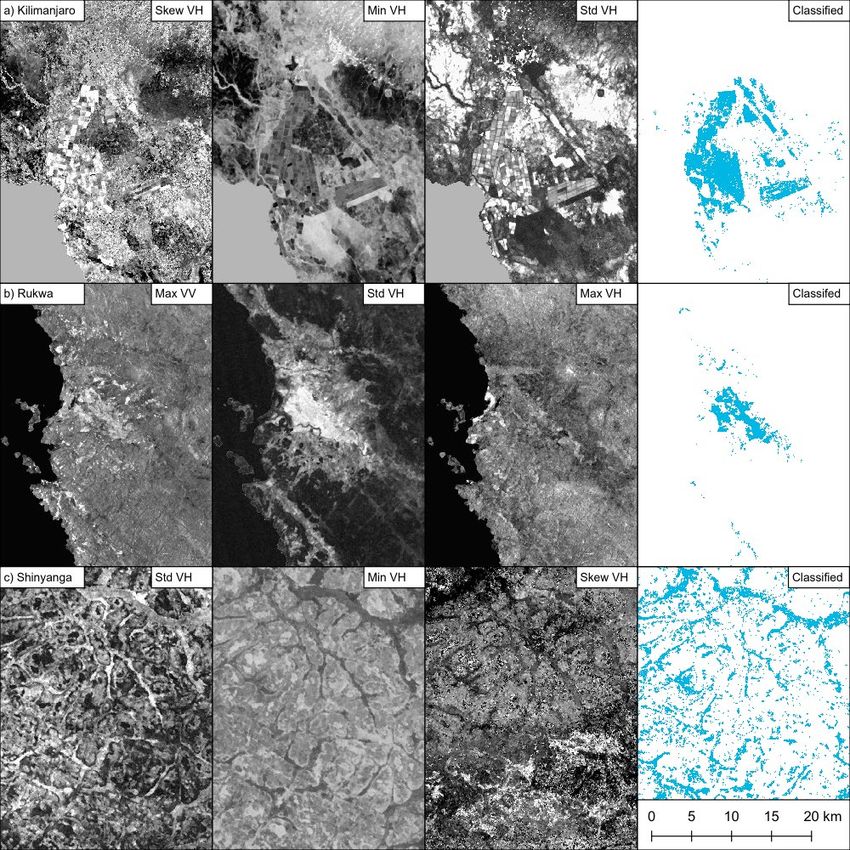
Training the Random Forest classifier separately for each of the three sites enabled a comparison of the
features of the radar signal that were important in predicting the presence of irrigated agriculture. The
analysis across the three sites shows that no single feature from the radar signal is a consistently good
predictor of irrigation (Figure 2; see also Appendix 2).
Figure 2. Image classification results over exemplar irrigated sites in (a) Kilimanjaro, (b) Rukwa and (c)
Shinyanga regions.
Source: Authors. Note: For each case, the features of the Sentinel-1 imagery that contributed most to the classification are
shown (see also Appendix 2), with the resulting irrigated area map in blue. VV= co-polarization; VH= cross-polarization.
Venot et al.: The politics of irrigation data in Sub-Saharan Africa 554Water Alternatives – 2021 Volume 14 | Issue 2
Box 2. Identifying radar features to detect irrigation
Our analysis is based on the premise that irrigated pixels display more variability in their backscatter
signal than do other land cover types. We generated a range of summary statistics from multi-temporal
Sentinel-1 backscatter data (annual minimum, maximum, mean, standard deviation, skew and kurtosis).
Together, these describe the backscatter properties and their temporal variability for each pixel. We also
generated a measure of the maximum backscatter increase between two consecutive images, a metric
similar to that used by Bouvet and Le Toan (2011) for mapping rice fields in the Mekong delta. This
statistic aims to capture the rapid increase in backscatter between the specular reflection of a flooded
field and the double-bounce effect that occurs once rice that has been initially grown in a nursery is
transplanted in the fields. These summary statistics were duplicated for each polarisation (co-polarization
– VV- and cross-polarization -VH) of Sentinel-1 imagery, totalling 14 features. Irrigated rice tends to be
limited to areas of low elevation and locations that are topographically relatively flat. To capture this, we
generated two further features using the Digital Elevation Model from the Shuttle Radar Topography
Mission, a dataset of global topography (Farr et al., 2007). 5 The first feature records distance above sea
level, and the second is an index of topographic roughness (calculated as the standard deviation of
elevation within a 10-pixel radius circular window).
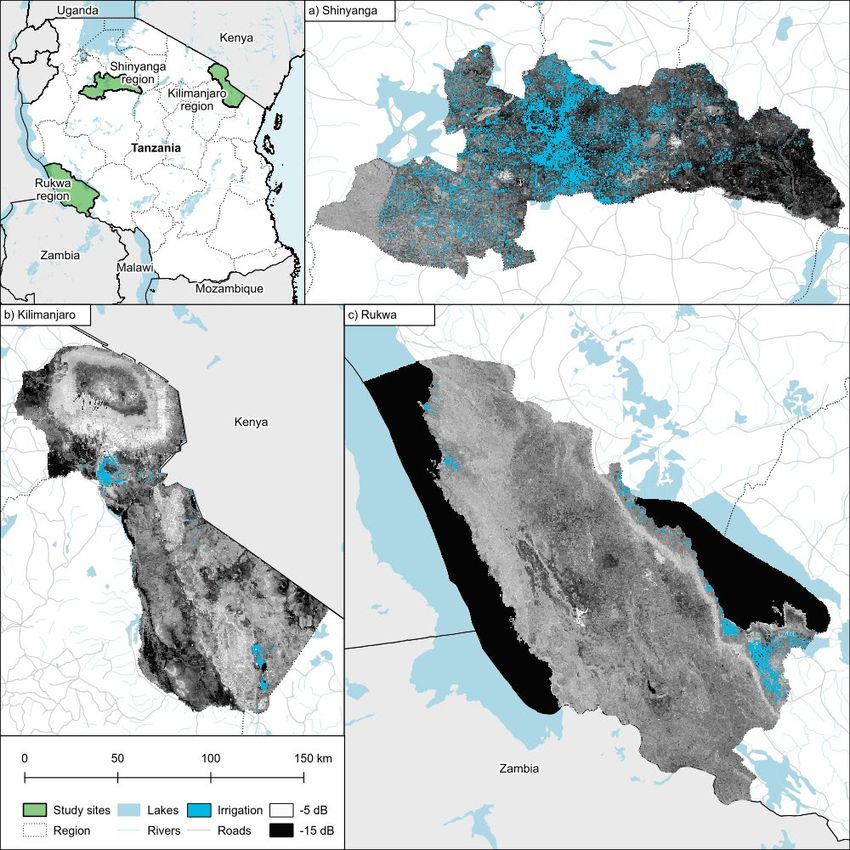
Figure 3 shows maps of irrigated areas obtained by radar analysis for the three study sites.
Mapped irrigation in Kilimanjaro region extends over 19,200 ± 7800 ha (± 95% confidence interval, or
CI) and appears largely limited to the area south of Moshi and to a large irrigated commercial sugar estate
near the towns of Ndungu and Kihurio in the southern part of the region. Similar to past remote sensing
analysis, the radar does not spot the hill-furrow irrigation systems on Mount Kilimanjaro or the Pare
Mountains though these have been extensively documented, including by authors of this paper (Grove,
1993; Gillingham, 1999; Mul et al., 2011; Komakech et al., 2012). These are systems found in elevated
and uneven topography where small streams are diverted by farmers to irrigate agroforestry systems.
Their invisibility to radar is likely linked to the fact that the permanent and dense canopy of agroforestry
systems conceals the changes in soil roughness and moisture that the radar data detects. It is possibly
also linked to the fact that hill-furrow irrigation was not added by the analyst into the training dataset on
which the classification relies.
Irrigation mapped by radar in Rukwa region covers an area of 36,600 ± 11,800 ha (± 95% CI) located
principally along the shore of Lake Rukwa and extending northwards along the Kavuu River. There is also
a smaller area of irrigation along the shore of Lake Tanganyika in the western part of the region,
particularly around the town of Kiranda.
Irrigation mapped by radar in Shinyanga region is extensive, covering 267,000 ± 37,000 ha (± 95% CI)
and accounting for 16.1% of the region’s total area. Irrigated fields are concentrated around the centre
of the region, particularly along the river networks running into the Mwanza Gulf of Lake Victoria to the
north. Irrigation is largely limited to river valleys, taking the form described in Meertens (1999), where
water control is achieved through construction of temporary bunds and dams in low-lying areas adjacent
to rivers, combined with harvesting of rainwater that flows down from higher slopes.
5 Available from https://www2.jpl.nasa.gov/srtm/
Venot et al.: The politics of irrigation data in Sub-Saharan Africa 555Water Alternatives – 2021 Volume 14 | Issue 2
Figure 3. Regional predicted extent of irrigation based on radar analysis (basemaps of each region are
mean VV backscatter).
Source: Authors. VV= co-polarization. dB= Decibel
Comparing the radar classification to the reference data used for accuracy assessment indicates that the
Random Forest classifier correctly identified most of the larger known irrigated areas across the three
study sites and did not incorrectly flag large areas of non-irrigation as irrigated. Overall map accuracy
varied from 86% in Shinyanga to 99% in Kilimanjaro and Rukwa (see Appendix 3 for a description of the
methods employed for accuracy assessment). However, as irrigation covers a relatively small proportion
of the Kilimanjaro and Rukwa regions, it is more informative to consider the accuracy of the irrigated
class alone. Uncertainty in estimates of irrigated area was high in all three study regions, with producer’s
accuracy varying from 56% to 74% and user’s accuracy between 55% and 83% (Appendix 3). Thus, as with
census and FAO data, significant uncertainty characterises remotely sensed irrigation data. The greatest
Venot et al.: The politics of irrigation data in Sub-Saharan Africa 556Water Alternatives – 2021 Volume 14 | Issue 2
absolute uncertainty in detecting irrigated areas was found in Shinyanga region, where the relatively low
accuracy of the irrigated class and widespread occurrence of irrigation inflated uncertainty. When
expressed relative to the total area of irrigation, however, our estimates of irrigated area were most
effective in Shinyanga. This is because in Kilimanjaro and Rukwa, where irrigation is relatively rare,
uncertainty is large relative to the area of irrigation, hence our estimate of total irrigated area is less
effective. Moreover, in these regions, where topography and environment vary significantly, irrigation is
likely to exploit micro-level conditions that remain invisible to the radar. Any training data set derived
from Google Earth image interpretation (such as that used in our analysis) is therefore unlikely to be able
fully to address this diversity. This highlights the vital role for ground-truthing campaigns that reflect the
diversity of irrigation practices observed in the fields.
These limitations notwithstanding, comparisons between the irrigated area mapped by radar and that
reported in the most recent agricultural census (2007/2008) offer useful insights. In Kilimanjaro, the
census figure of 36,607 ha (United Republic of Tanzania, 2012a) is 35% larger than the 27,000 ha upper
estimate of our 95% CI for this region. This probably reflects the fact that the widespread hill-furrow
irrigation systems of Mount Kilimanjaro and the Pare Mountains, while well known to government
agencies, are less likely to be detected by radar. In Rukwa and Shinyanga, however, which do not have
traditions of hill-furrow irrigation, we identified a significantly greater area of irrigation than had
previously been reported. In Rukwa region, the 2007/2008 census recorded 8,316 ha as irrigated (United
Republic of Tanzania, 2012c), which is 2.6 to 5.5 times lower than our estimate of 36,600 ± 11,800 ha. In
Shinyanga region, the census figure of 29,783 ha (United Republic of Tanzania, 2012b), is 7.6 to 10.1 times
lower than our radar estimate of 267,000 ± 37,000 ha (with AQUASTAT reporting a mere 2,181 ha of
irrigation).
A discrepancy of this order suggests that our radar analysis considered as 'irrigated' large areas that
are not recorded in official census data. This seems plausible if, instead of census data for 'irrigated crops',
we consider the agricultural census data for 'paddy rice' at the regional level. This data shows trajectories
of rapid growth by about 50% between 2002/2003 and 2007/2008 (from 110,673 ha to 175,192 ha;
United Republic of Tanzania, 2007, 2012b). Projecting this trajectory forward suggests that in 2016/2017
(the years of the radar images) the total paddy area could be around 230,000 ha for the districts of the
present day Shinyanga Region, a figure which falls within the estimates for irrigated rice generated by
our radar methodology. Moreover, our estimate for irrigated rice area proved unsurprising to those who
have worked on rice cultivation in Shinyanga (Meertens, personal communication, 4 November 2017). It
is also consistent with the significant yield gain recorded by FAO for paddy rice in Tanzania (from 1.9
tonnes/ha in the 2000s to 2.4 tonnes/ha in the 2010s; FAO, n.d.c), a gain which suggests that an increasing
number of farmers use some form of water control and management.
It is important to acknowledge that census data that report areas of 'equipped irrigation' cannot be
expected to correspond to areas of paddy grown under other forms of 'agricultural water management'.
This study, using radar images, suggests tantalising possibilities for better understanding the temporal
and spatial dynamics of farmer-led irrigation practices. These dynamics include medium-term trends
reflecting growth in population and markets, but also short-term changes responding to inter-annual
fluctuations in water availability (Lankford and Beale, 2007). The method, however, shares some of the
shortcomings of other (optical-based) remote sensing analyses of irrigated areas. It remains, for instance,
difficult to detect whether orchards and agroforestry systems are irrigated, and it is hard to detect small
patches of irrigation in rough terrain, such as small valleys in mountainous areas. Even in the case of
paddy rice, estimates still come with a high uncertainty range (though lower, it seems, than in census
data) and it can be difficult, for example, to distinguish flooded grassland near rivers from paddy fields.
Our radar analysis further stresses that accurate detection requires context-specific definitions in the
form of specific training procedures. This makes it rather unlikely that these methods – already
challenged by farmers' use of rapidly changing micro-spatial and temporal conditions – can be used in
routine monitoring exercises. This underlines that tracking the dynamics of irrigation in sub-Saharan
Venot et al.: The politics of irrigation data in Sub-Saharan Africa 557Water Alternatives – 2021 Volume 14 | Issue 2
Africa will always be challenging, whatever methods are used. Thus, in contrast to the widespread image
of remote sensing analysis as generating accurate, timely and widely applicable products with relative
ease, this study provides a stark reminder of their local character and the expertise and time that goes
into meaningful interpretation of remote sensing data.
More fundamentally, our study shows that, as with other methods, radar-based analysis is
underpinned by the need to use bounded categories of land use, even though farmer-led irrigation
development often cuts across conventional boundaries (Woodhouse et al., 2017) and reality seldom
conforms to neat boxes. As such, irrigation data generation efforts reflect first and foremost the analyst’s
understanding of what irrigation is, more than actual farming practices. This points to the need to analyse
and discuss irrigation data and data generation methods in relation to the narratives and politics of
irrigation development in sub-Saharan Africa.
BEYOND DATA: EXPLAINING THE INVISIBILITY OF FARMER-LED IRRIGATION DEVELOPMENT
The great diversity of agricultural water management practices in sub-Saharan Africa has long been
recognised as rendering the conceptualisation of 'irrigation' in the region problematic. Too restricted a
definition of irrigation may mean excluding many forms of water control by farmers (Woodhouse et al.,
2017). As Paul Richards (1983: 28) observed almost 40 years ago:
the absence of irrigation is (…) puzzling given the widespread significance of rainfall uncertainty in the
tropical zone. The answer to this particular puzzle would appear to be that irrigation was not absent. The
view that irrigation failed to spread beyond the Nile into sub-Saharan Africa is simply wrong.
We can illustrate this by exploring the way national governments and donors are thinking about
irrigation. The legacy they inherited from colonial administrations neglected the diversity of precolonial
agricultural water management practices in sub-Saharan Africa (Adams and Anderson, 1988; Widgren,
2004; Soper, 2006; Westerberg et al., 2010, Lang and Stump, 2017) and instead favoured large-scale
irrigation on the floodplains of major rivers. The latter are exemplified by the Gezira scheme in Sudan
that was constructed in the 1920s on the Nile, and the Office du Niger built ten years later in Mali. In both
schemes, small-scale cultivators were allocated plots to produce cash crops (initially cotton) as tenants
of a state corporation that was responsible for the management of the water infrastructure and of input
and output markets (Barnett, 1977; Aw and Diemer, 2005; Ertsen, 2016).
The influence of these colonial schemes can still be seen in contemporary irrigation policy in Africa as
the latter typically emphasises irrigation as distinct, spatially bounded enclaves embodying engineering
design and modern farming methods (Harrison, 2018; Veldwisch et al., 2009). The colonial influence also
infuses current definitions of irrigation. Indeed, as Adams and Anderson (1988: 522) observed some three
decades ago, "Irrigation is often conventionally defined simply by the fact that the particular cadre of
'experts' from the discipline of engineering are employed in its planning, design or management".
This 'scheme' model of irrigation development has long been challenged by scholars and some
development workers. Already by the 1980s, development practitioners considered that irrigation
investment in Africa was underperforming. In part, this reflected a wider ideological agenda that saw
state-managed activity as necessarily inefficient and prescribed turning over the management of
irrigation schemes to the private sector to be constituted by irrigators (as water users associations) and
commercial suppliers of inputs and services (Vermillion, 1991). Other critics, however, attributed the
underperformance of irrigation investments to the failure of engineers to understand the relationship
between the irrigation schemes they designed and farmers’ existing use of land and water. This lack of
understanding, they felt, resulted in displacement, disruption of existing production systems, and
political resistance (see, for example, Moris and Thom, 1985; Adams, 1992; Diemer and Vincent, 1992).
This led to proposals for a more inclusive definition of irrigation (Vincent, 2003) and notably a growing
recognition that irrigation was also taking place outside of official schemes. This 'non-scheme' irrigation,
Venot et al.: The politics of irrigation data in Sub-Saharan Africa 558Water Alternatives – 2021 Volume 14 | Issue 2
much of it small scale, could cover significant areas in aggregate terms, particularly where farmers
managed water in seasonally flooded lowland areas (Underhill, 1984; Hocombe et al., 1986). The
acknowledgement of non-scheme irrigation notably resulted in the introduction by the FAO of the
category of 'informal' irrigation to their irrigation statistics for Africa (FAO, 2005). Defined in parallel to
the other categories presented in AQUASTAT (see Tables 1 and 2), it was described as:
[s]chemes under local responsibility, controlled and operated by local people in response to their perceived
needs. In many areas with potential, farmers have attempted to enhance food production by introducing
some form of irrigation, e.g. small earth dams, simple diversion structures and self-made conveyance canals,
water harvesting, shallow groundwater abstraction. These schemes are often ad-hoc and therefore not
included in 'irrigated area'. They are also called initiated smallholder schemes (FAO, n.d.a).
The diverse forms irrigation development can take in sub-Saharan Africa are increasingly recognised by
researchers and development professionals (Giordano et al., 2012; Woodhouse et al., 2017) but much of
this irrigation – especially that initiated by farmers outside state-supported or state-managed irrigation
schemes – remains invisible in official accounts and databases of African irrigated agriculture.
We argue that this is not due simply to a lack of data, but rather to four interconnected conceptual
difficulties: 1) a continuum of water management practices that escapes conventional irrigation
categories; 2) the place of irrigation within farming and rural people’s other economic activities; 3) a
widely held perception that farmer-led initiatives are incompatible with modern design and that they are
unproductive and inefficient; and 4) the political narrative of water scarcity that shape engagement
between irrigators and development agencies. We now consider each aspect in more detail.
In thinking about the nature of water management in African agriculture, Moris and Thom’s (1985:
71) observation about vertisols in the African savannah seems worth repeating:
The valley-bottom 'vertisols' represent some of the best agricultural land available, provided they are
intelligently used with suitable technologies. The division between 'irrigation' and 'rainfed' cultivation is here
also arbitrary, since what usually occurs is not full irrigation, but rather a combination of drainage,
impoundment (for 'wet' rice), and some supplemental water to extend the soil moisture regime.
Scholarly writing has recently embraced the idea of a continuum and combination of techniques which
can range from 'rainfed' agriculture through rainwater harvesting and supplementary irrigation, to 'full'
irrigation (Molden, 2007; Rockström et al., 2010). This continuum largely explains the discrepancies that
may exist between different data sources, notably when reporting irrigated rice. Though the continuum
is readily acknowledged by irrigation engineers, development practitioners and researchers, most still
posit a binary division between practices that are, or are not, 'irrigation', with techniques that are not
considered 'irrigation' often being broadly categorised under the term 'agricultural water management'.
Practices 'at the margin' will be identified as belonging to one category by one analyst and to another
category by another, pointing out a need to reassess the utility of such categories.
The second conceptual difficulty that explains why many farmers’ initiatives are not seen as irrigation
is the way these practices are located alongside, as opposed to being exclusive of, other farming and
livelihood strategies. One of the most comprehensive critiques of irrigation design in Africa was made
almost three decades ago (Diemer and Vincent, 1992). It observed that engineers often made
inappropriate assumptions about key aspects such as the availability and cost of household labour for
agricultural work, the unity of 'household' decision-making, and producers’ access to markets. Put simply,
irrigated agriculture was thought to be a commercial activity that small-scale subsistence farmers would
not practice. This separation of irrigation planning from the broader conditions and characteristics of
small-scale agriculture is still evident in policy documents that tend to conflate small-scale production
Venot et al.: The politics of irrigation data in Sub-Saharan Africa 559Water Alternatives – 2021 Volume 14 | Issue 2
with subsistence or non-market goals. 6 Where development actors operate with such assumptions, they
will misread the dynamics of a farming landscape in which many small-scale producers use irrigation to
produce commercial crops while often maintaining rainfed production for other purposes and possibly
engaging in other economic activities such as trade or livestock production (Adams and Anderson, 1988;
for recent case studies see Hebinck et al., 2019 and Scoones et al., 2019).
The third reason why irrigated areas developed through farmers’ initiatives are not recognised in
official statistics relates to value judgements regarding farmers’ design and use of irrigation technologies.
The weirs, canals, boreholes and pumps they use are similar to technologies designed by engineers, yet
different. The difference stems from farmers combining different technologies in unexpected ways – both
spatially and over the course of a growing season – in what is best defined as 'bricolage', a way of
operating that is strikingly different from engineers’ practices (Lévi-Strauss, 1964). This similarity
between the technology designed by engineers and the combined techniques used by farmers makes
comparison possible, but also lays the groundwork for disqualifying farmers’ initiatives. Policy makers
sometimes have difficulties in accepting the functionality of farmers’ bricolage. Rudimentary techniques
such as bucket irrigation, or pumps and pipes, do not fit the image of the 'modern' and 'high tech' sector
to which policy aspires. As a consequence, they are often considered to be wasteful of scarce water
resources (de Bont et al., 2019a, 2019b). Equally, farmer-led expansion of irrigation – which aims to take
advantage of surplus or drainage water on the periphery of formal irrigation schemes – is often ignored,
or is even considered detrimental to the existing infrastructure and farming that is 'within the scheme'
(de Fraiture et al., 2014). According to this view, including these instances of irrigation in the statistics
would amount to an official acceptance of 'bad performance'. Acknowledging the value or efficacy of
farmers’ inventive bricolage would also contradict the prevalent paternalistic approach whereby
engineers and civil servants consider themselves to hold the only valuable form of irrigation knowledge,
which they have a duty to 'transfer' to farmers.
A fourth and final conceptual issue that makes farmers’ irrigation initiatives less visible to
development agencies and national governments is the fact that a regulatory framework with which to
engage smallholders is largely absent. It is not uncommon, for example, for small-scale water users to be
excused from compliance with water licensing rules on the basis of the perceived small scale of their
operations or their poverty. Water permits and payment of water fees are thus only required of those
whose use exceeds a defined minimum volume. Such approaches may be welcomed by small-scale
irrigators who thus avoid paying water fees but also by officials who are thereby not required to
administer many hundreds of such payments. However, another consequence of allowing small-scale
irrigation to go on unmonitored is that government administrations can then strategically ignore the
water rights of small-scale irrigators whenever competing larger-scale water users require water
allocations (Van Koppen and Schreiner, 2019). It is also evident that where state agencies recognise small-
scale irrigation activity as significant, regulatory policy prioritises the organisation and registration of
irrigators with a view to governing their activity and limiting their potential impacts on other
constituencies (United Republic of Tanzania, 2016; de Bont et al., 2019b; Mdee and Harrison, 2019).
THE POLITICS OF NEW DATA AND CHALLENGES OF REDEFINING IRRIGATION
In the absence of a capacity for constructive regulatory engagement with the large numbers of small-
scale irrigators, the political narrative of water resource management becomes critical. The discussion
thus moves from data towards politics and ideologies. Forty years ago, Paul Richards (1983) observed
that in debates over African land use simplistic ecological narratives often served to disguise political and,
6 In Tanzania’s National Irrigation Development Strategy (2013), for example, the category of 'commercial' irrigation is
differentiated from categories of both 'smallholder' and 'traditional' irrigation (whether improved or not, see pages xi and 17-
19). The explicit vision of the strategy is to "facilitate the Tanzania agriculture sector to be transformed from subsistence to a
modern and highly commercial sector" (page 1).
Venot et al.: The politics of irrigation data in Sub-Saharan Africa 560You can also read