Countering misinformation with targeted messages: Experimental evidence using mobile phones* - Alex ...
←
→
Page content transcription
If your browser does not render page correctly, please read the page content below
Countering misinformation with targeted messages:
                    Experimental evidence using mobile phones*

                   Alex Armand                Britta Augsburg                Antonella Bancalari
                                           Kalyan Kumar Kameshwara

                                                     August 2021

                                                        Abstract

           Widespread misconceptions can be critical, especially in times of crisis. Through a field ex-
       periment, we study how to address such wrong or inaccurate beliefs using messages delivered to
       individual citizens using mobile phones. We focus on misinformation related to the COVID-19 pan-
       demic in a hard-to-reach population – India’s slum residents. We randomly allocate participants to
       receive voice and video messages introduced by a local citizen, the messenger, and in which medi-
       cal practitioners debunk misconceptions. To understand the role of targeting, we randomly vary the
       signaled religious identity of the messenger into either Muslim or Hindu, guaranteeing exogenous
       variation in religion concordance between messenger and recipient. Doctor messages are effective
       at increasing knowledge of, and compliance with, COVID-19 policy guidelines. Changes in mis-
       conceptions are observed only when there is religion concordance and mainly for religious-salient
       misconceptions. Correcting misconceptions with information requires targeting messages to specific
       populations and tailoring them to individual characteristics. (JEL D04, D80, D83, I10, I15, Z12)

       Keywords: Misinformation, Misconception, Fake news, Religion, India, Social media, COVID-19.

   * Armand:   Nova School of Business and Economics – Universidade Nova de Lisboa, CEPR, NOVAFRICA, and Institute
for Fiscal Studies (e-mail: alex.armand@novasbe.pt); Augsburg: Institute for Fiscal Studies (e-mail: britta a@ifs.org.uk);
Bancalari: School of Economics and Finance, University of St. Andrews, and Institute for Fiscal Studies (e-
mail: antonella.bancalari@st-andrews.ac.uk); Kameshwara: University of Bath and Institute for Fiscal Studies (e-mail:
K.K.Kameshwara@bath.ac.uk). Declarations of interest: none. We would like to thank Oriana Bandiera, Maithreesh Ghatak
and Michael Callen, as well as participants at the LSE-STICERD Development Economics Seminar and the Institute for Fiscal
Studies Seminar for helpful comments. This project would have not been possible without the generous and insightful sup-
port of our partners in the field, Bhartendu Trivedi, Yashashvi Singh, Tatheer Fatima and the field team of Morsel Research
and Development. We are also indebted to study participants for their willingness to contribute to the study. We gratefully
acknowledge financial support from the International Growth Centre and the LSE Special Grant for Coronavirus Research and
the Economic and Social Research Council (ESRC)’s Centre for the Microeconomic Analysis of Public Policy at the IFS (grant
reference ES/M010147/1). Kameshwara acknowledges the support from the SWDTP Placement Scheme funded by the ESRC.
Ethics approval was secured from the London School of Economics (REC ref. 1132). The pre-analysis plan was registered on
the AEA RCT registry (Armand et al., 2020).

                                                            1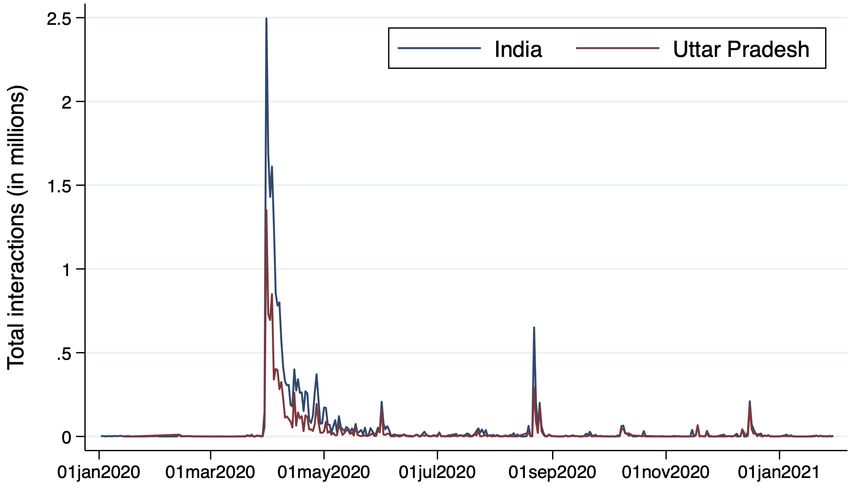
Misinformation plays an important role in distorting people’s beliefs (Gerber et al., 2009; Barrera et al.,
2020). Media, and in particular social media and instant messaging platforms, are often used as channels
to propagate fake news, spreading misconceptions (Allcott and Gentzkow, 2017; Barrera et al., 2020).1
This can have deep consequences in the way people make decisions in a wide variety of domains.2 In the
context of the COVID-19 pandemic, misinformation has become so widespread to have been deemed a
major concern for public health, labeling its diffusion as infodemic (Vicario et al., 2016; World Health
Organisation, 2020; Bursztyn et al., 2020). While the literature highlights the importance of misinforma-
tion in spreading misconceptions among citizens, their persistence is ‘incompletely understood’ (Chan
et al., 2017), and evidence about the instruments that can counteract them remains limited.

We study how targeted messages, i.e. messages delivered and tailored to an individual citizen, can
correct misconceptions. To this purpose, we implement a field experiment among slum residents of
the two largest cities of Uttar Pradesh (UP), India, amid the COVID-19 pandemic. Misinformation is
a particularly pressing issue in India, which has seen dramatic increases in access to platforms that are
widely used to spread misleading information. Internet penetration rate increased from about 4% in
2007 to 50% in 2020, giving access to 622 million users, while social media platforms are becoming
the primary source of news (Statista, 2021). With the onset of the COVID-19 pandemic, a wave of
misinformation flooded India to the extent that PM Narendra Modi addressed the nation urging everyone
to rely only on credible medical advice and demanding social media companies to curb misinformation
on their platforms (Purohit, 2020; Akbar et al., 2020). Misconceptions about COVID-19 were widespread
in our target population from early in the pandemic.

Being the most marginalized and less-educated share of the urban population in India, focusing on slum
residents allows studying the roots of misconception among the citizens that are most-at-risk for the con-
sequences of misinformation (Lazer et al., 2018; Bavel et al., 2020). Worldwide one billion people live
in such settlements -– more than half of these in Asia and almost a fifth in India (World Bank, 2020).
From June 2020, amid the early months of the pandemic, we followed more than 4,000 slum residents via
phone surveys for up to 6 months. Using standard measures of agreement with self-reported misconcep-
tion together with a novel survey instrument to capture agreement with other citizen’s misconceptions,
we gathered rich information about people’s beliefs related to the COVID-19 pandemic.

By varying the content of a message sent to citizens using mobile phone technology, the experiment tests
two hypotheses about the persistence of misconception among citizens. First, we test whether receiving
credible and informative messages can correct misconceptions. We randomly allocate participants to
receive messages on their mobile phones in which doctors working in locally-renowned hospitals debunk
misconceptions related to COVID-19 (versus receiving an unrelated message about a Bollywood gossip).
In the study setting, 95% of the target population report doctors and health experts as the most trusted
    1
      A misconception is defined as a wrong or inaccurate idea/belief. See, e.g., Scheufele and Krause (2019) for an application
to science.
    2
      These include women’s agency and fertility choices (Jensen and Oster, 2009; La Ferrara et al., 2012; Kearney and Levine,
2015), political accountability (Besley et al., 2002; Strömberg, 2004), crime (Müller and Schwarz, 2021; Bursztyn et al., 2019;
Card and Dahl, 2011; Dahl and Dellavigna, 2009), social capital and attitudes (Olken, 2009; Paluck and Green, 2009).

                                                               2
source of COVID-19 information. In addition, given concerns that class differences between the recipient
and the doctors can induce skepticism (Gauchat, 2012; Eichengreen et al., 2021), the messages were
introduced by a local citizen (labeled the messenger). While trusted voices have shown to increase the
credibility of the source and improve knowledge and health outcomes (O’Keefe, 2016; Greyling et al.,
2016; Khan et al., 2021; Sadish et al., 2021), there is limited knowledge on how targeted messages can
affect persistent misconceptions.
Second, we test whether tailoring the message by introducing shared characteristics between the mes-
senger and the recipient improves its effectiveness. Building on the literature on identity (Akerlof and
Kranton, 2000), we focus on religion concordance and we further randomize the signaled religious iden-
tity of the messenger to be either Muslim or Hindu, by altering its name, clothing, and greeting. Religious
identity is highly salient in India, and was particularly so during the onset of the COVID-19 pandemic,
which fueled pre-existent tensions that spurred violence against the Muslim population (Banaji and Bhat,
2020; Menon, 2020).3 At baseline, misleading claims about the role of Muslim citizens in the spread of
the virus were identified as the primary driver of the increase in fake news on social media (Appendix A;
Purohit, 2020); other widely-spread misconceptions had similarly a clear religious connotation. While
misconceptions are often tied with tensions across different identities (Greenwood et al., 2018; Bazzi
et al., 2019; Alsan et al., 2019, 2020; Greenwood et al., 2020; Hill et al., 2020; Alsan and Eichmeyer,
2021; Lowe, 2021), it remains unclear whether identity can play a role in debunking them.
Our results show that targeted messages containing informative content from trusted sources is an effec-
tive way to inform citizens: Doctor messages increase knowledge about ways to prevent infection with
COVID-19, and reported compliance with the related policy guidelines. Similar findings are reported by
Alsan et al. (2020), Torres et al. (2021), and Breza et al. (2021) in the context of the US.
While citizens become more acknowledged about the recommendations received, misconceptions aris-
ing from fake news are hard to change and a large proportion of the targeted population holds on to
their wrong beliefs. The effectiveness of messages in debunking them relies on whether there is religion
concordance with the messenger. Misconceptions are corrected only when the religious identity is re-
lated to the misconception, and when the misconception is religion-salient, i.e. wrong beliefs are stably
different across religions. Results are robust to alternative specifications and to multiple hypothesis test-
ing. This result reinforces the importance of identity in they way views and decisions are formed (Bazzi
et al., 2019; Lowe, 2021), and especially in the way health outcomes are improved (Alsan et al., 2019;
Greenwood et al., 2018, 2020; Hill et al., 2020; Alsan and Eichmeyer, 2021). It also contributes to the
understanding of the role of religion among interacting citizens, a growing field of research (Iyer, 2016),
highlighting an important role of diversity in the persistence of misinformation (see, e.g., Habyarimana
3
The Hindu-Muslim conflict in India goes back to the pre-partition era and flared up at regular frequency since (see, e.g.,
Mitra and Ray, 2014). During the pandemic, UP was repeatedly in the news for religious incidents (Arya, 2020; Al Jazeera,
2020). In addition, in early 2020, the Citizenship Amendment Act, a new law that offers Indian citizenship to people from three
neighboring countries, but restricted to non-Muslim only, led to protests across the country (see, e.g., Bhatia, 2021). Discrim-
ination and violence against stigmatized groups has been documented in other pandemic settings (Desai and Amarasingam,
2020).
3et al., 2007).
Overall, findings provide important insights into how governments and agencies across the world can rely
on targeted messages to counter misconceptions. They underline that careful consideration of the type of
misconception and the population targeted need to be taken into account for their design, highlighting the
importance of tailoring messages to specific individuals. These results contribute to the literature iden-
tifying ways to counteract agreement with misconceptions (Bolsen and Druckman, 2015; Ecker et al.,
2010; van der Linden et al., 2017), without undermining agreement with accurate information, a concern
highlighted in other contexts (Clayton et al., 2019).
1 Intervention and experimental design
The intervention targets the population of slum residents in the two largest urban agglomerations in UP,
Lucknow and Kanpur. Appendix B provides a description of the study area. Similar to other states of
India, UP was hit hard by the COVID-19 pandemic during the period of the study (Appendix Figure
A1 shows he number of COVID-19 cases and deaths in UP during this period). Guidelines of social
distancing and wearing face masks remained constant throughout these periods. Appendix Figure A2
shows details of which restrictions applied when over the study period.
The intervention consists of sending messages targeted at individual citizens using mobile phone tech-
nology. We sent the messages to targeted recipients in two forms: as an audio via voice messages, and as
a short video through a WhatsApp chatbot.4 Each message is structured in two components: the intro-
duction of a messenger, i.e. a local citizen closer in socio-economic status to the targeted population, and
the informative content of the message. In the main treatment, the informative content is represented by
doctors from locally renowned medical institutions updating priors about misinformed ways to prevent
COVID-19. Qualified medical practitioners were chosen as the main messengers since 95% of respon-
dents named doctors and health experts as their most trusted source of COVID-19 information in the
baseline survey. We sent two rounds of messages debunking two misconceptions prevalent in India: first
that eating a vegetarian diet protects against COVID-19 (sent in October–November 2020), and second
that the immune system of Indians is resilient to COVID-19 (sent in December 2020–January 2021).
Pre-intervention, these two beliefs about protection against COVID-19 were the two most prevalent in
the targeted population (Appendix Figure D5): about two-thirds of our study population believed that a
vegetarian diet can protect from infection with COVID-19, and only 16% disagree with the idea that the
Indian immune system ensures protection against the virus.
To build the informative content, we first asked several doctors from renowned local institutions to reply,
unscripted, to the questions “Is it true that eating a vegetarian diet protects against COVID-19?” and
“Is it true that the immune system of Indians is resilient to COVID-19?”. Responses were then collated
4
WhatsApp chatbot is a software program that runs on the encrypted WhatsApp platform, purposely programmed for the
intervention. Users can communicate with the chatbot through the chat interface.
4ensuring that every message was composed by a first part debunking the misconception and a second
part providing a reminder about the proven ways to protect against COVID-19. We refer to this as the
doctor message treatment arm. The full script is provided in Appendix E.
A control message was designed with a similar structure to hold all features not varied experimentally
constant, but replacing the informative content with an unsubstantiated gossip concerning Bollywood
stars. Sending a control message, rather than no message, allows us to disentangle the effects of the
intervention from receiving a message through mobile phone technologies. The final message duration
was 112 seconds for the doctor message and 40 seconds for the control message.
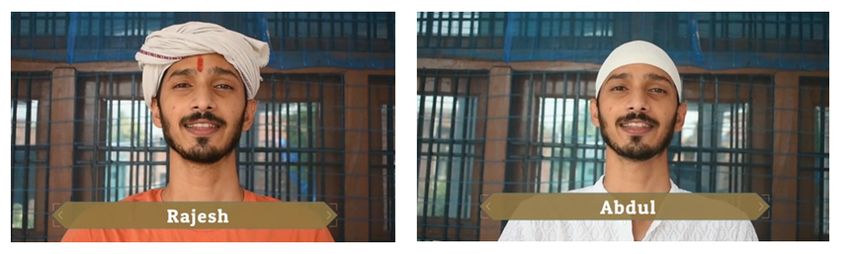
For each message, we introduced two additional variations by changing the signaled religious identity
of the messenger. In one version, keeping all else constant (including the informative content), the mes-
senger signaled a Hindu identity by dressing with traditional Hindu head wear and colors (see Appendix
E), using “namaste” as salutation, and introducing himself as “Rajesh”. In the other version, again
keeping all else constant, the messenger signaled a Muslim identity by dressing with traditional Muslim
head wear and colors, using “salam alaikum” as salutation, and introducing himself as “Abdul”.5 In our
analysis, we refer to religion concordance of the message when the signaled religious identity of the
messenger is the same as the religion stated by the receiver of the message. We therefore refer to this
cross-randomization as the religion concordance variation.
All messages were incentivized to increase attention to the message by giving participants the chance to
enter a lottery if they replied correctly to a follow-up question about the message. During the introduction
of the message, the messenger announced the financial incentive to be paid out through mobile top-
up.6 Lottery incentives have been widely used in experimental economics to increase response rates,
particularly relevant when faced with potentially extremely low uptake. For instance, Banerjee et al.
(2020), sending video messages to Indian citizens urging them to comply with COVID-19 policies and
report symptoms, achieved a viewing rate of information videos of only 1.14%, consistent with low rates
of ‘click-through’ studies (Richardson et al., 2007; Kanich et al., 2008).
We perform household-level randomization by randomly allocate targeted households, independent of
the number of mobile phones in each household, to receive one of the message variation, stratifying by
religion of the household head and by city. Randomization into the experimental arms was conducted
at the household level because the intervention is directed one-to-one through mobile phones. Using
households as the unit of randomization allows us to take advantage of greater variation in response to
the intervention within slums. Concerns over spillover effects are mitigated because the voice message
5
The names are the two most common male name by religion in the census of the targeted population. Refer to Armand
et al. (2021) for further details about the census.
6
We introduced two types of incentives: a low-incentive lottery with a value of Rs. 2,500 (US$35) and a high-incentive
lottery with a value of Rs. 5,000. The two modalities were randomly allocated to participants in the process of randomization.
Results on the effectiveness of different incentives are shown in Appendix Tables G7–G9. Potentially driven by the lottery
amounts being both sizable for our study context (approximately 14 days of pay under the Government’s National Rural
Employment Generation Scheme), and in line with Porter and Whitcomb (2003), we do not find any differential impacts
along this margin.
5is in the form of an automatic call which cannot be forwarded or shared, and the share of participants
accessing short videos through WhatsApp is small (see Section 2). There remains the possibility of word-
of-mouth information sharing, which we cannot test for. To the extent that it did occur, our estimates
would provide lower bounds to the true treatment effect.
2 Data
We draw on two data sources: administrative data on message delivery and time listened, and a panel
survey of slum residents.
Administrative data. We gather information about the delivery of both the WhatsApp chatbot and
the voice message, and about the share of the voice message that is listened by the user. Concerning
the WhatsApp chatbot, 50% of the sample had WhatsApp installed on their phone, 39% received the
message, 7% interacted with the chatbot, but only 3% replied accurately with ‘Hi’, a precondition to
play the video. The voice messages were instead sent to the whole sample, in which 37% picked-up
the phone when receiving the call, and once picked-up, the average listen time was 42 seconds (55%
of the message). Listening times vary between the experimental arms, given that the control message
was significantly shorter. For those who listened to the message, the average listening time was 51
seconds (43% of the message) of the doctor message, and 33 seconds (67% of the message) of the
control message.
Primary panel data. A baseline survey was collected in June–July 2020, followed by two panel data
waves in October–November 2020, and December 2020–January 2021 (3.5 and 5.5 months after the
baseline survey). Interviews were conducted via phone conversation. Multiple follow-up measurements
allows the averaging out of noise in the outcome variables, and increases power (McKenzie, 2012). The
sampling frame for targeted recipients was a census conducted in the second half of 2018 of more than
30,000 households living in the slums of the study area (see Armand et al., 2021 for further details). We
selected 5,261 residents to be part of the study, all of of which were sent the messages. Of these, we were
able to interview 3,991 at baseline, 3,816 during the first follow-up and 3,906 during the second follow-
up survey. Combining both follow-up surveys, we re-interviewed 87% of residents at least once, with
a low implied attrition rate (13%) compared to phone surveys conducted in similar settings.7 A likely
important driver of attrition rate is represented by people using multiple SIM cards to avail discounts
offered by different providers (Silver and Huang, 2019). Importantly, attrition is orthogonal to treatment
allocation (Panel B, Table C2).8
Appendix Table C1 presents descriptive statistics of the sample. Twenty-one percent are Muslim, similar
to the religion composition at the state level. Almost 80% of respondents are male, mostly represented
7
Response rates are typically around 50% in non-crisis contexts, while during crisis contexts this is expected to be lower.
For instance, a study during the Ebola crisis was able to re-interview only 38% (Himelein et al., 2020).
8
Appendix Table C3 correlates observable characteristics with attrition. Being female and dwelling owners reduces attrition.
6by the household head, with an average age of 40 years. More than 80% live in a strong dwelling
with four other members and 38% have a ration card (i.e., an official document by state governments
for subsidized purchase of essential commodities). At the time of the baseline survey, when lockdown
restrictions started to ease in both cities, 12% of respondents report that at least one member was having
COVID-19 symptoms, and respondents knew on average 1.6 COVID-19 symptoms.
The surveys elicited information on households’ experiences during the COVID-19 pandemic, such as
their knowledge on how to prevent the virus, compliance with policies, risk perceptions, symptoms and
testing, as well as information on sources of information and trust.9
A key part of the surveys was the elicitation of the level of agreement or disagreement with miscon-
ceptions about prevention of COVID-19. In the follow-up surveys, we ask whether respondents agree or
disagree with the following ways of preventing COVID-19: (1) eating a vegetarian diet, (2) just being In-
dian because of stronger immune systems, (3) living in warm weather because the virus does not survive,
and (4) being a disease of rich people, poor people are safe.10 The idea that Indians have stronger immu-
nity to prevent COVID-19 is the one most widely held, with two thirds of respondents voicing agreement.
But even the least perceived misconception – that COVID-19 is a disease that only rich people can get – is
still believed by one third of respondents. Figure 1 shows the average (normalized) agreement with these
misconceptions over time (Appendix Figure D6 breaks down the level of agreement using categorical
responses). Responses to the misconception that eating a vegetarian diet is a mean to prevent COVID-19
differ in two ways from responses to other statements: the percentage of respondents agreeing does not
reduce over time, and the misconception is religion-salient, i.e. Hindus are significantly more likely to
hold this belief than Muslims, likely because they are also significantly more likely to follow a vegetarian
diet.
Because misconceptions are often spread by groups or individuals with a particular identity where the
legitimacy is drawn from, we introduce a novel survey instrument to capture misconceptions originating
from these specific sources. We first inform respondent that ‘we have surveyed people from UP and
would like to hear whether you agree with their opinion’. We then reveal identity information of the per-
son making a statement by providing a name which signals his or her religion. Similar to the messenger,
we choose names common to the local context. For a randomly selected one third of the sample the name
is associated with Hindu religion, for one third with Islam and for the remaining respondents, the state-
ment is introduced by ‘people say’. We elicit level of agreement with four statements that have a religious
connotation: [NAME] says/People say that (1) ‘if you are vegetarian, you do not need to worry about the
coronavirus’, (2) ‘if you are a good person you do not need to worry about the coronavirus’, (3) ‘unity
and brotherhood will help us fight the coronavirus’, and (4) ‘religious gatherings should be allowed’.
The first statement carries religious salience since, in the context of India, vegetarianism is widely asso-
9
In order to collect detailed high-quality data, while at the same time balancing the need for concise phone survey, some
modules were administered to a random subset of households only. This was for example the case for compliance with COVID-
19 rules and regulations: some households were asked about social distancing and other households about hand washing.
10
At baseline, we asked respondents about prevention of COVID-19 using open-ended questions. Answers included miscon-
ceptions, which helped shaping the interventions and are summarized in Appendix D.
7ciated with the dominant ideology of Hinduism. The second statement alludes to the idea that religion
helps a person to become a ‘good person’, and in the third statement, ‘unity and brotherhood’ is typically
connected with Islam, but in the context of India, it is also associated with the Hindu nationalist ruling
party Bharatiya Janata Party (BJP).11 The fourth statement talks explicitly about religious gatherings.
We highlight that this statement can be interpreted as an opinion rather than a misconception. It bears
weight in the study context in view of an early outbreak in India linked to a congregation by the Tab-
lighi Jamaat, an Islamic missionary movement, which led to strong Islamophobic reactions across media
(Menon, 2020).
Panel A of Figure 2 shows levels of agreement for the random subset of households where statements
were said by ‘people’, split by whether the respondent is Hindu or Muslim. As with the generic statement,
Hindus are significantly more likely than Muslims to agree that vegetarianism implies not needing to
worry about being infected. Remaining statements, although carrying religious connotation, do not show
similarly stark differences by religion. Except for the statement about vegetarianism, we observe an
increase in agreement over time for both Hindus and Muslims. This trend is particularly stark for the
statement about religious gatherings, possibly linked to the fact that the first wave of cases was receding
when the follow-up data was collected, making it safer for gatherings to take place.
Panel B of Figure 2 displays levels of agreement with the statements said by someone of the same religion
as the respondent (‘own’), of a different religion (‘other’), or whether it was said by ‘people’. We find
relatively small differences in levels of agreement by religious concordance. This suggests low levels
of taste-based discrimination (driven by an aversion towards other religious identities) in our sample.12
The largest (statistically significant) difference is found in the statement ‘if you are a good person you do
not need to worry about the coronavirus’, where respondents tend to agree more, on average, when said
by somebody from another religion. Our study will shed light on whether one could leverage on these
(small) identity biases to correct misconceptions.
3 Results
To assess intervention impacts we rely on post-baseline data, in line with the trial registry (Armand et al.,
2020) and justified by having successfully created observationally-equivalent groups (we report mean
differences at baseline between control and treatment groups for various characteristics in Appendix
Table C1 and for outcomes at baseline in Appendix Table C2). We estimate treatment effects using the
following specification:
11
Slogans such as Vasudhaiva Kutumbakam (brotherhood of mankind) and unity among religions were evoked multiple times
by key party leadership before and during the pandemic as one of the ideological foundations of Hinduism (Kulkarni, 2017;
Choudhury, 2020; Hindustan Times, 2020; The Economic Times, 2020).
12
Low levels of taste-based discrimination could be driven by the close proximity households of different religions live in,
thereby having more information about each other (Farber and Gibbons, 1996; Altonji and Pierret, 2001; Arnold et al., 2018).
While one might be concerned that the name itself does not carry sufficient information for the respondent to react, we record
religious concordance of the citizen to have significant treatment effects that survive multiple hypothesis testing (Section 3).
8Yijt = β Ti + α Xij + δt + it (1)
where Yijt are outcomes of interest of recipient i in slum j at time t. Ti is an indicator variable equal
to 1 if the recipient i is in the treatment group, and 0 otherwise. Xij is a set of indicator variables for
randomization strata, and δt are period-of-survey indicator variables. The error term it is assumed to be
clustered at the slum level.13 Because 63% of recipients did not receive or listen to any message (Section
1), the parameter β identifies the intention to treat (ITT) impact of the treatment.
Results are presented in Tables 1–3. In each table, Panel A provides estimates of treatment effects using
equation 1, where Ti indicates allocation to the doctor treatment, while Panel B restricts the sample to
those that were allocated to the doctor message and Ti becomes an indicator of religion concordance
between the messenger of the doctor message and the intended recipient. Appendix Tables C1–C2 show
that, conditional on having received the doctor messages, baseline characteristics are also balanced be-
tween those that were allocated to different introductions of to the informative content of the message.
Appendix G.4 reports heterogeneous impacts by pre-specified variables, as well as by a social desirability
index, and no noteworthy differences are found.
In terms of exposure to the intervention, participants who received the doctor message have a 2.0 percent-
age point higher probability of recalling at least one of the keywords about COVID-19 from the message
sent to their mobile phones (last Panel of Appendix Table C2). While small in magnitude, this is a
40% increase over the control mean. Appendix Tables G1–G3 show treatment on the treated estimates,
obtained through an instrumental variable strategy where the endogenous treatment variable a proxy of
treatment intensity, i.e., a variable that multiplies the amount of time the message is listened with the
number of key words mentioned during this time) is instrumented with the random treatment indicators
Ti .14 The first stages are strong both when comparing the exposure to the doctor message versus the
control message, and when comparing the exposure to a religious-concordant introduction to the doctor
message versus non-religious concordant introduction. The doctor message increases listening intensity
by 14 percentage points (p-value < 0.001) and the F-stat is 74.4. The religious concordance introduction
treatment has a similar coefficient and F-stat of 45.9. In line with expectations, IV estimates are larger in
magnitude, and their statistical significance remain comparable to ITT estimates.
Level of agreement with misconceptions
Table 1 presents estimates of treatment effects on agreement with COVID-19 misconceptions. Column
(1) concerns the misconception that eating vegetarian is a mean to prevent COVID-19, column (2) that
Indians have a stronger immunity to prevent COVID-19, column (3) is about agreement with the mis-
13
Results are robust to heteroskedasticity and to clustering standard errors at the individual level. In addition, using weights
to increase representativeness of the population does not affect results.
14
We estimate ‘listening time’ for those 2.5% that were able to view the video as 50% of the video length. Varying these
imputations does not alter results.
9conception that living in warm weather protects from COVID-19 because the virus does not survive, and
column (4) that coronavirus is a disease of rich people, so poor people are safe.
We do not find any evidence that the doctor messages are successful in shifting agreement with these
general statements (Panel A). However, when the doctor message is introduced by religion-concordant
messenger, the respondent’s likelihood of agreeing with the statement that eating vegetarian protects
from getting COVID-19 reduces by 1.6 percentage points. This effect results from combining religion
concordance with the doctor message, rather than from the religion concordant introduction by itself
(Appendix Table G4 shows estimates of the effect of receiving the religion-concordant introduction with
the Bollywood control message). When accounting for multiple hypothesis testing, the p-value increases
from 0.04 to 0.16.
Table 2 assesses whether the interventions are effective when misconceptions are linked to identity and
local context. Columns (1)-(4) estimate impacts on agreement with statements, when the person making
the statement is of the same religion as the recipient, whereas in columns (5)-(8) the statement is made
by a person of a different religion.15 Columns (1) and (5) indicates level of agreement with [NAME]
saying that ‘if you are vegetarian, you do not need to worry about the coronavirus’, Columns (2) and
(6) that ‘if you are a good person you do not need to worry about the coronavirus’, Columns (3) and (7)
that ‘unity and brotherhood will help us fight the coronavirus’, and Columns (4) and (8) that ‘religious
gatherings should be allowed’.
Focusing first on the left Panel of the table, which shows outcomes where the statements are made by
someone of the same religion, we find that for statements 1 to 3 the estimated effects are in line with
those for the religious generic statement (Column (1) of Table 2), both in terms of size and sign. This
suggests that respondents might interpret generic statements as said by someone closer to their identity.
The effect of the religious-concordant introduction on the statement about vegetarianism is, however, no
longer statistically significant, possibly driven by the reduction in sample size due to only two-thirds of
the sample having been presented with a statement introduced by a named person.
Being allocated to the doctor message with a religion-concordant introduction reduces by 3 percentage
points the agreement with the misconception that ‘being a good person protects from getting the virus’.
This effect is statistically significant at the 5% level and is robust to multiple hypothesis testing. People
seem to be only persuaded to disagree with a statement said by their own religion when the message
delivered leverages on religion concordance.
The right Panel of Table 2 shows impact estimates when statements were made by someone of a differ-
ent religion as compared to the respondent. The doctor message reduces agreement with misconceptions
stated by someone else, statistically significant only for the statement of ‘being a good person’. The doc-
tor message successfully decreases agreement with this statement by 3.9 percentage points, statistically
significant and robust to multiple hypothesis testing. We find no effects driven by religion concordance.
15
Appendix Table G10 shows impacts when statements are said by ‘people’. We find no significant effects.
10This effect brings the level of agreement with someone of another religion down to that of someone of the
own religion (Figure 2. For other statements, the baseline difference between ‘own’ and ‘other’ religion
is less pronounced, leaving less room to be aligned. Correcting misconceptions said by someone from
another religion is achieved through messages from doctors (a trusted source in our context), without the
need to leverage on religion concordance.
Knowledge and reported behavior
Column (1) in Table 3 shows impact estimates on the extent to which respondent check truthfulness of
news, proxied with an indicator variable equal to 1 if news shared or discussed with family and friends is
always or frequently checked for truthfulness. We find a significant reduction in reported fact checking of
news. We interpret this result as respondents having now received information they trust more, decreasing
their felt need for additional checks.
Columns (2)–(5) show impacts on knowledge of and compliance with COVID-19 WHO guidelines,
which are included at the end of the doctor message (i.e, using a mask in crowded places, social distanc-
ing, and washing hands). Knowledge of guidelines is calculated as the normalized mean of responses
on different policies, measured using a likert scale. Compliance with policy guidelines is captured as an
indicator variable, equal to 1 if the respondent does not visit any other slum nor receive any visitors from
other slums within the previous week, and 0 otherwise.
The increased exposure to the doctor message translates into changes in knowledge and reported behav-
ior. We find a significant increase in knowledge of guidelines about using a mask and on hand washing,
as well as a significant increase in reported compliance with these guidelines. Respondents are 4 per-
centage points more likely to report compliant behavior. The effects on knowledge are smaller, partly
attributable to the fact that knowledge on guidelines is high also without the intervention taking place.
When accounting for multiple hypothesis testing, only the effect on checking truthfulness loses signif-
icance at conventional levels, with the p-value changing to 0.107. The effect on reported behavior is
particularly encouraging considering that previous literature has found that slum residents would find it
challenging to adhere to COVID-19 guidelines, given the lack of access to water (Patel, 2020) and the
limitations on social distancing imposed by crowded spaces (Wasdani and Prasad, 2020).
4 Conclusions
The internet and social media have become popular resources for news. At the same time, they have be-
come spreaders of inaccurate and misleading information. Ensuring that misconceptions resulting from
misinformation and fake news do not drown out scientific evidence and affect behavior in consequential
ways is of global importance.
In this study, we demonstrate that a low-cost intervention, relying on mobile technology, can be effec-
11tively deployed to reduce agreement with misconceptions about how to prevent COVID-19 infection.
We provide such evidence for a hugely important, while significantly understudied population: the urban
poor, living in overcrowded conditions at great risk of infectious diseases. Design choices are, however,
important. We show that messages from a trusted source can shift beliefs when the messenger and recip-
ient share identity. In our setting, the trusted source of information is a public health specialist (a doctor
from a local and renown institution) and the messenger is a local citizen (closer in socio-economic status)
of the same religion as the respondent. Even under these circumstances, we find that only misconceptions
that have a religious association are shifted, and only when Muslims and Hindus, the two main religions
in our setting, have on average different beliefs.
This study provides important insights into how governments and agencies across the world can rely on
mobile phone messages to counter COVID-19 misconceptions, and improve adherence to policy guide-
lines. While results highlight the importance of shaping messages to the characteristics of individual
citizens, further research is needed to understand how to target communication against misconception in
a more effective way.
References
Akbar, S. Z., Kukreti, D., Sagarika, S., and Pal, J. (2020). Increase in Communal Tone in COVID-19
Fake News in India: Study.
Akerlof, G. A. and Kranton, R. E. (2000). Economics and identity. Quarterly Journal of Economics,
115(3):715–753.
Al Jazeera (2020). ‘Do not buy from Muslims’: BJP leader in India calls for boy-
cott. https://www.aljazeera.com/news/2020/4/29/do-not-buy-from-muslims-bjp-leader-in-india-calls-
for-boycott.
Allcott, H. and Gentzkow, M. (2017). Social media and fake news in the 2016 election. Journal of
Economic Perspectives, 31(2):211–236.
Alsan, M. and Eichmeyer, S. (2021). Experimental Evidence on the Effectiveness of Non-Experts for
Improving Vaccine Demand.
Alsan, M., Garrick, O., and Graziani, G. (2019). Does diversity matter for health? Experimental evidence
from Oakland. American Economic Review, 109(12):4071–4111.
Alsan, M., Stantcheva, S., Yang, D., and Cutler, D. (2020). Disparities in coronavirus 2019 reported in-
cidence, knowledge, and behavior among us adults. JAMA Network Open, 3(6):e2012403–e2012403.
Altonji, J. G. and Pierret, C. R. (2001). Employer learning and statistical discrimination. Quarterly
Journal of Economics, 116(1):313–350.
12Armand, A., Augsburg, B., and Bancalari, A. (2020). COVID-19, fake news and religious tensions:
experimental evidence from India. AEA RCT Registry, October 08. https://doi.org/10.1257/rct.6564-
1.0.
Armand, A., Augsburg, B., and Bancalari, A. (2021). Coordination and the Poor Maintenance Trap: an
Experiment on Public Infrastructure in India. CEPR discussion paper DP16284, Centre for Economic
Policy and Research.
Arnold, D., Dobbie, W., and Yang, C. S. (2018). Racial bias in bail decisions. Quarterly Journal of
Economics, 133(4):1885–1932.
Arya, S. (2020). Muslims face social boycott in Buldhana, business too hit. The Times
of India, https://timesofindia.indiatimes.com/city/nagpur/muslims-face-social-boycott-in-buldhana-
business-too-hit/articleshow/7.
Banaji, S. and Bhat, R. (2020). WhatsApp Vigilantes: An exploration of citizen reception and circulation
of WhatsApp misinformation linked to mob violence in India. LSE Media and Communication, 2:1–
14.
Banerjee, A., Faye, M., Krueger, A., Niehaus, P., and Suri, T. (2020). Effects of a Universal Basic Income
during the pandemic. Technical report, UC San Diego.
Barrera, O., Guriev, S., Henry, E., and Zhuravskaya, E. (2020). Facts, alternative facts, and fact checking
in times of post-truth politics. Journal of Public Economics, 182:104123.
Bavel, J. J., Baicker, K., Boggio, P. S., Capraro, V., Cichocka, A., Cikara, M., Crockett, M. J., Crum,
A. J., Douglas, K. M., Druckman, J. N., Drury, J., Dube, O., Ellemers, N., Finkel, E. J., Fowler, J. H.,
Gelfand, M., Han, S., Haslam, S. A., Jetten, J., Kitayama, S., Mobbs, D., Napper, L. E., Packer, D. J.,
Pennycook, G., Peters, E., Petty, R. E., Rand, D. G., Reicher, S. D., Schnall, S., Shariff, A., Skitka,
L. J., Smith, S. S., Sunstein, C. R., Tabri, N., Tucker, J. A., van der Linden, S., van Lange, P., Weeden,
K. A., Wohl, M. J., Zaki, J., Zion, S. R., and Willer, R. (2020). Using social and behavioural science
to support COVID-19 pandemic response. Nature Human Behaviour, 4(5):460–471.
Bazzi, S., Gaduh, A., Rothenberg, A. D., and Wong, M. (2019). Unity in diversity? How intergroup
contact can foster nation building. American Economic Review, 109(11):3978–4025.
Besley, T., Burgess, R., and Pratt, A. (2002). Mass media and political accountability.
Bhatia, M. (2021). State Violence in India: From Border Killings to the National Register of Citizens
and the Citizenship Amendment Act. In Stealing Time, pages 171–196. Springer.
Bolsen, T. and Druckman, J. N. (2015). Counteracting the Politicization of Science. Journal of Commu-
nication, 65(5):745–769.
13Breza, E., Stanford, F. C., Alsan, M., Alsan, B., Banerjee, A., Chandrasekhar, A. G., Eichmeyer, S.,
Glushko, T., Goldsmith-Pinkham, P., Holland, K., and Others (2021). Effects of a large-scale so-
cial media advertising campaign on holiday travel and COVID-19 infections: a cluster randomized
controlled trial. Nature Medicine, pages 1–7.
Bursztyn, L., Egorov, G., Enikolopov, R., and Petrova, M. (2019). Social Media and Xenophobia:
Evidence from Russia. SSRN Electronic Journal.
Bursztyn, L., Rao, A., Roth, C., and Yanagizawa-Drott, D. (2020). Misinformation During a Pandemic.
Card, D. and Dahl, G. B. (2011). Family violence and football: The effect of unexpected emotional cues
on violent behavior. Quarterly Journal of Economics, 126(1):103–143.
Chan, M. p. S., Jones, C. R., Hall Jamieson, K., and Albarracı́n, D. (2017). Debunking: A Meta-
Analysis of the Psychological Efficacy of Messages Countering Misinformation. Psychological Sci-
ence, 28(11):1531–1546.
Choudhury, C. (2020). Under the BJP’s Big Tent. The Caravan. A Journal of Politics and Culture.
Clayton, K., Davis, J., Hinckley, K., and Horiuchi, Y. (2019). Partisan motivated reasoning and misin-
formation in the media: Is news from ideologically uncongenial sources more suspicious? Japanese
Journal of Political Science, 20(3):129–142.
Dahl, G. and Dellavigna, S. (2009). Does movie violence increase violent crime? Quarterly Journal of
Economics, 124(2):677–734.
Desai, S. and Amarasingam, A. (2020). CoronaJihad: Covid-19, misinformation, and anti-Muslim vio-
lence in India. Technical report, ISD Global.
Ecker, U. K., Lewandowsky, S., and Tang, D. T. (2010). Explicit warnings reduce but do not eliminate
the continued influence of misinformation. Memory and Cognition, 38(8):1087–1100.
Eichengreen, B., Aksoy, C. G., and Saka, O. (2021). Revenge of the experts: Will COVID-19 renew or
diminish public trust in science? Journal of Public Economics, 193:104343.
Farber, H. S. and Gibbons, R. (1996). Learning and wage dynamics. Quarterly Journal of Economics,
111(4):1006–1047.
Gauchat, G. (2012). Politicization of science in the public sphere: A study of public trust in the United
States, 1974 to 2010. American Sociological Review, 77(2):167–187.
Gerber, A. S., Karlan, D., and Bergan, D. (2009). Does the media matter? A field experiment measuring
the effect of newspapers on voting behavior and political opinions. American Economic Journal:
Applied Economics, 1(2):35–52.
14Greenwood, B. N., Carnahan, S., and Huang, L. (2018). Patient–physician gender concordance and
increased mortality among female heart attack patients. Proceedings of the National Academy of
Sciences of the United States of America, 115(34):8569–8574.
Greenwood, B. N., Hardeman, R. R., Huang, L., and Sojourner, A. (2020). Physician-patient racial
concordance and disparities in birthing mortality for newborns. Proceedings of the National Academy
of Sciences of the United States of America, 117(35):21194–21200.
Greyling, C., Maulit, J. A., Parry, S., Robinson, D., Smith, S., Street, A., and Vitillo, R. (2016). Lessons
from the Faith-Driven Response to the West africa Ebola Epidemic.
Habyarimana, J., Humphreys, M., Posner, D. N., and Weinstein, J. M. (2007). Why does ethnic diversity
undermine public goods provision? American Political Science Review, 101(4):709–725.
Hill, A., Jones, D., and Woodworth, L. (2020). Physician-Patient Race-Match and Patient Outcomes.
Himelein, K., Eckman, S., and McKenzie, D. (2020). Mobile Phone Surveys for Understanding COVID-
19 Impacts: Part II Response, Quality, and Questions.
Hindustan Times (2020). Modi calls for unity, says virus doesn’t see religion.
https://www.hindustantimes.com/india-news/modi-calls-for-unity-saysvirus-doesn-t-see-
religion/story-odKsutBpjYQ6hdv5lVWj, New Delhi.
Iyer, S. (2016). The new economics of religion. Journal of Economic Literature, 54(2):395–411.
Jensen, R. and Oster, E. (2009). The power of TV: Cable television and women’s status in India. Quar-
terly Journal of Economics, 124(3):1057–1094.
Kanich, C., Kreibich, C., Levchenko, K., Enright, B., Voelker, G. M., Paxsonf, V., and Savage, S. (2008).
Spamalytics: An empirical analysis of spam marketing conversion. Proceedings of the ACM Confer-
ence on Computer and Communications Security, pages 3–14.
Kearney, M. S. and Levine, P. B. (2015). Media influences on social outcomes: The impact of MTV’s
16 and pregnant on teen childbearing. American Economic Review, 105(12):3597–3632.
Khan, A., Nasim, S., Shaukat, M. I., and Stegmann, A. (2021). Building Trust in the State with Informa-
tion: Evidence from Urban Punjab. Journal of Public Economics.
Kulkarni, S. (2017). RSS-BJP Symbiosis: On the Cusp of Culture and Politics. Prabhat Prakashan, New
Delhi.
La Ferrara, E., Chong, A., and Duryea, S. (2012). Soap operas and fertility: Evidence from Brazil.
American Economic Journal: Applied Economics, 4(4):1–31.
15Lazer, D. M., Baum, M. A., Benkler, Y., Berinsky, A. J., Greenhill, K. M., Menczer, F., Metzger, M. J.,
Nyhan, B., Pennycook, G., Rothschild, D., Schudson, M., Sloman, S. A., Sunstein, C. R., Thorson,
E. A., Watts, D. J., and Zittrain, J. L. (2018). The science of fake news: Addressing fake news requires
a multidisciplinary effort. Science, 359(6380):1094–1096.
Lowe, M. (2021). Types of contact: A field experiment on collaborative and adversarial caste integration.
American Economic Review, 111(6):1807–1844.
McKenzie, D. (2012). Beyond baseline and follow-up: The case for more T in experiments. Journal of
Development Economics, 99(2):210–221.
Menon, S. (2020). Coronavirus: The human cost of fake news in India. BBC News, BBC Reality Check
https://www.bbc.co.uk/news/world-asia-india-53165436.
Mitra, A. and Ray, D. (2014). Implications of an economic theory of conflict: Hindu-Muslim violence
in India. Journal of Political Economy, 122(4):719–765.
Müller, K. and Schwarz, C. (2021). Fanning the Flames of Hate: Social Media and Hate Crime. Journal
of the European Economic Association, 19(4):2131–2167.
O’Keefe, D. J. (2016). Persuasion: Theory and Research. SAGE Publications, Inc, Thousand Oaks, CA,
3 edition.
Olken, B. A. (2009). Do television and radio destroy social capital? Evidence from indonesian villages.
American Economic Journal: Applied Economics, 1(4):1–33.
Paluck, E. L. and Green, D. P. (2009). Deference, dissent, and dispute resolution: An experimental
intervention using mass media to change norms and behavior in Rwanda. American Political Science
Review, 103(4):622–644.
Patel, A. (2020). Preventing COVID-19 Amid Public Health and Urban Planning Failures in Slums of
Indian Cities. World Medical and Health Policy, 12(3):266–273.
Porter, S. R. and Whitcomb, M. E. (2003). The impact of lottery incentives on student survey response
rates. Research in Higher Education, 44(4):389–407.
Purohit, K. (2020). Misinformation, fake news spark India coronavirus fears.
Richardson, M., Dominowska, E., and Ragno, R. (2007). Predicting clicks: Estimating the click-through
rate for new ads. 16th International World Wide Web Conference, WWW2007, pages 521–530.
Sadish, D., Adhvaryu, A., and Nyshadham, A. (2021). (Mis)information and anxiety: Evidence from a
randomized Covid-19 information campaign. Journal of Development Economics, 152(102699).
Scheufele, D. A. and Krause, N. M. (2019). Science audiences, misinformation, and fake news. Pro-
ceedings of the National Academy of Sciences of the United States of America, 116(16):7662–7669.
16Silver, L. and Huang, C. (2019). Smartphone, Social Media Users Have Broader Social Networks In
Emerging Economies.
Statista (2021). Main sources of news across India in 2019, by age.
Strömberg, D. (2004). Mass media competition, political competition, and public policy. Review of
Economic Studies, 71(1):265–284.
The Economic Times (2020). COVID-19 fallout makes Indian philosophy of ’Vasudhaiva Kutumbakam’
more relevant. https://m.economictimes.com/news/politics-and-nation/covid-19-fallout-makes-indi.
Torres, C., Ogbu-Nwobodo, L., Alsan, M., Stanford, F. C., Banerjee, A., Breza, E., Chandrasekhar,
A. G., Eichmeyer, S., Karnani, M., Loisel, T., Goldsmith-Pinkham, P., Olken, B. A., Vautrey, P. L.,
Warner, E., and Duflo, E. (2021). Effect of Physician-Delivered COVID-19 Public Health Messages
and Messages Acknowledging Racial Inequity on Black and White Adults’ Knowledge, Beliefs, and
Practices Related to COVID-19: A Randomized Clinical Trial. JAMA Network Open, 4(7):e2117115–
e2117115.
van der Linden, S., Leiserowitz, A., Rosenthal, S., and Maibach, E. (2017). Inoculating the Public against
Misinformation about Climate Change. Global Challenges, 1(2):1600008.
Vicario, M. D., Bessi, A., Zollo, F., Petroni, F., Scala, A., Caldarelli, G., Stanley, H. E., and Quattro-
ciocchi, W. (2016). The spreading of misinformation online. Proceedings of the National Academy of
Sciences of the United States of America, 113(3):554–559.
Wasdani, K. P. and Prasad, A. (2020). The impossibility of social distancing among the urban poor: the
case of an Indian slum in the times of COVID-19. Local Environment, 25(5):414–418.
World Bank (2020). World Development Indicators. Technical report.
World Health Organisation (2020). COVID-19 Response. Seventy-third world health assembly
(a73.conf./1 rev. 1), World Health Organization.
17Figure 1: Agreement with misconceptions, by religion and over time
A. Eating vegetarian B. Indian immune system C. Warm weather D. Disease of rich people
.7 .7 .7 .7
.6 .6 .6 .6
.5 .5 .5 .5
18
.4 .4 .4 .4
.3 .3 .3 .3
Jun-Jul 20 Oct-Nov 20 Dec-Jan 21 Jun-Jul 20 Oct-Nov 20 Dec-Jan 21 Jun-Jul 20 Oct-Nov 20 Dec-Jan 21 Jun-Jul 20 Oct-Nov 20 Dec-Jan 21
Hindu Muslim
Notes. This figure shows the trends in outcome variables over time by respondents religion for those in the control group. Each outcome variable indicates the respondent’s level of agreement with
the following misconceptions (from left to right): A. Eating vegetarian: ‘Eating vegetarian is a way to prevent COVID-19’; B. Indian immune system: ‘Indians having stronger immunity to prevent
COVID-19’; C. Warm weather: ‘Living in warm weather protects from COVID-19 because the virus does not survive’; D. Disease of rich people: ‘Coronavirus is a disease of rich people, so poor
people are safe’. Each outcome is measured using likert scale where 1 refers to strongly disagree and 5 refers to strongly agree, and the responses plotted are the mean of normalized values. The
sample is restricted to the control group. Lines in blue and red refer to Hindu and Muslim respectively.Figure 2: Agreement with religion-related misconceptions, over time
Panel A - Statement said by ‘people’, Hindu versus Muslim
A. Eating vegetarian B. Good person C. Unity & brotherhood D. Religious gatherings
.7 .7 .7
.7
.6 .6 .6
.6
.5 .5 .5
.5
.4
.4 .4 .4
.3
.3 .3 .3
Jun-Jul 20 Oct-Nov 20 Dec-Jan 21 Jun-Jul 20 Oct-Nov 20 Dec-Jan 21 Jun-Jul 20 Oct-Nov 20 Dec-Jan 21 Jun-Jul 20 Oct-Nov 20 Dec-Jan 21
Hindu Muslim
Panel B - Statement said by someone of own versus other religion, versus ‘people’
.7 .7 .7 .7
19
.6 .6 .6 .6
.5 .5 .5 .5
.4 .4 .4 .4
.3 .3 .3 .3
Jun-Jul 20 Oct-Nov 20 Dec-Jan 21 Jun-Jul 20 Oct-Nov 20 Dec-Jan 21 Jun-Jul 20 Oct-Nov 20 Dec-Jan 21 Jun-Jul 20 Oct-Nov 20 Dec-Jan 21
own other people
Notes. This figure shows the trends in outcome variables over time by respondents religion for those in control group. Each outcome variable indicates respondent’s level of agreement with
the following misconceptions (from left to right) among citizens, as said by someone of the same religion (Panel A) and of a different religion (Panel B): A. Eating vegetarian: ‘If you are
vegetarian, you do not need to worry about the coronavirus’; B. Good person: ‘If you are a good person you do not need to worry about the coronavirus’; C. Unity & brotherhood: ‘Unity and
brotherhood will help us fight the coronavirus’; D. Religious gatherings: ‘Religious gatherings should be allowed’. Each outcome is measured using likert scale where 1 refers to strongly
disagree and 5 refers to strongly agree, and the responses plotted are the mean of normalized values. The sample is restricted to the control group. Lines in blue and red refer to Hindu and
Muslim respectively.Table 1: Effect on agreement with misconception about ways to prevent COVID-19
Eating Indian Warm Disease
vegetarian immune system weather of rich people
(1) (2) (3) (4)
Panel A
Doctor message 0.002 -0.007 -0.004 -0.003
(0.006) (0.005) (0.006) (0.006)
[0.798; 0.797] [0.126; 0.423] [0.486; 0.867] [0.646; 0.873]
Mean (Control message) 0.563 0.661 0.471 0.352
Observations 7692 7697 7681 7676
Slums 142 142 142 142
Observation rounds 2 2 2 2
Panel B
Religion concordance -0.016 -0.001 -0.006 -0.013
(0.008) (0.007) (0.009) (0.009)
[0.044; 0.156] [0.850; 0.863] [0.526; 0.758] [0.172; 0.758]
Mean (Other religion) 0.571 0.654 0.470 0.355
Observations 3846 3849 3842 3839
Slums 142 142 142 142
Observation rounds 2 2 2 2
Notes. Estimates based on OLS regressions using Equation (1). Panel B restricts the sample to participants allocated to the doctor message.
Standard errors clustered at the slum level are reported in parentheses. P-values are presented in brackets, the first from individual testing, the
second adjusting for testing that each treatment is jointly different from zero for all outcomes presented in the table, separate for Panels A and
B. Dependent variables by column indicate respondent’s level of agreement with the following misconceptions: (1) Eating vegetarian: ‘Eating
vegetarian is a way to prevent COVID-19’; (2) Indian immune system: ‘Indians have stronger immunity to prevent COVID-19’; (3) Warm
weather: ‘Living in warm weather protects from COVID-19 because the virus does not survive’; (4) Disease of rich people: ‘Coronavirus is a
disease of rich people, so poor people are safe’. Measured using likert scale where 1 refers to strongly disagree and 5 refers to strongly agree,
and the responses are normalized in the analysis. All specifications include indicator variables for data collection rounds, and strata indicators
(city and religion of respondent). Differences in observations across columns are due to unit non-response.
20You can also read