A risk assessment of threats to Maui's dolphins - Rohan J.C. Currey, Laura J. Boren, Ben R. Sharp and Dean Peterson - Department ...
←
→
Page content transcription
If your browser does not render page correctly, please read the page content below
A risk assessment of threats
to Maui’s dolphins
Rohan J.C. Currey, Laura J. Boren, Ben R. Sharp and
Dean Peterson
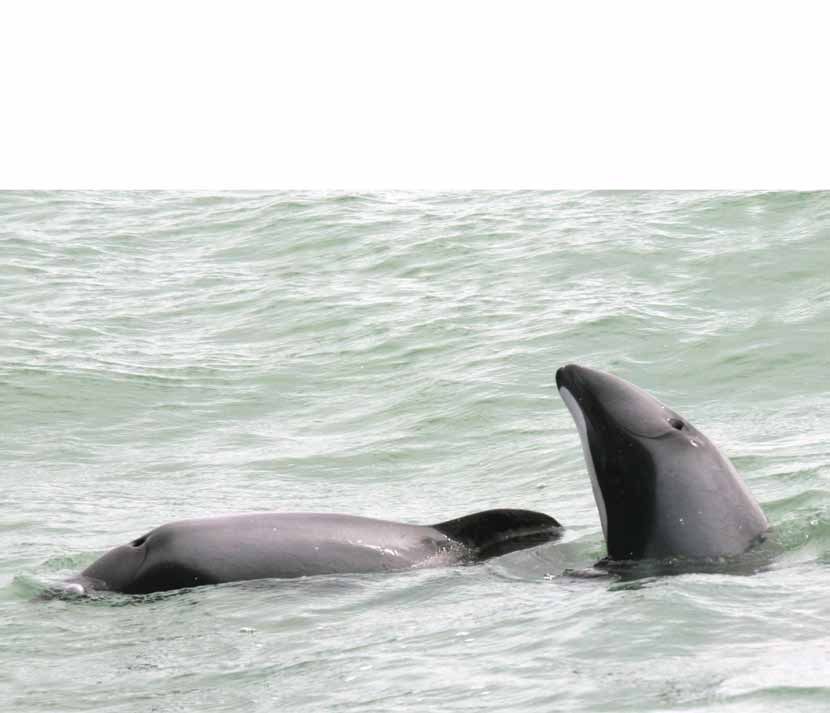
Cover: Maui’s dolphins, 2011. Photo: R.M. Hamner, Oregon State University Marine Mammal Institute.

© Copyright September 2012, New Zealand Ministry for Primary Industries and Department of Conservation.

This report was prepared for publication by the Publishing Team, Department of Conservation, Wellington, New Zealand. It may
be cited as: Currey, R.J.C.; Boren, L.J.; Sharp, B.R.; Peterson, D. 2012: A risk assessment of threats to Maui’s dolphins. Ministry for
Primary Industries and Department of Conservation, Wellington. 51 p.

In the interest of forest conservation, we support paperless electronic publishing.
Contents

Summary		                                                                                    1

1.   Introduction                                                                           2

     1.1     Purpose		                                                                       2
     1.2     Background                                                                      2
     1.3     Threats 		                                                                      3
     1.4     Risk assessment                                                                 4
     1.5     A risk assessment for Maui’s dolphins                                           5

2.   Methods                                                                                6

     2.1     Risk assessment workshop                                                        6
     2.2     Defining Maui’s dolphin spatial distribution                                    6
     2.3     Threat identification                                                           8
     2.4     Threat characterisation                                                         8
     2.5     Threat scoring                                                                  8
     2.6     Quantitative analysis                                                          11

3.   Results                                                                                13

     3.1	Estimated mortality                                                                13
     3.2     Population level impact                                                        15
     3.3     Spatial distribution                                                           16

4.   Discussion                                                                             19

     4.1     Risk assessment for Maui’s dolphins                                            19
     4.2     Application of the semi-quantitative methodology                               20
     4.3     Possible improvements for future risk assessments                              22
     4.4     Implications for the Maui’s dolphin population                                 23

5.   Conclusions                                                                            24

6.   Acknowledgements                                                                       25

7.   References                                                                             25

Appendix 1

     The Potential Biological Removal (PBR) and probability of decline for Maui’s dolphin   28

Appendix 2

     Maui’s dolphin distribution and fishing effort                                         33

Appendix 3

     Maui’s dolphin threat scoring                                                          50
A risk assessment of threats to
Maui’s dolphins
Rohan J.C. Currey1, Laura J. Boren2, Ben R. Sharp1 and Dean Peterson3
1Ministry for Primary Industries, PO Box 2526, Wellington 6140, New Zealand
Email: rohan.currey@mpi.govt.nz
2 Department of Conservation, PO Box 10420, Wellington 6143, New Zealand
Email: lboren@doc.govt.nz
3 The Royal Society of New Zealand, PO Box 598, Wellington 6140, New Zealand, New Zealand
Summary
Maui’s dolphin (Cephalorhynchus hectori maui) is a subspecies of Hector’s and Maui’s dolphin
(Cephalorhynchus hectori) and is endemic to New Zealand. Maui’s dolphin is listed as ‘critically
endangered’ on the IUCN’s Red List of threatened species and ‘nationally critical’ in the
New Zealand Threat Classification System. Current population estimates indicate that about
55 Maui’s dolphins over 1 year of age remain, and the population is exposed to a range of human-
and non-human-induced threats. A risk assessment workshop was held in June 2012 with the
purpose of identifying, analysing and evaluating all threats to Maui’s dolphins. The risk assessment
scoring was conducted by an expert panel of domestic and international specialists in marine
mammal science and ecological risk assessment. The method for the risk assessment involved
five key steps: defining Maui’s dolphin distribution, threat identification, threat characterisation
including the spatial distribution of the threat, threat scoring, and quantitative analysis.
The panel’s scores combined for all identified threats suggested a broad range of plausible values
for human-induced Maui’s dolphin mortalities over the next 5 years (a median of 5.27 dolphins
per annum with 95% of the distribution of scores being between 0.97 and 8.40 dolphins per
annum). The panel attributed 95.5% of these mortalities to commercial, recreational, customary
or illegal fishing-related activities combined, and the remaining 4.5% to non-fishing-related
threats.
Despite this uncertainty, the panel’s scores indicate high confidence that total human-induced
mortality is higher than the population can sustain. Population projections based on the panel’s
estimated total mortalities indicate a 95.7% likelihood that the population will decline if threats
remain at current levels (i.e. as at the time of the workshop and prior to the introduction of interim
measures). Estimated total human-induced Maui’s dolphin mortalities equate to a level of impact
that is many times higher than the estimated Potential Biological Removals (PBR; a median of
75.5 times PBR, with 95% of the distribution of estimates being between 12.4 and 150.7 times PBR).
The risk assessment method assessed the cumulative impact and associated population risk posed
by all threats combined and also disaggregated the impacts of the respective threats, to identify
those threats that pose the greatest risk to the dolphins. It also identified several threats that may
have a low likelihood, but which, given the small population size of Maui’s dolphins, nonetheless
may have detrimental consequences for the population.
Keywords: Maui’s dolphin, Cephalorhynchus hectori maui, risk assessment, potential biological
removal, risk ratio, cumulative impacts
© Copyright September 2012, Ministry for Primary Industries and Department of Conservation. This report may
be cited as: Currey, R.J.C.; Boren, L.J.; Sharp, B.R.; Peterson, D. 2012: A risk assessment of threats to Maui’s
dolphins. Ministry for Primary Industries and Department of Conservation, Wellington. 51 p.
Risk assessment of threats to Maui’s dolphins 11. Introduction
1.1 Purpose
In order to manage human-induced threats to Hector’s and Maui’s dolphins (Cephalorhynchus
hectori), the Department of Conservation (DOC) and the then Ministry of Fisheries (MFish—now
Ministry for Primary Industries, MPI) jointly developed and consulted on the Hector’s and Maui’s
dolphin Threat Management Plan (TMP) (MFish & DOC 2007). DOC and MPI had agreed to
review the TMP in 2013; however, the Minister for Conservation and the Minister for Primary
Industries agreed that, in light of new information, the review of the Maui’s portion of the TMP
should be brought forward. This risk assessment provides an evaluation of the risks posed to
Maui’s dolphin to support the review of the TMP.
1.2 Background
More than 50 species or subspecies of marine mammals are found in New Zealand’s EEZ (Perrin
et al. 2008). Among these are the endemic Hector’s and Maui’s dolphins. Both are protected
under the New Zealand Marine Mammals Protection Act (1978). The Hector’s subspecies is listed
as ‘endangered’ on the International Union for the Conservation of Nature’s (IUCN’s) Red List
of threatened species, and as ‘nationally endangered’ in the New Zealand Threat Classification
System. The Maui’s subspecies is listed as ‘critically endangered’ by the IUCN and as ‘nationally
critical’ in the New Zealand System (Reeves et al. 2000; Baker et al. 2010).
Maui’s dolphin (Cephalorhynchus hectori maui) is a subspecies of Hector’s and Maui’s dolphin1
which is one of 93 species in the order that contains whales, dolphins and porpoises (cetaceans)
(Jefferson et al. 1993). There are currently only 44 named subspecies in this group. Only two
species or subspecies of cetacean are listed as ‘critically endangered’ on the IUCN Red List (IUCN
2009). These are the vaquita, or Gulf of California porpoise (Phocoena sinus), which is a full species
of porpoise with just over 200 individuals remaining (Gerrodette et al. 2011), and Maui’s dolphin,
which now has approximately 55 individuals over 1 year of age remaining (95% CI: 48–69;
Hamner et al. 2012a). In the recent past, three species or subspecies were listed as critically
endangered; however, the baiji, or Chinese river dolphin (Lipotes vexillifer), was recently declared
extinct due to human-related mortality (Turvey et al. 2007). About 40 baiji were known to be
alive in 1998, but none were found during an extensive survey in 2006 (Turvey et al. 2007).
Their disappearance indicates that species with populations at low levels can become extinct over
relatively short periods of time.
Maui’s dolphin is a small coastal dolphin. Maui’s dolphins feed opportunistically, both at
the bottom and throughout the water column, and have been reported to feed on a variety of
species of fish (Miller et al. in press). Some diet variation has been observed between different
populations of Hector’s dolphins, and the evidence from Maui’s dolphins is consistent with that
of Hector’s dolphins; i.e. red cod (Pseudophycis bachus) and āhuru (Auchenoceros punctatus)
are important in their diet, along with sole (Peltorhamphus sp.) (Miller et al. in press). Maui’s
dolphins are typically found in small groups (average group size 4.7; Oremus et al. in press).
Fewer dolphins are sighted in winter and the groups tend to be more dispersed than in summer
(Rayment et al. 2006). The dolphins have relatively small ranges along the coastline (average
distance approx. 35 km), although movements of up to 80 km have been recorded for some
individuals (Oremus et al. in press).
1 In this document, ‘Hector’s dolphin(s)’ refers to the South Island subspecies (Cephalorhynchus hectori hectori), while ‘Maui’s dolphin(s)’
refers to the North Island subspecies (C. hectori maui). ‘Hector’s and Maui’s dolphins’ refers to both subspecies collectively (C. hectori).
This approach is taken to avoid confusion and enable distinction between the South Island subspecies and the species as a whole.
2 Risk assessment of threats to Maui’s dolphinsThe life history of Maui’s dolphins makes them particularly susceptible to population decline
arising from human impacts. Hector’s and Maui’s dolphins have a short lifespan for a cetacean,
with the oldest recorded individual living to 22 years of age (Rayment et al. 2009). The dolphins
mature relatively late, with females becoming sexually mature at 7–9 years of age (Slooten 1991),
and they are slow breeders, giving birth to a single calf every 2 to 4 years (Dawson 2008). The
resulting low reproductive rate makes them less resilient to impacts arising from anthropogenic
threats, and susceptible to population decline. Assuming that Maui’s dolphins survive and
reproduce at rates similar to their South Island counterparts, a maximum growth of 1.8–4.9% per
year can be expected, although 1.8% was deemed the most plausible ‘best case’ scenario (Slooten
& Lad 1991). Thus, a population of 55 could be expected to add only about 1 individual each year
on average. Recent capture recapture analysis indicates that the population is in decline, with a
survival rate of 84% (95% Confidence Interval (CI): 75–90%) and a rate of population decline
of 2.8% per year (95% CI: 10.5% decline to 5.6% increase; Hamner et al. 2012a). However, this
growth rate reflects trends between 2001 and 2011 that may not fully reflect population-level
effects of management measures put in place in 20082. The confidence intervals reflect statistical
uncertainty, but do not necessarily equate to plausible biological bounds.
A revised estimate of potential biological removal (PBR) was calculated in 2012 for Maui’s
dolphins (see Appendix 1). The PBR is the maximum human-induced mortality that can be
sustained by a marine mammal population without preventing that population from reaching or
maintaining a population level above their maximum net productivity level with high certainty
(Wade 1998). One of the key parameters in the estimation of PBR is Rmax, which is defined
as the maximum net productivity rate of the population at a small size (i.e. unconstrained by
density-dependent factors). The net productivity (or population growth rate) is the annual per
capita rate of increase resulting from additions due to reproduction, minus losses due to natural
mortality (Wade 1998). Depending on the value used for Rmax3, the estimated PBR for Maui’s
dolphins ranges from one dolphin per 10 years to one dolphin per 23 years; this implies that
Maui’s dolphins can sustain only one human-induced mortality every 10 to 23 years without
compromising their ability to reach or maintain (with high certainty) a population level above
their maximum net productivity level (see Appendix 1).
1.3 Threats
Threats are defined as any extrinsic factor or activity that may negatively affect the Maui’s
dolphin population, either by killing individual dolphins, i.e. direct threats, or by changing their
population characteristics (e.g. resulting in reduced reproductive output), i.e. indirect threats. The
actual level of the effect arising from a threat is referred to as the impact; in this context, easily
expressed in numbers of dolphin deaths (or equivalent dolphin deaths, for indirect threats) per
annum. Population-level risk is a function of impact and depends on the inherent biological or
population-level characteristics of that population.
Maui’s dolphins are exposed to a range of potential threats, both human- and non-human-
induced. The non-human-induced threats include naturally occurring causes of mortality such as
parasites, disease, predation, extreme weather events and small population effects (MFish & DOC
2007). The intrinsic rate of population increase (Rmax) accounts for non-human-induced (natural)
mortality such that, in the absence of other (human-induced) mortality, a population unaffected by
density-dependent limits to growth could still be expected to increase at the estimated maximum
population growth rate (Rmax). Therefore, when trying to determine causes of population decline,
2 For more details on the history of management measures refer to the Maui’s dolphin Threat Management Plan 2012: MPI & DOC 2012.
3 PBR calculated with Rmax of 0.04 (the default value recommended for dolphin populations by Wade (1998)) results in an estimate of 1
dolphin in 10 years. The PBR with Rmax of 0.018 (the value calculated for Hector’s dolphins by Slooten & Lad (1991)) results in an estimate
of 1 dolphin in 23 years.
Risk assessment of threats to Maui’s dolphins 3the focus is on human-induced threats and their impact on population growth. In this context,
the relative risk posed by specific threats is a function of the estimated level of impact, modified
by inherent biological and population level considerations. Impact levels are estimated for each
threat as a function of the spatial scale of the threatening activity, the intensity of the activity, and
the vulnerability of Maui’s dolphins to that particular threat.
Human-induced threats include fishing activities, tourism, petroleum and mineral exploration
and mining, and coastal development. Each of these activities has the ability to affect the
population directly or indirectly (see Wade et al. 2012).
Direct impacts are those that affect the survival of individuals directly from the activity itself
(e.g. bycatch in fishing operations, physical trauma from use of seismic airguns, boat strike). These
include direct mortality, but can also include physical trauma or injury that is a direct result of the
activity.
Indirect impacts are those that affect the longer-term survival or the reproductive ability of the
population and which result indirectly from the activity (e.g. compromised health, poor nutrition
from reduced food availability, masking of biologically important behaviours, or displacement
from an area). Indirect effects can result in mortality, but not as a direct result of the activity;
rather, the mortality may occur much later through reduced fitness or reduced prey availability, or
displacement to suboptimal habitat.
1.4 Risk assessment
When decisions need to be made about the management of natural resources, including
populations of protected species, managers responsible for such decisions are generally forced to
rely upon sparse data subject to considerable uncertainty. Ecological Risk Assessments (ERAs)
provide a systematic framework for evaluating the potential implications of different management
decisions when information is sparse, incomplete or uncertain (Burgman et al. 1993). Broadly
speaking, the challenge of any risk assessment is to assemble whatever relevant knowledge is
available—whether quantitative or qualitative, objective or subjective—and devise a means to
utilise that knowledge in the most rigorous and objective way possible to estimate the likely
consequences of actual or potential actions, while maintaining transparency about the requisite
assumptions and inputs, and associated uncertainty.
Discussion of the risk assessment process is often fraught with confusion arising from vague and
inconsistent use of language, and the term ‘risk assessment’ is commonly applied to a wide range
of loosely related analytic approaches. It is important to distinguish clearly between different risk
assessment approaches and to select the most appropriate approach for a particular management
problem, and to be clear about that selection and its implications, taking special care to define
the operative terms. The scoring framework can be qualitative, semi-quantitative, quantitative or
‘model-based’ (Hobday et al. 2007).
In the most common risk assessment approach, risk is calculated as a product of the expected
likelihood and expected consequence of an ‘event’ (i.e. occurrence of the threat or activity in
question), combined and assigned a numerical score in a ‘likelihood-consequence matrix’.
Commonly used qualitative models score various attributes, such as likelihood and consequence,
as being low, medium or high. Another example is the SICA method, which scores Scale, Intensity
and Consequence in a range from negligible to extreme (Hobday et al. 2007). However, with
its emphasis on discrete low-frequency events, the likelihood-consequence approach is not
ideally suited for the assessment of risks arising from activities that are predictable, ongoing
and cumulative, such as the environmental effects of fishing. In particular, both ‘likelihood’ and
‘consequence’ are unavoidably scale-dependent in both time and space, and there is generally a
mismatch between the scales at which individual fishing ‘events’ occur and the scales at which
the ecological consequences become manifest in ways that are relevant for management. At these
4 Risk assessment of threats to Maui’s dolphinslonger and larger scales, the assessed ‘events’ are certain and multiply, such that risk is a function
not of their individual likelihood and consequence, but of their cumulative impact, for which an
alternate ‘exposure-effects’ ERA approach is more suited (e.g. Sharp et al. 2009).
The ‘exposure-effects’ approach to risk assessment is designed to estimate risks associated
with threats that are measurable and ongoing (see US EPA 1992, 1998). Because the impacts
associated with those threats are generally not well-known, a two-stage assessment process is
required: an impact assessment to estimate the level of the effect associated with each threat, then
an evaluation of the associated ecological or population-level consequence (i.e. risk). Because
the relationship between impact and risk is affected by the specific biological or population
characteristics of the organism in question, this latter stage is best informed by specialist
knowledge or population modelling, or may benefit from reference to established benchmarks for
evaluating the consequences of impacts at different levels (e.g. PBR for marine mammals).
1.5 A risk assessment for Maui’s dolphins
To inform the development of the Maui’s dolphin component of the TMP review, all new
information on Maui’s dolphin biology and potential threats was evaluated and incorporated in
a risk assessment workshop process. The purpose of the workshop was to identify, analyse and
evaluate all threats to Maui’s dolphins and estimate the level of impact and corresponding risk posed
by these threats, individually and collectively, to the achievement of management objectives
(see MFish & DOC 2007; MPI & DOC 2012). A semi-quantitative risk assessment method consistent
with the ‘exposure-effects’ approach was chosen for this exercise. In the absence of reliable
quantitative information from which to estimate impacts on Maui’s dolphins arising from different
threats in a systematic way, an expert panel considered available data and characterised the nature
of each threat, then used their expert judgement to assess the associated impact, but expressed each
estimate on a quantitative scale (i.e. dolphin deaths or equivalent dolphin deaths per annum).
An advantage of this approach is that the resulting semi-quantitative impact estimates are
expressed on a common scale and are additive for all threats, and the corresponding combined
population-level consequences can be expressed quantitatively and compared with empirical
estimates. The risk assessment method did not conflate uncertainty with risk; rather, each expert
was asked to represent their own estimated uncertainty for each impact score, by defining a
triangular distribution (i.e. most likely level of impact plus upper and lower bounds).
All threat characterisations included a spatially explicit characterisation of risk by visually and
mathematically representing in a Geographic Information System (GIS) the spatial overlap of
the threat (e.g. spatial fishing effort distribution) and the affected population (i.e. the spatial
dolphin distribution; see below). As a consequence, even estimates of impacts made by expert
judgement could be subsequently disaggregated in space using available spatial data. This allows,
for example, the generation of testable hypotheses about levels of impact occurring in particular
areas and prediction of the extent to which impact and risk might be reduced using different
management measures.
Finally, the outputs of this method are amenable to incremental improvement, such that if reliable
quantitative estimates of impact for particular threats become available in the future (e.g. by
the acquisition of fisheries observer data to estimate capture rates in particular fisheries), then
empirically derived impact estimates can replace the expert-derived estimates for that threat
without the need to repeat the risk assessment exercise for all threats.
This report summarises the methodology applied and the results of the risk assessment
workshop. Note that the focus of the workshop and of this report is risk assessment, not risk
management. Management objectives, recommended management measures informed by the
outcomes of this workshop and report, and future research priorities are proposed in the Maui’s
dolphin Threat Management Plan (MPI & DOC 2012)4.
4 The Maui’s dolphin Threat Management Plan 2012 will be available at www.mpi.govt.nz and www.doc.govt.nz
Risk assessment of threats to Maui’s dolphins 52. Methods
2.1 Risk assessment workshop
A risk assessment workshop was held in Wellington, New Zealand on 12–13 June 2012. The
workshop was facilitated by scientists from the Royal Society of New Zealand, MPI and DOC.
The risk assessment scoring was conducted by an expert panel (the panel) comprising domestic
and international specialists in marine mammal science and ecological risk assessment. The
panellists were selected to ensure a broad range of scientific expertise was represented, including
specialists in marine mammal acoustics, ecology, genetics, population biology and taxonomy, as
well as ecological risk assessment methodology and its application to fisheries. Representatives
(stakeholders) from a range of sectors, including central and local government, environmental
NGOs, the fishing industry, the mining industry and iwi, were present to inform the risk
assessment scoring by the panel and to ensure transparency in the workshop process.
The workshop began with invited presentations on Hector’s and Maui’s dolphin biology, including
their diet, foraging ecology, demography, population genetics and distribution5. Following
the presentations, there was directed discussion to produce an agreed map of Maui’s dolphin
distribution (Fig. 1). This was followed by discussion of risk assessment methodology and then the
risk assessment took place.
The method for the risk assessment involved five key steps:
•• Defining Maui’s dolphin spatial distribution.
•• Threat identification.
•• Threat characterisation.
•• Threat scoring.
•• Quantitative analysis.
The risk assessment steps will be discussed consecutively under these headings below. Analysis of
cumulative risk combined for all threats was completed by the authors of this report subsequent to
the workshop.
2.2 Defining Maui’s dolphin spatial distribution
The map of Maui’s dolphin6 distribution was developed from a combination of empirical evidence
and expert judgment (Fig. 1, see Appendix 2 for details). Sighting data, from various systematic
surveys of Maui’s dolphins off the west coast of the North Island (Ferreira & Roberts 2003;
Slooten et al. 2005; Scali 2006; Rayment & du Fresne 2007; Childerhouse et al. 2008; Stanley
2009; Hamner et al. 2012a), were modelled to estimate the probability that a dolphin would be
seen at a given point, averaged over time. The panel agreed that certain aspects of the resulting
modelled distribution did not accurately reflect Maui’s dolphin distribution due to limitations
5 Assoc. Prof. Liz Slooten (University of Otago) presented a primer on the biology of Hector’s and Maui’s dolphins, including information on
diet, foraging ecology and maximum population growth rate. Rebecca Hamner (Oregon State University) presented the recent estimate of
Maui’s dolphin abundance (Hamner et al. 2012a) as well as the genetic test results of two recent beachcast dolphins. Dr Finlay Thompson
(Dragonfly Science) presented analysis of Maui’s dolphin distribution and fishing effort to provide spatial distribution layers for the spatial
assessment of risk (Appendix 2).
6 The map of the distribution of Maui’s dolphins was produced using a number of information sources, including sightings from aerial and
boat surveys, public observations, and expert judgement. The subspecies identity of many of the sightings was unable to be confirmed.
While Hector’s dolphins have been detected off the North Island West Coast, they are likely to represent a relatively small proportion of the
total sightings used to generate the distribution, as they comprised just 4 of the 91 animals that have been genetically sampled within the
area of the agreed distribution since 2001. Given that the proportion of Hector’s dolphins is likely to be small, the expert panel agreed to
proceed with the map produced on the basis that it provided the best estimate of Maui’s dolphin distribution available.
6 Risk assessment of threats to Maui’s dolphinsMaui density, dolphins per square nautical mile
0.003
0.0025
0.002
0.0015
0.001
0.0005
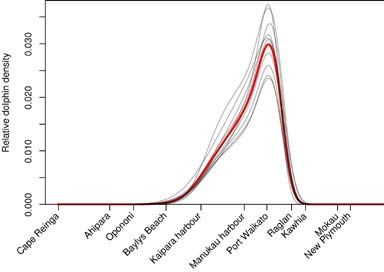
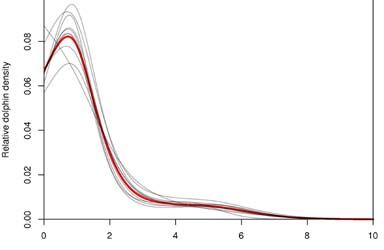
Figure 1. Maui’s dolphin distribution as agreed by the expert panel. It was created mostly from the sightings and effort data
from nine aerial and biopsy surveys conducted between 2000 and 2012. The distribution has been normalised to one, and so
the colours represent the proportion of the dolphin population in each square nautical mile (see Appendix 2 for details). The
grey outline marks the extent of the Marine Mammal Sanctuary, including the proposed southern extension.
arising from unequal survey effort, differences in sighting probability in close to shore and
differences in survey methodology. Accordingly, the panel agreed that the modelled distribution
should be modified to alter the shape of the offshore distribution function and extend the
alongshore range further south (see Appendix 2 for details).
Risk assessment of threats to Maui’s dolphins 72.3 Threat identification
The next step in the risk assessment process was to compile a list of possible threats to Maui’s
dolphins. The panel worked from a list assembled for the Hector’s and Maui’s dolphin Threat
Management Plan (MFish & DOC 2007) with the addition of tidal power generation. Given that
the list of threats was originally developed 6 years ago, and includes threats to both Hector’s and
Maui’s dolphins, the list was presented to the panel to be revised based on the applicability of each
threat to Maui’s dolphins. The updated list of threats (Table 1), as agreed by the panel with input
from stakeholders, then formed the basis of the risk assessment.
2.4 Threat characterisation
The threat characterisation involved initial prioritisation of the threats to be included in the
risk assessment followed by a description of the nature of the risk posed to the population.
Based on the term of the previous Hector’s and Maui’s dolphin threat management plan, the
risk assessment was time bounded to include threats that were assessed as likely to affect
population trends within the next 5 years (Table 1). Threats for which no plausible effect on
population trend was anticipated in the next 5 years (either because the threat was unlikely to
affect population trends, or was unlikely to be present or occur within the next 5 years) were
eliminated from further consideration. The panel undertook an evaluation of whether each threat
met this criterion, taking into account feedback from stakeholders. Where a consensus was
not achieved among the members of the panel, the threat was included among those subject to
further consideration. As a consequence, threats that were poorly understood underwent scoring
to ensure their potential impact was still considered and that the level of uncertainty around this
threat could be quantified. From this process the expert panel identified 23 threats and eliminated
24 others from further consideration (Table 1).
The 23 threats evaluated by the panel as relevant for Maui’s dolphins and with the potential
to affect population trends in the next 5 years were then characterised to document the nature
of the risk posed to the population. This included qualitative characterisation to identify, for
example, the mechanism by which the threat could affect Maui’s dolphins; whether the impact
is direct, via removals from the population, or indirect, involving a longer-term reduction in
survival or fecundity; and the specific component(s) of the population affected (e.g. fecundity,
juvenile survival, or adult survival). Each characterisation also involved the use of available
spatial data to examine (either visually or, where data to characterise threats was available as
spatially comprehensive data layers, mathematically) the spatial overlap between the threat and
the dolphin distribution produced in step 1. These spatial overlap maps were valuable during
the threat scoring process to provide context for the expert panel regarding the actual intensity
of threat exposure experienced by the dolphins, and will also provide a valuable resource for
informing evaluation of the effects of alternate spatial risk management options.
The threat characterisation was compiled in summary form and provided to the panel for
discussion. Once a consensus was reached, the resulting table (Table 2) was used as the basis for
risk assessment scoring.
2.5 Threat scoring
Following the threat characterisation, each threat evaluated by the panel as relevant for Maui’s
dolphins and likely to affect population trends in the next 5 years was scored. Members of the
panel were asked to assess the population-level impact from each of the identified threats to Maui’s
dolphins over the next 5 years. After discussion, the panellists agreed that the best approach would
be to express estimated impact levels in terms of the expected number of Maui’s dolphin mortalities
(or equivalent mortalities for indirect threats) per year associated with each threat.
8 Risk assessment of threats to Maui’s dolphinsTa b l e 1 . A l i s t o f t h e t h re a t s t o H e c t o r ’s a n d M a u i ’s d o l p h i n s . T h re a t s w e re e v a l u a t e d b y t h e
p a n e l t o a s s e s s w h e t h e r t h e y w e re a p p l i c a b l e t o M a u i ’s d o l p h i n s a n d , i f s o , w h e t h e r t h e y w e re
l i k e l y t o a ff e c t p o p u l a t i o n t re n d s w i t h i n t h e n e x t 5 y e a r s .
Threat Class Threat Applicable to Likely to affect
Maui's dolphins? population trends
within next
5 years?
Fishing
Commercial trawl Yes Yes
Commercial setnet Yes Yes
Commercial driftnet No N/A
Recreational setnet Yes Yes
Recreational driftnet Yes Yes
Customary setnets Yes Yes
Craypot entanglement No N/A
Trophic effects Yes Yes
Vessel noise: displacement, Yes Yes
sonar
Shellfish farming Displacement Yes No
Pollution Yes No
Finfish farming Displacement Yes No
Pollution Yes No
Entanglement Yes No
Tourism Boat strike Yes No
Noise Yes No
Disturbance Yes No
Displacement Yes No
Vessel traffic Boat strike Yes Yes
Disturbance Yes Yes
Pollution
Agricultural run-off Yes Yes
Industrial run-off Yes Yes
Plastics Yes Yes
Oil spills Yes Yes
Trophic effects Yes Yes
Sewage and stormwater Yes Yes
Coastal development Marinas, ports No N/A
Displacement, noise, pollution, Yes No
sedimentation
Wave power generation Yes No
Tidal power generation Yes No
Disease Natural Yes Yes
Stress-induced Yes Yes
Domestic animal vectors Yes Yes
Small population effects Stochastic and Allee effects* Yes Yes
Mining and oil activities Noise (non-trauma) Yes Yes
Noise (trauma) Yes Yes
Pollution (discharge) Yes Yes
Habitat degradation Yes Yes
Climate/environmental Temperature No N/A
change Prey availability No N/A
Displacement No N/A
Shooting Shooting No N/A
Research Physical No N/A
Disturbance No N/A
Predation Predation No N/A
Inbreeding Inbreeding No N/A
Military operations Military operations No N/A
* Stochastic effects refers to the inherent variability in the survival and reproductive success of individuals, which can result in
fluctuating population trends for small populations (Courchamp et al. 2008). These effects are distinct from depensation or Allee
effects that small populations may also experience if the survival or reproduction of individuals is compromised when they are at
low abundance (Stephens et al. 1999; Courchamp et al. 2008). In this report, the term ‘small population effects’ is used to describe
both stochastic and Allee effects of small population size.
Risk assessment of threats to Maui’s dolphins 9Ta b l e 2 . C h a r a c t e r i s a t i o n o f t h re a t s e v a l u a t e d a s re l e v a n t t o M a u i ’s d o l p h i n s a n d l i k e l y t o a ff e c t p o p u l a t i o n
t re n d s w i t h i n t h e n e x t 5 y e a r s .
Threat Threat Mechanism Type Population
class component(s)
affected
Fishing
Commercial trawl Incidental capture, cryptic mortality Direct Juvenile or adult survival
Commercial setnet Incidental capture, cryptic mortality Direct Juvenile or adult survival
Recreational setnet Incidental capture, cryptic mortality Direct Juvenile or adult survival
Recreational driftnet Incidental capture, cryptic mortality Direct Juvenile or adult survival
Customary setnet Incidental capture, cryptic mortality Direct Juvenile or adult survival
Trophic effects Competition for prey, changes in Indirect Fecundity, juvenile or adult
abundance of prey and predator species survival
Vessel noise: Displacement from habitat, masking Indirect Fecundity, juvenile or adult
displacement, sonar biologically important behaviour survival
Vessel traffic Boat strike Physical injury/mortality Direct Juvenile or adult survival
Disturbance Displacement from habitat, masking Indirect Fecundity, juvenile or adult
biologically important behaviour survival
Pollution Agricultural run-off Compromising dolphin health, habitat Indirect Fecundity, juvenile or adult
degradation, trophic effects survival
Industrial run-off Compromising dolphin health, habitat Indirect Fecundity, juvenile or adult
degradation, trophic effects survival
Plastics Compromising dolphin health, ingestion Both Fecundity, juvenile or adult
and entanglement survival
Oil spills Compromising dolphin health, ingestion Both Fecundity, juvenile or adult
(direct & prey) and inhalation survival
Trophic effects Changes in abundance of prey and Indirect Fecundity, juvenile or adult
predator species survival
Sewage and stormwater Compromising dolphin health, habitat Indirect Fecundity, juvenile or adult
degradation, trophic effects survival
Disease Natural Compromising dolphin health Both Fecundity, juvenile or adult
survival
Stress-induced Compromising dolphin health Both Fecundity, juvenile or adult
survival
Domestic animal vectors Compromising dolphin health Both Fecundity, juvenile or adult
survival
Small population Stochastic and Allee Increased susceptibility to other threats Indirect Fecundity, juvenile or adult
effects effects survival
Mining and oil Noise (non-trauma) Displacement from habitat, masking Indirect Fecundity, juvenile or adult
activities biologically important behaviour survival
Noise (trauma) Compromising dolphin health Direct Fecundity, juvenile or adult
survival
Pollution (discharge) Compromising dolphin health Indirect Fecundity, juvenile or adult
survival
Habitat degradation Displacement from habitat, reduced Indirect Fecundity, juvenile or adult
foraging efficiency, trophic effects survival
For indirect threats, panellists elected to either estimate a mortality level equivalent to the
population consequences of the threat, or to estimate the equivalent impact on population
growth rate (λ), which was then transformed into a mortality estimate. Mortality estimates were
based on the current level of risk posed by the threat, considering the presence and efficacy
of existing risk management measures (e.g. fisheries restrictions existing at the time of the
workshop). Interim fisheries restrictions introduced in the Taranaki region since the workshop
was held were not considered, meaning risk was estimated as if these restrictions were not
in effect. These estimates represented a judgement by the panel members, given available
information and taking into account input from stakeholders and other informed workshop
attendees (e.g. regional government officials with relevant local knowledge). The resulting
estimates permit an assessment of population-level impact arising from each threat.
10 Risk assessment of threats to Maui’s dolphinsTo inform the scoring process, the panel was presented with background material (du Fresne
et al. 2012; Appendices 1 & 2). The background material included information specific to Maui’s
dolphins as well as material from research on Hector’s dolphins (du Fresne et al. 2012). The panel
agreed that information from Hector’s dolphins could be used as a proxy in situations where
information was limited for Maui’s dolphins. Further, DOC and MPI staff compiled relevant
spatial data to plot the spatial distribution of activities identified as threats to Maui’s dolphins.
The data layers were analysed in advance of the workshop and displayed by GIS experts at the
workshop in real time. Based on the advice of the panel, the mortality associated with the two
natural threats in the threat characterisation (natural diseases and small population effects) was
not estimated separately. Instead, the level of mortality from these threats and their population
consequences were considered to be incorporated within the choice of maximum population
growth rate used in the quantitative analysis. The panel agreed to use the maximum population
growth rate suggested for Hector’s dolphins by Slooten & Lad (1991), i.e. 1.8% per annum.
Each panel member was asked to estimate the number of Maui’s dolphin mortalities per year
for each threat, along with an upper and lower bound representing uncertainty. The individual
estimates were then presented back to the workshop. The panel was provided with an opportunity
to discuss the results, and individual panel members were permitted to update their estimates
following these discussions. The updated estimates, including upper and lower bounds, were then
recorded.
Subsequent to the workshop, during data analysis and report preparation, estimates of cumulative
impact from all combined threats were compiled by workshop facilitators and corresponding
estimates of population growth rate were generated. Expert panellists were re-contacted at this
time and offered the opportunity to update their scores in light of the combined population
growth or decline rate implied by their threat-specific impact estimates. This was to ensure that
the combined population-level consequences of cumulative impacts were considered and the
combined mortality estimates were not influenced by the level of threat disaggregation. The
panellists’ final estimates were then used for the quantitative analysis.
2.6 Quantitative analysis
To preserve the uncertainty of individual expert scores in subsequent analysis of cumulative
impacts and population-level consequences, each individual expert score for each threat was
resampled using a parametric bootstrap (10 000 samples) from the distribution specified by the
expert. If no alternate distribution was specified, the panel agreed to apply a default triangular
distribution that peaked at the expert’s best estimate of impact and tailed off linearly to zero
at the lower and upper bounds. These distributions were aggregated with equal weighting to
produce impact distributions representing estimated annual Maui’s dolphin mortalities for
each threat, for each threat class, for each expert, and combined across all threats and experts.
The aggregated distributions across all experts incorporate estimates of uncertainty provided
by individual panellists as well as the degree of consensus among the panellists. To summarise
these distributions and reflect associated uncertainty, we reported medians7 and 95% confidence
intervals in the results.
To represent the population-level consequence associated with estimated impacts, we applied two
different approaches: first, we generated a corresponding rate of population growth or change
(λ); second, we estimated a risk ratio (RR), i.e. the level of estimated population mortality as a
proportion of the Potential Biological Removals (PBR).
To estimate λ and RR, we bootstrap resampled (10 000 samples) using distributions (see below)
for each of the parameters in the following formulae:
7 Medians are measures of central tendency that are robust to skewed data (when compared with arithmetic means). However, as medians
are contingent on the shape of their underlying distribution, multiple medians cannot be summed.
Risk assessment of threats to Maui’s dolphins 11λ = (N λmax –MP)/N (1)
RR = M/PBR (2)
Where:
•• N was the most recent abundance estimate (55 animals over 1 year of age; 95% CI: 48–69;
selected from an empirical distribution applying Chao’s (1989) formula for sparse data;
Hamner et al. 2012a).
•• λmax was the maximum population growth rate fixed as agreed by the panel (1.8 % per
annum; Slooten & Lad 1991).
•• M was the total estimated human-induced mortalities combined across all threats as scored
by the panel, with a distribution estimated from the expert score resampling.
•• P was the proportion of total estimated threat-induced mortalities that were of individuals
over 1 year of age (fixed at 100%).
•• PBR was the level of potential biological removal provided to the panel (1 dolphin every
10 to 23 years; which was simulated as a uniform distribution between 0.1 and 0.044 to
incorporate uncertainty, Appendix 1).
This approach assumed that the current population is at a proportion of carrying capacity
sufficiently low as not to be subject to the density-dependent effects on population growth rate
that affect populations near carrying capacity and, noting that any small population effects are
reflected in the value chosen for λmax. To summarise these distributions in the results, we report
medians and 95% confidence intervals as well as the likelihood of threat-induced mortalities
exceeding reference limits such as PBR (i.e. RR > 1) or the level of surplus production (i.e. λ < 1).
These reference limits provide measures of the biological sustainability of threats individually or
cumulatively.
12 Risk assessment of threats to Maui’s dolphins3. Results
3.1 Estimated mortality
The panel estimated that there were likely to be 5.27 (95% CI: 0.97–8.40) Maui’s dolphin
mortalities per annum from all threats over the next 5 years (Fig. 2). The broad range of the
confidence intervals of mortality estimates reflected the uncertainty of individual panellists as well
as the degree of consensus among them in their estimated levels of mortality. The bimodal shape
of the distribution resulted from differences in overall mortality estimates between panellists.
While eight of nine panellists provided scores that were broadly consistent and relatively
uncertain, one expert provided estimates that were significantly lower and comparatively more
certain (Table 3). Subsequent analyses retain the outlying expert’s estimates to ensure the findings
are robust to diverging views among panellists.
Likelihood based on aggregated expert scores
0.045
0.04
0.035
0.03
0.025
0.02
0.015
0.01
0.005
0
0 1 2 3 4 5 6 7 8 9 10 11
Estimated number of Maui's dolphin mortalities per year
Figure 2. Distribution of estimated Maui’s dolphin mortalities per year for all threats as scored by
the panel. Individual scores were bootstrap resampled from distributions specified by the panel
and aggregated to provide an overall distribution that incorporates uncertainty and the degree of
consensus.
Ta b l e 3 . E s t i m a t e d n u m b e r o f M a u i ’s d o l p h i n m o r t a l i t i e s p e r y e a r a r i s i n g f ro m f i s h i n g - re l a t e d
t h re a t s a n d f ro m a l l t h re a t s c o m b i n e d , a s s c o re d b y e a c h m e m b e r o f t h e p a n e l . I n d i v i d u a l t h re a t
s c o re s w e re b o o t s t r a p re s a m p l e d f ro m d i s t r i b u t i o n s s p e c i f i e d b y t h e p a n e l l i s t s a n d a g g re g a t e d
to generate medians and 95% confidence intervals.
Expert fishing-related all threats Proportion from fishing
Median 95% CI 95% CI Median 95% CI 95% CI Median percentage
Lower Upper Lower Upper
Expert A 0.31 0.23 0.41 1.04 0.84 1.24 30.1
Expert B 4.17 2.26 6.55 4.53 2.62 6.91 92.3
Expert C 4.69 3.41 6.22 4.78 3.51 6.31 98.3
Expert D 4.77 3.34 5.94 4.86 3.43 6.03 98.3
Expert E 4.97 2.95 6.95 5.11 3.16 7.07 96.8
Expert F 4.81 3.06 6.54 5.43 3.67 7.21 88.3
Expert G 5.77 4.15 7.88 6.13 3.94 8.47 89.1
Expert H 5.91 3.69 8.19 6.48 4.83 8.54 96.4
Expert I 7.00 5.05 9.22 7.24 5.30 9.58 96.4
Total 4.97 0.28 8.04 5.27 0.97 8.39 95.5
Risk assessment of threats to Maui’s dolphins 13The panel estimated that fishing-related threats were responsible for 4.97 (95% CI: 0.28–8.04)
Maui’s dolphin mortalities per annum, or 95.5% of total human-associated mortalities (Table 3).
In comparison, non-fishing-related threats (of which mining and oil activities, vessel traffic,
pollution and disease generated non-zero impacts) were estimated to contribute 0.27 (95% CI:
0.05–0.90) Maui’s dolphin mortalities per annum, or 4.5% of total threat-associated mortalities
(Table 4).
Ta b l e 4 . E s t i m a t e d M a u i ’s d o l p h i n m o r t a l i t i e s p e r y e a r, t h e r i s k r a t i o o f m o r t a l i t i e s t o PBR a n d
t h e l i k e l i h o o d o f e x c e e d i n g PBR f o r e a c h t h re a t c l a s s , a s s c o re d b y t h e p a n e l . I n d i v i d u a l t h re a t
s c o re s w e re b o o t s t r a p re s a m p l e d f ro m d i s t r i b u t i o n s s p e c i f i e d b y t h e p a n e l a n d a g g re g a t e d t o
generate medians and 95% confidence intervals.
Threat Estimated Risk Liklihood of
class mortalities ratio exceeding pbr
Median 95% CI 95% CI Median 95% CI 95% CI Median percentage
Lower Upper Lower Upper
Fishing 4.97 0.28 8.04 71.5 3.7 143.6 100.0
Mining and oil 0.10 0.01 0.46 1.5 0.1 7.4 61.3
activities
Vessel traffic 0.07Commercial setnet, commercial trawl and recreational/customary setnet fisheries were the threats
estimated to have the greatest impact on Maui’s dolphins (Fig. 4). The median estimated numbers
of Maui’s dolphin mortalities from commercial setnet, commercial trawl and recreational/
customary setnet fisheries were 2.33 (95% CI: 0.02–4.26), 1.13 (95% CI: 0.01–2.87) and 0.88
(95% CI: 0.02–3.14) dolphins per year respectively (see Appendix 3 for a complete list of threats
and associated estimated mortalities). Despite the lack of consensus among panellists about the
impact of fishing-related activities, the relative importance of commercial setnet, commercial
trawl and recreational/customary setnet fisheries was unchanged whether the one outlying
expert’s estimates were included or not (see Appendix 3).
Commercial trawl bycatch
Commercial setnet bycatch
Recreational/customary setnet bycatch
Recreational driftnet bycatch
Trophic effects of fishing
Vessel noise/disturbance from fishing
Boat strike from all vessels
Vessel noise/disturbance from other vessels
Agricultural run-off
Industrial run-off
Plastics
Oil spills
Sewage and stormwater
Trophic effects of pollution
Stress-induced diseases
Domestic animal diseases
Noise (non-trauma) from mining & oil activities
Noise (trauma) from mining & oil activities
Pollution (discharge) from mining & oil activities
Habitat degradation from mining & oil activities
0 1 2 3 4 5
Estimated number of Maui's dolphin mortalities per year
Figure 4. Estimated Maui’s dolphin mortalities per year for each threat, as scored by the panel. Individual threat scores were
bootstrap resampled from distributions specified by the panel and aggregated to generate medians (shaded bars) and 95%
confidence intervals (error bars).
3.2 Population level impact
The level of combined impact from all threats as estimated by the expert panel is considerably
higher than the population can sustain, given a maximum population growth rate of 1.8% per
annum. Population projections based on the panel’s estimated total mortalities suggest that there
is a 95.7% likelihood of population decline in the population of Maui’s dolphins over the next
5 years. The population projections suggest that, at the current rate of human-induced mortality,
the population will decline at 7.6% per annum (95% CI: 13.8% decline to 0.1% increase); Fig. 5.
The panel’s scores suggest a rate of population change that is more negative than, but broadly
consistent with, a recent empirical estimate (Hamner et al. 2012a; Fig. 6). Total estimated Maui’s
dolphin mortalities equate to a risk ratio of 75.5 (95% CI: 12.4–150.7) times the level of the PBR
(Table 4; see Appendix 3 for a complete list of threats and associated risk ratios). Each threat class
had at least a 30% chance of exceeding the PBR in the absence of other threats (Table 4).
Risk assessment of threats to Maui’s dolphins 15Likelihood based on aggregated expert scores
0.04
0.035
0.03
0.025
0.02
0.015
0.01
0.005
0
-20% -18% -16% -14% -12% -10% -8% -6% -4% -2% 0% 2% 4%
Estimated annual rate of population change for Maui's dolphins
Figure 5. Estimated annual rate of population growth or decline for Maui’s dolphins given the
estimated mortalities per year across all threats scored by the panel. Estimates were generated via
bootstrap resampling of mortality and abundance estimates to provide an overall distribution that
incorporates uncertainty and the degree of consensus.
Likelihood based on aggregated expert scores
0.035
0.03
0.025
0.02
0.015
0.01
0.005
0
-20% -16% -12% -8% -4% 0% 4% 8% 12%
Estimated annual rate of population change for Maui's dolphins
Figure 6. Estimated annual rate of population growth or decline for Maui’s dolphins given the
estimated mortalities per year across all threats scored by the panel (black) compared with an
empirical estimate (grey) generated via bootstrap resampling the estimate of Hamner et al. (2012a).
3.3 Spatial distribution
In the initial characterisation of specific threats, the panel characterised the spatial overlap
between the dolphin distribution and the spatial distribution of each threat, as a proxy for the
overall threat intensity experienced by the dolphins.
Following threat scoring, these spatial overlap maps were examined in greater detail for the two
threats estimated to pose the greatest level of risk to Maui’s dolphins, i.e. commercial setnet
and trawl fisheries. For these threats, the spatial overlap maps were generated empirically by
multiplying the average annual fishing intensity under the current spatial management regime
(i.e. 2008–2011 for setnets and 2008–2011 for trawls) by the relative dolphin density in each
spatial cell on a fine scale (cell size = 1 nautical mile (n.m.)). The resulting maps (Figs 7 & 8) provide
an empirically derived representation of the spatial distribution of impact and risk arising from
each of these threats; the total impact estimates generated by the expert panel can be disaggregated
and assigned quantitatively to each cell proportional to their relative values in Figs 7 & 8.
16 Risk assessment of threats to Maui’s dolphins< 0.05
0.05 - 0.1
0.1 - 0.5
0.5 - 0.75
1
Figure 7. Intersection of Maui’s dolphin distribution (Fig. 1) with all setnet effort between 2008 and 2011. The intersection
is calculated by multiplying the fishing effort with the dolphin distribution value in each cell (as shown in blue). The values
have been scaled to indicate relative intensity, with the maximum intersection having a value of 1. The existing and proposed
areas closed to setnet fishing are indicated in shades of red8. The marine mammal sanctuary is outlined in grey, including the
proposed extension to the sanctuary in southern Taranaki (see Appendix 2 for further details).
8 Not all fisheries closures displayed in this map were in effect throughout the 2008–2011 period. The palest red region around Taranaki
was the area proposed for closure under interim measures at the time of the workshop.
Risk assessment of threats to Maui’s dolphins 17< 0.05
0.05 - 0.1
0.1 - 0.5
0.5 - 0.75
1
Figure 8. Intersection of Maui’s dolphin distribution (Fig. 1) with all trawl effort between 2008 and 2011. The intersection
(shown in blue) is calculated by multiplying the fishing effort with the dolphin distribution value in each cell. The values have
been scaled to indicate relative intensity, with the maximum intersection having a value of 1. The areas closed to trawl fishing
are indicated in red. The marine mammal sanctuary is outlined in grey, including the proposed extension to the sanctuary in
southern Taranaki (see Appendix 2 for further details).
18 Risk assessment of threats to Maui’s dolphinsFigure 7 reveals that Maui’s dolphins are exposed to the greatest level of risk from setnet fisheries
in the area of the northern Taranaki coastline out to 7 n.m. offshore, and at the entrance to the
Manukau Harbour. Figure 8 reveals that Maui’s dolphins are exposed to the greatest level of risk
from inshore trawl fisheries between the boundary of the trawl fishery closures areas (that extend
2 or 4 n.m. offshore) and 7 n.m. offshore, particularly in the core region of dolphin distribution
(from Raglan Harbour entrance to the Kaipara Harbour entrance).
These maps, in combination with the expert-panel-derived estimates of total fisheries-associated
impact from these methods, can be used to generate testable hypotheses of expected impact levels
in particular locations, which could be tested or updated in future using actual data, e.g. from
deploying fisheries observers (as in Richard et al. 2011). The absence of spatial information for
recreational and customary setnet effort at comparable spatial resolution prevented the workshop
from generating similarly precise spatial estimates of relative risk, but the application of lower-
resolution spatial estimates of the relative prevalence of these threats (e.g. regional-level data from
local compliance or fisheries officials) may prove valuable.
4. Discussion
4.1 Risk assessment for Maui’s dolphins
The risk assessment process indicates that the long-term viability of the Maui’s dolphin
population remains at risk from human-induced mortality. Cumulative mortality estimates of
5.27 dolphins per year (95% CI: 0.97–8.40) cannot be sustained by a population with only
55 individuals over 1 year of age (95% CI: 48 to 69; Hamner et al. 2012a) with a maximum rate
of increase of 1.8% per year. The present estimates of mortality are 76 times greater than the
PBR, a level that would allow Maui’s dolphins to reach or maintain a population level above their
maximum net productivity level with high certainty (Wade 1998). This means that, exposed to the
current level of threat, the population is highly unlikely to recover. Indeed, quantitative analysis
using the panel’s estimates of mortality (with associated uncertainty) indicated a 95.7% likelihood
of ongoing population decline, with a median rate of population decline of 7.6% per annum.
Fishing-related threats were assessed by the panel as posing greatest risk to Maui’s dolphins,
particularly bycatch in commercial setnets, commercial trawl nets and recreational or customary
setnets. Fishing-related activities accounted for 95.5% of total Maui’s dolphin mortalities as
estimated by the panel, and mortalities associated with fishing were assessed as having a 100%
likelihood of exceeding the PBR, even in the absence of other threats. This is consistent with the
conclusions of the Hector’s and Maui’s dolphin Threat Management Plan (2007; p. 12) that it
is believed that the effects of fishing are the greatest cause of human-induced mortality on the
dolphins and the effect of fishing related mortality is likely to be greatest on populations that
are small because the level of mortality they can sustain will be less. The panel’s estimates are
also broadly consistent with a number of studies that have assessed the risk posed by commercial
setnet fisheries to population trends for Hector’s and Maui’s dolphins (Slooten 2007; Davies
et al. 2008; Slooten & Dawson 2010; Slooten & Davies 2012). Their general conclusion that setnet
bycatch is likely to be driving ongoing population decline is consistent with the findings of this
study. Similar findings have been made for similar small cetacean populations, including vaquita
in the Gulf of California (Jaramillo-Legorreta et al. 2007; Gerrodette et al. 2011), and harbour
porpoises (Phocoena phocoena) in the Baltic Sea (Berggren et al. 2002). Marine mammal bycatch
in setnet fisheries is a global issue. In the 1990s, 84% of cetacean bycatch in the USA and most of
the world’s cetacean bycatch occurred in setnet fisheries (Read et al. 2006).
Risk assessment of threats to Maui’s dolphins 19You can also read