FY 2020 Adopted Budget - Finance Department P.O. Box 619428 DFW Airport, Texas 75261-9428
←
→
Page content transcription
If your browser does not render page correctly, please read the page content below

FY 2020 Adopted Budget

 Finance Department
 P.O. Box 619428
 DFW Airport, Texas 75261-9428
FY 2020 Adopted Budget                           Introduction

                                                          Table of Contents
                                                            Introduction
DFW’s Vision Statement and Board of Directors.… ....................................................................... 2
DFW Infrastructure .......................................................................................................................... 4
Strategic Plan .................................................................................................................................. 6
DFW's Airline Use Agreement Rate Model ...................................................................................... 8
DFW Fund Structure……… ............................................................................................................. 10
FY 2020 Budget Comparisons to Other Periods………………...………………………………...... 11
Budget Schedule.....……………………………………………………………… .............................. 11

                                   Executive Summary
FY 2020 Key Performance Indicators.… ....................................................................................... 12
FY 2020 Budget Comparisons and Walkforward ............................................................................ 13
Passenger Airline Cost per Enplanement (CPE) ............................................................................. 15
DFW Cost Center Net Revenues……… ...................................................................................... 17
FY 2020 Revenue and Expense Budget Exposures……………...……………………………… .... 18

                                    Airline Cost Centers
Airfield Cost Center…………………………… ............................................................................... 20
Terminal Cost Center………………………. .................................................................................. 24
Transfers - DFW Terminal Contribution ........................................................................................ 25
Cost Per Enplanement (CPE) Calculation...………………………………………………………... 26

                                                          DFW Cost Center
DFW Cost Center ............................................................................................................................27
Parking ......................................................................................................................................... 28
Concessions ....................................................................................................................................30
Rental Car Center (RAC) ................................................................................................................31
Commercial Development ............................................................................................................ 32
Other DFW Revenues and Expenses .............................................................................................33

                                                         Operating Expenses
FY 2020 Expenditure Budget ....................................................................................................... 34
Operating Budget by Category ..................................................................................................... 39
Contingency Outside of Rate Base. .............................................................................................. 41
Net Debt Service Budget .............................................................................................................. 42
Positions ........................................................................................................................................ 43

                                     Departments
Department Overview and Walkforwards….................................................................................. 44

                                                     Capital Budget
Projected Capital - Uses of Cash by Capital Account................................................................... 64
DFW Capital Account… ................................................................................................................ 69
Joint Capital Account .................................................................................................................... 70
Capital Project Sources of Cash ................................................................................................... 71

        1       DFW International Airport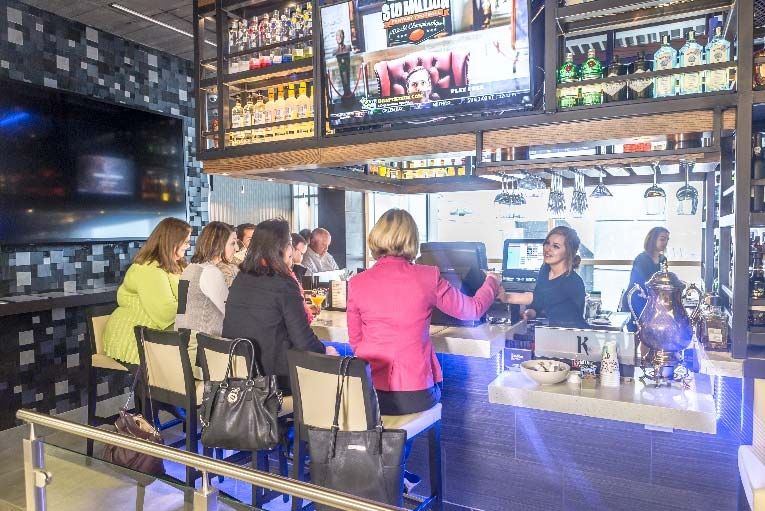
FY 2020 Adopted Budget   Introduction

2   DFW International Airport
FY 2020 Adopted Budget        Introduction

                                    Airport Background

Dallas Fort Worth International Airport (Airport or DFW) was created by a Contract and Agreement
between the cities of Dallas, Texas, and Fort Worth, Texas (Cities) on April 15, 1968, for the
purpose of developing and operating an airport as a joint venture between the Cities. Although
owned by Dallas and Fort Worth, DFW is located within the boundaries of the Cities of Grapevine,
Coppell, Irving, Euless and Fort Worth; and within Dallas and Tarrant Counties.

                 Source: DFW Airport Information Technology Services

      3    DFW International Airport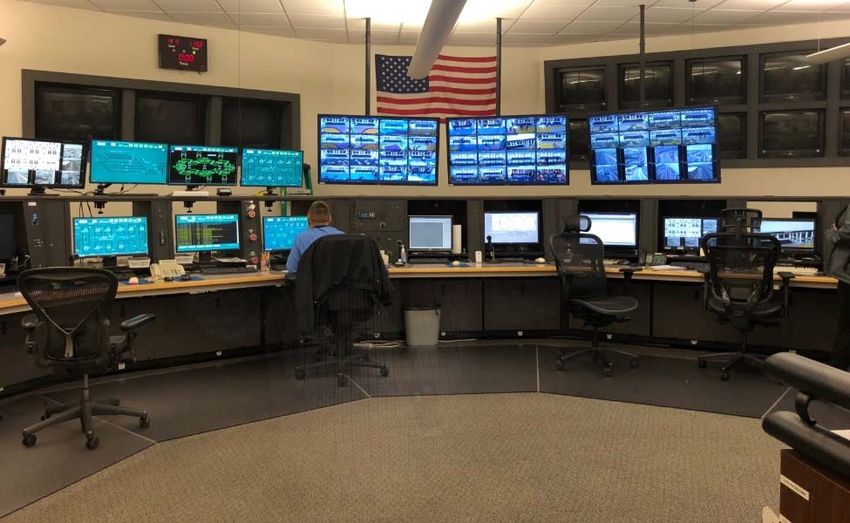
FY 2020 Adopted Budget Introduction
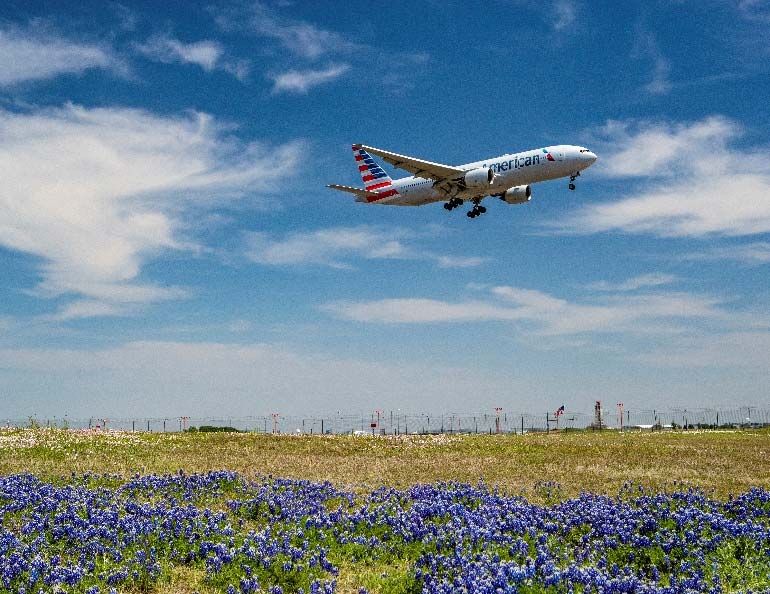
DFW property consists of 26.9 square miles (or 17,183 acres) making it one of the largest land mass
airports in the world. In 2019, DFW earned the prestigious Airport of the Year award from Air
Transport World. DFW is located within a four-hour flight time of 98% of the U.S. population, and
currently ranks fourth among the world’s busiest airports in terms of operations and 15th in
terms of g l o b a l passengers. Its central location is the focal point of one of the nation’s largest
intermodal hubs, connecting air, rail, and interstate highway systems. A s o f J u l y 1 , 2 0 1 9 ,
DFW currently operates daily passenger flights to 253 destinations worldwide, including 190
nonstop domestic destinations and 63 nonstop international destinations. There are 23
passenger carriers and 22 cargo carriers serving DFW. The Airport is the economic engine
for North Texas. According to a 2 0 1 6 study, DFW drives $37 billion in annual economic activity,
supporting approximately 60,000 on-airport employees, 228,000 local jobs, and an annual payroll
of $12.5 billion.
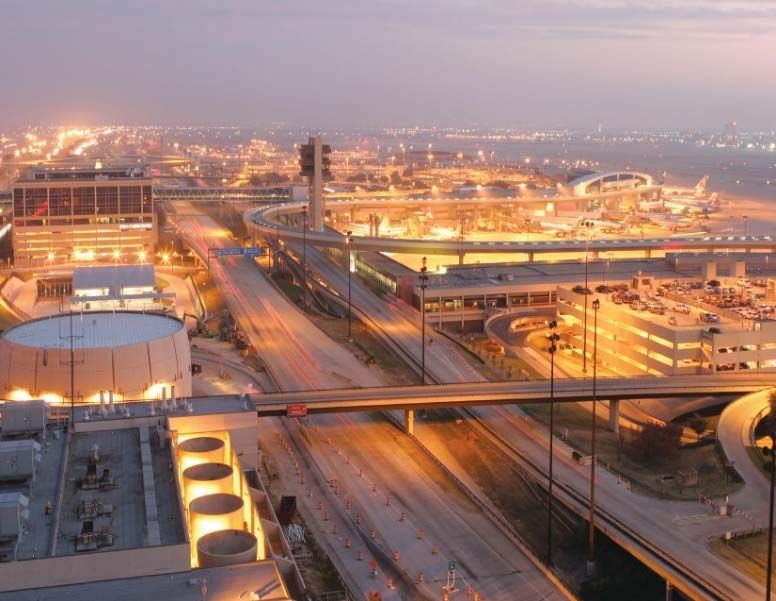
DFW Infrastructure
Terminals - The Airport has five terminals (A, B, C, D, and E) totaling 6.3 million square feet of
building space, including 164 aircraft boarding gates, approximately 361 ticketing positions,
including supporting self-service kiosks and 15 security checkpoints, with four including TSA
expedited screening for domestic passengers. Collectively, the airlines averaged seven turns per
active gate in FY 2018.
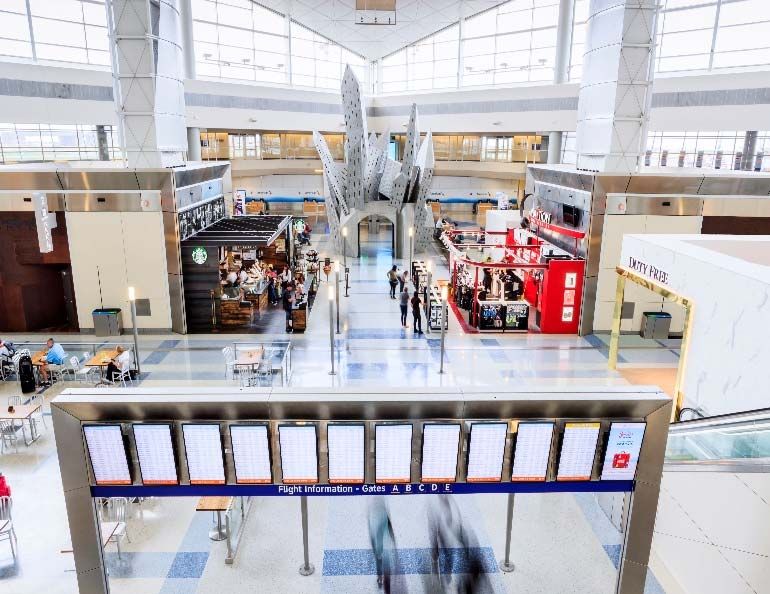
DFW Terminal Complex
American Airlines (AA) operates domestic service in Terminals A, B and C, and D. All of American’s
international arrivals are in Terminal D. Their international departures are primarily in Terminal D, with
a handful operated from Terminals A and C. American Eagle operates domestic service in Terminals
B, D and E, with international service in Terminals B and D. All other airline domestic flights operate
from Terminal E (with a few seasonal flights in Terminal D). The other airline international arrivals and
most departures operate from the Airport’s International Terminal D, with a few international departures
in Terminal E.
Terminal D has 2.2 million square feet and 26 gates. Seventeen of the gates are preferentially leased
to AA, and the remaining 9 gates are common use. The preferential gate lease expires on
September 30, 2020, concurrent with the Airline Use Agreements. The Airport’s Customs and Border
Protection (CBP) facilities are located in Terminal D. The Airport’s CBP facility is approximately
406,000 square feet with 49 inspection booths, 20 Global Entry kiosks with facial recognition
biometrics, and 85 Automated Passport Control (APC) kiosks. The CBP facility has the capacity to
handle approximately 2,800 international customers per hour, and customers can retrieve their
luggage from any one of eight bag carousels.
4 DFW International Airport
FY 2020 Adopted Budget           Introduction

The Airport is responsible for all the custodial services in Terminals B, D and E, and has budgeted to
transition control from American of Terminals A and C in FY 2020. American is responsible for facilities
maintenance in Terminals A and C, and the Terminal E Satellite. Additionally, American handles
Terminal D baggage maintenance, American’s leased boarding bridges in Terminal D, and six
boarding bridges in Terminal B. The Airport handles the facilities maintenance for the balance of
Terminals B, D, and E, and outsources most of the maintenance and janitorial functions to third
parties. The costs associated with the Airport’s maintenance of these facilities are included in the
Airport’s operating budget. The costs of maintenance activities paid directly by American Airlines are
not included in the Airport’s operating budget or financial statements.

Airfield – DFW has seven runways with significant airfield capacity that can accommodate
simultaneous takeoffs and landings. Five runways are configured as north/south parallels with two
diagonals. Four of DFW’s runways are 13,400 feet in length. DFW’s infrastructure is capable of
supporting aircraft such as the Airbus A380 and the Boeing 747-8F. Per FAA benchmark studies,
the Airport’s designated hourly capacity arrival/departure flow is approximately 170 aircraft
operations per hour under instrument flight rule (IFR) weather conditions and approximately 226-
264 aircraft operations per hour under optimum visual flight rule (VFR) weather conditions, a
condition that prevails approximately 78% of the time.

Airport Operations Center – The Airport Operations Center (AOC) serves as a single point of
contact to centralize communications for DFW’s passengers, guests, tenants, employees, and
contractors, with an emphasis on Communication, Collaboration and Coordination (C³). The AOC
is the communication and coordination center that provides DFW staff, airport tenants and aviation
stakeholders with the situational awareness needed to efficiently and quickly manage airport
resources. The AOC facilitates coordination among stakeholders when responding to routine/daily
infrastructure deficiencies, irregular operations and emergency incidents. The combined facility
handles approximately 26,000 calls per month and generates approximately 3,200 work orders per
month.

DPS Tactical Communications / Emergency Operations Center - The Department of Public
Safety (DPS) Tactical Communications team includes the DPS Dispatch Center and the Master
Control Room. The DPS Dispatch Center serves as a single point of contact for emergency
communications for DFW’s passengers, guests, tenants, contractors and employees through 9-1-
1 and non-emergency calls for assistance from police, fire, and emergency medical response
teams. The Master Control Room provides 24/7 video surveillance monitoring to ensure the safety
and security of the airport community.         The
Emergency        Operations   Center     is     the
coordination center that provides DFW Board
staff, Airport tenants and aviation stakeholders
with the situational awareness needed to
efficiently and effectively manage airport
resources during any disruption of critical airport
service and situations that require large-scale
emergency response.

On June 21, 2019 the Airport opened a new DPS
headquarters which will be the home to more
than 600 employees. The new headquarters
marks the first time in the Airport’s history that
leaders from Police, Fire and Special Services are working together under one roof, which will allow
for greater collaboration and a more integrated response to emergencies.

      5     DFW International Airport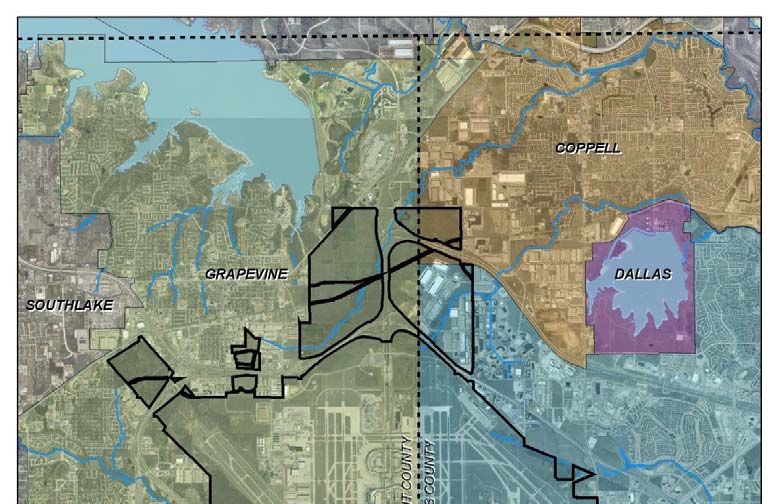
FY 2020 Adopted Budget Introduction
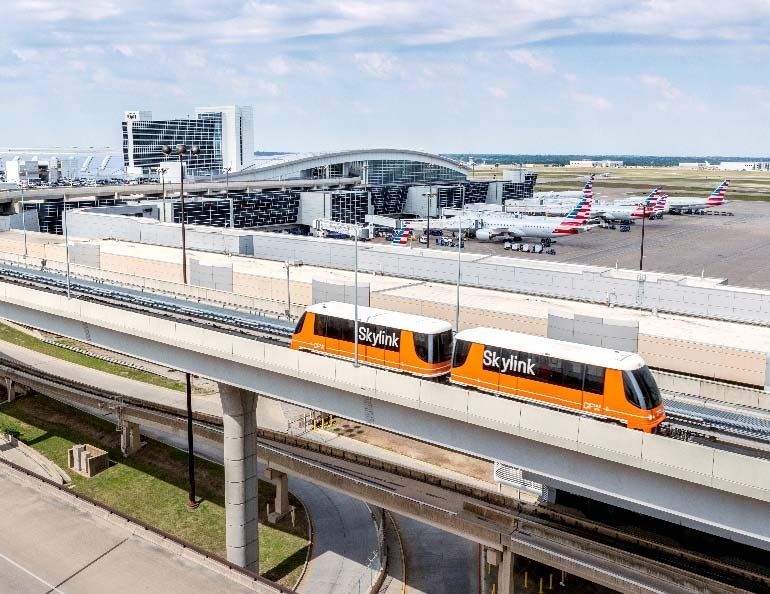
Automated People Mover (APM) and Transportation System – The Skylink APM system began
service in 2005 and carries an average of approximately 129,000 passengers and employees each
day (47 million annually) between DFW’s five terminals. Skylink trains are on the secure side of the
terminals and travel in concentric loops in both directions. There are two Skylink stations in each
terminal and trains average two minutes headways. The typical customer ride duration is less than
eight minutes. Skylink operates around-the clock with 16 two-car trains.
DFW uses 21 buses to shuttle passengers between the terminals and Grand Hyatt (Terminal Link);
42 buses between express parking lots and terminals, 16 buses between remote parking lots and
terminals, 32 between employee lots and terminals, and 5 buses for various DFW activities.
DFW Controlling Documents
In addition to the Contract and Agreement between the Cities, DFW is governed by several
other key documents, including the Master Bond Ordinance and the Use Agreements between
DFW and the Signatory Airlines. Collectively, these agreements are called the Controlling
Documents.
The Controlling Documents define how DFW manages its business affairs. DFW does not
collect any local tax revenue to fund its operations. The Controlling Documents require that Gross
Revenues of the Airport be deposited into the Revenue and Expense Fund. Gross Revenues are
defined as all Airport revenues and receipts except: bond proceeds; Passenger Facility Charge
(PFC) proceeds used to fund capital projects (rather than for debt service); interest earned on
unspent bonds; proceeds in the Capital Accounts; grant proceeds used to fund capital projects;
and sale of land or mineral rights, including natural gas royalties.
Strategic Plan
DFW’s executive team rolled out the organization’s current Strategic Plan in FY 2017. The
structure of the plan is shown in the next page.
A copy of DFW’s Strategic Plan is available at www.dfwairport.com.
6 DFW International Airport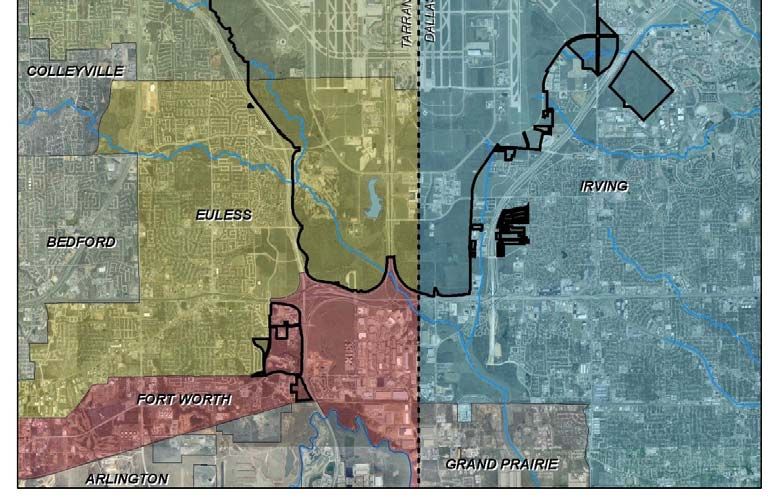
FY 2020 Adopted Budget   Introduction

7   DFW International Airport
FY 2020 Adopted Budget   Introduction

                                Airline Use Agreement Rate Model

The Airline Use Agreement is a hybrid model, whereby the Signatory Airlines pay landing fees and
terminal rentals based on the net cost to provide those services, and DFW retains a portion of the
net revenues from non-airline business units (e.g., parking) in the DFW Cost Center (DFWCC). The
following chart summarizes the Airline Use Agreement rate model.

                     Operating Revenue and Expense Fund (the "102 Fund")
                         Airline Cost Centers
             Airfield                           Terminal
 Expenses                           Expenses
  Direct Costs                       Direct Costs
  DPS and Overhead Allocations       DPS and Overhead Allocations
  Debt Service (net of PFCs)         Debt Service (net of PFCs)

 Less: Misc Airfield Revenues       Less: Misc. Terminal Rentals
  General Aviation                   Federal Inspection Fees
  Fueling Facility Lease             Turn Fees; TSA Rentals
                                     Concessions Reimbursements
 +/- Transfers/Adjustments          +/- Transfers/Adjustments           -
  - Lower Threshold Adjustment       + DFW Terminal Contribution
  + Upper Threshold Adjustment       + Annual Capital Transfer
  +/- True-Up Adjustment             +/- True-Up Adjustment
  Net Cost = Landing Fees (KPI)     Net Cost = Terminal Rentals (KPI)
           Airline Cost & Airline Cost per Enplanement (KPI)

Airline Cost Centers – The Airline Cost Centers are cost recovery in nature, such that the
amount charged to the airlines equals the cost to provide services, after certain adjustments.
Landing fees and terminal rental rates are based on the net cost to operate and maintain the
airfield and terminals, respectively. DFW charges the direct operating and maintenance costs for
the airfield and terminals, plus allocated Department of Public Safety and overhead costs, plus
debt service net of Passenger Facility Charges (PFCs) to each cost center. DFW t h e n
subtracts ancillary revenues generated in these cost centers and credits or charges certain
transfers and/or adjustments (see True-Up Adjustments below). The budgeted landing fee rate is
determined by dividing the net cost of the airfield by projected landed weights. The budgeted
average terminal rental rate is determined by dividing the net cost of the terminal cost center

       8    DFW International Airport
FY 2020 Adopted Budget Introduction
divided by leasable square footage. The Use Agreement requires the Airport to charge an
equalized terminal rental rate for all five terminals.
The amount paid by the airlines for landing fees and terminal rent fees less airline incentive
payments for new service equals airline cost, which is an airport industry Key Performance
Indicator (KPI). Another common industry KPI is passenger airline cost per enplaned passenger
(CPE). This KPI for passenger airlines is calculated by dividing the amount paid by passenger
airlines for landing fees and terminal rent fees (i.e., collectively, airline cost) by the number of
enplanements.
DFW Cost Center – All non-airline business units, plus interest income, are included in the
DFW Cost Center. The DFW Cost Center also pays all costs associated with the Skylink people
mover system. The net revenues from this cost center are transferred to the DFW Capital
Account and currently equal the “upper threshold” plus 25%. One of DFW’s most important KPIs is
DFW Cost Center Net Revenue. This KPI measures the profitability (i.e., net revenues) generated
by the Airport’s non-airline business units, after adjusting for the cost of Skylink and drives the
contribution of discretionary capital to the DFW Capital Account.
Joint Capital Account – Funds in the Joint Capital Account (JCA) generally require DFW and
airline approval before money can be spent. The JCA is funded from the proceeds from natural
gas royalties and the sale of land, plus interest income on the account. Supplemental funding
for projects paid from the JCA comes from grants and the issuance of debt.
Coverage Account – The Airport established the Coverage Account as part of the c u r r e n t
Use Agreement in order to implement “rolling coverage.” Each year, the Coverage Account is
rolled into the 102 Fund as a source of revenue, and then transferred back into the Coverage
Account as excess revenue at the end of the year. The Coverage Account must equal 25% of
aggregate debt service each year. If new debt is issued, rates are established to generate the
incremental coverage required to fund 25% of the new debt service, except if commercial paper is
issued, then the coverage amount is 10%.
DFW Capital Account – This is DFW’s discretionary account and is funded primarily from the
DFWCC Net Revenues plus interest income. Supplemental funding for projects paid from the DFW
Capital Account comes from grants and the issuance of debt. Funds in this account may be used
for any legal purpose without airline approval.
Threshold Adjustments – The Use Agreement established Lower and Upper Thresholds for
DFWCC Net Revenues. If DFWCC Net Revenues are budgeted to be less than the Lower
Threshold ($45.6 million in FY 2019), an incremental charge (i.e., a Lower Threshold Adjustment)
is collected through landing fees in an amount sufficient to achieve the Lower Threshold
amount. Although clearly not needed given current levels of net revenues, the theoretical
benefit of the Lower Threshold Adjustment guarantees that DFW will have a minimum level of
cash to transfer to the DFW Capital Account t o replace assets on a timely basis. I f DFWCC Net
Revenues are budgeted to be greater than the Upper Threshold ($70.0 million in FY 2019), then
75% of the excess is credited to the Airfield Cost Center as an Upper Threshold Adjustment. This
reduces budgeted landing fees. The remaining 25% i s transferred to the DFW Capital Account
at the end of the fiscal year. Sharing net revenues over the Upper Threshold sharing provides
sufficient funds for capital replacement but also provides funds to lower landing fees. The Threshold
Amounts are adjusted annually for inflation.
9 DFW International AirportFY 2020 Adopted Budget Introduction
True-Up Adjustments – At the end of each fiscal year, DFW performs a reconciliation or true-
up, such that revenues collected equal the actual net cost to operate and maintain the airfield
and terminals. Any difference becomes a True-Up Adjustment, w h i c h is either charged or
credited to the appropriate cost center in the next fiscal year beginning in the second quarter of
such fiscal year.
DFW Terminal Contribution – Per the terms of the Use Agreement, an annual transfer is made
from the DFW Cost Center to the Terminal Cost Center to pay for DFW’s share of common use
and leasable but unleased space in Terminals D and E. This amount is $2.8 million in FY 2020.
DFW’s Fund Structure
Although DFW uses the word “fund” to describe the designation of the source and prospective
use of proceeds, DFW is an Enterprise Fund and does not utilize traditional fund accounting
commonly used by government organizations. The table below summarizes the primary funds
used by DFW:
Number Fund Description Primary Use
Fixed Assets and Long Term Debt Capital Assets/Bonds
Operating Revenues and Expenses Operations
252 Passenger Facility Charges (PFC) Collections/Debt Service
320s/330s Joint Capital Account and Bond Funds Capital/Bond Proceeds
340s DFW Capital Accounts and Bond Funds Capital/Bond Proceeds
500-600s Debt Service and Sinking Funds Principal and Interest
907/910/914 Public Facility Improvement Corporation (PFIC) Rental Car Facility/Grand Hyatt and Hyatt Place Hotels
DFW’s financial statements are issued in conformance with Generally Accepted Accounting
Principles (GAAP) and include all of DFW’s funds, whereas the Annual Budget focuses on
revenues and expenses included in the 102 Fund. DFW manages its day-to-day operations
primarily through the 102 Fund in accordance with the Controlling Documents.
Passenger Facility Improvement Corporation (PFIC)
DFW has a PFIC which owns and operates the Grand Hyatt Hotel in Terminal D and the Hyatt
Place Hotel in Southgate Plaza, as well as the Rental Car Facility and rental car bus transportation
services. In October 2018, the PFIC took over operations of the Verizon office complex
located in the west section of the Airport. This complex, now known as DFW Campus
West, will be leased to other tenants in the future. Revenues, expenses, and capital projects
of the PFIC are not included in this budget. These businesses are specifically excluded from the
airline rate base per the Use Agreement. DFW has issued bonds to finance the construction of
the Grand Hyatt Hotel and Rental Car Facility. Each business transfers funds in an amount equal
to the debt service so that there is no impact on the airline rate base.
Basis of Budgeting
The Operating Revenue and Expense Fund budget is commonly called the Operating Budget but
contains elements that are not expenses under GAAP such as debt service, reserve
requirements, and certain expenditures that may be capitalized under GAAP.
10 DFW International AirportFY 2020 Adopted Budget Introduction
Capital expenditures are funded through Joint Revenue Bonds, grants, PFCs, or cash in the
DFW or Joint Capital Accounts. From a process standpoint, the Board of Directors approves
the Operating Budget. The Board reviews the capital budget as part of the Annual Budget process
but does not approve a capital budget.
FY 2020 Budget Comparisons to Other Periods
FY 2019 Budget – During FY 2019, the Board approved the use of $4.5 million of contingency
budgeted outside of the rate base. The FY 2019 Budget as adjusted by contingency is
summarized in the following table. Any reference to the FY 2019 Budget in this budget document
relates to the FY 2019 Budget, as adjusted for the use of approved contingency.
Millions
FY 2019 Approved Budget $ 496.2
Approved Changes
DPS Expanded Security Measures 4.5
FY 2019 Budget with approved contingency $ 500.7
FY 2019 Outlook – DFW employs continuous forecasting techniques to project revenues and
expenses for the full 12 months of the fiscal year, which is called the Outlook. Most of the tables
and charts in this budget document include FY 2019 Outlook comparisons to provide the best
basis for comparison, rather than comparing to the FY 2019 Budget. The detailed Outlook in
this Budget Book was developed in a process such that every account was reforecast. This was
completed in March 2019.
Presentation of Amounts and Prior Years Actuals – The FY 2020 Budget is presented in
tables and charts that are rounded to millions and thousands. Some columns and charts may not
appear to add-up or foot due to rounding differences. Certain prior year amounts have been
reclassified to reflect the FY 2020 presentation.
Budget Schedule
DFW’s fiscal year begins October 1. The FY 2020 Expense Budget was compiled by the various
DFW departments in J une and reviewed and modified by management in J un e and Jul y .
Presentations were made to representatives of the Signatory Airlines on June 21, 2019 with
follow up information provided on July 16, 2019. A preview of the FY 2020 Budget was presented
to the Finance Committee on Ma y 28, 2 019. The final recommended Budget was presented
to and approved by the Board on August 1, 2019. The FY 2020 Budget must be submitted to
the City Managers of Dallas and Fort Worth by August 15, 2019, with approval of the two City
Councils by September 30, 2019.
11 DFW International AirportFY 2020 Adopted Budget Executive Summary
FY 2020 Key Performance Indicators
The table below compares the Key Performance Indicators (KPIs) of the FY 2019 Outlook and
the FY 2020 Budget.
FY19 FY20 Increase (Decrease)
Key Performance Indicators Outlook Budget Amount Percent
Total Passengers (Ms) 72.4 75.7 3.4 4.6%
Total Landed Weights (Lbs in Bs) 45.7 48.9 3.1 6.9%
Total 102 Expenditure Budget (Ms) $1,009.0 $1,032.0 $23.1 2.3% *
DFW Cost Center Net Revenues (Ms) $145.6 $164.0 $18.3 12.6%
Amount to DFW Capital Account (Ms) $87.5 $93.5 $6.0 6.8%
Airline Costs (Ms) $490.1 $501.5 $11.4 2.3%
Airline Cost Per Enplanement $13.24 $12.96 ($0.28) (2.1%)
* 1.4% excluding impact of transferring custodial responsibilities from AA to DFW.
The major changes in the FY 2020 Budget as compared to the FY 2019 Outlook can be
summarized by the following points:
1. Passengers – Total passenger traffic is budgeted at 75.7 million, a 3.4 million (4.6%)
increase and a record number of passengers. The budget reflects a full year of
American Airlines (AA) operating peak service of more than 900 daily operations which
began in June 2019. The increase in passengers positively impacts non-airline
revenues and Airline Cost Per Enplanement (CPE).
2. DFW to take-over Terminals A & C custodial services from AA – The FY 2020 Budget
includes $9.4 million in incremental funding ($7.5 million for services, plus 25% operating
reserve) for DFW to assume custodial operations for Terminals A & C from AA.
Although DFW’s budget will be increased, the net cost to AA is about the same since
they were paying for this service directly. It is expected that DFW management of
custodial services in all five terminals will have a positive impact on the Airport’s
customer experience and cleanliness metrics.
3. Funding strategic priorities with minimal budget increase – The total budget increase is
2.3% (1.4% if the new A & C custodial services are excluded). Although this is the
lowest increase in budget since FY 2011, the budget still includes $11.4 million for
strategic priorities (Safe and Secure, Customer Experience and Operational Excellence)
and $21.9 million for cost annualization and fixed contract increases. This was offset by
$15.5 million of management-identified cost savings and a net $9.2 million decrease in
debt service, primarily from refunding bond savings and reductions in debt service
coverage requirements.
4. DFW Cost Center net revenues – Net revenues from non-airline businesses are
budgeted to increase $18.3 million (12.6%) from the FY 2019 Outlook due to growth of
all business units except rental car. This will benefit (i.e., lower) landing fees and CPE
and put a record $93.5 million into the DFW capital account.
5. Airline Cost Per Enplanement (CPE) – DFW is projecting a decrease in CPE of $0.28 to
$12.96.
12 DFW International AirportFY 2020 Adopted Budget Executive Summary
Passengers
DFW projects a record number of passengers in FY 2020. The FY 2020 Budget for passengers
is 75.7 million, an increase of 3.4 million (4.6%) over the FY 2019 Outlook. The growth in
passengers is primarily due to the annualization of the growth of AA’s new service at DFW in FY
2019. AA leased the Terminal E satellite and grew operations from 830 peak flights a day in FY
2018 to over 900 peak flights in June 2019.
Originating passengers begin their trip at DFW. Destination passengers live elsewhere and fly to
DFW for business or leisure. People who travel through DFW to get to their final destination are
connecting passengers. Enplanements represent all passengers boarding a plane at DFW.
Changes in these passenger metrics are important because they are the key revenue drivers for
parking (originating passengers), concessions (enplanements) and rental car (destination
passengers) revenues. See further detailed explanations in the DFW Cost Center section.
FY19 FY20 Increase (Decrease)
Passengers (Millions) Outlook Budget Amount Percent
Origination 16.9 17.4 0.5 3.1%
Destination 13.3 13.6 0.3 2.0%
Connecting 42.2 44.7 2.6 6.1%
Total Passengers 72.4 75.7 3.4 4.6%
Enplanements 36.2 37.8 1.6 4.5%
International passengers are budgeted to increase to 9.7 million, 0.5 million (5.7%) over the FY
2019 Outlook. Landed weights are budgeted to increase 6.9% year over year primarily due to
American Airlines’ increase in operations and its use of new heavier airplanes.
FY 2020 Budget Comparisons and Walkforward
The table below compares the Expenditure Budget for the FY 2019 Budget, FY 2019 Outlook and
the FY 2020 Budget. The budget consists of operating expenses and debt service. The FY 2020
Budget is $1.032 billion, a $19.2 million (1.9%) increase over the FY 2019 Budget and a $23.1
million (2.3%) increase over the FY 2019 Outlook. Excluding the impact of transferring custodial
responsibilities from AA to DFW, the increase is $13.7 million (1.4%) from the FY 2019 Outlook.
The total budget request for the Cities of Dallas and Fort Worth includes $10 million of contingency
outside of the rate base. This contingency may only be accessed with Board approval.
FY20B v FY19B FY20B v FY19OL
FY19 FY19 FY20 Inc (Dec) Inc (Dec)
Annual Budget (in Millions) Budget Outlook Budget Amount Percent Amount Percent
Operating Expenses $500.7 $497.0 $529.3 $28.6 5.7% $32.3 6.5%
Gross Debt Service 512.2 511.9 502.8 (9.4) (1.8%) (9.2) (1.8%)
Total 102 Expenditures Budget $1,012.9 $1,009.0 $1,032.0 $19.2 1.9% $23.1 2.3%
Contingency O/S Rate Base 10.0
Total Budget w/Contingency $1,042.0
13 DFW International AirportFY 2020 Adopted Budget Executive Summary
Without the transfer of Terminals A & C custodial costs from AA, the operating expense budget
increase would be 4.7% and 4.6%, respectively, compared to FY2019 Budget and FY2019
Outlook. Debt service is lower due to the assumed savings from the FY 2019 Refunding Bonds
and changes in debt service coverage requirements. Following are some assumptions that were
used in preparing the FY 2020 Budget.
DFW to Assume Custodial Services in Terminals A & C – The budget invests an incremental
$9.4 million ($7.5 million plus a 25% operating reserve) in costs for custodial operations in
Terminals A & C. DFW is assuming these custodial responsibilities from AA. Note that this will
not result in a cost increase to AA since they were paying for these services directly in FY 2019.
This will allow better management of the total custodial operations and is expected to improve the
overall customer experience.
Strategic Priorities – The budget includes $11.4 million ($9.1 million plus the 25% operating
reserve) for strategic priorities, specifically for the key results of Safe and Secure, Customer
Experience and Operational Excellence. An incremental $3.3 million has been added for Safe
and Secure to increase security presence, improve security screening, and enhance the fire alarm
system. Customer Experience priorities include an additional $3.3 million for custodial increases
related to passenger growth and terminal contracts, as well as technology related to checkpoint
wait times and bus tracking. Operational Excellence has increased by $2.5 million to provide
funds for the Integrated Operations Center and developing innovation testing and a digital
strategy.
Budget Savings and Cost Reductions – The budget process included identifying cost savings
by division with a target reduction of 3%. The total budget savings identified in the FY 2020
budget is $15.5 million, 3.1% of the FY 2019 Outlook. Cost and budget reductions resulted from
reductions in contract labor, renegotiation of maintenance contracts, scope changes that will not
impact service levels, reductions in technology consulting, software maintenance, overtime, and
discontinuance of FY 2019 one-time projects.
Expense Walkforward – The following table summarizes the major changes in operating
expense between the FY 2019 Outlook and the FY 2020 Budget. Operating expenses increased
$32.3 million (5.5%) from the FY 2019 Outlook. Explanations of the changes in the walkforward
are addressed in the Operating Expenses section.
Operating Expenses (in Millions) Total
FY 2019 Outlook $497.0
Cost savings and budget reductions (15.5)
Strategic Priorities
A & C Custodial Transfer 7.5
Customer Experience 3.3
Safe and Secure 3.3
Operational Excellence 2.5
Salary/Benefits annualization and merit pool 14.7
Contract increases 7.2
Restore budgets 5.6
Other increases 3.7
Net increase 32.3
FY 2020 Budget $ 529.3
14 DFW International AirportFY 2020 Adopted Budget Executive Summary
Airline Cost
Airline cost represents the fees paid to DFW by the passenger and air cargo carriers, primarily for
landing fees and terminal rents. Cost per enplanement (explained below) is based solely on
passenger airline cost. The FY 2020 Airline Cost Budget is $501.5 million, $11.4 million (2.3%)
higher than the FY 2019 Outlook. If the A & C custodial costs are excluded, the increase would
be $2.0 million (0.4%) over the FY 2019 Outlook, the lowest increase in airline cost since FY
2011. Following is a walkforward of airline cost from the FY 2019 Outlook to the FY 2020 Budget.
Variances are explained in the Airline Cost Centers section.
Change in Airline Cost - $11.4 Million
$31.6
$501.5
$490.1 $1.4
($12.4) ($2.4)
($6.8)
FY19OL Decreased Threshold Airline Cost Transfer from Other Non- FY20B
Debt Service Adjustment Centers O&M DFW Cost Airline
Center Revenues
Passenger Airline Cost Per Enplanement
Cost Per Enplanement – CPE is the total passenger airline revenue (cost to the airlines) paid to
DFW divided by the number of enplaned passengers. CPE is a standard metric used by the
airline industry. Enplaned passengers is the denominator because it is a key revenue/cost driver
for the airlines; however, this is not the case for an airport. Airport costs are driven by the cost to
operate and maintain its facilities and runways. Notwithstanding this issue, DFW (and the
industry) use this indicator as a cost performance metric. CPE is budgeted to decrease 2.3%
because passengers are projected to grow faster (4.6%) than airline costs (2.3% increase).
Airline Cost per Enplanement
$16 $13.24 $12.96
$12
$8
$4
$0
FY19 Outlook FY20 Budget
15 DFW International AirportFY 2020 Adopted Budget Executive Summary
CPE Benchmarked to Other Airports – DFW’s strategic goal is to have a competitive CPE. The
following chart benchmarks DFW’s fully loaded CPE with the fully loaded CPE projections for
DFW’s competitive set of 17 large U.S. hub airports using the latest data available from Airports
Council International (ACI) surveys from FY 2018. Fully loaded cost is the most meaningful
comparison because it includes most of the costs incurred by airlines to operate at an airport,
including what they pay the airport (blue), what they pay directly for terminal maintenance and
terminal debt service (purple), an estimate of what costs the airlines incur for delay and taxiing
(orange) and an estimate for fuel taxes (yellow).
The graph on the following page illustrates that DFW is competitive from a cost standpoint
compared to AA’s other major hubs.
Fully Loaded C.P.E. - DFW 2018 vs Competitive Set
ATL 2.61 2.01 13.91 1.99 $20.52
PHX 6.26 0.27 13.56 0.77 $20.87 Cost on Airport Books
MSP 6.74 0.74 17.85 1.28 $26.61
Cost on Airlines' Books*
DEN 10.24 15.13 2.32 $27.69
Delay and Taxiing Cost**
SEA 10.79 16.59 3.13 $30.51
CLT 3.580.07 24.84 2.47 $30.96 DFW 2020
Fuel Tax
$32.37
DFW 12.90 1.15 18.41 $32.47
DTW 9.30 19.69 4.08 $33.06
Source: 2018 CPEs from ACI Survey, FAA CATS database, or directly from
airports. Delay and Taxiing Cost from A4A 2017 study and FAA ASPM.
IAH 11.29 2.00 20.07 $33.36
Other estimates from DFW Finance.
BOS 14.96 17.60 2.55 $35.11 * Estimated Maintenance and Debt Service cost paid directly by Airlines.
Additional direct airline CPE represents an estimate for airline-specific direct
DCA 11.60 22.41 1.25 $35.27 costs divided by enplanements. EWR, JFK, LAX, ORD amounts from 2013
Oliver Wyman study; ATL per Atlanta Department of Aviation.
MIA 19.20 14.39 2.51 $36.10
** Excludes gate delays, which are primarily due to airline actions.
SFO 17.77 15.66 4.92 $38.36
PHL 16.04 0.63 23.92 0.52 $41.11
LAX 16.75 6.00 15.21 5.29 $43.25
ORD 17.87 3.00 24.29 3.78 $48.93
EWR 26.17 6.00 20.82 0.75 $53.74
JFK 25.41 25.00 17.60 2.86 $70.88
$0 $10 $20 $30 $40 $50 $60 $70 $80
16 DFW International AirportFY 2020 Adopted Budget Executive Summary
DFW Cost Center Net Revenues
The following chart is a walkforward of DFW Cost Center (DFWCC) net revenues. The FY 2020
net revenues budget is $164.0 million, an $18.3 million (12.6%) increase from the FY 2019
Outlook. This represents the profit from non-airline businesses, such as parking, concessions,
rental car and commercial development.
Change in DFW Net Revenues - $18.3 Million
$3.2 $164.0
$15.7
($0.6)
$145.6
FY19 Outlook Increased Revenues Decrease in Net Debt Increased Operating FY20 Budget
Service Expenses
The following chart highlights the portion of DFWCC net revenues that are shared with the airlines
to reduce landing fees and the amount transferred to the DFW Capital Account. The Use
Agreement requires DFW to share 75% of revenues over the “upper threshold” of $70.0 million
(in FY 2020) with the airlines.
Net Revenues from DFW Cost Center
(Millions)
$70.5
$93.5
DFW Capital Account Shared with Airlines
In addition to the $70.5 million, the Use Agreement requires a terminal contribution from the DFW
Cost Center to reduce terminal rates. The terminal contribution for FY 2020 is $2.8 million. The
combined amount of $73.4 million reduces landing fees and terminal rates. The $73.4 million
share to the airlines in FY 2020 is an increase of $12.4 million compared to the FY 2019 Outlook.
17 DFW International AirportFY 2020 Adopted Budget Executive Summary
Revenues Overview
The table below summarizes revenues by cost center and compares the FY 2019 Outlook and
the FY 2020 Budget.
FY19 FY20 Increase (Decrease)
Millions Outlook Budget Amount Percent
Revenues
Airfield Cost Center $182.7 $191.8 $9.1 5.0%
Terminal Cost Center 398.9 414.6 15.8 3.9%
DFW Cost Center 395.8 411.5 15.7 4.0%
PFCs and Other 177.2 178.1 0.9 0.5%
Total Revenues $1,154.6 $1,196.0 $41.4 3.6%
FY 2020 Airfield Cost Center revenues increased $9.1 million (5%) due to increased operating
expenses reduced by higher DFWCC net revenues. FY 2020 Terminal Cost Center revenues
increased $15.8 million (3.9%) primarily due to increased terminal rentals necessary to recover
operating expenses including the Terminals A & C custodial transfer. FY 2020 DFWCC revenues
increased $15.7 million (4.0%) primarily due to higher parking, concessions, and commercial
development revenues. See Airline Cost Centers and DFW Cost Center sections for further
explanations.
A $4.50 Passenger Facility Charge (PFC) is collected from most enplaned revenue passengers
and is used to pay for debt service. Other Revenues relate to transfers from the Public Facility
Improvement Corporation (PFIC) to pay debt service associated with the Grand Hyatt Hotel and
rental car facility, plus transfers from the DFW Capital Account to pay for debt service associated
with the Terminal E garage and DFW’s headquarters facility.
Revenue and Expense Budget Exposures
Revenue Exposures – The FY 2020 revenue budget includes an estimated $6.3 million of
exposure items that could result in DFW not attaining its revenue budget targets.
Revenue Budget Exposures (in Millions)
Rental car revenues $3.0
Department of Public Safety (DPS) revenues 1.3
Parking revenues 1.0
Interest income 1.0
Total revenue exposures $6.3
There is revenue exposure for rental cars due to declines in average rental rates resulting from
the competitive impact of Transportation Network Companies (TNC) and other ride sharing
services. If rental car companies are unable to maintain pricing at current levels, percentage rent
paid to DFW will decrease. The Department of Public Safety’s revenue budget includes $1.3
million for a federal reimbursement program for law enforcement officers. There is no certainty
that Congress will continue to fund this program. Parking revenues are at risk if TNCs continue
to increase and parking utilization falls since average revenue per passenger is less for TNCs.
18 DFW International AirportFY 2020 Adopted Budget Executive Summary
The interest income budget assumes that interest rates remain at current levels. If the Federal
Reserve implements rate reductions, interest income may not achieve the budget.
Expense Exposures – The FY 2020 Budget includes incremental expenses for Terminals A & C
custodial costs previously incurred by AA, additional security, and other custodial and strategic
objectives. The incremental increases are largely based on cost estimates that are currently
known and passenger growth projections. However, if passenger growth is greater than expected
or if cost estimates increase due to rates, there is exposure for incremental cost. There are other
related cost exposures such as weather, inflation, regulatory, security and other items.
Because these exposures could result in cost increases, particularly with an increased focus on
customer experience for Terminals A & C, the CEO Contingency has been increased by $2.0
million to $6.0 million. The CEO contingency has been at $4.0 million for the past few years and
has been as high as $7.5 million. The budget includes an additional $10 million of Board-
controlled contingency (outside of the rate base) to mitigate additional operating expense
exposures or to fund new strategic priorities that arise during the fiscal year, especially if non-
airline revenues are higher than projected.
19 DFW International AirportFY 2020 Adopted Budget Airline Cost Centers
Airline Cost Centers
There are two airline cost centers, the
Airfield and the Terminal. The airlines pay
DFW landing fees to cover the net cost of
the airfield and terminal rents to cover the
net cost to operate and maintain the
terminals. At the end of each fiscal year,
DFW performs a reconciliation or true-up,
of actual costs paid and revenues received.
If there is a variance (i.e., if revenues
collected exceed or are lower than the
actual costs), then the Airport provides a
credit or adds an incremental charge in the
following fiscal year to settle the difference.
Airline Cost Walkforward
The following table is a walkforward of airline cost between the FY 2019 Outlook and the FY
2020 Budget.
Airline Cost Walkforward (in Millions) Total
FY 2019 Adjusted Outlook $490.1
Debt and Use Agreement Items
Debt Service (net of PFCs) (6.8)
Threshold Adjustment 1.4
Total Debt and Use Agreement (5.4)
Net Operating Expenses
Airline Cost Center O & M 31.6
Transfer from DFW Cost Center (12.4)
Terminal Contribution (0.0)
Other Non-Airline Revenues (2.4)
Total Net Operating Expenses 16.8
Total Increase 11.4
FY 2020 Budget 501.5
20 DFW International AirportFY 2020 Adopted Budget Airline Cost Centers
Summary of Airline Cost
The following table compares the summary of airline costs for the FY 2019 Outlook and the FY
2020 Budget. The 2.3% increase is the lowest airline cost increase since FY 2011 before DFW
started TRIP.
FY19 FY 20 Increase (Decrease)
Airline Revenue/Costs (in Millions) Outlook Budget Amount Percent
Landing Fees $112.2 $108.7 ($3.6) (3.2%)
Terminal Leases 317.9 331.9 14.0 4.4%
FIS Fees 26.5 27.6 1.1 4.1%
Turn Fees & Terminal Office Rents 32.8 32.7 (0.1) (0.2%)
Aircraft Parking 0.6 0.7 0.0 1.1%
Total Airline Revenue/Cost $490.1 $501.5 $11.4 2.3%
Airfield Cost Center
The table below compares the FY 2019 Outlook and the FY 2020 Budget for the Airfield Cost
Center. Note that revenues equal expenses in this cost center in both periods. Revenue variances
to the FY 2019 Outlook are explained below. See the Operating Expenses section for expenditure
variances.
FY 19 FY 20 Increase (Decrease)
Airfield CC (in Millions) Outlook Budget Amount Percent
Revenues
Landing Fees $112.2 $108.7 ($3.6) (3.2%)
Transfer from DFWCC 58.1 70.5 12.4 21.3%
Other 12.4 12.7 0.3 2.1%
Total Revenues 182.7 191.8 9.1 5.0%
Expenditures
Operating Expenses 99.8 109.2 9.4 9.4%
Net Debt Service 82.9 82.6 (0.3) (0.4%)
Total Expenditures 182.7 191.8 9.1 5.0%
Net Airfield Revenue $0.0 $0.0 $0.0 n/a
Landing Fee Revenues
The FY 2020 landing fees budget is $108.7 million, a decrease of $3.6 million (3.2%) from the FY
2019 Outlook due to the increase in the revenue sharing from the DFW Cost Center ($12.4 million)
net of an increase in total expenditures charged to the airfield ($9.1 million). The increase in
airfield operating cost is the result of increased operations headcount for airfield safety
management, DPS headcount increase for Airport security, and new costs associated with the
21 DFW International AirportFY 2020 Adopted Budget Airline Cost Centers
integrated operations center and the Airport’s innovation initiative. Airfield costs are also impacted
by an allocation of fixed increases for annualization, merit and other costs.
Other Airfield Revenues
The Airfield is a residual cost center with landing fees as the balancer. The following table
compares Airfield Cost Center revenues and expenditures for the FY 2019 Outlook and the FY
2020 Budget showing the landing fee revenues necessary to cover budgeted net airfield costs.
FY19 FY20 Increase (Decrease)
Airfield CC (in Millions) Outlook Budget Amount Percent
Expenditures
Operating Expenses $99.8 $109.2 $9.4 9.4%
Net Debt Service 82.9 82.6 (0.3) (0.4%)
Total Expenditures 182.7 191.8 9.1 5.0%
Revenues
Aircraft Parking 0.6 0.7 0.0 1.1%
Corporate Aviation 2.7 2.8 0.1 4.5%
Fuel Facility Ground Lease 5.7 5.7 0.0 0.0%
DPS 3.5 3.6 0.1 1.7%
Other (0.2) (0.1) 0.1 (37.6%)
Transfer from DFW Cost Center 58.1 70.5 12.4 21.3%
Revenues before Landing Fees 70.5 83.1 12.6 17.9%
Landing Fees $112.2 $108.7 (3.6) (3.2%)
Other airfield revenues include fees for aircraft parking, landing and other fees for the use of
DFW’s corporate aviation facility, ground lease payments for the fuel farm that is operated for the
airlines by a third party, and an allocation of DPS revenues.
Landing Fees and Landed Weights
The following charts compare landing fees and landed weights for the FY 2019 Outlook and the
FY 2020 Budget. The landing fee rate is assessed per 1,000 pounds of maximum approved
landed weight for each specific aircraft as certified by the FAA. Changes in landed weights will
not affect total landing fee revenues because DFW must charge the airlines collectively for the
cost to operate the airfield. Thus, an increase in landed weights will lower the average landing
fee rate and a decrease in landed weights will cause the landing fee rate to increase.
Signatory landing fees are budgeted at $2.23 in FY 2020, a $0.22 (9.0%) decrease from the
blended rate of $2.45 for the FY 2019 Outlook. Per the Use Agreement, non-signatory airlines
are assessed a rate that is 25% greater than signatory airlines. Non-signatory landed weights
are only 0.5% of total weights in FY 2020.
Landed weights are budgeted for 48.9 billion in FY 2020, a 3.2 billion (6.9%) increase over the
FY 2019 Outlook. The increase is primarily driven by AA’s increase in daily operations and a
larger aircraft mix.
22 DFW International AirportFY 2020 Adopted Budget Airline Cost Centers
Landing Fee Rates (per 1,000 pounds) Landed Weights
(in Billions)
$3.00 $2.45 52.0
$2.50 $2.23 48.9
$2.00 49.0
$1.50 45.7
46.0
$1.00
$0.50 43.0
$0.00 40.0
FY19OL FY20B FY19OL FY20B
Cargo
DFW Airport is increasingly recognized
as an outstanding cargo gateway,
providing direct access to the fast-
growing Sunbelt region and acting as an
attractive connecting point for cargo
flowing between Asia and Latin America.
The Airport’s prime location allows
assorted cargo to reach millions of U.S.
customers by road, while also reaching
several continents by plane in a matter
of hours. From DFW, 98% of the
continental U.S. population can be
reached via truck within 48 hours.
Approximately 9.7% of all landing fees
are budgeted to come from cargo aircraft
for the FY 2020 Budget.
DFW continues to grow its cargo business, with projections to achieve 952,000 tons of cargo in
FY 2019 (+4.5% YOY), and 987,000 tons in FY 2020 (+3.6% YOY). DFW has outsized exposure
to Asia, and the continuing trade disputes are an ongoing risk to our ability to grow cargo volumes.
Cargo Tonnage
FY (US tons) Change Percent
2018 911,000
2019 952,357 41,357 4.5%
2020 986,743 34,386 3.6%
23 DFW International AirportFY 2020 Adopted Budget Airline Cost Centers
Terminal Cost Center
The table below compares the FY 2019 Outlook and the FY 2020 Budget for the Terminal Cost
Center. Note that revenues equal expenses in this cost center in both periods. Revenue
variances between the FY 2020 Budget and the FY 2019 Outlook are explained below. See the
Operating Expense section for expenditure variations.
FY19 FY20 Increase (Decrease)
Terminal CC (in Millions) Outlook Budget Amount Percent
Revenues
Operating Revenue
Terminal Leases $317.9 $331.9 $14.0 4.4%
FIS Fees 26.5 27.6 1.1 4.1%
Turn Fees & Office Rents 32.8 32.7 (0.1) (0.2%)
Other 21.6 22.4 0.8 3.6%
Total Operating Revenue 398.9 414.6 15.8 3.9%
DFW Terminal Contribution 2.8 2.8 0.0 0.3%
Total Revenues 401.7 417.5 15.8 3.9%
Expenditures
Operating Expenses 217.2 239.4 22.3 10.3%
Net Debt Service 184.6 178.0 (6.5) (3.5%)
Total Expenditures 401.7 417.5 15.8 3.9%
Net Terminal Revenue $0.0 $0.0 $0.0 n/a
The FY 2020 Terminal Lease budget is $331.9 million, a $14.0 million (4.4%) increase from the
FY 2019 Outlook due primarily to higher operating costs charged to the terminals partially offset
by a decrease in net debt service. Operating expenses increased $22.3 (10.3%) million due
primarily to the transfer of custodial responsibility from AA to DFW ($9.4 million). The remaining
increase is due to other custodial increases for customer experience and a portion of DPS
headcount increase for airport security, an increase in the integrated operations center and
innovation initiatives, and an allocation of salary and contract annualization, merit and other costs.
The decrease in debt service is primarily due to savings from the Series 2019A Refunding bonds
and a change in coverage needs for FY 2020, partially offset by incremental debt service and
coverage to interim finance the FY 2020 Capital Program.
Total terminal operations, maintenance and debt
service costs, including utilities for the five
terminals, are divided by leasable square feet to
calculate an average lease rate per square foot.
American Airlines pays directly for the
maintenance costs of Terminals A, C, and E
Satellite and six jet bridges in Terminal B. These
costs are added into the numerator of this formula
to derive the fully loaded average rate. American
Airlines receives a rent credit for their costs. This
credit of $37.6 million was reduced by $7.2 million
in FY 2020 due to the transfer of custodial responsibility.
24 DFW International AirportFY 2020 Adopted Budget Airline Cost Centers
Average Terminal Rents before Credits
Total terminal leased square footage increased in FY 2020 to 1.204 million square feet
from 1.157 million square feet in FY 2019 due to American Airlines leasing the Terminal
E satellite facility. This caused terminal rental rates to fall from $310 per square foot to
$307 per square foot, despite a $14 million increase in net terminal expenses. The
following chart compares average terminal rents before credits for the FY 2019 Outlook
and the FY 2020 Budget.
Average Terminal Rents before Credits
per square foot
$350 $310 $307
$300
$250
$200
$150
$100
$50
$0
FY19OL FY20B
Federal Inspection Services (FIS) Fees
Costs are allocated to the FIS based on its percent share of terminal square footage. The FIS
budget for FY 2020 is $27.6 million, a $1.1 million (4.1%) increase from the FY 2019 Outlook. The
FY 2020 rate is based upon terminal costs excluding new debt service. The rate for FIS per
international passenger clearing customs at DFW is budgeted at $6.30 for FY 2020 compared to
$6.61 for the FY 2019 Outlook, a decrease of $0.31 (4.7%). DFW expects 4.4 million International
FIS passengers in FY 2020 compared to 4.1 million in FY 2019. FIS passengers do not include
arriving passengers from countries where passengers clear U. S. Customs in that country (e.g.,
Canada).
Turn Fees and Office Rents
Turn fees are paid by airlines for common use gates in Terminals D and E in lieu of permanently
renting space. Per the terms of the Use Agreement, turn fee rates must change at the same
percentage as terminal lease rates. The turn fees budget for FY 2020 is $28.7 million, a $0.2
million (0.5%) decrease from the FY 2019 Outlook.
Other Terminal Revenues
Other terminal revenues include TSA rents, concessions O & M reimbursements, catering fees
and allocable miscellaneous DPS revenues. Concessionaires are required to reimburse the
Airport (for Terminals B, D and E) and American Airlines (for Terminals A and C) for the allocated
maintenance cost per square foot of the terminals.
Transfers - DFW Terminal Contribution
Per the terms of the Use Agreement, DFW pays for a portion of the terminal cost based on DFW’s
proportionate share of expenses for common use and vacant space in the terminals. From a cost
center standpoint, this contribution is shown as a source of cash in the Terminal Cost Center and
a use of cash for the DFW Cost Center. DFW can reduce its contribution to the Terminal Cost
25 DFW International AirportFY 2020 Adopted Budget Airline Cost Centers
Center by leasing more space to other airlines or tenants, increasing common use turn fees, and
by reducing costs in the terminals. The DFW terminal contribution is $2.8 million, which is flat to
the FY 2019 Outlook.
Cost Per Enplanement (CPE) Calculation
The following table shows the passenger airline cost per enplanement calculation and compares
the CPE for the FY 2019 Outlook and the FY 2020 Budget. This KPI only includes passenger-
related airline revenues (i.e., costs) and excludes cargo and general aviation revenues.
FY19 FY20 Increase (Decrease)
Cost Per Enplanement (in Millions) Outlook Budget Amount Percent
(1)
Enplanements 36.2 37.8 1.6 4.5%
Passenger Airline Cost per Enplanement
Airline Cost/Revenue $490.1 $501.5 $11.4 2.3%
Less: Cargo (11.6) (10.9) 0.7 (6.4%)
Total PAX Airline Revenue 478.5 490.7 12.2 2.5%
(2)
Cost per Enplanement (CPE) $13.24 $12.96 ($0.28) (2.1%)
1
Corporate Aviation enplanements are excluded from CPE calculation
2
Actual rates, not in millions
26 DFW International AirportFY 2020 Adopted Budget DFW Cost Center
DFW Cost Center
The table below compares the FY 2019 Outlook and the FY 2020 Budget for the DFW Cost
Center. Revenue variances are explained in the rest of this section. Expenditure variances are
covered in the Operating Expenses section.
DFW Cost Center Net Revenues are increasing $18.3 million (12.6%) in FY 2020. This net
revenue is shared between the airfield cost center and the DFW Capital Account. To lower
landing fees, 75% of net revenues in excess of the “upper threshold” of $70.0 million are
transferred to the airfield cost. The remaining net revenues of $93.5 million are transferred to the
DFW Capital Account.
FY19 FY20 Increase (Decrease)
DFW Cost Center (in Millions) Outlook Budget Amount Percent
Revenues
Parking $178.0 $181.4 $3.4 1.9%
Concessions 78.0 83.1 5.1 6.5%
Advertising 14.3 14.6 0.3 2.4%
Rental Car (RAC) 33.6 33.3 (0.3) (0.9%)
Commercial Development 50.1 55.3 5.2 10.5%
Subtotal 353.9 367.7 13.8 3.9%
Employee Transportation 16.9 18.4 1.4 8.4%
Utilities & Miscellaneous 8.8 8.7 (0.1) (1.4%)
DPS 1.6 1.6 (0.0) (1.5%)
Interest Income 14.5 15.1 0.6 4.5%
Total Revenues 395.8 411.5 15.7 4.0%
Expenditures
Operating Expenses 143.5 146.9 3.4 2.3%
Net Debt Service 61.9 58.9 (3.0) (4.8%)
Total Expenditures and Debt Service 205.4 205.8 0.4 0.2%
Gross Margin - DFW Cost Center 190.4 205.7 15.4 8.1%
Less: Terminal Contribution 2.8 2.8 0.0 0.3%
Less: Skylink 41.9 38.9 (3.0) (7.2%)
DFW Cost Center Net Revenues $145.6 $164.0 $18.3 12.6%
Transfer to Airfield Cost Center* 58.1 70.5 12.4 21.3%
Amount to DFW Capital Account 87.5 93.5 6.0 6.8%
Allocation of DFWCC Net Revenues $145.6 $164.0 $18.3 12.6%
* Threshold Adjustment
27 DFW International AirportYou can also read