Pedigree-based and phylogenetic methods support surprising patterns of mutation rate and spectrum in the gray mouse lemur
←
→
Page content transcription
If your browser does not render page correctly, please read the page content below
www.nature.com/hdy

ARTICLE
Pedigree-based and phylogenetic methods support surprising
patterns of mutation rate and spectrum in the gray mouse
lemur
C. Ryan Campbell1,2,8, George P. Tiley 1,8, Jelmer W. Poelstra1, Kelsie E. Hunnicutt                           1,6
                                                                                                                     , Peter A. Larsen1,7, Hui-Jie Lee       3
                                                                                                                                                                 ,
                                                          ✉
Jeffrey L. Thorne4, Mario dos Reis 5 and Anne D. Yoder1

© The Author(s), under exclusive licence to The Genetics Society 2021

    Mutations are the raw material on which evolution acts, and knowledge of their frequency and genomic distribution is crucial for
    understanding how evolution operates at both long and short timescales. At present, the rate and spectrum of de novo mutations
    have been directly characterized in relatively few lineages. Our study provides the first direct mutation-rate estimate for a
    strepsirrhine (i.e., the lemurs and lorises), which comprises nearly half of the primate clade. Using high-coverage linked-read
    sequencing for a focal quartet of gray mouse lemurs (Microcebus murinus), we estimated the mutation rate to be among the highest
    calculated for a mammal at 1.52 × 10⁻⁸ (95% credible interval: 1.28 × 10⁻⁸–1.78 × 10⁻⁸) mutations/site/generation. Further, we
    found an unexpectedly low count of paternal mutations, and only a modest overrepresentation of mutations at CpG sites. Despite
    the surprising nature of these results, we found both the rate and spectrum to be robust to the manipulation of a wide range of
    computational filtering criteria. We also sequenced a technical replicate to estimate a false-negative and false-positive rate for our
    data and show that any point estimate of a de novo mutation rate should be considered with a large degree of uncertainty. For
    validation, we conducted an independent analysis of context-dependent substitution types for gray mouse lemur and five
    additional primate species for which de novo mutation rates have also been estimated. These comparisons revealed general
    consistency of the mutation spectrum between the pedigree-based and the substitution-rate analyses for all species compared.

    Heredity (2021) 127:233–244; https://doi.org/10.1038/s41437-021-00446-5

INTRODUCTION                                                                                Approaches for estimating rates of genomic change in
Spontaneous germline mutations are errors that occur as DNA is                           vertebrates generally fall into one of two categories: phylogenetic
transmitted from parent to offspring in sexually reproducing                             (indirect) versus pedigree-based (direct) estimation. While phylo-
organisms. The accrual of these errors, often referred to as de                          genetic methods have been the standard for many years, recent
novo mutations, provides not only the raw material for evolution                         developments in sequencing technology have made whole-
but can also serve as a means for measuring evolutionary time                            genome sequencing widely accessible and pedigree-based
along phylogenies (Kimura and Ohta 1971; Langley and Fitch                               approaches are now increasingly being used to estimate de novo
1974; Zuckerkandl and Pauling 1965). The rate at which these                             rates for nonmodel species. By comparing the genomes of
mutations are introduced into genomes is thus a crucial metric of                        individuals with known genealogical relationships—typically,
evolution at the genomic level, as well as a measure of                                  parent to offspring—investigators can count mutations as they
fundamental biological processes (Kondrashov and Kondrashov                              appear in single-generation transmissions (Feng et al. 2017; Koch
2010). By characterizing mutation-rate variation across the                              et al. 2019; Pfeifer 2017; Scally and Durbin 2012; Smeds et al. 2016;
genome and between generations, we may be able to shed light                             Thomas et al. 2018). Phylogenetic approaches, on the other hand,
on the impacts of biological processes such as sex and parental                          use external calibrations such as fossils or geological events to
age biases. Ultimately, by quantifying the variation in de novo                          obtain substitution rates in units of absolute time (Drummond
mutation rates across the tree of life, we can refine hypotheses                          et al. 2006; Sanderson 2002; Thorne and Kishino 2002; Thorne
regarding the relationship between mutation rates and life-history                       et al. 1998). Phylogenetic studies work from the fundamental
characteristics (Agarwal and Przeworski 2019; Fazalova and                               assumption that the rate at which substitutions accumulate
Nevado 2020; Garimella et al. 2020; Wang et al. 2020; Wu et al.                          between species at putatively neutral sites is equal to the de novo
2020).                                                                                   mutation rate (Kimura 1983). If this assumption holds, pedigree-

1
 Department of Biology, Duke University, Durham, NC, USA. 2Department of Evolutionary Anthropology, Duke University, Durham, NC, USA. 3Department of Biostatistics and
Bioinformatics, Duke University, Durham, NC, USA. 4Bioinformatics Research Center, North Carolina State University, Raleigh, NC, USA. 5School of Biological and Chemical
Sciences, Queen Mary University of London, London, UK. 6Present address: Department of Biological Sciences, University of Denver, Denver, CO, USA. 7Present address:
Department of Veterinary and Biomedical Sciences, University of Minnesota, St. Paul, MN, USA. 8These authors contributed equally: C. Ryan Campbell, George P. Tiley Associate
editor Armando Caballero ✉email: anne.yoder@duke.edu

Received: 20 May 2020 Revised: 25 May 2021 Accepted: 26 May 2021
Published online: 16 July 2021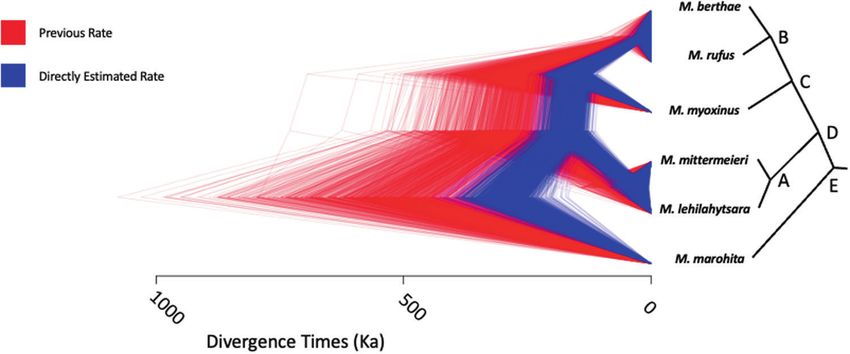
C.R. Campbell et al.
                  234
                         Table 1.     Directly estimated mammalian de novo mutation rates.
                        Species                                             Common name                             Citation                                          Ratea
                                          b
                        Homo sapiens                                        Human                                   Jonsson et al. (2017)                             1.29
                        Pan troglodytes                                     Chimpanzee                              Venn et al. (2014)                                1.2
                                                                                                                    Tatsumoto et al. (2017)                           1.48
                                                                                                                    Besenbacher et al. (2019)                         1.26
                        Gorilla gorilla                                     Gorilla                                 Besenbacher et al. (2019)                         1.13
                        Pongo abelii                                        Orangutan                               Besenbacher et al. (2019)                         1.66
                        Chlorocebus sabaeus                                 Green Monkey                            Pfeifer (2017)                                    0.94
                        Papio anubis                                        Baboon                                  Wu et al. (2020)                                  0.57
                        Macaca mulatta                                      Rhesus Macaque                          Wang et al. (2020)                                0.58
                                                                                                                    Bergeron et al (2020)                             0.77
                        Aotus nancymaae                                     Owl Monkey                              Thomas et al. (2018)                              0.81
                        Mus musculus                                        House Mouse                             Lindsay et al. (2019)                             0.54
                        Canis lupus                                         Wolf                                    Koch et al. (2019)                                0.45
                        Felis catus                                         Domestic Cat                            Wang et al. (2021)                                0.86
                        Bos taurus                                          Cow                                     Harland et al. (2017)                             1.17
                        Ornithorhynchus anatinus                            Platypus                                Martin et al. (2018)                              0.7
                         ×10−8 mutations per site per generation.
                         a
                         b
                         Many more studies exist than can be listed here.
1234567890();,:

                        based and phylogenetic methods should in principle produce                   The mistaken identity of somatic mutations for de novo germline
                        equivalent estimates of the rate of evolution.                               mutations (Li 2014), which can occur at a non-negligible rate
                           Phylogenetic methods for estimating rates of evolution are                (Muryas et al. 2020), can also be the consequence of the tissues
                        known to suffer from various sources of uncertainty, however,                sampled for genomic comparisons. Because the number of de novo
                        including violation of the molecular clock (Thorne et al. 1998),             mutations produced in a single generation can be difficult to
                        inaccuracies in external calibration points (Benton and Donoghue             differentiate from erroneous variant calls, stringent variant filtering
                        2007), incomplete lineage sorting (Angelis and dos Reis 2015), and           is applied. While necessary, true mutations can be missed (i.e., false
                        the difficulties of recovering multiple overlapping changes (i.e.,            negatives can also be common), and the mutation rate can be
                        “multiple hits”) at any given site (Felsenstein 1981). Although a            under- rather than overestimated (Scally 2016). Thus, studies that
                        number of solutions to these problems have been proposed (Heath              attempt to accurately estimate de novo rates must deal with a high
                        et al. 2014; Ogilvie et al. 2017), some limitations such as sampling         probability of detecting false positives as well as false negatives
                        biases or an absence of fossils are difficult to overcome (Herrera and        (Segurel et al. 2014).
                        Davalos 2016; Magallon and Sanderson 2005; Near et al. 2005).                   In this study, we utilize two strategies for minimizing both false-
                        Pedigree-based mutation-rate estimates are not affected by the               negative and false-positive rates. First, linked short reads from 10x
                        same complications and can help characterize variation among                 Genomics (Weisenfeld et al. 2017) provide improved mapping and
                        different types of mutations (Harris and Pritchard 2017) or among            increased accuracy of individual variant calls (Long et al. 2016;
                        different regions of the genome (Segurel et al. 2014). Previously,           Winter et al. 2018), especially in repeat-rich mammalian genomes
                        these estimates have relied on well-assembled genomes available              (Chaisson et al. 2015). In addition, the phasing information
                        only in model organisms (Jonsson et al. 2017; Scally and Durbin              provided by linked reads can determine the parent-of-origin with
                        2012; Uchimura et al. 2015; Venn et al. 2014), and have therefore            just two generations of sequencing. Phased haplotypes with
                        been limited in taxonomic scope. For example, mutation-rate                  known parental origin then allow individual mutations to be
                        estimates within mammals are dominated by primates (Table 1).                assigned to either the maternal or paternal germline. We
                        Fortunately, recent genome assembly strategies (Rhie et al. 2020)            estimated the callable fraction of our genome using two
                        have enabled chromosome-level assemblies of nonmodel organ-                  approaches. The first was based on variant filtering criteria, while
                        isms, including mouse lemurs (Larsen et al. 2017), and pedigree-             the second introduced synthetic mutations to the sequencing
                        based mutation-rate estimation is now feasible for virtually any             data for one individual and evaluated the accuracy of our
                        species, as long as related individuals with known pedigrees are             bioinformatic pipeline in recovering these mutations (Keightley
                        available (Feng et al. 2017; Harland et al. 2017; Koch et al. 2019;          et al. 2015; Xie et al. 2016). Although the use of synthetic
                        Martin et al. 2018; Pfeifer 2017; Smeds et al. 2016).                        mutations recovered by mutation-calling pipelines has typically
                           These advantages notwithstanding, pedigree-based studies also             been applied to estimating false-negative rates (Bergeron et al.
                        face substantial challenges. Perhaps foremost among them is the              2020; Keightley et al. 2015; Koch et al. 2019; Pfeifer 2017; Wu et al.
                        fact that mutation rates are orders of magnitude lower than the              2020; Xie et al. 2016), callable sites and false-negative rates are not
                        sequencing error rate, even for the most accurate sequencing                 independent of each other (i.e., determining low-coverage sites as
                        methods. Furthermore, while de novo mutations are biologically               not callable will also remove a majority of false negatives). Here,
                        distinct from somatic mutations, it can be hard to differentiate the         we show that the two callable site estimators yield similar
                        two because new mutations can occur at any stage of embryonic                mutation rates. To estimate a false-negative and false-positive rate
                        development post fertilization (especially during the earliest cell          for our data, we sequenced a technical replicate of the father in
                        divisions when mutagenesis is highly likely), and thus can affect            our pedigree and show that any point estimate of a de novo
                        both somatic and germline cells in the developing embryo.                    mutation rate should be considered with a large degree of

                                                                                                                                                Heredity (2021) 127:233 – 244
C.R. Campbell et al.
                                                                                                                                                                      235
uncertainty. Last, we illustrate how the adjustment of key variant                  technical replicate. Libraries were sequenced at the Duke Center for Genomic
filtering steps, such as the number of callable sites and allelic                    Computational Biology (GCB) Sequencing and Genomic Technology Shared
balance, can affect the final rate estimate, whereas many features                   Resource across nine lanes of a HiSeq 4000. Paired-end sequencing of 150
of the mutation spectrum are robust to likely variant calling errors.               basepair reads was performed with an average insert size of 554 bp (range:
   We applied these sequencing and computational methods to                         527–574 bp). A single lane was run as a test of the 10x Genomics
                                                                                    LongRanger analysis software and was analyzed to confirm successful
produce the first pedigree-based mutation-rate estimate for a                        indexing and preparation of the samples. Next, the remaining eight libraries
strepsirrhine primate, the gray mouse lemur (Microcebus murinus).                   were multiplexed across eight lanes of a single flowcell. Over 933 Gb were
Mouse lemurs comprise a radiation of morphologically cryptic                        generated across nine libraries and nine lanes. Sequencing data are available
primates distributed throughout Madagascar (Setash et al. 2017).                    through NCBI’s SRA database (SRR10130788-SRR10130796).
Numerous studies have suggested that their rapid speciation
dynamics may reflect climatic change through time in Madagascar                      10x Genomics pipeline
(Andriatsitohaina et al. 2019; Poelstra et al. 2021; Setash et al.                  Basecall files were demultiplexed and analyzed using 10x Genomic’s
2017) and that their unique life-history characteristics make them                  LongRanger v2.2.1 pipeline. Average genomic coverage after filtering was
an ideal genetic model organism (Ezran et al. 2017; Hozer et al.                    34.5× across the nine samples. Sequences were aligned to the reference
2019). Thus, an accurate mutation-rate estimate for these                           gray mouse lemur genome assembly (mmur3.0, GCF_000165445.3) and
organisms can potentially yield valuable insight into both                          variant calling was performed using GATK v3.8 (McKenna et al. 2010; Van
geological and biological phenomena. Even though previous                           der Auwera et al. 2013), implemented within LongRanger v2.2.1 (Weisenfeld
divergence time studies exist, they have had to rely on either                      et al. 2017). The mean N50 scaffold length, across samples, generated by
phylogenetic methods, wherein only distantly related external                       the 10x Genomics LongRanger alignment pipeline, was 1.18 Mb.
fossil calibrations are available (dos Reis et al. 2018; Yang and
Yoder 2003), or on pedigree-based mutation-rate estimates from                      DeNovoGear
distant relatives (Yoder et al. 2016). Notably, fossil-calibrated                   LongRanger alignments were used to find de novo mutations within the
phylogenetic and pedigree-based approaches have yielded highly                      offspring in the focal family. Several methods were used to find mutations.
                                                                                    First, DeNovoGear v1.1.1 (Ramu et al. 2013) was used to analyze the
divergent age estimates further emphasizing the need for
                                                                                    LongRanger variant call files with default settings. VarScan2 v2.4.3 was run
accurate estimates of de novo rates in mouse lemurs, and more                       with the LongRanger binary alignment files and the resulting variants were
generally, in other recently radiated groups wherein divergence                     intersected with the de novo mutations found with DeNovoGear. Only
time estimation may be problematic (Tiley et al. 2020).                             mutations found by both approaches were retained.
   By estimating the mutation rate in mouse lemurs with a pedigree-                    De novo mutations were inferred separately with each replicate library
based approach, we aim to simultaneously expand our knowledge of                    from the sire, and mutations that differed by sire replicate were used to
mutation-rate variation across lineages and to facilitate the estima-               estimate both the false-positive and false-negative rates (see Supple-
tion of divergence times within the mouse lemur radiation                           mentary Methods: Variant calling’s effect on de novo mutation rate
specifically. To do so, we deeply sequenced a pedigree of gray                       estimation). Finally, we checked whether alleles produced by the inferred
mouse lemurs, including a focal quartet of mother, father, and two                  de novo mutations were absent in the nonquartet samples and in
                                                                                    existing data from a sequenced diversity panel of gray mouse lemurs
offspring, to accurately identify de novo mutations and to assign                   (NCBI SRA:SRP045300). The final list of mutations was filtered for de novo
mutations to their parent-of-origin. We found a relatively high                     quality in the offspring (de novo quality of at least 100), offspring
mutation rate, an unexpectedly low rate of transitions at CpG sites,                mapping quality (mapping quality of at least 50), for at least 10× depth of
and a weak paternal sex bias compared with other primates. Given                    coverage in both parents, less than 85× depth (2.5-fold increase over
the surprising nature of these results, we take care to discuss                     average coverage) in the offspring, and allelic balance of >0.30 and
C.R. Campbell et al.
236
callable autosomal and X-chromosome sites (gca and gcx). The denominator tree are available through Dryad. Posteriors were analyzed in R v3.6.3 with
of each weighted average was multiplied by the number of haplotype the package CODA (Plummer et al. 2006).
genomes tested; for autosomes, the number was four, but for X The same subsampled alignments were used to estimate substitution
chromosomes, only three were tested as one offspring was male and the rates for nine context-dependent substitution types (Table S2) following
other female. After determining the weighted average, we made a direct the method in (Lee et al. 2015). This method characterizes dinucleotide
adjustment for the estimated amount of false-positive (fp) and false-negative sites by integrating over uncertainty in substitution history for each site
(fn) mutations. We subtracted the number of raw mutations by the estimated based on a sample of stochastic character maps. Substitution histories for
number of false positives and added the estimated number of false each site were generated with PhyloBayes MPI v1.8 (Lartillot et al. 2013)
negatives (Eq. (1), see also Supplementary Methods: De novo mutation rate under the CAT–GTR model (Lartillot and Philippe 2004). In total,
calculation). These corrections assumed that the variants not shared by our 5000 samples were collected for two chains for each subsampled
two technical replicates were equally contributed to by false positives and alignment while sampling every five generations. The first 1000 samples
false negatives (see Supplementary Methods: Variant calling’s effect on de were discarded as burn-in. A total of 15 stochastic mappings were
novo mutation rate estimation), although it is possible to weight the effects collected for each site. These were used to compute the
of false positives and negatives on erroneous variants differently. variance–covariance matrices for the nine substitution types and
approximate the likelihood surface of Bayesian relaxed-clock model.
ga ðm1a þ m2a Þ fp þ fn gx ðm1x þ m2x Þ fp þ fn MULTIDIVTIME (Thorne et al. 1998) was then used to estimate absolute
þ (1) rates of evolution for each substitution type under an autocorrelated
g 4 gca g 3 gcx
model (Thorne and Kishino 2002) with calibrations in Table S1. MULTI-
DIVTIME analyses collected 10,000 posterior samples for two chains,
sampling every 10,000 generations after a 10-million-generation burn-in.
Parent-of-origin Rate posteriors were evaluated for convergence and combined.
Phased variant call files produced by LongRanger were used to assign
mutations to a maternal or paternal chromosome. In brief, these methods
took input of the three family individuals and a mutation location. The Comparing mutation and substitution rates across species
surrounding haplotype that contained the mutation was directly compared Because the de novo mutation rate should, in theory, be equivalent to the
with the parental haplotypes at the same location to determine a match. neutral substitution rate, we compared the mouse lemur mutation rate
As these individuals are all genetically related members from a single along with previously published third-codon position substitution-rate
colony, dam and sire often shared similar haplotypes. When the mutation- estimates from a recent study of primate divergence times (dos Reis et al.
bearing haplotype was found in both parents, a parent-of-origin was not 2018). For species with a published per-generation de novo mutation rate,
assigned, resulting in T transitions at non-CpG based on estimates of mouse (genus, Mus) and human mutation rates, and
and CpG sites. First, we downloaded high-coverage mammalian whole- (2) using the new estimates of the de novo rate generated by this study.
genome alignments from Ensembl (ftp://ftp.ensembl.org/pub/current_emf/
ensemblcompara/multiple_alignments/46_mammals.epo/; last accessed
February 2020). Analyses used alignments that included seven taxa: Mus
musculus, Microcebus murinus, Callithrix jacchus, Chlorocebus sabaeus, Pongo RESULTS
abelii, Pan troglodytes, and Homo sapiens. The M. murinus reference genome Estimating the gray mouse lemur mutation rate
used in the whole-genome alignment was the same version used for calling We assessed 4,542,770 potential variants across eight related
mutations (Larsen et al. 2017). Sites that mapped to protein-coding genes individuals to discover 107 de novo mutations in two focal
and CpG islands based on human gene features were removed. Data offspring (Fig. S2), which was reduced to 92 after filtering for allele
processing was done with Perl scripts available through Dryad. We balance (Fig. 1). Among these 92 mutations, 87 (46 in Floretta and
randomly sampled ten one-megabase lengths of concatenated alignment 41 in Texas Pete) were located on autosomes and five (four in
to keep analyses computationally tractable. Floretta and one in Texas Pete) were located on the X
We first estimated context-independent substitution rates. Branch
chromosome. The average depth of coverage in the quartet for
lengths were optimized by maximum likelihood with the baseml program
in PAML v4.8j (Yang 2007) using the HKY + gamma model. The the 92 mutations was 59 reads (SD = 14.61). Our estimation of
approximate likelihood method (dos Reis and Yang 2011) was used to callable sites with synthetic mutations, similar to previous efforts to
estimate absolute rates of evolution with fossil calibrations on all nodes account for false-negative results (Keightley et al. 2015; Xie et al.
(Table S1) that follow “calibration strategy A” from dos Reis et al. (2018). 2016), detected 798 of 952 mutations on autosomes and 38 of 48
For each subsample, we ran four MCMC chains that discarded the first mutations on the X chromosome. Therefore, we estimate our
50 million generations as burn-in and kept 10000 posterior samples for detection rate to be 83.8% on autosomes and 79.2% on the X
every 50,000 generations. Input alignments, control files, and the species chromosome, which yields a total of 2.075 billion callable sites (out
Heredity (2021) 127:233 – 244C.R. Campbell et al.
237
of a total genome size of 2.487 billion). When using depth-based that are due to false negatives and could be close to 1.28 × 10⁻⁸ if the
criteria for determining callable sites, we estimated that between contributions of false negatives are actually small (Fig. S7). This rate is
88.9 and 62.2% of sites were callable for our quartet at 10× and also a median when considering depth filters on callable sites
25× depth, respectively (Fig. 2). Thus, the number of callable sites between 10× and 25× depth (Fig. 2).
was sensitive to depth criteria, although the number of de novo
mutations was not. The number of de novo mutations was The mouse lemur mutation spectrum
sensitive to filtering on allelic balance (Figs. 2 and S2). Most From the pedigree-based estimate of the mutation spectrum, a ratio
mutations that passed our filters appeared to be free of technical of transitions to transversions (Ti:Tv) was estimated to be 0.96 (45
artifacts such as poor alignment of repeat-rich regions upon visual transitions and 47 transversions). The ratio of strong-to-weak
inspection (Figs. S3–S5). Although some mutations at higher mutations (SW; C/G>A/T) to weak-to-strong mutations (WS; A/T>C/
depths appear suspect as potential paralogous alignments (Fig. S6), G), SW:WS, was estimated to be 1.24 (41 SW and 33 WS mutations).
only ten mutations are between 2 and 2.5 times the average The most common two categories of de novo mutation type were
sequencing depth and there are no apparent systemic biases in A>G and C>T (Fig. 3A). Eight mutations were detected at parental
mutation type among them (additional data available on Dryad).
Based on an error rate of 0.021 from the number of variants unique
to the two technical replicates, and assuming errors are caused
equally by false positives and false negatives, we calculated 3.42 false
positives and 34.46 false negatives from the total of 92 de novo
mutations and 2.088 billion callable mutation sites. In an attempt to
generate a more accurate estimate of the de novo mutation rate, we
adjusted our raw rate (1.14 × 10⁻⁸) by accounting for the estimated
false positives and false negatives, to arrive at a final rate estimate of
1.52 × 10⁻⁸ mutations per-site per-generation (95% credible interval:
1.28 × 10⁻⁸–1.78 × 10⁻⁸). This estimate is sensitive to assumptions
about the proportion of unique variants between technical replicates
Fig. 3 Mutation spectrum of the gray mouse lemur. A Counts of
de novo mutations from the pedigree analysis. Mutation types are
broken down by weak-to-strong transversions (A>C and T>G), weak-
Fig. 1 Focal family quartet. Parents (P) and offspring (O) are to-strong transitions (A>G and T>C), weak-to-weak transversions
subscripted as male (m) or female (f ). Lines represent familial (A>T and T>A), strong-to-weak transversions (C>A and G>T), strong-
relationships as in a traditional pedigree, with thickness and color to-strong transversions (C>G and G>C), and strong-to-weak transi-
reflecting the number and source of de novo mutations passed tions (C>T and G>A). Complementary mutation types are shown
down (red is from male parent, blue from female parent, and gray is together. B Context-dependent substitution-rate estimates. Nine
undetermined origin). Color of line represents source and shading possible substitution-type parameters are shown for the gray
represents destination (lighter shading to Om, darker to Of). Numbers mouse lemur terminal branch, which are categorized similarly as
within bars show mutation counts and the rate of each individual the de novo mutation spectrum. Error bars on substitution rates
offspring is listed below. represent 95% highest posterior densities.
Fig. 2 Effect of filtering thresholds on mutation-rate estimation. The mutation rate and spectrum of the gray mouse lemur, as a product of
two main filtering decisions: (1) an allelic balance filter (along the rows) and (2) a callable site filter (along the columns). The first three columns
display how the parent-of-origin, the mutation rate at CpG sites, and total number of mutations vary. The remainder of the table shows the
combined effect of these filters on the calculated rate. Cells for lower rates are shaded blue and higher rates are shaded red. All mutation rates
have been corrected for the estimated number of false positives and false negatives with their respective number of mutations and
callable sites.
Heredity (2021) 127:233 – 244C.R. Campbell et al.
238
Fig. 4 Context-dependent relaxed-clock analysis shows low rates of C>T substitution rates at CpG sites in the gray mouse lemur. C>T
substitution-rate estimates at non-CpG versus CpG sites are compared for six species of primate, including the gray mouse lemur (M. murinus).
Note that with the exception of M. murinus, all primates examined show significantly higher CpG rates than non-CpG rates. The C>T
substitution rates at non-CpG and CpG sites are nearly identical in M. murinus. Error bars represent 95% highest posterior densities.
CpG sites, constituting 8.7% of all de novo mutations. This represents from other primates (Table 1) with substitution rates estimated
a roughly fourfold enrichment given that 1.9% of the genome from a recent relaxed-clock analysis of the same species (dos Reis
consists of CpG sites. Because the elevated mutation rate at CpG sites et al. 2018). Phylogenetic substitution rates are estimated per-year,
is linked to methylation (Bird 1980), mutations are typically not so we rescaled them by generation time to represent them as
expected in regions of the genome with high GC content (CpG substitutions per-site per-generation (s/s/gen), considering the
islands), where CpG sites are much less likely to be methylated (Bird average parent age as well as the average age of fathers (Table
1986; Molaro et al. 2011). As anticipated, none of the 92 de novo S3), for direct comparison with per-generation mutation rates
mutations were found within CpG islands, which constitute roughly from pedigrees. There are three notable observations: (1) the
4% of the M. murinus genome. mean pedigree-based mutation-rate estimates are contained by
The mutation spectrum in mouse lemur was further investigated the phylogenetic-based substitution-rate estimate highest poster-
with an independent approach based on absolute substitution rates ior density intervals for all but three cases: human, owl monkey,
(substitutions/site/year; s/s/y) and fossil-calibrated relaxed-clock mod- and mouse lemur, (2) substitution rates are not consistently lower
els. All clock model parameters (Fig. S8) converged across ten one- than mutation rates as demonstrated by humans, and (3) scaling
megabase replicates (Figs. S9–S19) and revealed a higher global phylogenetic substitution rates with the average age of the father
substitution rate in mouse lemurs compared with apes and Old World closes the distance between mutation and substitution rates in
monkeys (Fig. S20). We then estimated context-dependent substitu- cases where there are differences between the ages of fathers and
tion rates for the same alignments (Lee et al. 2015). All rate parameters mothers, as observed in orangutan and mouse lemur. For most
converged (Figs. S21–S30) and transitions at CpG sites (Group 9) were great apes and Old World monkeys, their pedigree-based
the only substitution type to clearly break from the pattern expected mutation-rate estimates are consistent with their third-codon
by not partitioning across substitution types (Fig. S20). Mouse lemur substitution rates, especially when scaling by the average age of
had the lowest rate of C>T transitions at CpG sites of all primates (Figs. the father as opposed to average parent age for orangutan (P.
S31–S40), thereby supporting the results of the pedigree-based abelii, Fig. 5).
approach. Notably, in mouse lemur, the rate of C>T transitions at CpG
sites is slightly lower than the rate of C>T transitions at non-CpG sites Sex bias
(Group 5), whereas the converse is true for all other primates across all Using the long phasing blocks generated by the linked-read
ten subsampled alignments (Figs. S31–S40). Specifically, the mean rate method, we were able to determine the parent-of-origin for 61 out
estimate for C>T transitions at CpG sites is 98% of the rate of C>T of 92 (66%) de novo mutations. The number of mutations
transitions at non-CpG sites (1.210 × 10⁻¹¹ s/s/y vs 1.234 × 10⁻¹¹ s/s/y) confidently assigned to a parent are notably higher in the analysis
in mouse lemur. The C>T transition rate is 2.92, 3.11, 2.51, 1.81, and presented here compared with previous studies that used short-
1.74 times higher for CpG versus non-CpG sites in human, chimp, read sequencing alone, which found only 35% (Venn et al. 2014)
orangutan, Old World monkey, and New World monkey, respectively. or 38% (Thomas et al. 2018). Among the assigned mutations, 51%
The pattern of rate variation across substitution types generally agrees (n = 31) were found on the offsprings’ paternal haplotype, while
with the observed mutation spectrum from our focal quartet (Fig. 3B) the remaining 49% (n = 30) were found on the offsprings’
and corroborates the low rate of CpG mutations in the gray mouse maternal haplotype; a ratio of male-to-female mutations of 1.03.
lemur relative to other primates (Fig. 4). This is considerably lower than the observation of approximately
4:1 typically observed in other primate studies (Wu et al. 2020).
Discrepancies of magnitude when comparing pedigree-based
mutation rates and phylogenetic substitution rates Impacts for divergence time estimation
We compared pedigree-based estimates of the mutation rate for We recalibrated branch lengths in absolute time for a genus-level
mouse lemurs together with published mutation-rate estimates phylogeny of mouse lemurs (Yoder et al. 2016) based on the new
Heredity (2021) 127:233 – 244C.R. Campbell et al.
239
Fig. 5 Difference between mutation and substitution rates among primates. Error bars around substitution rates are 95% highest posterior
density intervals from a Bayesian relaxed-clock analysis. Credible intervals are given for mutation rates where available from published data.
Substitution rates are scaled from per-year to per-generation based on the average parent (parental) age at the time of conception, except for
C. sabaeus where data were not available and the generation time assumed from external information. Where age information on parents was
available, substitution rates were also scaled by the average father (paternal) age. Data are given in Table S3.
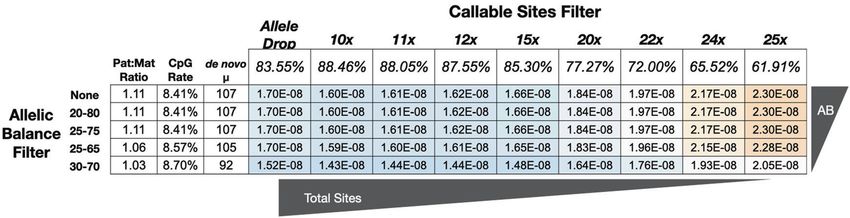
Fig. 6 Estimated divergence times among mouse lemur species. Trees are posterior samples from BPP based on a fixed previously published
topology. The directly estimated mutation rate (blue) is nearly twice as high as the previously assumed rate (red). Divergence times estimated
with the new mutation rate are nearly half of the previous estimates. Summary statistics are given in Table S4, matched by node labels (A–E).
mutation-rate estimate of 1.52 × 10⁻⁸ mutations/site/generation including the use of simulations to determine the appropriate
derived from this study. Previously, the mutation rate was denominator for mutation-rate calculations and a technical
modeled on a gamma distribution from mouse (Uchimura et al. replicate to estimate both false-positive and false-negative rates.
2015) and human (Scally and Durbin 2012) estimates, with a mean Even so, any point estimate of the de novo mutation rate should
of 0.87 × 10⁻⁸ mutations/site/generation. The higher mutation be interpreted with caution as there are numerous variables that
rate calculated here yields considerably more recent divergence can impact rate estimates, including biological factors such as rate
times (Fig. 6) with reduced uncertainty compared with sampling variation among the pedigrees themselves (Smith et al. 2018).
from the previously wide gamma distribution (Table S4). Moreover, any pedigree-based estimate is the direct result of
accumulated study-design decisions made regarding available
animals, experimental planning, and data-quality thresholds. The
DISCUSSION rate we present is a product of these decisions and to change any
A high mutation rate in mouse lemurs of these inputs could potentially yield a change in the final
In this study, we provide the first pedigree-based estimate of the estimate. For example, narrowing the allelic balance threshold
de novo mutation rate in a strepsirrhine primate. Our mean would eliminate called mutations and thus lower the rate, while
mutation-rate estimate was calculated to be 1.52 × 10⁻⁸ muta- increasing the coverage requirement would decrease the number
tions/site/generation, which is high compared with previously of callable sites and thus raise the rate (Fig. 2). We adjusted the
characterized primates with the exception of orangutan that allele balance and depth-based callable site filters to estimate a
shows a similarly high rate (Besenbacher et al. 2019). We took range of mutation rates, the majority of which are within the 95%
several measures to ensure accurate mutation-rate estimation, CI of our allele drop-based estimate of 1.52 × 10⁻⁸ mutations/site/
Heredity (2021) 127:233 – 244C.R. Campbell et al.
240
generation. Although the mutation-rate estimate was sensitive to (Moorjani et al. 2016a), but past analyses with context-dependent
various filters, the fraction of mutations found at CpG sites as well substitution rates on a 0.15-Mb alignment have suggested much
as the ratio of mutations from dam and sire was not. more clock-like behavior (Lee et al. 2015). We anticipate that
We used linked-read sequencing technology that improves future analyses with denser sampling of New World monkeys and
mapping accuracy to produce high-quality variants for the de strepsirrhines will be necessary to rigorously test clock-like
novo mutations identified here. The linked reads also allowed us behavior of C>T transitions at CpG sites in primates.
to recover parental haplotypes, and subsequently, the parent-of-
origin for observed mutations in offspring (Fig. 1). The number of The mouse lemur mutation spectrum
mutations with an assigned parent-of-origin is higher (66%) in the Our estimates of the Ti:Tv and SW:WS ratios at 0.96 and 1.24 each
present study than in analyses that used short reads and three are also lower than values found in other animals. For instance, the
generations of sequencing (Thomas et al. 2018; Venn et al. 2014). Ti:Tv ratio found in previous pedigree-based studies in other
Although a number of factors such as sequencing depth, species varied between 1.97 and 2.67 (Agier and Fischer 2012;
heterozygosity, and recombination rate may vary across investiga- Assaf et al. 2017; Besenbacher et al. 2019; Kong et al. 2012; Smeds
tions and limit the value of cross-study comparisons, the prospect et al. 2016; Thomas et al. 2018; Venn et al. 2014). Our finding of a
of successfully phasing more mutations while also eliminating the lower Ti:Tv ratio is likely a consequence of the relatively low
need to sequence across more than two generations with linked- number of C>T transitions at CpG sites. For example, C>T
read data is appealing. transitions are twice as frequent as A>G transitions in human,
chimp, and owl monkey (Thomas et al. 2018; Venn et al. 2014), but
Low numbers of mutations at CpG sites these two mutation classes occur in equal frequency in mouse
CpG sites have generally been found to have higher mutation lemur (Fig. 3A). These findings also explain the SW:WS ratio closer
rates relative to other site classes, a pattern discovered several to 1 than previous studies, since C>T mutations are strong-to-
decades ago using DNA sequence comparisons (Bird 1980) and weak transitions. For instance, without an elevation in the
ascribed to the frequent deamination of methylated cytosines mutation rate at CpG sites, the Ti:Tv and SW:WS ratios would
(Friedberg et al. 2005). Only a fourfold enrichment of mutations at drop from 2.06 and 2.11 to 1.46 and 1.33, respectively, in a study
CpG sites (8 mutations, 8.7% of all mutations) was found in mouse of chimpanzees (Venn et al. 2014). Thus, reduced numbers of C>T
lemur, which is less than the at-least tenfold enrichment (12–25% transitions at CpG sites can simultaneously explain several aspects
of total mutations) found in other primate studies (Besenbacher of the measured mouse lemur mutation spectrum that deviate
et al. 2019; Gao et al. 2019; Thomas et al. 2018; Venn et al. 2014). from previous studies of other primate mutation rates.
Though surprising, we are confident that the result here reported The Ti:Tv and SW:WS ratios observed in the mouse lemur
has biological relevance. The findings from our relaxed-clock mutation spectrum are also supported by the context-dependent
analyses of different substitution types are consistent with the substitution-rate analysis. Taking the average of transition and
observed de novo mutation spectrum (Fig. 3). Notably, the rate of transversion rate classes (Table S2) yields a Ti:Tv of 1.64. When
C>T transitions at CpG sites breaks from the pattern expected considering substitution classes by strong-to-weak and weak-to-
without partitioning (Fig. S20), including C>T transitions at non- strong types, we find a SW:WS of 0.85. Although not equivalent to
CpG sites (Figs. S31–S40) where mouse lemurs show a higher the spectrum-based estimates, these ratios are much lower than
substitution rate than great apes and Old World monkeys but a the branch rates observed in other species, for example, where Ti:
lower rate than New World monkeys. Mouse lemurs have the Tv ranges from 2.05 to 2.58, while SW:WS ranges from 1.04 to 1.33
lowest rate of C>T transitions at CpG sites of all primates analyzed in C. jaccus and P. troglodytes, respectively. The lower ratios of Ti:Tv
here (Figs. S31–S40). This leads to the hypothesis that methylation and SW:WS rates in mouse lemur are both explained by the lower-
of CpG sites in mouse lemur germ cell lines may actually be lower than-expected C>T transition rate at CpG sites. In total, the
relative to that in other primates (Rahbari et al. 2016), thus independent substitution-rate analysis of the primate reference
ultimately contributing fewer hits to their mutation spectrum genomes validates our findings that the C>T transition rate at CpG
(Figs. 3 and 4). sites, Ti:Tv ratio, and SW:WS ratio of the de novo mutation
A lowered rate of C>T transitions at CpG sites is surprising for spectrum in mouse lemurs deviates from those in other primates.
primates. Because these mutations are caused by deamination of
methylated cytosines, they are expected not to be affected by Reduced male mutational bias
variation in generation times and are thus predicted to evolve A paternal mutational bias has long been hypothesized for diploid
more clock-like than other substitution types (Kim et al. 2006). sexually reproducing organisms based on the idea that the
Substitution rates are consistent with a molecular clock when increased number of cell divisions in sperm versus egg should
there is no among-branch variation, such that the expected lead to higher numbers of mutations in the male germline than
number of substitutions increases linearly over time. Previous the female germline (Haldane 1946; Kong et al. 2012; Lindsay et al.
studies of relative substitution rates using similar whole-genome 2019). Indeed, a strong paternal mutation-rate bias has been
alignments have found that transitions at CpG sites are much observed in the vast majority of pedigree-based mutation-rate
more clock-like than transitions at non-CpG sites when comparing estimates to date (Gao et al. 2019; Lindsay et al. 2019; Rahbari et al.
great apes to Old World monkeys or New World monkeys 2016; Thomas et al. 2018; Venn et al. 2014) and in many studies of
(Moorjani et al. 2016a). These same analyses of context-dependent phylogenetically based rates (Axelsson et al. 2004; Ellegren and
substitution rates also demonstrated clock-like behavior of C>T Fridolfsson 1997; Goetting-Minesky and Makova 2006; Shimmin
transitions at CpG sites across anthropoids (Lee et al. 2015). In et al. 1993; Zhang 2004). The cell-division hypothesis has lately
both of these studies, a single stepsirrhine (Otolemur garnetii) was been challenged, however, with the suggestion made that
treated as an outgroup and rates within strepsirrhines were not observed paternal biases relate instead to more complicated
estimated. However, earlier approaches for estimating context- relationships among DNA repair mechanisms and life-history traits
dependent substitution rates on a 1.7-Mb region across mammals (Wu et al. 2020).
(Hwang and Green 2004) also discovered lowered relative C>T The 1.03 ratio of paternal-to-maternal mutations in gray mouse
transition rates at CpG sites in lemurs and their common ancestor lemur observed here, among the 66% of mutations that could be
when compared with anthropoids, although we also found a assigned with parent-of-origin, is considerably lower than the range
notably elevated rate in New World monkeys (Callithrix jacchus; observed in primates between 2.1 in owl monkey (Thomas et al.
Fig. 4). New World monkeys have been shown to have rates of 2018) and 5.5 in chimpanzee (Venn et al. 2014), with most human
transitions at CpG sites approximately 20% higher than great apes studies falling around 3.6 (Gao et al. 2019; Rahbari et al. 2016) and 2.7
Heredity (2021) 127:233 – 244C.R. Campbell et al.
241
in mouse (Lindsay et al. 2019). It is similar, however, to the ratio of 1.2 and analyses will be needed to reconcile the differences between
found in collared flycatchers where the F1 male was only 1-year old pedigree-based and phylogenetic estimates of the mutation rate.
(Smeds et al. 2016), which suggests that the low sex bias ratio
observed in the gray mouse lemur is not unreasonable in the larger Mutation rates and divergence time estimates
context of vertebrate diversity. Also, it is worth noting that one of the Application of the pedigree-based mutation-rate estimate
driving factors of the paternal mutational bias has been hypothesized observed in this study leads to more recent divergence times
to relate to the time of first reproduction after puberty, with rate among mouse lemur species than previously inferred (Fig. 6 and
increasing as time between puberty and first reproduction increases Table S4). These divergence times are obtained by rescaling
(Segurel et al. 2014). Here, mouse lemurs are exceptional in the branch lengths in substitutions per-site to absolute time given a
primate clade given that puberty and time of first reproduction occur mutation rate and generation time (Burgess and Yang 2008) as
nearly simultaneously (Blanco et al. 2011; Blanco et al. 2015; Zohdy opposed to relaxed-clock phylogenetic methods that estimated
et al. 2014). Mouse lemurs are reproductively mature in the first year older species divergences within mouse lemurs (dos Reis et al.
of life with females typically producing their first litter by the age of 2018; Yang and Yoder 2003). A previous analysis made assump-
10 months. It is less clear when males first become successful sires as tions regarding mutation rate in mouse lemurs (Yoder et al. 2016)
they must compete with older more experienced males in their first that resulted in divergence times nearly twice as old as those
year. The sire for our focal quartet was 4.1 and 5 years old at the time presented here (Fig. 6 and Table S4). Although such assumptions
of conception of the male and female offspring, respectively (Figs. 1 regarding mutation rates are reasonable in the absence of data,
and S1). Though mature regarding life-history stage, this timeframe direct mutation rates from pedigrees can arguably produce more
may nonetheless be insufficient for producing a strong male accurate divergence time estimates, especially when no fossils are
mutational bias relative to longer-lived species where more available for the target clade mandating that deeply diverged taxa
mutations in the male germline would be anticipated (Kong et al. must be included for external calibration in relaxed-clock studies
2012; Thomas et al. 2018). In addition, there are differences in the (Tiley et al. 2020). Unfortunately, a complete lack of lemuriform
methylation process within male and female germline cells, with fossils means that we cannot evaluate the accuracy of divergence
male cells experiencing more methylation (Kobayashi et al. 2013; Reik time estimates for mouse lemurs in the context of the fossil
and Dean 2001). This discrepancy yields more methylation-related record. Given the endangered status of many mouse lemur
mutations in males than females as mammals age (Gao et al. 2019; species, and virtually all other strepsirrhine species, an enhanced
Jonsson et al. 2017). Thus, fewer methylation-related (i.e., CpG) ability to provide a temporal context to speciation and to estimate
mutations, and a short time to puberty in mouse lemurs may in demographic parameters such as effective population size may
combination lead to the observed, limited sex bias. As a potential yield critical information for directing ongoing conservation policy
caveat, mouse lemurs have both behavioral (Dammhahn and and efforts. We caution though that pedigree-based mutation
Kappeler 2005; Eberle and Kappeler 2004) and morphological signs rates can also lead to poor estimation of divergence times when
(i.e., enlarged testes during the mating season) of sperm competition species are distantly related and de novo mutation rates vary
(Kappeler 1997) that in other primates may be correlated with high significantly among lineages or have changed through time (Scally
substitution rates (Wong 2014). though this appears not to be the and Durbin 2012), as in the case of dating the common ancestor
case in mouse lemurs. of apes and Old World monkeys (Wu et al. 2020).
Mutation and substitution rates
Our analyses show that there is incongruence between the CONCLUSIONS
magnitude of mutation rates and of phylogenetic substitution rates Our study emphasizes the importance of increased sampling
when attempting to directly compare the two (Fig. 5). Several sources across the tree of life for gaining insight into the nature and
of uncertainty underlie both. Pedigree-based mutation rates offer causes of mutation-rate evolution. Critically, it also sheds light on
only a sample of the present, and both mutation rate and generation the effect that data processing has on the final estimate of
time may have varied through time (Moorjani et al. 2016b). For mutation rate. We emphasize that mutation-rate estimates are
example, one revelation in the rapidly developing literature on de highly sensitive to variant filtering, and by using a technical
novo mutation rates has been that the estimated rate in humans is replicate, identify assumptions about the sources of error for false-
less than half that predicted by phylogenetic studies, and is positive and false-negative rate estimation and their respective
recapitulated here (Fig. 5), suggesting that the mutation rate has impacts on de novo rate estimation. Further, as this is the first
slowed down over time in humans and that rates can change rapidly pedigree-based mutation- rate estimate for a strepsirrhine
within primates (Scally and Durbin 2012), and presumably other primate, it is not clear whether the high mutation rate, low CpG
clades. Substitution and mutation rates from apes, aside from mutation rate, and weak sex bias are specific to mouse lemurs or
humans and Old World monkeys observed here, agree when may be representative of strepsirrhines more generally. Although
considering the average paternal age for rescaling absolute variation in the mutation rate and spectrum is anticipated among
substitution rates to per-generation. Mouse lemur, however, had a different pedigrees, and our study is largely based on a single
significantly elevated mutation rate to the point where credible quartet, the results of our context-dependent substitution-rate
intervals with their paternal age-rescaled substitution rates did not analysis validate the most surprising aspect of a low rate of C>T
overlap, although they would if not correcting for the estimated transitions in CpG sites. Reconciling the disparity in magnitude
number of false-positive and false-negative mutations. between mutation rates from pedigrees and substitution rates
Phylogenetically based estimates may be biased downward if from phylogenetic methods will be a focus of future work as more
substitutions are not fully neutral. Substitution rates used for pedigree-based mutation rates become available. As demon-
comparison with generation times and mutation rates were based strated by this study in mouse lemurs, de novo mutation-rate
on third-codon positions from a supermatrix of different data estimates stand to drastically revise divergence times, especially in
types (dos Reis et al. 2018; Springer et al. 2012) and may be under recent evolutionary radiations.
weak purifying selection. Indeed, previous studies have found
evidence for low phylogenetically based compared with pedigree-
based estimates (Denver et al. 2000; Howell et al. 2003; Winter DATA AVAILABILITY
et al. 2018). For pedigree-based estimates, the degree to which Data are available from the Dryad Digital Repository https://doi.org/10.5061/
somatic mutations and/or interindividual variation might impact dryad.8pk0p2njx. Raw sequence data are available through NCBI under BioProject
these estimates is not clear (Segurel et al. 2014). Additional data PRJNA512515.
Heredity (2021) 127:233 – 244C.R. Campbell et al.
242
REFERENCES Felsenstein J (1981) Evolutionary trees from DNA sequences: a maximum likelihood
Agarwal I, Przeworski M (2019) Signatures of replication timing, recombination, and approach. J Mol Evol 17:368–376
sex in the spectrum of rare variants on the human X chromosome and auto- Feng C, Pattersson M, Lamichhaney S, Rubin CJ, Rafati N, Casini M et al. (2017)
somes. Proc Natl Acad Sci USA 116:17916–17924 Moderate nucleotide diversity in the Atlantic herring is associated with a low
Agier N, Fischer G(2012) The mutational profile of the yeast genome is shaped by mutation rate. Elife 6:e23907
replication Mol Biol Evol 29:905–913 Friedberg EC, Walker GC, Siede W, Wood RD (2005) DNA repair and mutagenesis.
Alschul SF, Gish W, Miller W, Myers EW, Lipman DJ (1990) Basic local alignment tool. J American Society for Microbiology Press Washington DC
Mol Biol 215:403–410 Gao Z, Moorjani P, Sasani TA, Pedersen BS, Quinlan AR, Jorde LB et al. (2019) Over-
Andriatsitohaina B, Ramsay MS, Kiene F, Lehman SM, Rasoloharijaona S, Rakoton- looked roles of DNA damage and maternal age in generating human germline
dravony R et al. (2020) Ecological fragmentation effects in mouse lemurs and mutations. Proc Natl Acad Sci U S A 116:9491–9500
small mammals in northwestern Madagascar. Am J Primatol 82(4):e23059 Garimella KV, Iqbal Z, Krause MA, Campino S, Kekre M, Drury E et al. (2020) Detection
Angelis K, dos Reis M (2015) The impact of ancestral population size and incomplete of simple and complex de novo mutations with multiple reference sequences.
lineage sorting on Bayesian estimation of species divergence times Curr Zool Genome Res 30:1154–1169
61:874–885 Goetting-Minesky MP, Makova KD (2006) Mammalian male mutation bias: impacts of
Assaf ZJ, Tilk S, Park J, Siegal ML, Petrov DA (2017) Deep sequencing of natural and generation time and regional variation in substitution rates. J Mol Evol
experimental populations of Drosophila melanogaster reveals biases in the 63:537–544
spectrum of new mutations. Genome Res 27:1988–2000 Haldane HBS (1946) The mutation rate of the gene for haemophilia, and its segre-
Axelsson E, Smith NG, Sundstrom H, Berlin S, Ellegren H (2004) Male-biased mutation gation ratios in males and females. Ann Eugen 13(1):262-271
rate and divergence in autosomal, z-linked and w-linked introns of chicken and Harland C, Charlier C, Karim L, Cambisano N, Deckers M, Mni M et al. (2017) Frequency
Turkey. Mol Biol Evol 21:1538–1547 of mosaicism points towards mutation-prone early cleavage cell divisions in
Benton MJ, Donoghue PC(2007) Paleontological evidence to date the tree of life Mol cattle. bioRxiv
Biol Evol 24:26–53 Harris K, Pritchard JK (2017) Rapid evolution of the human mutation spectrum. Elife 6:
Bergeron LA, Besenbacher S, Bakker J, Zheng J, Li P, Pacheco G, Sinding M-HS, e24284
Kamilari M, Gilbert MTP, Schierup MH, Zhang G (2020) The germline mutational Heath TA, Huelsenbeck JP, Stadler T (2014) The fossilized birth-death process for
process in rhesus macaque and its implications for phylogenetic dating. bioRxiv coherent calibration of divergence-time estimates. Proc Natl Acad Sci U S A 111:
https://doi.org/10.1101/2020.06.22.164178 E2957–2966
Besenbacher S, Hvilsom C, Marques-Bonet T, Mailund T, Schierup MH (2019) Direct Herrera JP, Davalos LM (2016) Phylogeny and divergence times of lemurs inferred
estimation of mutations in great apes reconciles phylogenetic dating. Nat Ecol with recent and ancient fossils in the tree. Syst Biol 65:772–791
Evol 3:286–292 Howell N, Smejkal CB, Mackey DA, Chinnery PF, Turnbull DM, Herrnstadt C (2003) The
Bird AP(1980) DNA methylation and the frequency of CpG in animal DNA Nucleic pedigree rate of sequence divergence in the human mitochondrial genome:
Acids Res 8:1499–1504 there is a difference between phylogenetic and pedigree rates. Am J Hum
Bird AP (1986) CpG-rich islands and the function of DNA methylation. Nature 321:209- Genet 72:659–670
213 Hozer C, Pifferi F, Aujard F, Perret M (2019) The biological clock in gray mouse lemur:
Blanco MB, Rasoazanabary E, Godfrey LR (2011) Reproductive opportunism in adaptive, evolutionary and aging considerations in an emerging non-human
unpredictable environments: the comparison of two wild mouse lemur species primate model. Front Physiol 10:1033
(Microcebus rufus and M. griseorufus) from eastern and western Madagascar. Hwang DG, Green P (2004) Bayesian Markov chain Monte Carlo sequence analysis
Am J Phy Anthr 144:91–91 reveals varying neutral substitution patterns in mammalian evolution. Proc Natl
Blanco MB, Rasoazanabary E, Godfrey LR(2015) Unpredictable environments, Acad Sci U S A 101:13994–14001
opportunistic responses: Reproduction and population turnover in two wild Jonsson H, Sulem P, Kehr B, Kristmundsdottir S, Zink F, Hjartarson E et al. (2017)
mouse lemur species (Microcebus rufus and M. griseorufus) from eastern and Parental influence on human germline de novo mutations in 1,548 trios from
western Madagascar Am J Prima 77:936–947 Iceland. Nature 549:519–522
Burgess R, Yang Z (2008) Estimation of hominoid ancestral population sizes under Kappeler PM (1997) Intrasexual selection and testis size in strepsirhine primates.
Bayesian coalescent models incorporating mutation rate variation and Behav Ecol 8:10–19
sequencing errors. Mol Biol Evol 25:1979–1994 Keightley PD, Pinharanda A, Ness RW, Simpson F, Dasmahapatra KK, Mallet J et al.
Chaisson MJ, Wilson RK, Eichler EE(2015) Genetic variation and the de novo assembly (2015) Estimation of the spontaneous mutation rate in Heliconius melpomene.
of human genomes Nat Rev Genet 16:627–640 Mol Biol Evol 32:239–243
Chojnacki S, Cowley A, Lee J, Foix A, Lopez R(2017) Programmatic access to bioin- Kim YH, Petko Z, Dzieciatkowski S, Lin L, Ghiassi M, Stain S et al. (2006) CpG island
formatics tools from EMBL-EBI update: 2017 Nucleic Acids Res 45:W550–W553 methylation of genes accumulates during the adenoma progression step of the
Dammhahn M, Kappeler PM(2005) Social system of Microcebus berthae, the world’s multistep pathogenesis of colorectal cancer. Genes Chromosomes Cancer
smallest primate Int J Primatol 26:407–435 45:781–789
Denver DR, Morris K, Lynch M, Vassilieva LL, Thomas WK(2000) High direct estimate of Kimura M (1983) The neutral theory of molecular evolution. Cambridge University
the mutation rate in the mitochondrial genome of Caenorhabditis elegans Press, Cambridge
Science 289:2342–2344 Kimura M, Ohta T (1971) On the rate of molecular evolution. J Mol Evol 1:1–17
dos Reis M, Gunnell GF, Barba-Montoya J, Wilkins A, Yang Z, Yoder AD(2018) Using Kobayashi H, Sakurai T, Miura F, Imai M, Mochiduki K, Yanagisawa E et al. (2013) High-
phylogenomic data to explore the effects of relaxed clocks and calibration resolution DNA methylome analysis of primordial germ cells identifies gender-
strategies on divergence time estimation: primates as a test case Syst Biol specific reprogramming in mice. Genome Res 23:616–627
67:594–615 Koch E, Schweizer RM, Schweizer TM, Stahler DR, Smith DW, Wayne RK et al. (2019) De
dos Reis M, Yang ZH (2011) Approximate likelihood calculation on a phylogeny for novo mutation rate estimation in wolves of known pedigree. Mol Biol Evol 36
Bayesian estimation of divergence times. Mol Biol Evol 28:2161–2172 (11):2536-2547
Drummond AJ, Ho SY, Phillips MJ, Rambaut A (2006) Relaxed phylogenetics and Kondrashov FA, Kondrashov AS (2010) Measurements of spontaneous rates of
dating with confidence. PLoS Biol 4:e88 mutations in the recent past and the near future. Philos Trans R Soc Lond, B
Eberle M, Kappeler PM (2004) Sex in the dark: determinants and consequences of 365:1169–1176
mixed male mating tactics in Microcebus murinus, a small solitary nocturnal Kong A, Frigge ML, Masson G, Besenbacher S, Sulem P, Magnusson G et al. (2012)
primate. BehavEcolSociobiol 57:77–90 Rate of de novo mutations and the importance of father’s age to disease risk.
Ellegren H, Fridolfsson A-K (1997) Male-driven evolution of DNA sequences in birds. Nature 488:471–475
Nat Genet 17:182–184 Krasovec M, Sanchez-Brosseau S, Piganeau G (2019) First estimation of the sponta-
Ewing AD, Houlahan KE, Hu Y, Ellrott K, Caloian C, Yamaguchi TN et al. (2015) neous mutation rate in diatoms. Genome Biol Evol 11:1829–1837
Combining tumor genome simulation with crowdsourcing to benchmark Langley CH, Fitch WM (1974) An examination of the constancy of the rate of mole-
somatic single-nucleotide-variant detection. Nat Methods 12:623–630 cular evolution. J Mol Evol 3:161–177
Ezran C, Karanewsky CJ, Pendleton JL, Sholtz A, Krasnow MR, Willick J et al. (2017) The Larsen PA, Harris RA, Liu Y, Murali SC, Campbell CR, Brown AD et al. (2017) Hybrid de
mouse lemur, a genetic model organism for primate biology, behavior, and novo genome assembly and centromere characterization of the gray mouse
health. Genetics 206:651–664 lemur (Microcebus murinus). BMC Biol 15:110
Fazalova V, Nevado B (2020) Low spontaneous mutation rate and pleistocene Lartillot N, Philippe H (2004) A Bayesian mixture model for across-site heterogeneities
radiation of pea aphids. Mol Biol Evol 37:2045–2051 in the amino-acid replacement process. Mol Biol Evol 21:1095–1109
Heredity (2021) 127:233 – 244You can also read