Airfares and Flights Routes in Regional Australia: Case of Central Australia - Dr Benxiang Zeng The Northern Institute Charles Darwin University ...
←
→
Page content transcription
If your browser does not render page correctly, please read the page content below

Airfares and Flights Routes in Regional Australia:
Case of Central Australia

Dr Benxiang Zeng

The Northern Institute
Charles Darwin University, Alice Springs

May 2018

                                       1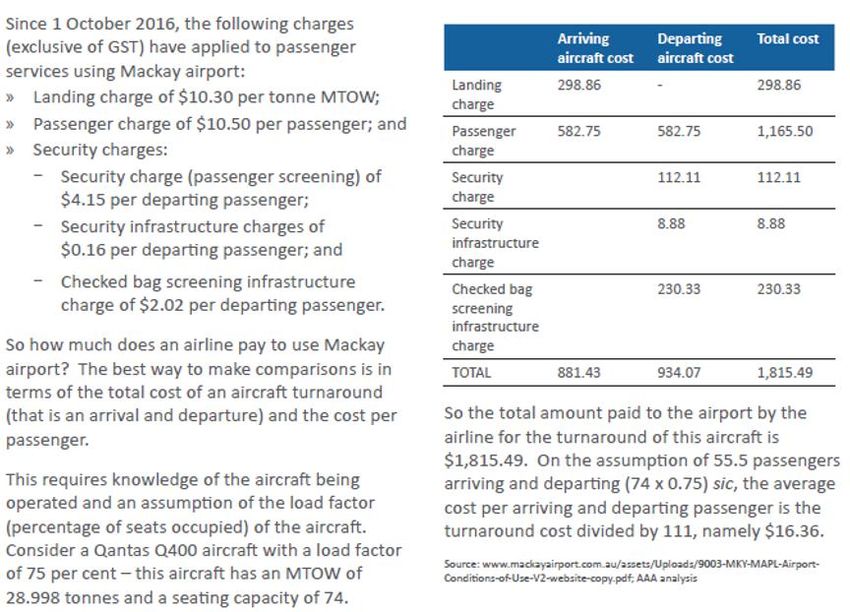
Contents
1. Acknowledgement ...................................................................................................... 3
2. Introduction ................................................................................................................ 3
3. Regional airfares have been and are higher absolutely and relatively ......................... 4
   3.1. Airfares trends ....................................................................................................... 4
   3.2. Northern Regional Australia suffers expensive airfares ......................................... 6
   3.3. Airfares for central Australia are even higher ........................................................ 9
4. Social & economic impacts of high airfares ............................................................... 13
   4.1. Stakeholders’ perceptions ................................................................................... 13
   4.2. Impacts on local businesses ................................................................................. 14
   4.3. Impacts on tourism .............................................................................................. 17
5. Determinant factors of airfares ................................................................................. 19
   5.1. Ticket price drivers .............................................................................................. 19
   5.2. Airline cost structure ........................................................................................... 20
   5.3. Airport charges .................................................................................................... 22
   5.4. Scale of passengers and airfares .......................................................................... 26
6. Discussion ................................................................................................................. 27
   6.1. Current situation and challenges ......................................................................... 27
   6.2. Possible solutions: collaborative efforts of key stakeholders ............................... 28
   6.3. Better access: from demand side......................................................................... 29
      6.3.1. Government subsidies ................................................................................... 30
      6.3.2. Coexistence of airports and airlines ............................................................... 30
      6.3.3. Pro-regional policies are needed ................................................................... 31
   6.4. Competition: from supply side............................................................................. 32
      6.4.1. Competition .................................................................................................. 32
      6.4.2. Cabotage ....................................................................................................... 32
7. References ................................................................................................................ 33

                                                                2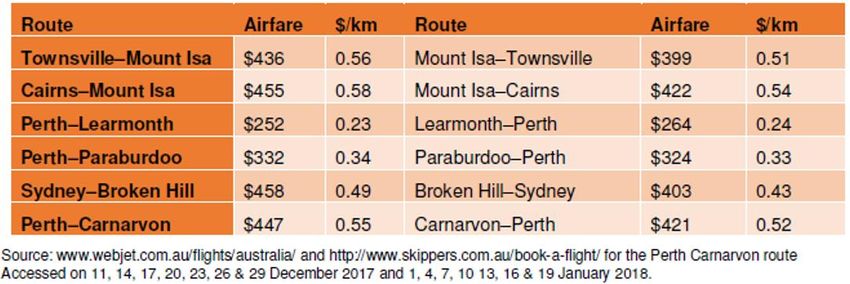
1. Acknowledgement
This research is jointly funded by Tourism Central Australia and Alice Springs Town Council. A special
thankyou goes to Mr. Stephen Schwer, CEO of Tourism Central Australia for his support in scoping the
study and providing information.

2. Introduction
Air services are critical for the Northern Territory’s economic and social wellbeing and growth, and
underpin the Territory’s ability to close the gap on Aboriginal disadvantage, develop our regions, and drive
the development of the north.

The factors which impact on the supply, sustainability and cost of air services in the Territory include a
small population (approximately 244,000 people dispersed over a vast geographic area of 1.3 million
square kilometres), long travel distances, climatic extremes, remoteness and isolation. The Northern
Territory’s relatively low resident population is routinely cited by airlines as a key factor in the lack of
competition on air routes to and within the Territory, which in turn contributes to higher prices for
consumers (Northern Territory Government, 2018).

Alice Springs, located at the geographic centre of Australia, it is the centre of economic, social, cultural
and recreational needs of Central Australia. The nearest major cities are Adelaide and Darwin, with each
being approximately 1,500 km to the south and north respectively. Furthermore, other capital cities are
more than 2,300 km away. This geographic remoteness and isolation absolutely enhances its
dependence on air transport compared to any other regional centres.

According to 2016 Census, Alice Springs has a population of 24,753
(http://www.censusdata.abs.gov.au/census_services/getproduct/census/2016/quickstat/LGA70200)
with another 18,000 people living within a 500km radius of Alice Springs. Alice Springs is a service town
with a very transient and disadvantaged Indigenous hinterland. Even though Alice Springs LGA itself
scores high on SEIFA’s measure of Relative Socio-Economic Disadvantage, this does not take into
account the fact that Alice Springs is a service town with a very transient and disadvantaged Indigenous
hinterland. For example, the Relative Socio-Economic Disadvantage scores for MacDonnell and Central
Desert Regional Council LGAs are 592 and 558 respectively, placing both in the most disadvantaged
decile
(http://www.abs.gov.au/ausstats/subscriber.nsf/log?openagent&2033055001%20-%20lga%20indexes.xl
s&2033.0.55.001&Data%20Cubes&5604C75C214CD3D0CA25825D000F91AE&0&2016&27.03.2018&Lat
est). The high cost of airfares compounds the disadvantage that the people of Alice Springs, and the
wider Central Australia region, experience. It also amplifies the negative impact of high cost of living in
the region which including high cost for transportation especially the high airfares. High airfares have
been blamed as a negative factor which discourages the recruitment and retainment of workers for the
businesses in the region (Alice Springs Town Council, 2018).

This report provides information about the airfares and flight routes in regional destinations focusing on
central Australia to analyse the possible reasons of relatively high airfares and less connection with
capital cities, and to discuss the possible solutions. The report is based on desktop research. The main
information collected include submissions from different stakeholders to the Senate Inquiry in late 2017
to early 2018; the literature studying the airline price models and airport cost structure; the published
materials about the impact of airlines on regional economic development including tourism
                                                       3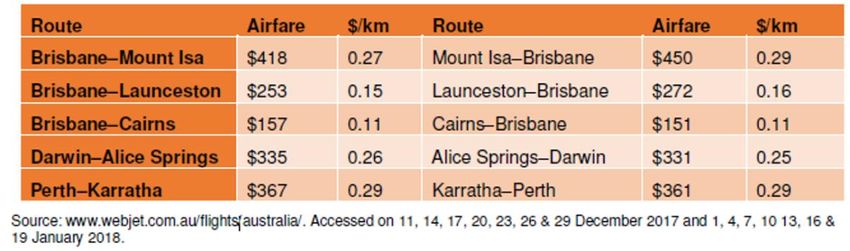
development; reports published by airports; and published airfares by major airlines operating regional
air-services in Australia. With the limitation in research time and resource availability, this report mainly
focuses on comparison of airfares in regional destinations, particularly in Alice Springs and central
Australia, the roles and impacts of airlines on regional Australia, possible reasons for high airfares and
discussion about the solutions. It is not a comprehensive study or a policy recommendation by any
means but provides a basis for further research into the co-existence of airlines and regional airports,
delivery of continuous quality services and contribution to social economic development in regional
Australia.

3. Regional airfares have been and are higher absolutely and relatively

  3.1. Airfares trends
Analysing the long-term trend of airfares across Australia, it is suggested that although the real full
economy airfares have been slightly increasing (Figure 1), the real best discount airfares have been
decreasing (Figure 2), according to (BITRE, 2017a).

                     Data source: https://bitre.gov.au/statistics/aviation/files/air_fares_1804.xls
                  Figure 1: Real Full Economy (13 month moving average, Oct 1992-Feb 2015)

                                                           4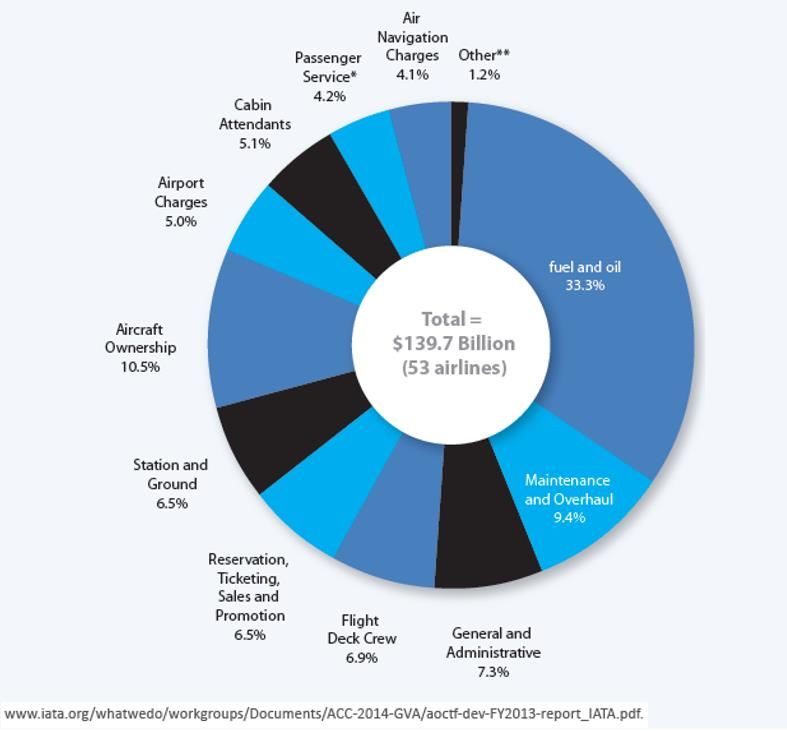
Data source: https://bitre.gov.au/statistics/aviation/files/air_fares_1804.xls
                  Figure 2: Real best discount (13 Month Moving Average, Oct 1992-Apr 2018)

This trend has impacted the airfares pricing for regional routes. According to Qantas Airways (2018),
compared to the airfares in 2003, in real terms, on average for all routes including regional routes, as at
June 2017, Best Discount Economy fares were lower by 38.4%, Restricted Economy Class fares were
lower by 19.1% and Business Class were lower by 4.9% (Qantas Airways, 2018, p6). Qantas argued that
as “across all regional routes, the highest airfare buckets represent a minority of the retail fares sold-the
vast majority of retail fares are purchased in Entry Level classes” (p6, refer to Table 1).

                     Table 1: Percentage of Retail Fares Sold in Full Economy v Entry Level
                       Brisbane-         Brisbane-             Brisbane-        Alice Springs-        Alice Springs-
                       Mount Isa         Rockhampton           Moranbah         Darwin                Sydney
      Full Economy     0%                1%                    2%               0%                    2%
      Entry Level      32%               27%                   44%              51%                   31%
                                        Cited from (Qantas Airways, 2018, p6)

Although Qantas published these figures, for the public it is still difficult to know at which level (other
than entry level and full economy level) the rest more than half (only little less for Alice Springs-Darwin
route) of retail fares were sold. Moreover, this does not necessarily suggest that the overall regional
airfares have been reduced. While when availability has been exhausted the high short-notice fares are
understandable, it is the fact that there has always not been a very high load factor (Table 2) according
to the BITRE’s activity statistics (BITRE, 2017b).

                               Table 2: Load factors for some flight routes (2017)
              Flight routes    Brisbane-        Brisbane-           Alice Springs-        Alice Springs-
                               Mount Isa        Rockhampton         Darwin                Sydney
              Average LF%      67.2             82.3                56.2                  Not available

                                                           5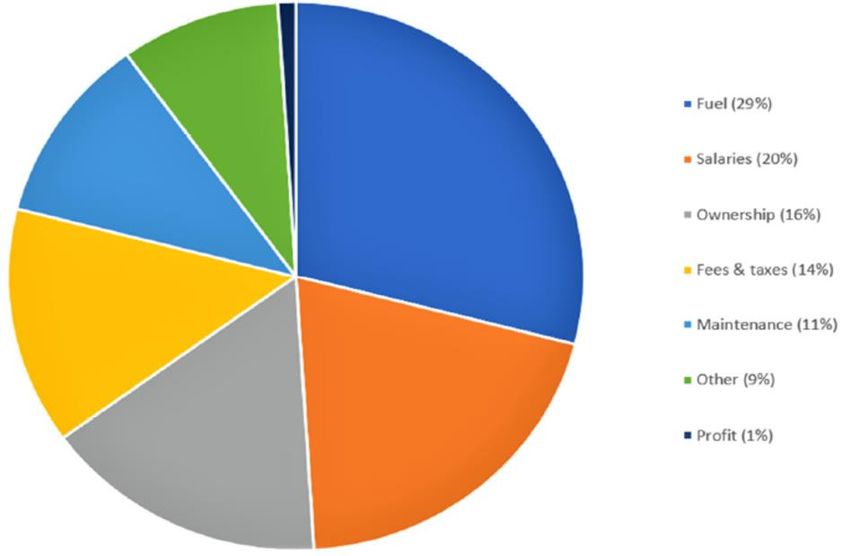
3.2. Northern Regional Australia suffers expensive airfares
It can be asserted that regional destinations in northern Australia and outback have higher airfares and
less connection, compared to capital cities and regional areas in the south.

In the submission to Western Australia Parliament’s Inquiry into the Regional Airfares in Western
Australia in 2017, Broome Chamber of Commerce & Industry and Broome Airfare Action Group (2017)
referred randomly to airfares from and to Broome at a weekend (Friday 11 August, return Monday 14
August 2017) booking 3 weeks before departure. They found that airfare flying from Sydney to Hamilton
Island (with a population of 1,347) was $135, returning from $135. On the same day flying from Perth to
Broome (with a population of 17,000) (the same distance as Sydney-Hamilton Island) started at $352,
returning $495. The discrepancy being more than 300% (Broome Chamber of Commerce & Industry &
Broome Airfare Action Group, 2017).

Chamber of Commerce NT and Tourism Central Australia (2017) investigated the airfares between
Darwin and Alice Springs. The distance between Darwin and Alice Springs is 1310km, slightly less than
Brisbane to Cairns at 1380km. The difference in pricing and servicing is significant, with Brisbane to
Cairns offering 14 flights ranging in price from $85-192 (booked 1 week in advance), while Darwin to
Alice Springs offers 3 flights ranging from $321-340 (Chamber of Commerce NT & Tourism Central
Australia, 2017). Currently in Darwin we have price fluctuations that are inhibiting travel to our region.
For example, a general one-way fare from Darwin to a major capital city in Australia can be purchased
for approx. $350, this is very similar to a one-way fare to Singapore (similar travel time). However,
during the dry season (May to Sept), this rate can fluctuate by up to 300% (Tourism Top End, 2018).

Airfares to and from Mount Isa are between two to three times higher than east coast Australian routes
(Mount Isa City Council, 2018).Mount Isa City Council (2018) compared the airfares from and to Mount
Isa with similar airports and routes (with comparable distance, route passengers, airport passengers and
load factors). It suggested that airfares per flying km ($/km) for remote regional airports such as Mount
Isa (Qld), Alice Springs (NT), Karratha (WA) and Carnarvon (WA) are much higher than other regional
airports and routes (Table 3 and Table 4).

                                   Table 3: Airfare comparison (long haul)*

                                   *Cited from (Mount Isa City Council, 2018)

                                                       6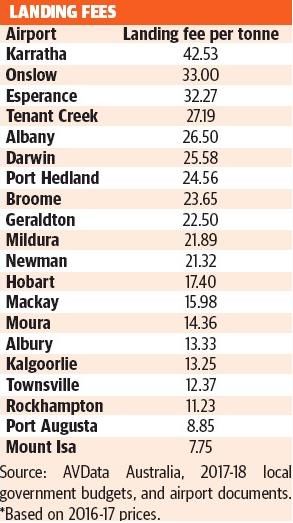
Table 4: Airfare comparison (medium haul)*

                                   *Cited from (Mount Isa City Council, 2018)

These relatively higher airfares do not come with a premium service. For example, submissions to the
Senate Inquiry into Regional Air Services from NT Government and Mount Isa City Council (Mount Isa
City Council, 2018; Northern Territory Government, 2018) claim that they are increasingly being serviced
by ageing aircraft with poorer on-time and cancellation performance.

We collected the airfare data from the airlines’ official online booking systems on 27 April 2018. We
collected the 4 days return airfares of direct flights between the city pair departing in two weeks (i.e.
departing on 14 May and returning on 17 May 2018). We picked the available lowest fares at the entry
level (e.g. Red e-Deal for Qantas, Starter for Jetstar, and Gateway for Virgin) (Table 5).

                                                       7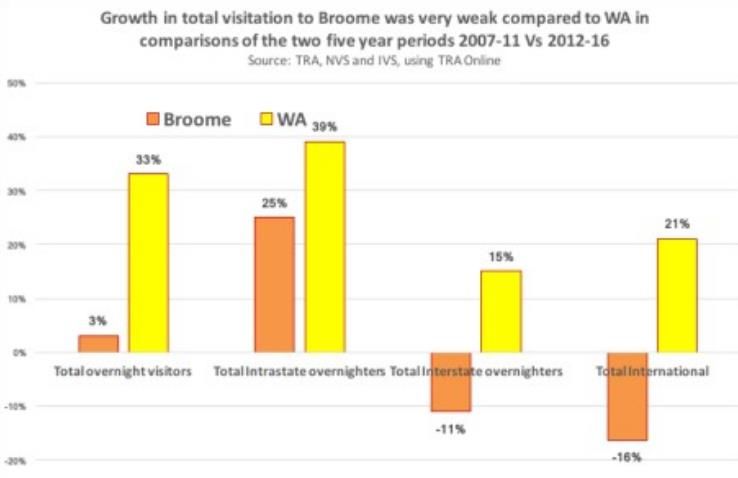
Table 5: Airfares from Capitals to Capitals and some regions (NT, QLD and WA) (return fares for 14-17 May 2018)*
Airport      Airlines    Sydney         Adelaide      Brisbane     Perth     Melbourne           Tennant   Katherine   Alice      Ayers Rock    Broome     Mount      Kalgoorlie
                                                                                                 Creek                 Springs                             Isa
Darwin       Qantas      737 (2         853           650 (2       937       746                                       673 (2     967 (no
                         direct                       direct                                                           direct     direct *via
                         flights)                     flights)                                                         flights)   AS)
             Jetstar     471            471           368                    452
             Virgin      920            700           570          819       643                                        642
             Air                                                                                 678       774         714
             North                                                                               (18/05    (18/05      (18 /05
                                                                                                 return)   return)     return)
Perth        Qantas      681 (7         580 (4        690 (5                 598 (8 direct                             834     908 (no          611                   495 (3
                         direct         direct        direct                 flights)                                          direct *)                              direct
                         flights)       flights)      flights)                                                                                                        flights)
             Jetstar     472            494                                  452 (2 direct
                                                                             flights)
             Virgin      620 (4         530 (2        620 (4                 558 (4 direct                                                      563 (3
                         direct         direct        direct                 flights)                                                           direct
                         flights)       flights)      flights)                                                                                  flights)
Brisbane     Qantas      288 (21        436 (4                               360 (12                                   803        747 (no                  756 (2
                         direct         direct                               direct                                    (no        direct *)                direct
                         flights)       flights)                             flights)                                  direct)                             flights)
             Jetstar     232 (6         336                                  292 (3 direct
                         direct                                              flights)
                         flights)
             Virgin      258 (19        370 (3                               318 (13                                                                       784
                         direct         direct                               direct
                         flights)       flights)                             flights)
* Fares were published on airlines’ official booking websites on 27 April 2018.

                                                                                             8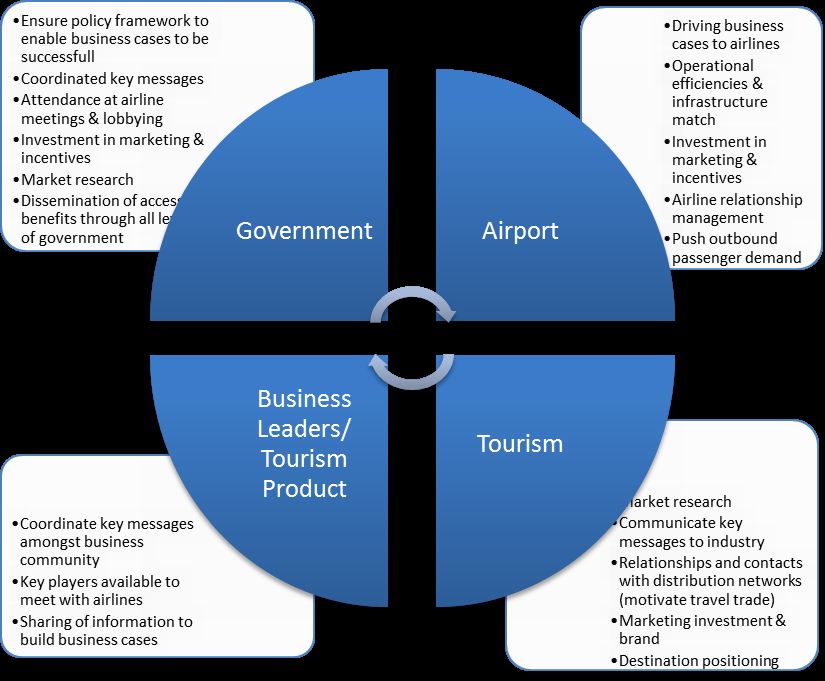
We found that:
  1) the airfares between the capital cities to their intra-state/territory destinations are much
      higher than the capital cities to other capital cities, although the flight distances are always
      much longer than intra state/territory routes. This suggests that regional routes usually have
      higher airfares.
  2) for the same route, the fare of Jetstar is lowest, with Virgin fares in the middle and Qantas
      fares highest. This suggests that cheaper fares could be achieved if airlines adopt different
      management strategies or price setting models.
  3) The more airlines and fights flying the same route, the cheaper the average fares are
      available. This suggests that the competition is an important driver for cheaper airfares.

  3.3. Airfares for central Australia are even higher
Due to the tyranny of distance, flying is often the only option for people living in Alice Springs and
central Australia to travel to other Australian cities. Whilst the high cost of airfares can be mitigated
by booking early or traveling in the offseason, this generally only applies to holiday travellers. People
who are forced to travel on short notice (for medical or legal reasons, to visit sick relatives, or to
attend important family events, including funerals) are forced to pay exorbitant prices, often in
excess of $1,000 for a single return trip (Alice Springs Town Council, 2018).

The data collected from BITRE suggests that Central Australia’s airfares are significantly higher
compared to many other regional destinations to their own capital cities (such as outback Western
Australia and Queensland) (Refer to Table 6). For example, a Qantas return airfare between Alice
Springs and Darwin is $673, while the fare for Broome and Perth is $611 (10% lower than ASP-DRW),
and Kalgoorlie to Perth is $495 (26% lower than ASP-DRW). Travelling from Alice Springs to other
regional airports in the NT (Tennant Creek and Katherine), although shorter distances, is even more
expensive ($678 and $774 respectively).

                                                    9
Table 6: Airfares from regional airports (NT, QLD and WA) (return fares for 14-17 May 2018)*
Airport Airlines Sydney Darwin Adelaide Brisbane Perth Melbourne Tennant Katherine
Creek
Alice Qantas 768 673 (2 direct 489 803 (no direct) 834 710
Springs flights)
Jetstar
Virgin 642 458
Air North 714 (18 May 678 (18 May 774 (18 May
return) return) return)
Ayers Rock Jetstar 491 967 (no direct 753 (no direct) 747 (no direct) 908 (no 556 (half
via AS) direct) direct)
Virgin 574
Broome Qantas 611
Jetstar 1038 (no direct,
via Perth)
Virgin 563 (3 direct
flights)
Air North 738
Mount Isa Qantas 756 (2 direct
flights)
Virgin 784
Kalgoorlie Qantas 495 (3 direct
flights)
* Fares were published on airlines’ official booking websites on 27 April 2018.
10Another significant fact is that in the same region, the airfares for Alice Springs and Ayers Rock are
quite different. The airfare information collected on 19 April 2018 from the Qantas website shows
that the airfares, for example, between Sydney and Uluru are significantly lower than that between
Sydney and Alice Springs (website airfares published for May 1-10, 2018) (Figure 3a, b and Figure 4a,
b, c, d).
Figure 3a: From Sydney Airfares-Red e-Deal Figure 3b: To Sydney Airfares-Red e-Deal ($)
($)
600
600
400
400
200 200
0 0
SYD-ASP SYD-AYQ ASP-SYD AYQ-SYD
Figure 3: Comparison of one-way airfares between Sydney and Alice Springs/Ayers Rock
We compared the Red e-Deal (or Starter for Jetstar) fares. Figure 3a shows clearly that the one-way
fare from Sydney to Alice Springs (10 days average is $417) is consistently higher (52% higher on
average) than to Ayers Rock (10 days average is $273). Although the difference in fares to Sydney is
narrow, the one-way airfare from Alice Springs to Sydney ($384 on average) is still 21% higher than
that from Ayers Rock ($317 on average) (Figure 3b).
Figure 4a: Sydney departure return airfares- Figure 4b: Sydney departutre return
Red e-Deal ($) airfares-Flex ($)
1000 1140
800 1120
600
1100
400
200 1080
0 1060
1-4 2-5 3-6 4-7 5-8 6-9 7-10 1-4 2-5 3-6 4-7 5-8 6-9 7-10
May May May May May May May May May May May May May May
SYD-ASP SYD-AYQ SYD-ASP SYD-AYQ
Figure 4c: To Sydney return airfares-Red e- Figure 4d: To Sydney return airfares-Flex ($)
Deal ($)
1140
1000 1120
1100
500
1080
0 1060
1-4 2-5 3-6 4-7 5-8 6-9 7-10 1-4 2-5 3-6 4-7 5-8 6-9 7-10
May May May May May May May May May May May May May May
ASP-SYD AYQ-SYD ASP-SYD AYQ-SYD
Figure 4: Comparison of return airfares between Sydney and Alice Springs/Ayers Rock
11When we compared return fares between the two routes, it is found that Red e-Deal offers $728-
$906 ($824 on average) for flying from Sydney to Alice Springs and then returning, meanwhile $492-
$692 ($590 on average) for flying to Ayers Rock and returning to Sydney (Figure 4a). The cost for
flying to and from Alice Springs is 40% higher than to and from Ayers Rock. When we looked at the
fares from central Australia to Sydney, we found the same story. The return fares from Ayers Rock
are $538-$692 ($612 on average) while those from Alice Springs are $728-$865 ($758 on average),
that represents 23.7% higher costs for people travelling from Alice Springs (Figure 4c). Interestingly,
when compared the Flex offers, although the fares for Alice Springs (both one-way and return) is
higher than for Ayers Rock, there is no variation (only on 3 May, the fare from Sydney to Ayers Rock
jumps by $50) and little difference (only 2-3%) (Figure 4b, d).
The return airfare we used here is 4 days return, e.g. depart on 14 May, and return on 17 May 2018
which were collected at Qantas website on 27 April. When booking one way or return from either
direction, there is no difference for the airfare for each leg. However, there might be slight
differences in return fares if departing from different airports. For example, for the route Alice
Springs-Sydney, the return fares departing Sydney or Alice Springs are $768; but for Ayers Rock-
Sydney route, the return fare departing Sydney is $471, while the fare departing Ayers Rock is $491.
We used the average return fares for each route to compare the differences (Table 7).
Table 7: Comparison of average return Airfares between Sydney and Darwin, Alice Springs and Uluru
Flight
Red e-Deal/Starter Flex/Max distance
(km)
Airfare % difference % difference
Airfare ($)
($)($/km) (F-D)/D (F-D)/D
Sydney-Ayers Rock (Jetstar) 1086 2181
481 (0.2205)
(D) (0.4979)
716.5 1267 16.7% (- 3155
Sydney-Darwin (QF) (F) 49.0% (3.0%)
(0.2271) (0.4016) 19.4%)
1117 2022
Sydney-Alice Springs (QF) (F) 768 (0.3798) 59.7% (72.2%) 2.9% (10.9%)
(0.5524)
33.5% 1052 -3.1% 1305
Alice Springs-Darwin (QF) (F) 642 (0.4920)
(123.1%) (0.8061) (61.9%)
Data sources: 14-17 May return ticket, checked on 27 April from Qantas website.
The published fares suggest that the return fare for Sydney-Ayers Rock is the lowest and that for
Sydney-Alice Springs is the highest which is even more expensive than flying the route Sydney-
Darwin (Figure 5).
Return fares comparison ($)
1500 1267
1086 1117 1052
1000 716.5 768 642
481
500
0
Red e-Deal/Starter Flex/Max
Sydney-Uluru (*) (Average) (D) Sydney-Darwin (Average) (F)
Sydney-Alice Springs (Average) (F) Alice Springs -Darwin (Average) (F)
Figure 5: Return fares comparison in $
12If we compared the fare rate per km flying distance, the rate for Alice Springs is very high. The route
between Alice Springs and Darwin reveals the highest return fares, and Alice Springs-Sydney follows
as the second highest compared to Ayers Rock-Sydney and Darwin-Sydney (Figure 6).
Return fares comparison ($/km)
1.0000
0.8061
0.8000
0.4979 0.5524
0.6000 0.4920
0.3798 0.4016
0.4000
0.2205 0.2271
0.2000
0.0000
Red e-Deal/Starter Flex/Max
Sydney-Uluru (*) (Average) (D) Sydney-Darwin (Average) (F)
Sydney-Alice Springs (Average) (F) Alice Springs -Darwin (Average) (F)
Figure 6: Return fares comparison in $/km
We found that:
1) the airfares between Alice Springs and capital cities are much higher than other regional
routes, such as Broome and Kalgoorlie (refer to Table 5);
2) the airfares from and to Alice Springs are much higher than the airfares from and to Ayers
Rock (refer to Table 5 and Figure 5); and
3) Considering the flying distance, airfares for Alice Springs are extremely high, compared to
Ayers Rock and Darwin (refer to Table 7 and Figure 6).
4. Social & economic impacts of high airfares
As demonstrated, central Australia’s airfares are high. They are even much higher considering social
economic disadvantages in this region: lower average income per capita, lower (smaller scale of)
business revenue, and higher staff turnover with associated increased recruitment and training
expenses, and higher cost of living. The high fares negatively impact on people’s movement as well
as on social and economic development in the region.
4.1. Stakeholders’ perceptions
People have suffered financially from the high airfares. Many residents are seeking solutions. In
Mount Isa, a family of four will save over $2000 by driving 903 kilometres to Townsville and then
catching a flight to Brisbane, rather than catching a direct flight to Brisbane (Mount Isa City Council,
2018).
In Alice Springs, locals often drive for 5 hours to fly to capital cities from Ayers Rock, as it is much
cheaper than in Alice Springs (Alice Springs Town Council, 2018; Chamber of Commerce NT &
Tourism Central Australia, 2017).
The high cost of airfares is often a major reason for people to move away from Alice Springs. The ABS
ERP that shows that the population of Alice Springs has declined every year since 2011 (Australian
13Bureau of Statistics, 3218.0 Regional Population Growth, Australia, “Table 7. Estimate Resident
Population, Local Government Areas, Northern Territory”) (Alice Springs Town Council, 2018).
The unfairly high airfares from Alice Springs has been a hot topic in local media, which increased
recently while the Senate Inquiry into the regional air-services visited town. We collected and
summarised some of these media responses in Table 8.
Table 8: Some media responses to high airfares
Date Media Title Issues
Nov 28, Centralian Is this fare? About 1) Services warning in Yulara bargains; 2) High flight
2017 Advocate Senate Inquiry to prices anger in Alice; 3) Airlines rely on volume first,
P1 and P7) investigate regional to achieve profitability; 4) All of my peer group feel
airfares pressured by flight prices
Feb 20, Centralian What’s a fair fare for all? Australia’s in need of a Ryanair-style shake-up
2018 P12 Advocate
Mar 6, Centralian Flight cost Alan Joyce speaks at the launch of the new
2018, p3 Advocate questions Dreamliner in Alice Springs on Friday.
for Qantas
April 6, Centralian Low cost flight of fancy Senate inquiry interested in Alice and Uluru price
2018 p3 Advocate disparity
April 6, Centralian It’s time for airlines to 1) Interviews with Alice Springs residents and visitors
2018 p15 Advocate give travellers a fare go 2) Remote situations outlined
April 10, Centralian Blow to backpacker 1) Blow to backpacker market
2018 p9 Advocate market 2) too expensive to fly to receive awards
3) Family paying price for costly education thanks to
soaring airfares
April 24, Centralian Locals continue to fight 1) Will Low Cost Carriers come back?
2018 p15 Advocate for fair fares to the Alice 2) Competition between Alice Springs and Ayers Rock
4.2. Impacts on local businesses
Not only do people in Alice Springs have to pay a higher price for flights, it also negatively impacts
local businesses, resulting in low wage growth and a lack of employment opportunities. Local
businesses need people to spend money, however, the reality is that there are fewer residents in
Alice Springs than in 2011, and the combination of high cost of living and high cost of airfares forces
people to hold on to their money in case of an emergency (Alice Springs Town Council, 2018). As a
result, the issue of staff attraction and retention are important for Alice Springs, especially since Alice
Springs is also a very transient town. Consequently, it is important to make the town an attractive
place to live; this includes the ability to travel elsewhere in Australia for a fair price (Alice Springs
Town Council, 2018).
The cost of doing business in the Northern Territory including central Australia is significantly higher
than other parts of Australia, due in no small part to the high cost of travelling long distances.
According to a survey conducted jointly by Tourism Central Australia and the Chamber of Commerce
Northern Territory in early 2018 (Chamber of Commerce NT & Tourism Central Australia, 2017),
51.39% of total surveyed businesses (53.4% from Central Australia, 39.7% from Top End) had an
annual domestic air travel budget over $10,000, which is significant considering most of businesses in
the region are small businesses with limited total budget. 45.32% of respondents confirmed that the
average price they paid for a one-way intrastate fare was more than $400, with a further 44.6%
confirming the average cost was $300-$400. Only 10.07% of respondents paid less than $300 (Figure
7).
14Figure 7: Average you paid (n=139)
50.00%
44.60% 45.32%
45.00%
40.00%
35.00%
30.00%
25.00%
20.00%
15.00%
10.00% 7.19%
5.00% 2.88%
0.00%
Less than $300 About $300 $300-$400 More than $400
Figure 7: Average one-way fare paid by businesses travelling interstate
In the survey, there was not a single respondent happy with the cost and provision of air services. In
their comments, they mentioned many issues associated with the air services, including
compromised business promotion and reduced business productivity, flight cancellation affecting
business operation, lost business and difficulties in staff recruitment. Some comments are aware of
the importance of collaboration in finding a solution (Table 9).
Table 9: Comments about the airfares for central Australia*
Key issues commented Quotes of comments
Compromised business My business is restricted form travelling too much due to the high cost of
promotion and cut flights to and from Alice Springs. I would like to travel more to attend trade
business productivity shows and training, but have to heavily restrict due to high cost of flights. Tis
has a direct impact on my business by not being able to promote at major
trade shows and limits the staff training we can undertake.
My staff and I would fly more often however we chose to drive now due to
costs. It cuts our productivity as we are on the road so much more. We have
flown less and less in the past 5 years and will continue to drive more than fly
while the costs are so high. It is putting too much strain on small business
with the prices we have to pay. I have also had some family not visit for over
6 years as they can't afford to fly in. Family stay in Alice Springs less time as
they have to allow for drive time. I am looking at moving my business to be
based in Adelaide so I can see family more often due to high air fares. It has
also stopped me flying to weddings, birthdays, births, concerts etc as I just
can't afford it.
The increase in airfare cost has meant our business can travel less often and
network less effectively with our customers interstate. This has a huge
negative impact on our business
We could do more business and provide a better service to regional and
remote areas if airfares were reasonable. We can’t service our customers
with the current prices
The greatest cost to the business and the economy is not the cost of flights
for the company -rather it is the isolation and disconnection to the rest of
Australia which has a major impact on keeping people in Alice Springs long
term. This has a negative impact on tourism, private investment and the
sustainability of various social elements. A long term, sustainable population
is paramount to Alice Springs, however, expensive flights makes this difficult.
Cancellation affect business Airlines are continually reducing flights to and from Alice Springs and Qantas
operation has cancelled many of the afternoon flights into and out of Alice Springs to
15lack of numbers, usually just hours before flight is to depart. Difficult in
organising meetings when flights are so unpredictable.
We travel extensively and have seen several flights cancelled in recent
months with no
explanation. We are concerned this will continue to happen when flights are
not full. The cancelled flights then were redirected to another city and took
more than 24 hours to return. This makes it unworkable when setting client
meetings. Air North is also is an alternative, but is often cancelled or delayed.
We are concerned that not only are flights expensive, but they will become
unreliable as well which makes doing business challenging. It also impacts on
liveability for staff who are trying to see family etc. on short trips.
Flights get changed without warning and then you miss your connection flight
as this carrier does not service this area and they do not seem to care that
you are out of pocket or incontinence. This is more than an isolated case. We
would fly more if the price was lower but now we drive more.
Lost business We have lost significant business in the tourism and corporate events
industries due to excessively high flight costs in and out of Alice Springs. It has
affected our business greatly in the
first 6 months of operation. We have the capacity to seat 500 people at a
corporate function and require response from the airlines and the
government as to why flights are prohibitive and detrimental to Tourism in
the region.
We forego many business opportunities due to the prohibitive cost of flights
from Alice Springs within the territory and nationally.
Flights into and out of the Territory are having a detrimental effect on the
Business Events Industry. We are constantly hearing feedback from
organisers that flight and accommodation costs are some contributing factors
as to why the Territory is not selected for a business event.
Staff recruitment and The prices to Alice Springs are ridiculous. They are killing our business. Staff
retention retention is almost impossible as people can't go on leave without paying
around $800-1200 per person return to Sydney or Melbourne. Over
Christmas it was as much as $2000 per person return to Melbourne.
Travel budget depletes very quickly - restrictions on staff due to high travel
cost – training opportunities getting missed
The cost of airfares from and to Alice Springs has a negative effect when
trying to recruit staff from interstate. During tourist season the cost of
interstate fares rises considerably. Business travel is often at short notice, so
we are unable to take advantage of any discount fares, as they are usually
unavailable. When compared to the prices of flights available interstate,
Central Australia continues to be price gouged.
We hire temporary staff from all over Australia and getting temp staff is not
affordable for our business. Further, potential employees are turned off from
moving to Alice Springs to take up positions due to the isolation in particular
expensive airfares. To travel from Uluru is half the cost which is 450km from
Alice Springs. If they can have affordable flights I cannot see why we in Alice
cannot have the same.
Whilst one flight per day to Capital Cities and 2 flights per day with in NT is
acceptable and usable for both business and pleasure travellers, the cost is
far too expensive to allow businesses to work effectively and for families to
travel. It is very hard to encourage families to move to Central Australia
where there is a lot of work on offer when they can't get home to see their
families on holidays. Airlines complain that they need "bums on seat" in order
to run an effective business, however you would have more bums on seats if
the airfares were lower!
16Need to find out why and The cost of flights is prohibitive for business in terms of expenditure and sales
work together to find a with visitors turning away from the region due to the cost. A negative media
solution campaign against the airlines is not going to achieve the desired outcome and
we have to find a way to work with them cooperatively. Find out from them
what we need to do to achieve a better deal that will enable our economy to
grow.
40 years ago we had regular daily interstate flights connecting Alice Springs,
Tennant Creek, Katherine and Darwin with Ansett and TAA, we also had a
great number of overseas flights including Cathay Pacific, Garuda, Royal
Brunei, Qantas, Malaysian Airlines, it seems we have and are continuing to
slide backwards and this with an increase in population and tourism so from
the outside, it is hard to fathom why.
More importantly, when will the government bring some of these freight
companies in to line whereby they charge a surcharge for air freight and
airbags into the NT. Atom is charged $15-$20 for airbags by some companies,
which is the national charge. Many others add a surcharge which will end up
costing between $40-$60 for a bag, which is daylight robbery and has been
going on for years. The subject has been broached with NT politicians as well
as visiting Federal politicians, who are always going to look into it, but to no
avail.
What about there being an agreement for a minimum number of flights
either a week or a month that must be met in order to keep being able to fly
to a certain destination, and or what about a certain number of seats with a
capped price (market equivalent of similar distance within Australia but has
competition so prices are fairer) per week or month to from ie a 1 hour flight
from Sydney to Melbourne is easily found for less than $150, imagine a 1
hour flight from Darwin or Alice, to anywhere for similar cost.
We are finding the cost of service personnel from interstate a large and
inhibitive cost. There are skills not available in Alice Springs that we need to
bring in and it is a huge cost. In addition it makes attendance at conferences
and other events expensive. One of the reasons prices in Alice need to be
higher than the rest of Australia. Taking this a step further, it restricts our
choice when hiring staff...people from interstate think twice when they see
the cost of returning home if working in Alice. It also restricts our access to
investment as new owners see the cost of monitoring an investment in Alice
which inevitably requires some face time.
*Data source: (Chamber of Commerce NT & Tourism Central Australia, 2017)
4.3. Impacts on tourism
Airfare pricing is a consideration for consumers when confirming their travel plans (Tourism Research
Australia (TRA), 2012). Cost is a key deterrent amongst domestic travellers. Expensive airfares are an
important reason for not intending to travel to the NT. Tourists often complain about high airfares:
“The flight prices are bit too expensive”; “Price, it is so far away and so expensive to get there.
Apparently, the airlines believe they need to overcharge their customers. I can fly to New Zealand for
less than $300” (Tourism Top End, 2018).
It is also similar for international tourists travelling around Australia. In general, international tourists
are price sensitive when they travel overseas and plan their intra-country trips. Transport was the
most expected service at both regional and major airports, and included provision of taxis, public
transport links and shuttle buses (TRA, 2016). China is an important international tourist source
market for Australia and also for the Northern Territory. According to Pham, Nghiem and Dwyer
(2017), Chinese visitors are very price sensitive and have a high income elasticity. Chinese visitors are
17very responsive to price signals. Hence, it is important to keep prices in Australia at a reasonable
level, as the impacts of higher prices and price variation will be detrimental to the level of inbound
demand from China, as well as their dispersal to regional regions. Another increasing market is India.
A recent survey on Indian tourists in NT (TRA & Tourism NT, 2018) suggests that Indian travellers are
very price sensitive and value conscious. Moderating the costs of travel to/from and within the NT
would help to encourage visitation. Cost reductions in flights and accommodation would be
particularly well received as this allows more discretional spend on activities. Airline schemes and
partnerships were felt to be necessary to provide more cost-effective airfares and limit the cost of
travelling to the NT. Among the types of promotions that had the largest impact on potential
considerers of the NT, “discounted airfares direct from India to the NT (57%)” and “discounted
airfares from a major Australian city to the NT (52%)” are top listed (TRA & Tourism NT, 2018).
As local providers of information and sales for visitors, tourism organisations in the NT, including
Tourism Top End and Tourism Central Australia, often prepare itineraries for families, only to be
notified that the flights are too expensive, and we will “go to the Gold Coast instead”. Similarly,
research conducted by the Darwin Convention Centre explains the price of airfares across 2016/17
was the reason explained for 2,450 lost delegates. That equates to more than 12,000 lost room
nights and estimated $10 million in delegate spend lost for Darwin (Tourism Top End, 2018).
The high cost of airfares compounds the disadvantage that the people of Alice Springs, and the wider
Central Australia region, experience. Tourism is an important economic driver for Alice Springs, but
due to its remote location, it is dependent on the cost of airfares. Both overseas and domestic
tourists look at the cost of airfares to determine if they can afford to include Alice Springs in their
travel itinerary. As a result, the higher the cost of airfares, the lower the number of tourists that visit
Alice Springs (Alice Springs Town Council, 2018).
The higher fares between Darwin and NT regional airports such as Alice Springs, Ayers Rock, Tenant
Creek and Katherine, compared with airfares between Darwin and capital cities, will be likely to
significantly compromise the dispersal of international tourists from Darwin through the recently
announced direct flights from China. It is more likely, given their price sensitivity, to fly directly from
Darwin to other capital cities. This also will prevent domestic tourists in Darwin from visiting more
regional locations in the NT. Moreover, the higher fares between Alice Springs and Darwin,
compared to the fares between Alice Springs and other capital cities, will discourage residents in the
NT to have holidays within the NT. They will rather fly interstate even overseas instead. This will
negatively impact on intra-territory visitation.
The negative social and economic impacts of high airfares have been experienced in other regions;
especially in the North and Outback. For example, high airfares act as a significant brake on business
in Mount Isa and limit the ability of the local economy to expand and diversify. Similar to Alice
Springs in remoteness, residents and tourists rely heavily on air travel. There is a strong willingness
within the community to drive tourism growth and develop packages to encourage visitors to stay
longer and experience more of the outback. Due to the high cost of air travel, and the low availability
of discount airfares and frequency of flights, the holiday and tour packages have to be costly and,
therefore, are difficult to promote (Mount Isa Tourism Association Inc (MITA), 2018). This loss in
tourism opportunities has a negative impact on its economic development, and its growth as a major
tourism destination.
Being a traditional tourist destination, Broome’s tourism has been decreasing in recent years while
increasing in WA as a whole, according to Flowers’ (2017) Remote Airfares Broome Case Study
(Figure 8). This is, to some extent, associated with high airfares and less connection between Broome
and capital cities and large centres.
18Cited from (Flowers, 2017): Remote Airfares Broome Case Study
Figure 8: Decreased tourist visitation to Broome
5. Determinant factors of airfares
5.1. Ticket price drivers
There are numerous studies exploring the underlying factors that impact on air ticket prices. In
broad terms, the existence of sufficient demand, an airline’s ability to recoup its costs and
competitor dynamics will determine the commercial viability of air services on any route, and these
are also the key factors which underpin airfare pricing (Virgin Australia, 2018).
A study in the US found that there are three key factors impacting the price. They are Density,
Distance and Competition, which explain 52%, 16% and 7% of the variation in average ticket prices
(Surry, 2014). It is found that the biggest individual factor is the “density of demand” in the origin
state. Large states with smaller populations, or states with lower median average incomes, are more
expensive to serve, since lower demand makes it harder to fill airplanes and a dispersed population
makes it harder to service airports. Regarding the impact of distance flown in and out of
destinations, Surry’s study estimated that each additional mile flown adds about 6 cents per mile to
the cost of round-trip tickets. The level of competition is another important price driver. States with
lower median household incomes also tend to be less well serviced by the airlines, with less
competition meaning fewer airline choices and a higher average number of stops between origin and
destination (Surry, 2014).
Gillen and Hazledine (2015) (David Gillen & Hazledine, 2015) studied all flights (about 3000) on all
regional routes (about 250) with scheduled airline services from one of about 130 regional towns or
cities, in regional airline markets in six countries: Australia, Canada, New Zealand, Norway, Sweden,
and a sample of three U.S. states. They suggested that the determinants of service and pricing on
regional routes align with the standard model of the extent of service between city pairs. The study
also shows strong effects of competition on prices and quite substantial intertemporal price
discrimination (i.e. consumers are separated into different groups with different demand elasticities
by charging different price at different points in time) (David Gillen & Hazledine, 2015). A later study
they conducted focusing on Eastern Australia and New Zealand regional routes (David Gillen &
Hazledine, 2016) supported their previous findings and also suggested that Airfares are more
expensive in regional Australia than New Zealand.
19Cameron (2013) examined the economy class airfares published online, totalling some 1,780,832
price points. He grouped the airfares by distance and selected the 20th percentile fare for each
distance (where 20% of fares are less, and 80% are more), to produce a graph showing a clear linear
relationship between distance traveled and airfares (Figure 9). The study then established a simple
equation to model this relationship: Fare = US$50 + (Distance * $0.11). The formula suggests that on
average, a fare costs $50 before any flight distance is taken into account, plus an average of 11 cents
per mile travelled. The research further analyzed the average cost per mile for fares grouped by
airline, using the same methodology. The average costs for Qantas Airways, Virgin Australia and
Jetstar Airways are US$12.9, US$11.2 and US$10.3 respectively (Cameron, 2013).
Figure 9: Linear relation between flight distance and airfare (Cameron, 2013)
However, Cameron also recognized that there are many factors which can influence the costs
including type of aircraft flown, routes flown, local salary and fuel costs, ancillary revenue, and
airport landing fees (Cameron, 2013).
5.2. Airline cost structure
Generally, the overall cost determines available air ticket price. The overall cost will be affected by
many factors. It is critical to explore airline cost structures to understand airfare pricing.
Airline cost structures vary depending on a wide range of factors – their business model, markets
serviced and so on – and are not generally made publicly available by individual airlines. Moreover,
they will vary over time, especially as a result of movements in interest and exchange rates and fuel
prices. The following graphic (Figure 10) provided by the International Air Transport Association
(IATA) –the international airline industry association, gives the broad picture (Australian Airports
Association (AAA), 2018).
20Figure 10: Airline cost structure-1 (Australian Airports Association (AAA), 2018, p32)
In this structure, fuel and oil contributes to one third of total cost, airport charge and passenger
service contributes to less than 10% of the total cost.
Another airline cost structure provided here is cited from (Mount Isa City Council, 2018). Fuel and
salaries are the largest components of airline costs (29% and 20% respectively), and followed by
Ownership (16%) and then Fees & taxes (14%) (Figure 11) and are therefore the most obvious
targets (Mount Isa City Council, 2018).
Figure 11: Airline cost structure-2 (cited from (Mount Isa City Council, 2018))
According to The International Civil Aviation Organization (ICAO, 2017), in the US, aircraft serving
(7%) and traffic servicing cost (11%) (associated with airport use) take around 18% of the total
operating cost for major airlines (Table 10).
21Table 10: Total Airline Operating Cost Breakdown in the US
Functional Cost Categories
Aircraft operating costs – Expenses associated with flying aircraft, also referred to as
“Direct Operating Costs” (DOC)
Aircraft servicing costs – Handling aircraft on the ground, includes landing fees
Traffic service costs – Processing passengers, baggage and cargo at airports
Passenger service costs – Meals, flight attendants, in-flight services
Reservation and Sales costs – Airline reservations and ticket offices, travel agency
commissions
Other costs, including: – Advertising and publicity expense – General and administrative
expense
Total Airline Operating Cost Breakdown (US Major airline total operating costs):
– 44% is aircraft operating expense, which includes fuel, direct maintenance, depreciation, and crew
– 29% is servicing expense • Aircraft servicing (7%)
• Traffic servicing (11%)
• Passenger service (11%)
– 14% is reservations and sales expense This figure was 19.5% in 1993, but declined steadily throughout
the 1990s
– 13% is overhead expense • Advertising and Publicity (2%)
• General and Administrative (6%)
5.3. Airport charges
Although it is suggested in the literature of airline cost structures previously presented (Figure 10, 11
and Table 10) that airport charges take small proportions (from 10-18%), they seem to be an
important concern for Australian airlines flying regional routes (Qantas Airways, 2018; Virgin
Australia, 2018).
According to Australian Airports Association (AAA) (2018), most reginal airports in Australia have a
similar pricing structure that consists of:
• A landing charge levied on the maximum take-off weight (MTOW) of the aircraft, for use of
the airfield;
• A passenger services/facilitation charge levied on a per-passenger basis, for use of the
terminal; and
• One or more security charges, usually levied on a per departing passenger basis, to recover
the costs incurred by the airport in screening passengers and their bags, and perhaps other
matters, in accordance with the relevant aviation security standards.
Generally, the share of airport charges out of airfares varies considerably depending on the charges
themselves, the length of the route, the level of competition on the route and the business model of
the airlines involved. Any estimation based on general cost structure is only a reference to any
specific route. Research currently being conducted for the Australian Airports Association (AAA)
estimates that on average across Australia, airport charges account for less than 10 per cent of fares
(Australian Airports Association (AAA), 2018).
There is difference between regional airports in their airport charges. Despite difficulties, this report
compiles a list of airport charges for a small sample of airports based on limited available information
(Table 11).
22Table 11: Aeronautical and terminal charges for regular public transport airlines, by airport
Mount Isa (1) Townsville (1) Cairns (1) Mackay (1) Broome (2) Kalgoorlie (3) Alice Tennant Darwin (4)
Springs (4) Creek (4)
Aeronautical services (per 16.89 7.36 13.85 20.37 Total charges for a 9.13 18.00 8.86
Pax) complete aircraft
Common user terminal 11.15 5.85 10.50 turnaround were 9.59 10.34
charge (per pax)/ Passenger $9143.83 with the
facilities charges landing fee,
Aeronautical services 10.30 23.65 terminal services 25.58 27.19 25.58
($/tonne MTOW)/landing levy of $3405.60
charge for 132 passengers
Security charge (per 2.60 4.31 13.24 and the same for 9.49 11.03
departing pax) departing flights
Checked bag screening (per 2.90 2.02
pax)
Common user check-in (per 0.23
departing pax)
Passenger screening charge 2.90 2.15 9.95
(per pax)
Estimated total fees 34.5 (With a full
charged for per pax plane of 132
passengers, Virgin)
Data sources: (1) cited from (Mount Isa City Council, 2018); (2) Broome International Airport Aerodrome Charges (Broome International Airport, 2016); (3)Interview with the City of
Kalgoorlie-Boulder council chief executive John Walker (Meachim & Kalgoorlie Miner, 2017); (4) Northern Territory Airports-Conditions of Use 2016-17 (v1.3) (Northern Territory
Airports, 2017)
23We understand the calculation of airport charges is difficult for each airport even for each route, as it
highly depends on types of aircrafts, load factors and other factors such as agreements between
airports and airlines. For example, only for landing fees alone, they vary significantly from one airport
to another, ranging from as high as $42.53 per tonne to as low as $7.75 per tonne, as show in Table
12 (Pilbara News & Zaunmayr, 2017).
Table 12: Landing fees by regional airports (cited from (Pilbara News & Zaunmayr, 2017))
The airport charges include more than just landing fees. The comprehensive overall airport charges
will affect the cost of airlines and further affect the airfares customers have to pay. Case studies
suggest that the airport charges are around 10% of airfares (Case 2 and Case 3). In some cases, the
percentage is even lower (e.g. in Case 1).
24Case 1: Mackay Airport, QLD
(Australian Airports Association (AAA), 2018, p26).
Case 2: Kalgoorlie Airport, WA
City of Kalgoorlie-Boulder council chief executive John Walker said the total charges for a
complete aircraft turnaround were $9143.83 with the landing fee, terminal services levy
of $3405.60 for 132 passengers and the same for departing flights.
“We also have a screening charge of $9.95 per departing passenger, which doesn’t apply
to incoming flights and is actually a revenue-neutral charge — we only charge the airlines
what we are paying the contractor to screen passengers,” he said.
The cheapest flights with Virgin Australia yesterday (22 April 2017) from Kalgoorlie-
Boulder to Perth was $455 at 6.15pm.
With a full plane of 132 passengers, the Kalgoorlie Miner calculated $34.50 of passengers’
fare would go towards airport fees to land one-way, meaning Virgin Australia was
charging $420, which amounts to 70¢ a kilometre.
(Meachim & Kalgoorlie Miner, 2017)
Case study 3: Mount Isa Airport, QLD
Aeronautical charges at Mount Isa do appear high in comparison with these other
airports, being at least double those at Townsville. Moreover, for a flight taking off from
25Mount Isa and landing at Cairns, the airport charges of $47.70 represent over 10 per cent
of the $435 airfare
(Mount Isa City Council, 2018).
According to Virgin Australia (2018), one of the most challenging issues they face is the
disproportionately high charges imposed by a number of regional airports. Qantas Airways also
claims that airport charges per passenger in Northern Australia are higher than in the South, and
these charges play a significant role in forming the airfares in regional Australia. For example, 13 of
the top 15 most expensive airports in Australia that Qantas flies to fall within QLD and WA; Airport
charges are $16 for airports in NSW, VIC, SA and TAS, and $25 for those in QLD, NT and WA (Qantas
Airways, 2018, p9). According to Qantas Airways (2018), one of unique supply factors for regional
destinations is ‘airports exercise monopolistic power over airport charges’ which has a direct impact
on the airfare. It claims indicates that particularly in regional QLD and WA.
Clearly, there are different perceptions regarding the airport charges between airports and airlines.
While airports claim they charge reasonable rates to recover their costs, airlines claim the high
airport charges are one of key factors responsible for high airfares, especially in the North. It is true
that regional airports apply higher airport charges per passenger compared with capital city airports.
However, it is unlikely that these charges play a significant role in airfares remaining costly.
Considering the figures published in the literature and assuming the possible significant movement in
charges in some regional airports, we might argue the proportion could be higher than AAA’s claim
(i.e. less than 10% of airfare). However, even if as high as 20-25 per cent, it would not necessarily
materially affect airfare prices and service volumes.
5.4. Scale of passengers and airfares
Five regional airports in northern Australia: Alice Springs, Ayers Rock, Broome, Kalgoorlie and Mount
Isa, have some similarities in terms of their annual revenue passenger numbers (refer to Figure 12),
remoteness and population (except Ayers Rock).
1,000,000 Annual Revenue Passenger Numbers-Domestic Airlines (5
900,000 airports)
800,000
700,000
600,000
500,000
400,000
300,000
200,000
100,000
0
ALICE SPRINGS AYERS ROCK BROOME
KALGOORLIE MOUNT ISA
Data source: WebAirport_FY_1986-2017
Figure 12: Annual revenue passenger number by regional airport
26We compared the return airfares for some top regional flight routes in the region against their
revenue passenger numbers (Table 13).
Table 13: Qantas airfares for regional routes (published on 1 May 2018)*
REVENUE TOTAL REV A/C Return fares
CITY-PAIR PASSENGERS TOTAL RPKs AVAILABLE TOTAL ASKs PAX TRIPS Red e-Deal
SEATS LF % (14-17 May) $
35 Broome - 313 383 521 412 840 420 767 699 253 659 74.6 3 673 712
Perth
41 Kalgoorlie - 241 869 130 125 522 415 434 223 503 492 58.2 3 436 495
Perth
50 Ayers Rock - 191 479 417 615 699 245 654 535 771 374 77.9 1 391 531
Sydney
61 Mount Isa - 125 273 197 054 429 186 481 293 334 613 67.2 1 835 756
Brisbane
62 Alice Springs 124 466 163 797 256 181 752 239 185 632 68.5 1 201 489
- Adelaide
63 Alice Springs 118 772 154 997 460 211 450 275 942 250 56.2 1 766 673
- Darwin
*Date sources: Domestic_aviation_December_2017annual; Qantas website: booking.qantas.com.au
It is hard to identify the relationship between airport passenger scale and airfares. From the Figure
13, there seems no correlation between return airfares and passenger scale.
800
756
700 712
673
600
531
500 495 489
400
300 313
242
200 191
100 125 124 119
0
Broome - Perth Kalgoorlie - Ayers Rock - Mount Isa - Alice Springs - Alice Springs -
Perth Sydney Brisbane Adelaide Darwin
Passengers ('000) $
Figure 13: Passenger scales and return airfares
6. Discussion
6.1. Current situation and challenges
Booking information suggests that regional airfares in the North especially in the NT and central
Australia are much higher than major domestic and even international routes. Even in the same area,
the airfares for Alice Springs are more expensive than those for Ayers Rock. All stakeholders including
airlines, airports and passengers hold perceptions that the airfares in regional destinations especially
in the northern Australia and outback Australia are high. However, because of the lack of deep
research, it is unclear what the specific reasons driving the consistent high airfares are. For the high
airfares and less routes offered to the largest centre in central Australia-Alice Springs, they seem not
27You can also read