EX-POST EVALUATION OF THE KYOTO PROTOCOL: FOUR KEY LESSONS FOR THE 2015 PARIS AGREEMENT
←
→
Page content transcription
If your browser does not render page correctly, please read the page content below

N°44 May 2014
EX-POST EVALUATION OF THE KYOTO PROTOCOL:
FOUR KEY LESSONS FOR THE 2015 PARIS AGREEMENT
Romain Morel1 and Igor Shishlov2
Signed in 1997, following the 1992 United Nations Framework Convention on Climate Change
(UNFCCC), the Kyoto Protocol (KP) is the first international tool focused on greenhouse gas (GHG)
mitigation involving as many countries: in its final configuration, thirty-six developed countries
committed to reduce their emissions by 4% between 1990 and 2008-2012 – the first commitment
period (CP1). In April 2014, the data from the CP1 was officially published. This report thus presents
the first comprehensive ex-post analysis of the first period of the KP.
In terms of emission reductions – and the effectiveness of the agreement – countries party to the
protocol globally surpassed their commitment reducing their emissions by 24%. While positive, this
“overachievement” appears to be mainly due to the highly-criticized “hot air” – or the emission
reductions that already occurred in economies in transition before 1997 – equivalent to 18.5% of total
base-year emissions. Nevertheless, other developed countries would have complied even without the
“hot air”, as they have globally seen economic growth coupled with declining emissions. This low-
carbon growth can be explained by better primary energy-mix, the continued expansion of the service
sector, declining GHG intensity of industries and outsourcing the production of goods overseas.
Despite a low need to use flexibility mechanisms, KP countries actively embraced all of them.
Based on the results of this report, it is possible to draw four key lessons from the Kyoto experience for
the establishment of a new global agreement that is expected to be signed in Paris in 2015:
1. The GHG emission coverage of the KP was insufficient to stop the growth of global GHG emissions.
Thus, expanding the coverage is a priority. The KP included rules tailored for specific sectors’ or
countries’ contexts that helped ensure their participation. In that perspective, it can be strategic to
implement specific rules as long as it does not jeopardize the global environmental integrity.
2. The KP is presented as an internationally binding agreement on GHG emissions. However, its
binding nature is rather limited and virtual in practice. Extensive negotiations and resources were
dedicated in demarcating the boundaries of compliance and dedicated tools that in some instances
were not really used by countries. Dedicating significant negotiation resources and time, as it has been
the case until now, on emissions reduction commitments and their legally binding nature may thus not
be the most efficient approach.
3. Implementing Monitoring, Reporting and Verification (MRV) procedures is essential to build trust
among countries and to recognize various domestic policies implemented. Therefore, it is an essential
characteristic for any global agreement on climate change. The KP initiated the development and
implementation of several MRV frameworks providing reliable and transparent information on GHG
emissions and emission reductions.
4. Flexibility should be integrated both in the adoption process and the agreement itself. Similar to the
KP, a new treaty could be adopted in two steps: a framework agreement in Paris and eventually the
detailed rules and mechanisms in the following years.
1
CDC Climat Research, romain.morel@cdcclimat.com
2
CDC Climat Research, igor.shishlov@cdcclimat.com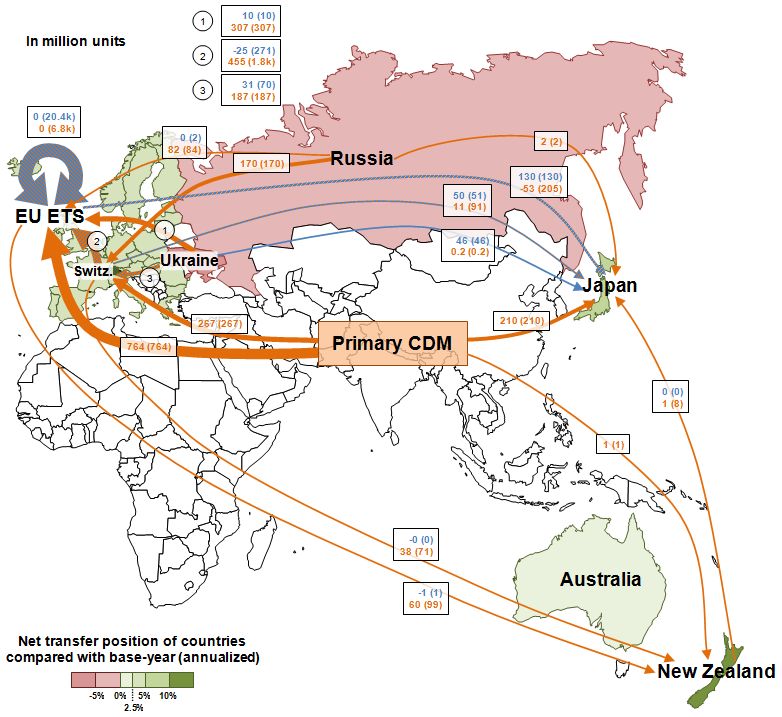
Climate Report n°44 – Ex-post evaluation of the Kyoto protocol:
                                      Four key lessons for the 2015 Paris Agreement

    ACKNOWLEDGEMENTS
    The authors would like to thank all those who helped with preparing this report and in
    particular Yves André (CDC), Cécile Hanoune (European Commission), Sylvie Lemmet,
    Dimitar Nikov, Baptiste Perrissin-Fabert, Paul Watkinson (French Ministry of Environment)
    and Thomas Roulleau (French Ministry of Finance) for their precious technical inputs and
    clarifications provided. They also deeply thank Valentin Bellassen (CDC Climat Research)
    for his valuable inputs and challenging ideas.
    The authors take sole responsibility for findings or ideas presented in this report as
    well as any errors or omissions.

    Publication director: Benoît Leguet - ISSN 2101-4663

    To receive regular updates on our publications, send your contact information to research@cdcclimat.com

    Press contact: Maria Scolan - + 33 1 58 50 32 48 - maria.scolan@cdcclimat.com

    This publication is fully-funded by Caisse des Dépôts, a public institution. CDC Climat does not contribute to the financing of
    this research.

    Caisse des Dépôts is not liable under any circumstances for the content of this publication.

    This publication is not a financial analysis as defined by current regulations.

    The dissemination of this document does not amount to (i) the provision of investment or financial advice of any kind, (ii) or of
    an investment or financial service, (iii) or to an investment or financial proposal of any kind.

    There are specific risks linked to the markets and assets treated in this document. Persons to whom this document is directed
    are advised to request appropriate advice (including financial, legal, and/or tax advice) before making any decision to invest in
    said markets.

    The research presented in this publication was carried out by CDC Climat Research on an independent basis. Organisational
    measures implemented at CDC Climat have strengthened the operational and financial independence of the research
    department. The opinions expressed in this publication are therefore those of the employees of CDC Climat Research alone,
    and are independent of CDC Climat’s other departments, and its subsidiaries.

    The findings of this research are in no way binding upon, nor do they reflect, the decisions taken by CDC Climat’s operational
    teams, or by its subsidiaries. CDC Climat is not a provider of investment or financial services.

2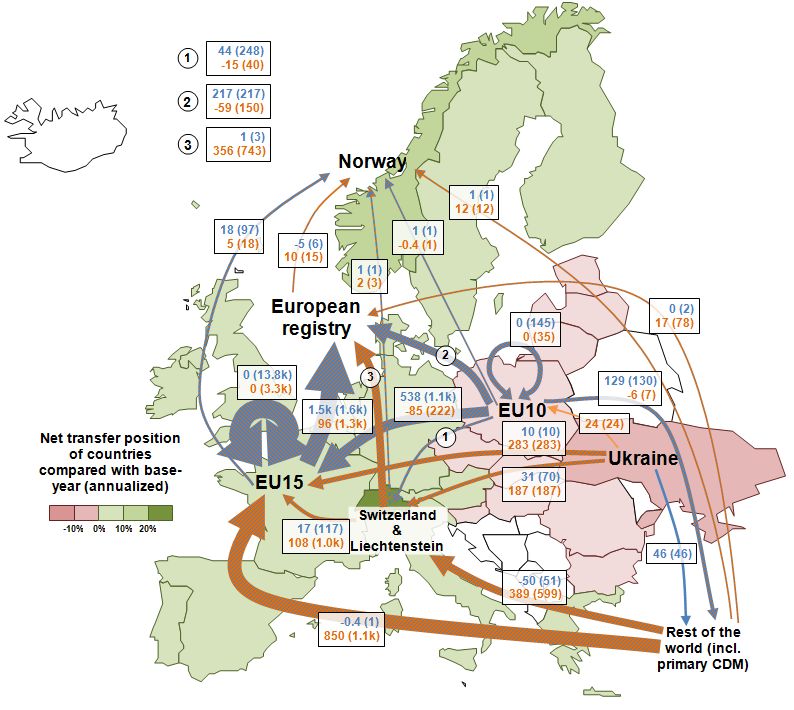
Climate Report n°44 – Ex-post evaluation of the Kyoto protocol:
                                             Four key lessons for the 2015 Paris Agreement

TABLE OF CONTENTS

             TABLE OF CONTENTS                                                                                       3

             INTRODUCTION                                                                                            4

             I. COUNTRIES HAVE GLOBALLY FULFILLED THEIR MITIGATION TARGET UNDER THE KYOTO
             PROTOCOL                                                               5

             A.     Countries participating in the KP have reduced their emissions by 24%, surpassing their commitment
                    of a 4% decrease                                                                           5

             B.     Emission reductions can be explained by structural changes in the economies of industrialized
                    countries and minor changes in their energy mix                                             11

             II. COUNTRIES EMBRACED ALL FLEXIBILITY MECHANISMS, ALBEIT USING DIFFERENT
             STRATEGIES                                                               15

             A.     Thanks to the “Bubbling”, all countries are in a position to comply with their commitments       15

             B.     The trade of carbon units was mainly driven by European companies thanks to the EU ETS 17

             C.     Japan and New Zealand, two ways of building domestic policies using the Kyoto Protocol framework
                                                                                                              22

             D.     Eastern European countries attempted to maximize the economic benefits of the surplus            23

             III. DOHA DECISIONS HAVE SOFTENED THE IMPACT ON THE CP2 OF THE
             OVERACHIEVEMENT UNDER THE CP1 BUT MAY NOT HAVE BEEN SUFFICIENT                                          26

             A.     Countries will be able to carry-over up to 7 billion units but private entities may lose around 70 million
                    units                                                                                            26

             B.     If it wants to use its surplus, Ukraine should officially review its commitment                  28

             CONCLUSION AND POLICY LESSONS FOR AN INTERNATIONAL AGREEMENT IN 2015 30

             APPENDICES                                                                                              32

             REFERENCES                                                                                              35

             LATEST PUBLICATIONS IN CDC CLIMAT’S “CLIMATE REPORTS” SERIES                                            37

                                                                                                                             3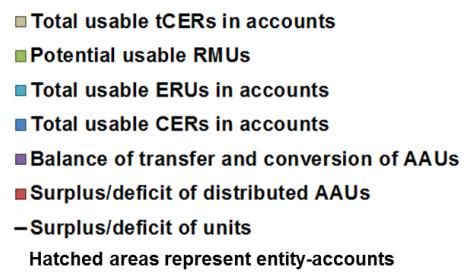
Climate Report n°44 – Ex-post evaluation of the Kyoto protocol:
Four key lessons for the 2015 Paris Agreement
INTRODUCTION
The Kyoto Protocol, which was adopted in 1997, is the first and so far the only tool dedicated to tackling
the issue of anthropogenic climate change at a global level. It follows the 1992 United Nations Framework
Convention on Climate Change (UNFCCC). The Kyoto Protocol established greenhouse gas (GHG)
emissions reduction targets for 37 developed countries and economies in transition – Annex B parties to
3
the Protocol – which pledged to reduce their total GHG emissions during the first Kyoto commitment
period (2008-2012) by 5% compared to the 1990 baseline. These mitigation targets are enounced in
countries’ emissions quotas – Assigned Amount Units (AAU). Besides the emissions reduction targets,
the Kyoto Protocol incorporated so-called “flexibility mechanisms” aimed at containing the cost of
compliance:
“Bubbling” (article 4 of the Protocol) allows a group of Annex B countries to take a collective GHG
emissions reduction commitment and then to share it among them, as it was done by the
European Union countries;
Joint Implementation (JI, Article 6 of the Protocol) allows Annex B countries to offset their
emissions by investing into emission reductions projects in other Annex B countries. JI projects,
thus, generate Emission Reduction Units (ERU), which have to be converted from the AAUs of
the host country. Therefore, JI does not affect the total cap of Annex B countries, but only
redistributes the emissions reduction efforts among them.
Clean Development Mechanism (CDM, Article 12 of the Protocol) allows Annex B countries to
offset their emissions by investing into emissions reduction projects in non-Annex B countries,
which do not have emission caps. Emission reductions from these projects have to be “additional
to any that would occur in the absence of the certified project activity” (Kyoto Protocol 1997). The
CDM projects, thus, generate Certified Emission Reductions (CER) – carbon credits that can be
used by Annex B countries for compliance with their Kyoto targets in addition to their AAUs.
International Emissions Trading (IET, Article 17 of the Protocol) allows Annex B countries to
directly trade their AAUs. Thus, IET does not affect the total cap of Annex I countries, but only
redistributes the AAUs among them. AAU transactions are overseen by the UNFCCC through the
International Transaction Log (ITL).
The roots of the Kyoto Protocol date back to 1992 when the United Nations Framework Convention on
Climate Change (UNFCCC) was adopted at the “Earth Summit” in Rio de Janeiro. The most notable
package of rules for the implementation of the Kyoto Protocol was established at the seventh Conference
of the Parties to the UNFCCC (COP7) in Marrakech in 2001, and is therefore often referred to as the
“Marrakesh Accords”. In order for the Kyoto Protocol to enter into force, at least 55 Annex B countries,
responsible for at least 55% of the CO2 emissions of all Annex B countries in 1990, had to be covered by
instruments of ratification. After the withdrawal of the USA from the Kyoto Protocol, its ratification by
Russia was crucial for reaching this threshold, which eventually happened in 2005. The first Commitment
Period (CP1) spanned from 2008 through 2012 and the roadmap to negotiate a new climate treaty to
4
succeed the Kyoto Protocol after the end of the CP1 was adopted at the COP13 in Bali in 2007. The
COP15 that took place in Copenhagen in 2009 however failed to produce a new agreement and the CP2
(2013-2020) was consequently agreed upon at the COP17 in Durban in 2011 while the implementation
details were signed at the COP18 in Doha in 2012. According to the “Durban Platform”, the new
international climate agreement is planned to be adopted at the COP21 in Paris in 2015 and enter into
force in 2020 (Figure 0-1).
3
Annex B refers to the annex to the Kyoto Protocol, while Annex I refers to the annex to the UNFCCC. Both annexes include
developed countries and economies in transition that have binding emission reduction targets. In order to avoid confusion only
the term “Annex B” will be used throughout this paper. See Appendix 2 for the list of Annex B countries.
4
The negotiations about the second commitment period (CP2) of the Kyoto Protocol started in Montreal in 2005.
4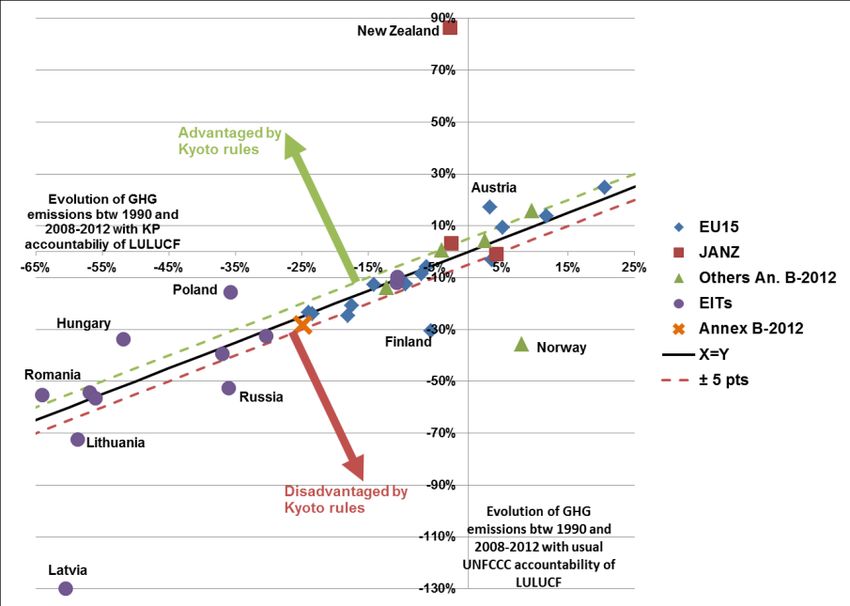
Climate Report n°44 – Ex-post evaluation of the Kyoto protocol:
                                                 Four key lessons for the 2015 Paris Agreement

                                      Figure 0-1 – Key milestones in international climate negotiations

                                                                                                   Source: CDC Climat Research.

               The CP1 under the Kyoto Protocol ended on 31 December 2012; however, complete and detailed official
               data regarding the countries’ emissions and transactions of carbon credits in 2008-2012 was not available
               until April 2014. This data now makes it possible to conduct a comprehensive ex-post analysis of the
               Kyoto Protocol and draw lessons for the new international climate treaty, which is the main objective of
               this research report.

               The paper is structured as follows: section I analyses the fulfillment of the emissions reduction targets
               under the Kyoto Protocol and explains the underlying causes, section II reviews the use of the Kyoto
               flexibility mechanisms and different countries’ compliance strategies, while section III looks at the CP2
               and implications of the Doha Amendments for the Protocol. Conclusions are organized to highlight
               lessons that can be drawn from the KP experience for a new global agreement expected in Paris in 2015.

I. COUNTRIES HAVE GLOBALLY FULFILLED THEIR MITIGATION TARGET UNDER THE KYOTO PROTOCOL

A. Countries participating in the KP have reduced their emissions by 24%, surpassing the initial
commitment of a 4% decrease

               Under the Kyoto Protocol, thirty-eight developed countries – accounting for 39% of 2010 global GHG
               emissions – committed to a 5% decrease of their emissions between 2008 and 2012 in comparison with
               their base-year emissions – most often 1990. With the non-ratification of the KP by the USA and
               withdrawal of Canada, the commitment of the 36 remaining countries – accounting for 24% of global GHG
               emissions in 2010 – is equivalent to a 4% decrease of their emissions.

               The majority of countries reduced their emissions more than required

               Among the 36 countries that fully participated to the first commitment period of the Kyoto Protocol (CP1),
               only eight countries emitted higher levels of GHGs than initially committed (Figure I-1). These countries
                                                                  5
               represented 20% of emissions of Annex B-2012 countries during the CP1. Thus, to comply with their
               commitment, they had to use the flexibility mechanisms (see section II).

               Furthermore, all “economies in transition” (EIT) countries reduced their emissions more than committed.
               The resulting surplus allowances are often called “hot air” as the majority of these emission reductions
               occurred before 1997 (Figure I-2). Even though these emission reductions are not due to the Kyoto
               Protocol, they result from strong changes in these countries’ economies (see below). The two countries
               that eventually did not participate in the KP – the USA and Canada – have higher emissions than their
               target.

               At a broader level, the underachievement of some countries is more than offset by other KP-countries.
               This result is true even without accounting for the surplus from EITs. The emissions data show also that,
               even if the USA and Canada had participated in the KP, developed countries would have globally
               complied with their commitments (Figure I-1).

               5
                   Annex B countries as of 31 December 2012, i.e. excluding the USA and Canada.

                                                                                                                             5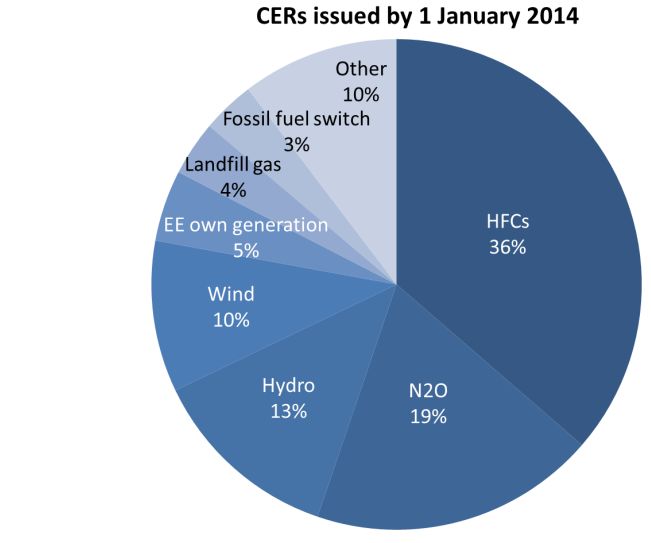
Climate Report n°44 – Ex-post evaluation of the Kyoto protocol:
                                     Four key lessons for the 2015 Paris Agreement

       Figure I-1 – 2008-2012 emissions compared with targets under the Kyoto Protocol by country

    Note: The emission data include the LULUCF with the application of articles 3.3, 3.4 and 3.7 of the Kyoto Protocol as it is
    reported in countries’ inventories

                                     Source: CDC Climat Research calculations based on UNFCCC and national inventories data.

6
Climate Report n°44 – Ex-post evaluation of the Kyoto protocol:
                                 Four key lessons for the 2015 Paris Agreement

“Hot air” and the non-participation of the USA and Canada reduced the need for further
efforts6

Usually, the overachievement of the global Kyoto target is explained by three main factors:

    1.   “Hot air” from economies in transition;
    2.   The non-participation of the USA and Canada;
    3.   The international economic crisis that decreased GHG emissions.

On the one hand, in 1997, negotiators were aware of the “hot air” and expected large transfers of units
between the USA and EITs. On the other hand, the non-participation of the USA and the withdrawal of
Canada were allowed under the Kyoto Protocol. Thus, it is possible to assess the decisions made during
the Kyoto conference surrounding factors 1 and 2.

Concerning factor 1, Figure I-2 shows that most of emissions reductions occurred in EITs before 1997.
Thus, to cancel the “hot air” effect, we “cancel” the emission reductions that occurred in EITs before
     7
1997. The value of the “hot air” is then the difference of emissions between base-year emissions and
1997 in EITs, totaling 2.22 GtCO2e per annum.

This cancellation is translated in a new KP target, artificially decreasing the annual cap by 2.22 GtCO2e
per annum. It illustrates a new target integrating already-achieved emission reductions when the KP was
signed. While for Annex B-2012 countries, the official target is -4%, the target cancelling hot air would
have been -22.5%.

                   Figure I-2 – Evolution of absolute annual emissions for KP countries

Reading notes: All Annex B-2012 emissions for the base-year are represented in purple with diagonal lines. 1997 emissions
for these countries were 9.7 GtCO2e and annual emissions decreased by 2.22 GtCO2e in EITs and by 0.08 GtCO2e in other
countries between the base-year and 1997.

                                Source: CDC Climat Research calculations based on UNFCCC and national inventories data.

Figure I-2 illustrates that in case of cancelling hot air, a very small amount (32 MtCO2e) of further
emissions reductions would have been needed by KP countries to comply. Adding the LULUCF rules (see
p.8) would be enough to make KP countries globally compliant in case of cancelling “hot air”. Moreover,
the CDM would have further reinforced the compliance by adding new units (see section II).

Concerning factor 2, as seen in Figure I-3, if all the initial signatories would have participated in the KP,
the global emission reduction objective would have already been achieved in 1997 at the moment of

6
 For methodological reasons and issues with the lack of data, this section does not take into account the LULUCF emissions.
As shown on p. 9, this estimate should not have a significant impact on the overall global balance.
7
  It is coherent with the fact that the KP was signed in 1997 and it is approximately the date when the GDP of EITs started to
recover.

                                                                                                                            7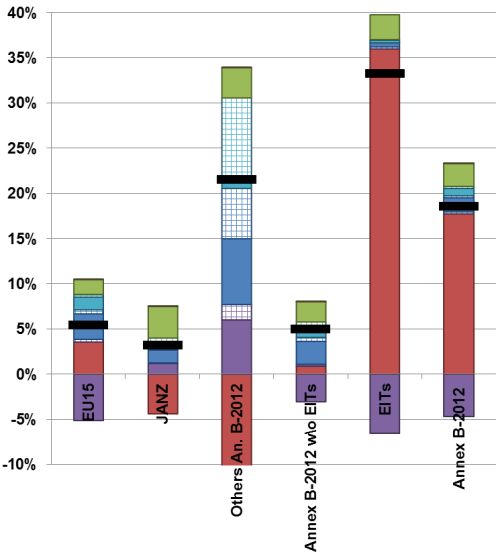
Climate Report n°44 – Ex-post evaluation of the Kyoto protocol:
                                  Four key lessons for the 2015 Paris Agreement

    signature. As emissions increased to 2007, these countries would have had just to stabilize emissions
    levels, at the beginning of the CP1 to comply. Moreover, in case of participation of the USA and Canada,
    the 2008-2009 crisis would have given a comfortable margin to countries. Nevertheless, in terms of the
    compliance of individual countries, this would have required significant transfers of carbon units between
    countries (see Figure I-1).

    Figure I-3 also shows that the cancellation of “hot air” would have necessitated substantial further efforts
    from countries to comply globally. Indeed, the deficit of carbon quotas would have been around
    1.2 GtCO2e per year on average, representing 6.4% of base-year emissions. In its current development
    level, the CDM would not have been sufficient to satisfy this demand of credits.

    The 2008-2009 crisis had a comparable impact on developed countries emissions to the fall of the USSR:
    annual emissions declined by 1.5 GtCO2e in developed countries between 2007 and 2009 while annual
    emissions declined by 2.22 GtCO2e in EITs between the base-year and 1997.

    Thus, four ex-post lessons can be extracted from this analysis:

        1.   As soon as the “hot air” was included, the participation of North-American countries was essential
             but not sufficient to make the KP’s target lower than business-as-usual (BAU) emissions;
        2.   If North-American countries had participated, the unplanned crisis would have given a margin to
             countries. Thus, no further efforts above those realized would have been needed;
        3.   In order to globally trigger further efforts than observed, it would have been necessary to –
              partially or totally – cancel the “hot air” by setting more ambitious mitigation targets to EITs;
        4.   Fixing absolute reduction targets leaves the system vulnerable to the impact of economic shocks
             even for developed countries.

       Figure I-3 – Absolute annual evolution of emissions for KP countries including the USA and
                                                  Canada

                                Source: CDC Climat Research calculations based on UNFCCC and national inventories data.

    One of the data that was obviously not available in 1997 was the evolution of emissions between 1997
    and 2007 and especially the impact of the recovery of former USSR and Eastern European countries. The
    generosity of the “hot air” would have been limited by rising GHG emissions in EITs. The rise of GHG
    emissions in EITs has eventually been limited, especially compared with the growth of emissions in North-
    American countries during the same period.

    While specific accounting rules may be game-changing at the country level, the global
    impact was limited

    When the Kyoto Protocol was signed in 1997, the accounting rules for Land-Use, Lad-Use Change and
    Forestry (LULUCF) emissions were not finalized. Nevertheless, their inclusion in the KP was made
    through the articles 3.3, 3.4 and 3.7.

8
Climate Report n°44 – Ex-post evaluation of the Kyoto protocol:
Four key lessons for the 2015 Paris Agreement
Article 3.4 allows countries to optionally include in their national inventories the carbon emissions and
sequestration related to the management of forests, croplands and grasslands. In practice, this mainly
concerns forests and includes all changes in the carbon stocks of lands that have been forests since
1990. The Kyoto Protocol caps the quantity of Removal Units (RMUs) that a country can receive from a
positive "3.4 budget", in principle to factor out effects linked to the normal aging of forests and the
acceleration of their growth because of climate change. In practice however, the generosity of this cap is
not clearly related to these effects.
Article 3.3 requires an accounting for emissions and sinks linked to reforestation and deforestation
resulting in land use changes. The net variation between 2008 and 2012 of the carbon stock of these
lands, the use of which has changed since 1990, constitutes the "3.3 budget".
Article 3.7 only concerns countries for which LULUCF was a net source of emissions in 1990. For these
countries, LULUCF emissions in 1990 give right to AAUs as well as for other sectors. In principle, this was
intended to reward a potential decrease in LULUCF emissions over the CP1.
Only 5 countries decided to use article 3.7: Australia, Ireland, the Netherlands, Portugal and the United
Kingdom. Australia and Portugal benefited the most from this article – an increase of 31.6% and 1.6% of
their base-year emissions respectively while it was negligible (Climate Report n°44 – Ex-post evaluation of the Kyoto protocol:
Four key lessons for the 2015 Paris Agreement
Figure I-4 – Impact of LULUCF rules under the Kyoto Protocol on the achievement of emissions
targets
Notes: LULUCF was not integrated for USA and Canada as those countries did not provide any LULUCF-related information
under KP. A large black bar on the left side or below of a grey bar, means that the given country could be compliant without
the use of flexibility mechanisms.
Source: CDC Climat Research calculations based on UNFCCC and national inventories data.
10Climate Report n°44 – Ex-post evaluation of the Kyoto protocol:
Four key lessons for the 2015 Paris Agreement
Figure I-5 – Impact of LULUCF rules under the Kyoto Protocol compared with LULUCF accounting
in UNFCCC inventories
Notes: USA and Canada are not represented as those countries did not provide any LULUCF-related information under the
KP.
Source: CDC Climat Research calculations based on UNFCCC and national inventories data.
B. Emission reductions can be explained by structural changes in the economies of industrialized
countries and by minor changes in their energy mix
8
Annex B-2012 countries managed not only to decrease their emissions by 20% between 1990 and 2011
9
but they also managed to increase their GDP by 36% in the same time period. Thus, a decorrelation
between GHG emissions and GDP has been observed for these specific countries while, at the global
level, GDP and GHG emissions grew respectively by 89% and 37% between 1990 and 2010.
Without assessing the role of the Kyoto Protocol in these evolutions, it is however possible to identify the
underlying causes. Countries’ pathways on GDP and GHG emissions can be roughly divided in three
groups: “Annex B-2012 without EITs”, “EITs” and “USA & Canada”.
While the USA and Canada did not considerably improve their energy-mix, countries
participating in the KP did
By comparing the evolution of GHG emissions, energy consumption and GDP since 1990, it is possible to
understand the sources of the decorrelation between GDP and GHG emissions. Indeed, the decorrelation
can be explained by two main phenomena: a less energy-intensive growth and a less polluting energy
10
consumption that is a consequence of a change in the primary energy mix. The IPCC (2014) shows that
growth tends to be less energy-intensive for all groups of countries even if the rate of decrease may differ
between different groups of countries.
8
Contrary to section I.A, all emissions in this section are emissions excluding LULUCF. In this paragraph, part of the analysis
may not include 2011 and 2012 due to lack of data for these years.
9
Annex B-1997 countries decreased their emissions by 10 % between 1990 and 2011 while increasing their GDP by 47%.
10
The IPCC (2014) explains the global evolution of CO2 emissions with four factors: carbon intensity of energy, energy
intensity of GDP, GDP per capita and population. Our analysis differs from the IPCC by focusing on the decorrelation between
GDP and GHG emissions.
11Climate Report n°44 – Ex-post evaluation of the Kyoto protocol:
Four key lessons for the 2015 Paris Agreement
Figure I-6 – Decorrelation between GDP and GHG emissions with less energy-intensive growth
and change in the primary energy mix
170% 170%
Annex B-2012 w\o EITs EITs
160% 160%
150% 150%
140% 140%
130% 130%
120% 120%
110% 110%
100% 100%
90% 90%
80% 80%
70% 70%
60% 60%
170% 170%
Annex B-2012 USA & Canada
160% 160%
150% 150%
140% 140%
130% 130%
120% 170% 120%
160% 2012 Annex B
110% 150% 110%
100% 140% 100%
130%
90% 120% 90%
110%
80% 100%
80%
70% 90% 70%
80%
60% 70% 60%
60%
1990 1991 1992 1993 1994 1995 1996 1997 1998 1999 2000 2001 2002 2003 2004 2005 2006 2007 2008 2009 2010 2011
Decorrelation due to change in the primary energy mix Decorrelation due to less energy-intensive growth
GHG emissions evolution GDP evolution
Energy consumption evolution
Note: Energy consumption data is not available for all countries in 2012 and data are not available for Liechtenstein and
Monaco for the whole period. Estonia, Croatia and Ireland are not counted either due to incomplete data series.
Source: CDC Climat Research calculations based on UNFCCC, national inventories and World Bank data.
Figure I-6 shows that these two phenomena do not play the same role in the observed low-carbon growth.
In the USA and Canada, the change in the energy mix is marginal compared with a less energy-intensive
growth. On the contrary, the role of the change in the energy-mix is much more important in countries that
participated in the KP. For example, on the Figure I-6, for EU15 countries, the red area illustrating the
impact of the change in the energy mix represents 45% of the total area (blue and red) representing this
decorrelation. This share goes up to 80% for Japan. Nevertheless, the change in the Japanese primary
energy mix after Fukushima almost canceled the improvement of the primary energy mix compared with
1990.
The reduction in the carbon intensity of the energy mix in Western countries is mainly due to a switch from
oil to gas. A small decrease in the share of coal and a small increase in the share of renewable energy in
the primary energy mix can also be observed. This is the general overview for Western countries and
energy mix may have changed differently at the national level.
A less energy-intensive growth can be explained by two main factors: a more efficient economy and a
shift of the economy from emissive activities (e.g. industry) to less emissive activities (e.g. services).
The low-carbon growth is mainly due to the expansion of the service sector…
The evolution in the sectors contributing to growth since 1990 (Figure I-7) shows that all the cumulated
growth of annex B-2012 countries comes from services. The contribution of agriculture and industry to
growth is almost neutral for these countries between 1990 and 2010. In EITs, these sectors did not
manage to fully recover in terms of GDP from their decline post-fall of the USSR.
Without taking into account its electricity consumption, the industry sector represented 23% of annex B-
2012 countries’ GHG emissions in 1990 and 37% of their GDP. In 2010, it represented 20 % of their
emissions and 27% of their GDP.
Figure I-8 shows that direct emissions of the industry sector – including combustion and fugitive emissions
but not indirect emissions from electricity consumption – have globally declined in every group of
countries. However, energy industries and transports increased their emissions in western countries.
12Climate Report n°44 – Ex-post evaluation of the Kyoto protocol:
Four key lessons for the 2015 Paris Agreement
Figure I-7 – The contribution of sectors to cumulated economic growth since 1990 is dominated by
services
6 1,5
Trillions (in $2005 PPP)
Trillions (in $2005 PPP)
Annex B-2012 w\o EITs EITs
5 1
4
0,5
3
0
2
-0,5
1
-1
0
-1,5
7 7
Annex B-2012
Trillions (in $2005 PPP)
Trillions (in $2005 PPP)
USA & Canada
66 6
2012 w\o EIT
Trillions
55 5
44 4
33 3
22 2
11 1
00 0
-1 -1
Services Industry Agriculture Cumulated growth
Source: CDC Climat Research calculations based on World Bank data.
Figure I-8 – Evolution of sectoral emissions since 1990
7 6
GtCO2e
GtCO2e
Annex B-2012 w\o EITs EITs
6
5
5
4
4
+ 10.9% 3
3 - 20.2%
- 43.1%
- 23.2% 2
2
1
1
+ 6.7% - 26.2%
0 0
1990 1997 2008 2009 2010 2011 2012 1990 1997 2008 2009 2010 2011 2012
14 9
GtCO2e
GtCO2e
7 USA & Canada
Annex B-2012
Millions
8
12
6
7
10
5
6
48 5
+ 17.9%
+ 0.6%
4
36
- 2.4%
- 32.8% 3
24
2
12
1 + 7.7%
- 12.6%
00 0
19901990 1997 2008 1997 2009 2010 2008 2011 2012 2009 1990 1997
2010 2008 2009
2011 2010 2011
2012 2012
Energy industries Manufacturing Industry and Construction Transport Agriculture Waste Solvent Buildings and others
Note: Transport only includes domestic transport and not international transport (see Box I-2).
Source: CDC Climat Research calculations based on UNFCCC and national inventories data.
13Climate Report n°44 – Ex-post evaluation of the Kyoto protocol:
Four key lessons for the 2015 Paris Agreement
Box I-2 – The missing passenger: international transport
In 1997, international air and maritime transports – known as international bunkers – were not included in
the KP. This choice was based on two technical reasons were advanced: a lack of reliable data and a lack
of consensus on how to attribute responsibility. The threat to global trade and development of non-Annex I
countries is also generally suggested as an argument when climate policies on international transports are
evocated.
However, emissions from international transport increased by 52% between 1990 and 2012 in Annex B-
2012 countries and its share increased from 2.1% of GHG emissions excluding LULUCF in 1990 to 4.4%
in 2012.
Source: UNFCCC and national inventories.
… but is accompanied by less-emitting industry and outsourced production to
developing countries
Part of the decorrelation explained by the decrease of industry’s emissions is due to the outsourcing of the
production of manufactured goods. Indeed, every subgroup of developed countries increased its
11
“consumption-based emissions/domestic emission” ratio (Figure I-9). CO2 emissions based on
consumption decreased by 5.7% in Annex B-2012 countries between 1990 and 2011. However, this
decrease is due principally to EITs as the consumption-based CO2 emissions increased by 5.9% in other
Annex B-2012 countries between 1990 and 2011.
Figure I-9 – Evolution of domestic and consumption-based emissions from energy combustion
and cement since 1990
Source: CDC Climat Research based on Global Carbon Project data.
The increase in consumption-based emissions is a consequence of the increasing use of imported goods
in developed countries. Nevertheless, at the global level, the energy intensity of GDP declined by a
quarter. It shows that the dynamics are more complex than a simple outsourcing of industrial production
from developed to developing countries.
Moreover, it does not necessarily mean that emission reductions that have been observed in developed
countries’ industries are a consequence of this outsourced production, and therefore outsourced
emissions.
11
Any extrapolation to all GHG emissions would be mistaken. Indeed in 2011, CO 2 emissions accounted by the Global
Carbon Project (GCP) represented 75% of GHG emissions excluding LULUCF in Annex B-2012 countries. In Annex B
countries, whilst CO2 emissions accounted in the GCP decreased by 17.6% between 1990 and 2011, GHG emissions
decreased by 22.1% in national inventories.
14Climate Report n°44 – Ex-post evaluation of the Kyoto protocol:
Four key lessons for the 2015 Paris Agreement
Indeed, these emission reductions are largely explained by less-emissive industries rather than a decline
in the production. The Table I-1 illustrates that, in western countries, all the emission reductions observed
in the industry sector are due to the decrease of the emission-intensity of industry sectors. For EITs, this
contribution amounts to roughly 70%.
It is unclear whether the evolution in the emission-intensity of the industry is due to improved efficiency,
changes in the primary energy mix of the industry or increasing role of less energy-intensive industries.
Further country-level analysis would be needed to assess the role of these different factors. At the global
level, the energy intensity of GDP declined by a quarter.
Table I-1 – Assessing the role of GDP decline and less-emissive industries in emission reductions
that occurred in the industry sector
Evolution of the ratio
Evolution of industry Evolution of direct
"emissions / value
value added GHG emissions from
Group of countries added" for the
between 1990 and the industry between
industry between
2010 1990 and 2010
1990 and 2010
Annex B-2012 -2.0% -29.1% -30.5%
EITs -14.9% -35.7% -45.3%
Annex B-2012 w\o EITs 2.9% -22.8% -20.6%
USA & Canada 20.3% -21.4% -5.5%
Source: CDC Climat Research calculations based on national inventories and World Bank data.
II. COUNTRIES EMBRACED ALL FLEXIBILITY MECHANISMS, ALBEIT USING DIFFERENT STRATEGIES
Section I shows that even though Kyoto countries should achieve their aggregate Kyoto target, some
individual parties may not be compliant without the use of flexibility mechanisms (Figure I-1). Therefore,
this part reviews the use of the Kyoto flexibility mechanisms and different countries’ compliance
strategies.
A. Thanks to “bubbling”, all countries are in a position to comply with their commitments
To comply with their commitment under the Kyoto Protocol, Annex B countries must surrender as many
12 13
carbon units as they emitted tCO2e during the CP1. , Eligible units are AAUs – distributed or
14
transferred –, ERUs, CERs, RMUs, t-CERs and l-CERs. All units are listed in national registries whose
15
annual data is published every year. It is therefore possible, based on 2008-2012 emissions , to assess
which countries have enough units in their accounts to cover all their emissions (Figure II-1).
Figure II-1 illustrates the use of different flexibility mechanisms by countries. Indeed, EITs in general –
except for Croatia – partially valorized their surplus of AAUs by transferring them to other countries or
converting them into ERUs, and then transferring ERUs to Annex B countries or private entities.
12
In this section, only countries that actually took part in the KP during the first commitment period are considered. Therefore,
“Annex B” countries refers to “Annex B-2012” countries in the precedent section.
13
The deadline is fixed at the end of the “true-up period“, a 100-days period following the end of the review of the final annual
report (UNFCCC, 2008).
14
See Appendix 1 for definitions. “Carbon credits” refers to CERs/ERUs while “Carbon units” refers to all kinds of KP units.
15
Emissions between 2008 and 2011 are verified. Only 2012 emissions and, in most cases, application of articles 3.3 and 3.4
are not verified yet. Modifications can still happen by the end of the true-up period mid-2015.
15Climate Report n°44 – Ex-post evaluation of the Kyoto protocol:
Four key lessons for the 2015 Paris Agreement
Figure II-1 – Comparison between emissions and units in countries’ account, as of 31 December
2013
Contribution to compliance in percentage of base-year
emissions
Notes:
A country with a black line over the line “0%” should have enough units in its registry to comply under the CP1. A country with
a black line below the line “0%” would need to purchase units from other countries or use the “bubbling”.
As some countries postponed the application of articles 3.3 and 3.4 to the end of the CP1, the amount of RMUs listed in
countries’ accounts does not reflect precisely the expected amount of usable RMUs for the compliance. Therefore, it is
preferable to estimate of usable RMUs based on inventories. Only units listed in “Party holding accounts”, “Entity holding
accounts” and “Retirement account” were accounted. All data – units and emissions – are annualized.
The EU15 figure is the aggregated data from 15 member-states of the EU-15. It does not take into account and the difference
between the EU15 commitment and AAUs to distributed EU15 countries (19 M AAUs), which has been transferred to the
European community registry nor subtract the non-EU part of EU15 countries such as Greenland for example.
Source: CDC Climat Research calculations based on UNFCCC, national inventories and national registries data.
16Climate Report n°44 – Ex-post evaluation of the Kyoto protocol:
Four key lessons for the 2015 Paris Agreement
Only two EU-15 countries lack enough units for compliance at the time of writing, namely Italy and
Luxembourg. In both cases, the deficit of units is partly a consequence of the transfer of units to the
European Union registry. In any case, these countries could use the “bubbling” to comply. Based on the
article 4 of Kyoto Protocol, when EU-15 as a whole has enough units to cover its engagements, every
country within the EU-15 is considered to be compliant. As the EU-15 should comply globally (Figure II-1),
16
there is theoretically no need for these countries to purchase units to comply under the KP. As there is
no agreed rule on which EU15 countries would provide missing units, it seems nevertheless probable that,
17
Italy and Luxembourg would purchase units from other countries if they are still in deficit by early-2015.
The impact of the emission trading schemes (ETSs) cannot be fully observed in Figure II-1. The impact of
ETSs on the emissions and carbon assets balance is twofold. First, under the EU ETS, which covers
various Annex B countries, the cross-border exchange of an EU allowance (EUA) between two EU
Annex B countries automatically implied the simultaneous exchange of an AAU. It is a direct consequence
of the link between the KP and the EU ETS (Point Carbon, 2012). While the trade of AAUs was normally
reserved to countries and not companies, it is therefore mainly driven by the private sector (see below).
Second, countries that have implemented domestic ETSs and allowed entities included in the ETS to use
Kyoto units for compliance have entities-specific accounts in their registry. In particular, countries under
the EU-ETS, Japan and New Zealand are concerned. The role of Switzerland as a hub for carbon credits
trading is illustrated by an over-proportionally high rate of entity-owned units.
When a company surrenders a credit under the EU ETS, the country “retires” this credit and uses it for its
own compliance under the KP. Therefore, these credits are in retirement accounts and are accounted in
solid bars and not hatched bars.
B. The trade of carbon units was mainly driven by European companies thanks to the EU ETS
As seen in sections I.A and II.A, despite national AAU allocations being ultimately above their GHG
emissions creating a surplus of AAUs, countries have used project mechanisms and the transfer of units.
Therefore, a deeper look into the role of different countries in unit transfers seems warranted.
The European Union and Japan were major players in trading units
Trades of carbon units between parties to the Kyoto Protocol are recorded in the registry. It is thus
possible to assess the movement of units (Figure II-2). Two main sources of demand can be observed:
Europe and Japan.
The EU ETS is the main driver of carbon units trading under the Kyoto Protocol
The European case is a bit different of Japan which needed to purchase units to comply and played the
18
game by constantly buying different kinds of units during the CP1. Even if some countries may have
needed to purchase units in order to comply, the transactions within and towards of European countries
were mainly driven by the EU ETS. As seen above, it is directly linked with the trading of EUAs and the
19
eligibility of CERs and ERUs under the EU ETS.
The trading volumes of carbon units on Figure II-2 are dominated by AAUs transfer within EU ETS
countries. Looking at Figure II-3 shows that within EU ETS countries, the main destination of transfers of
CERs and ERUs are EU15 countries. Indeed, these countries purchased more than 1 billion carbon
credits. The high level of AAU transactions within the EU is mainly an illustration of trading volumes under
16
For further information on the interaction between bubbling, EU emissions and EU ETS, see (EEA, 2013).
17
European Legislation is vague about not complying countries within a globally complying bubble: “The European
Community and its Member States shall take the necessary measures to comply with the emission levels” (EC, 2002).
18
The Japanese context is detailed in section II.C.
19
To better understand how carbon credits are used by companies under the EU ETS, see Stephan et al. (2014)
17Climate Report n°44 – Ex-post evaluation of the Kyoto protocol:
Four key lessons for the 2015 Paris Agreement
the EU ETS. The data also shows that this level has also been artificially increased by the VAT fraud
which happened in 2008-2009 (European Commission, 2010).
Figure II-2 – World map of carbon unit trades as of 31 December 2013: Europe and Japan as the
principal sources of demand
Reading notes: Flows of AAUs are in blue, flows of CERs/ERUs are in orange. Figures in parentheses represent volumes
traded. Figures outside parentheses represent the net transfer. The direction of the arrow indicates the net transfer of all
carbon units. A positive figure represents a net transfer in the same direction as the arrow.
E.g.: the volume of carbon units exchanged between EU ETS countries and Switzerland is 271 million AAUs and
1.8 billion CERs/ERUs. The net result of trades between these countries is that Switzerland received 25 million AAUs from EU
ETS countries and EU ETS countries received 455 million CERs/ERUs from Switzerland.
Only exchange volumes higher than 1 million are represented. Australia and Canada transferred units but for small amounts.
Thus, these transfers are not represented.
Source: CDC Climat Research calculations based on UNFCCC, national inventories and national registries data.
In any case, EU15 countries are the principal actors of Kyoto units trading – first trader and first
purchaser. While it is not surprising – as it was a group of major emitters –, it is mainly due to the EU ETS
and more broadly the EU legislation. Indeed, Figure II-1 shows that, with the bubbling, EU15 countries
would have been compliant even without trading carbon units. Therefore, all this trading is not a result of a
“Kyoto strategy” but an “EU ETS strategy” and is therefore company-driven rather than state-driven.
However, when a group of countries are part of the same ETS which is directly linked with the KP throught
the transfer of AAUs/CERs/ERUs – such as the EU ETS –, it seems preferable to include all particpating
countries under the same “bubble” as it is the case for the second period of the KP. Indeed, a country
achieving its target under both KP and EU ETS may, nevertheless, need to purchase units if domestic
18Climate Report n°44 – Ex-post evaluation of the Kyoto protocol:
Four key lessons for the 2015 Paris Agreement
20
installations sold too many EUAs. In that case, the profit of private entities – by selling EUAs – would
create a loss for the State.
Switzerland as a hub, Canada as a dead end
Compared to its own emissions, the role of Switzerland is also remarkable. Indeed, the trading volume of
Switzerland represents 11 times its base-year emissions. Even the net position of the country is unusual
with a surplus of more than one third of its base-year emissions. Switzerland was thus a hub for carbon
units trading and an entry door for carbon units in Europe (Figure II-3). This may be explained by the fact
that many CDM/JI project developers and traders are located in Switzerland and that the Swiss legislation
encouraged carbon offsetting (Stephan et al., 2014 and Shishlov and Bellassen, 2012). The prior
connection of the Swiss registry with the International Transaction Log (ITL) have probably also played a
role as it ensured delivery of the Kyoto credits to the national accounts of European investors before 2008
(Alberola and Stephan, 2010).
The Swiss position is at the very opposite of Canada’s behavior during its participation in the KP (Box II-1)
as few units were traded despite high GHG emissions.
Box II-1 Remaining in the KP would have cost much less than estimated by Canada
In late 2011, Canada announced its withdrawal from the KP, in compliance with article 27 of the Protocol.
The decision entered into force one year later. Despite a large deficit of units (see Figure I-1), Canada did
not purchase a significant amount of units from other countries.
The only visible trades in its accounts are the purchase of 441,302 primary CERs that have since been
cancelled. As these credits were probably contracted prior to the country’s withdrawal, 110,271 CERs
were nevertheless transferred to the Canadian account in 2012, after the announcement of Canada’s
withdrawal.
Based on Canadian emissions inventories, it is short of 728 million units for the whole period – excluding
the impact of LULUCF as it was not reported. In its withdrawal announcement, the Canadian government
explained that not withdrawing would have cost Canada “the loss of thousands of jobs or the transfer of
$14 Billion from Canadian taxpayers to other countries”.
The Canadian estimate seems to be based on a price around 20$/tCO2e. The current average market-
price of CERs/ERUs is around 0.10$/tCO2e. The minimum market cost of compliance would then have
been around $70-80M. Potentially, a higher market cost could have been expected as Canadian demand
would most likely have increased the prices. However, as the additional demand would not have been
sufficient to balance the global market – which would have remained long – the expected increase would
most likely have remained limited. Moreover, another option for Canada was to trade over-the-counter
with other Annex B countries to buy allowances and credits; this option may have further decreased the
cost of compliance.
Source: CDC Climat Research based on Statement by Minister Kent (2011) and Canadian inventories and registries.
20
Example: a country’s emissions are 50 from ETS sectors and 50 non-ETS sectors for the base year. Its target is to stabilize
emissions for both ETS and non-ETS sectors. Verified emissions are 40 for ETS sectors and 60 for non-ETS sectors. If
domestic installations sold their 10 of EUA surplus, the country would lack 10 AAUs, transferred to other EU-ETS countries.
19Climate Report n°44 – Ex-post evaluation of the Kyoto protocol:
Four key lessons for the 2015 Paris Agreement
Figure II-3 - European map of carbon unit trades as of 31 December 2013: a Western rush
Notes: same reading notes as Figure II-2. Iceland did not trade any unit during the CP1.
The European Registry is both the KP registry of the EU as a Party to the Kyoto Protocol and also the EU ETS registry.
Therefore it cannot be attributed to EU15 or EU10.
Source: CDC Climat Research calculations based on UNFCCC, national inventories and national registries data.
The advanced developing countries and transition economies are the main sources of
carbon credits traded under the Kyoto Protocol
As of 1 January 2014 the 7,418 CDM and 603 JI projects that were registered had issued 1,419 million
CERs and 830 million ERUs respectively (UNEP Risoe 2014). Total CERs represent additional allowed
emissions equivalent to 2.4% of base-year emissions for the CP1. Both CER and ERU supplies are
largely concentrated in advanced developing countries and transition economies respectively. Indeed,
over 90% of all issued CERs come from 5 largest CDM countries: China, India, South Korea, Brazil and
Mexico, while African countries account for less than 2%. Similarly, over 90% of all issued ERUs come
from Russia and Ukraine, while Western Europe accounts for only 3% (Figure II-4).
Such a concentrated distribution of CDM and JI projects can be primarily explained by larger absolute and
relative levels of GHG emissions in advanced developing countries and in transition economies and,
hence, larger economically attractive emissions reduction potential. Moreover, in the case of the CDM,
advanced developing countries in Asia and South America provided relatively strong institutional capacity
and relatively favorable investment climate compared to less developed countries in Africa (Shishlov and
Bellassen 2012).
In the case of JI, large AAU surpluses in Russia and Ukraine meant that these countries could pursue the
maximum potential of the offset mechanism without putting their Kyoto compliance position at risk.
Conversely, countries with tighter AAU positions had to be more cautious in approving JI projects in order
to ensure that emissions reductions credited with ERUs were truly additional. Furthermore, potential
projects in Europe in such sectors as renewable power generation or energy efficiency could not be
registered under the JI scheme. This is due to the risk of double counting of emissions reduced under the
EU ETS, unless a special “JI reserve” was created (Shishlov, Bellassen, and Leguet 2012).
20Climate Report n°44 – Ex-post evaluation of the Kyoto protocol:
Four key lessons for the 2015 Paris Agreement
Figure II-4 – CER and ERU issuance by host country as of 1 January 2014
Source: CDC Climat Research based on UNEP Risoe (2014).
From the sectoral perspective both offset mechanisms are also relatively concentrated, albeit in different
sectors (Figure II-5). Indeed, about 55% of all issued CERs originated from projects focused on reducing
industrial gases emissions – HFC-23 and N2O. This dominance can be explained by the earlier start of
HFC-23 and N2O projects, as well as their high returns on investment. Additionally, the large size of these
projects – the 10 biggest projects, all focused on destruction of industrial gases, have issued 45% of all
CERs – enables them to benefit from the economy of scale and submit their monitoring reports more
often. Conversely smaller projects might tend to wait until a large number of emissions reductions is
accumulated in order to reduce transaction costs. Other important sectors in the CDM are renewable
energy, especially hydro and wind power, energy efficiency, waste (landfill gas destruction or utilization)
and fossil fuel switch (Shishlov and Bellassen 2012). Investments in CDM projects amounted to over
USD200 billion (UNFCCC 2012).
For JI, the leading project types accounting for almost two thirds of all issued ERUs are reducing fugitive
emissions in gas pipelines and coal mines and industrial energy efficiency, which can be explained by
high emissions reductions potential in these sectors in Ukraine and Russia (Shishlov, Bellassen, and
Leguet 2012).
Figure II-5 – CER and ERU issuance by project type as of 1 January 2014
Source: CDC Climat Research based on UNEP Risoe (2014).
21Climate Report n°44 – Ex-post evaluation of the Kyoto protocol:
Four key lessons for the 2015 Paris Agreement
C. Japan and New Zealand, two examples of building domestic policies using the Kyoto Protocol
framework
Japan: anticipating the need for carbon units
Japan was the second largest GHG emitter after Russia among Annex B-2012 countries. Having adopted
the emissions reduction target of 6% below the 1990 base year level, Japan was short of AAUs to cover
its commitment and therefore had to resort to Kyoto flexibility mechanisms. Japan anticipated the need for
units and steadily increased acquisition of AAUs, CERs and ERUs throughout the first Commitment
Period (Figure II-6). By the end of 2013 Japan held 150 million CERs and 22 million ERUs on its accounts
making it one of the largest buyers of Kyoto offsets. Additionally, the country has purchased 226 million
AAUs. Many of the acquisitions had occurred through so-called Green Investment Schemes (GISs) in
cooperation with Czech Republic, Ukraine and Estonia (Point Carbon, 2012 and Japan’s registries).
Under their GISs, Czech Republic, Ukraine and Estonia committed to invest the respective revenues into
further domestic emissions reduction. The main objective of such arrangements was to prevent countries
with large AAU surpluses – mainly EITs – from simply selling “hot air” and thus to bolster the
environmental integrity of carbon trading.
Figure II-6 – Cumulative net imports of carbon units by Japan as of 31 December 2013
Source: Japan’s National Registry (2014).
Having gained experience investing in CDM projects and driven by its long term emissions reduction
strategy, Japan has also been actively developing the Bilateral Offset Crediting Mechanism (BOCM). This
scheme aims to simplify the registration of projects as most administrative decisions are taken bilaterally.
At the same time, the international oversight (e.g. by the UNFCCC) is supposed to provide guidance
regarding the MRV framework in order to avoid double-counting of emissions reductions (Figure II-7).
Japan is thus aiming at using a mechanism similar to that of the CDM with a potentially larger scope,
since the BOCM does not exclude any given sector by default (Le and Delbosc 2012).
Figure II-7 – Japan’s Bilateral Offset Crediting Mechanism
Source: Le and Delbosc (2012).
22Climate Report n°44 – Ex-post evaluation of the Kyoto protocol:
Four key lessons for the 2015 Paris Agreement
New Zealand JI tenders: maximizing the crediting leveraging
New Zealand has been an active player on the carbon market since its ratification of the Kyoto Protocol in
2002, principally through the creation of a special framework: Projects to Reduce Emissions (PRE). The
scheme encouraged voluntary early offset projects that could later be included into the JI scheme and
used in the national emissions trading scheme that began operation in 2008. Under the PRE scheme New
Zealand conducted two tenders – in 2003 and 2004 – which resulted in the registration of 34 projects with
a total emissions reduction potential of around 10 Mt CO2e. 19 of these projects were completed and
generated 5.5 million carbon offsets (Ministry for the Environment of New Zealand, 2013).
The prioritization of the projects that contribute to energy security defined the sectoral scope of the
selected projects – they were all focused on renewable energy generation, namely wind, hydro,
geothermal and landfill gas utilization. At the same time, the projects were evaluated based on the ratio
between the amount of ERUs requested for the first Kyoto commitment period and the amount of planned
emission reductions since the beginning of a project until the end of 2012.
The PRE ranking system encouraged early movers, since they could declare emission reductions prior to
2008, thus improving their ERU-to-emission-reductions ratio compared to projects that started later. For
example, if a project that started in 2007 and resulted in stable emissions reduction until the end of 2012,
claimed the maximum amount of ERUs amounting to the reduction achieved between 2008 and 2012, it
would have a ratio of 5/6=0.833. A similar project that started in 2005 would have a ratio of 5/8=0.625
and, hence, a higher rating. In order to further improve its ranking a project could also claim fewer ERUs
than its actual emission reductions in 2008-2012. However, in reality most projects claimed 1:1 ratio for
the compensation of the abatement during the first commitment period. Therefore the main driver that
defined a project’s final ranking was the project’s start date rather than the amount of the ERU bid
(Shishlov, Bellassen, and Leguet 2012).
These domestic projects provided a valuable opportunity to learn and develop understanding of carbon
markets among relevant actors. Furthermore, it enabled New Zealand to receive additional funding for
local authorities to finance emission reduction projects (Clapp et al., 2010).
D. Eastern European countries attempted to maximize the economic benefits of the surplus
Total net exports of units from Eastern European countries amount to 800 million AAUs and 630 million
21
ERUs, which could be translated into net revenues around a few billion euros. Different countries,
however, employed different strategies towards flexibility mechanisms.
Russia: a slow start followed by last-minute sprint of JI
Russia’s position towards the Kyoto Protocol has always appeared cautious, with the international climate
agreement being ratified only in 2004 arguably in exchange for the EU backing Russia’s WTO bid.
Paradoxically, Russia could potentially be the biggest beneficiary of the Kyoto Protocol, as it granted the
fourth largest GHG-emitting country with a vast surplus of AAUs. This “hot air” occurred due to the
economy contraction following the collapse of the Soviet Union. Since the potential to market this surplus,
in the form of AAUs was quite vague, the JI mechanism seemed like a reasonable instrument to take
advantage of the Kyoto Protocol.
Despite being a promising mechanism to capitalize on the country’s AAU surplus and to attract foreign
investments, the development of JI in Russia was restrained by the unclear division of responsibilities
between ministries, constantly changing legislation and lack of political support. Over 100 projects with a
total emissions reduction potential of around 240 million tons of CO 2e entered the pipeline by 2009. More
21
Most of AAUs transferred come from EU10 countries to other EU ETS countries. They are probably the consequence of a
trade of EUA. It is very tricky to assess at which price all units have been sold. “A few billion euros” seems to be a good order
of magnitude given the prices of carbon units in past years. To have a better overview of disclosed AAU transactions, see
Point Carbon (2012).
23You can also read