Integrated Assessment of Black Carbon and Tropospheric Ozone - Summary for Decision Makers
←
→
Page content transcription
If your browser does not render page correctly, please read the page content below
Integrated Assessment
of Black Carbon
and Tropospheric Ozone
Summary for Decision Makers

                                           i

             Summary for Decision Makers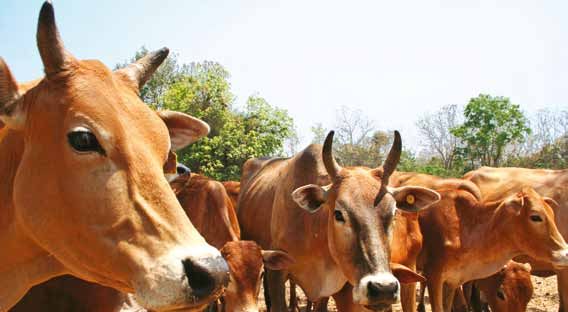
Foreword
     One of the key climate change challenges is today to ensure that a sustainable development
     path will continue to remain available to all nations, including in particular the capability to
     appropriately meet their expanding food, water and energy requirements, while at the same
     time limiting inasmuch as possible the carbon dioxide emissions from fossil-fuel burning.

     There is growing awareness that a wide range of airborne pollutants not only negatively affect
     health, agricultural production and key ecosystems like forests and freshwater but also contribute
     to augment climate change. Many of these substances, ranging from black carbon and methane
     to tropospheric ozone and fluorinated gases, are “short-lived” in the atmosphere in comparison
     with carbon dioxide.

     Accordingly, a number of early actions being undertaken under a range of international,
     regional and national treaties, laws and guidelines, may offer a near-term solution to curb the
     observed climate trends, and contribute in particular to maintain globally averaged surface
     temperature rise below 2 degrees Celsius, as well as meet some major international challenges
     such as the achievement of the UN Millennium Development Goals.

     The present report – The Integrated Assessment of Black Carbon and Tropospheric Ozone –
     addresses two such short-lived climate forcers. It reflects, in particular, a number of findings on
     the state of scientific knowledge as well as policy proposals to cut emissions provided by over fifty
     authors convened by WMO and UNEP.

     While previous assessments focused essentially either on direct effects of these pollutants or the
     associated climate impacts, rather than on both issues, the present report offers a comprehensive
     assessment of the collateral benefits which can be derived from practical measures to reduce
     black carbon – a principal soot component – as well as the gases which contribute to the
     formation of tropospheric ozone, especially methane. In the process, the panel reviewed the best
     available scientific knowledge and it concluded that a cluster of measures had the potential to
     yield major benefits.

ii

     Integrated Assessment of Black Carbon and Tropospheric Ozone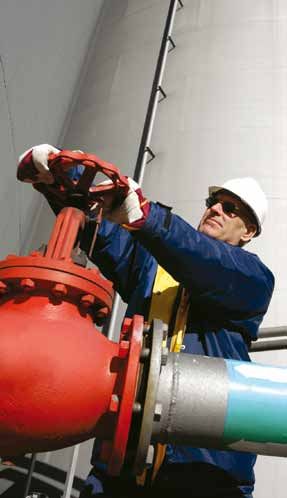
Additionally, the report provides some sobering findings, in particular that millions fall ill or die
prematurely in the developing world from the inhaling of black carbon-polluted air, while mega
tonnes of wheat, maize and rice are annually lost to the ozone impacts on crop yields, as well as
that black carbon deposits on snow and ice are contributing to the melting of glaciers and ice in
the polar regions and over the Himalayas.

On the encouraging side, there is substantial evidence that existing technologies, policies and
measures – some of them linked to actions launched to improve energy access, sustainable
transport and health – could immediately begin to provide significant benefits in terms of
human well-being, the climate system and the wider environment, if they were rapidly and
widely implemented.

Accordingly, fuller implementation of the identified measures is expected to offer substantial
benefits to the relevant regions, particularly to Asia where short-lived pollutants may also be
impacting on such regional climate features as the Asian Monsoon.

Scientific knowledge in this vital field is rapidly growing and the present report includes clear
recommendations for the sectors where the appropriate policy decisions could significantly
contribute to deliver cost-effective opportunities to improve livelihoods and to erect a
considerably more sustainable future for humanity.

Achim Steiner                                        Michel Jarraud
UNEP Executive Director                              Secretary-General
Under-Secretary-General of the United Nations        World Meteorological Organization

                                                                                                         iii

                                                                           Summary for Decision Makers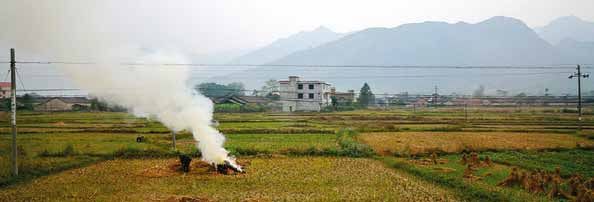
Table of Contents
Main Messages.  .  .  .  .  .  .  .  .  .  .  .  .  .  .  .  .  .  .  .  .  .  .  .  .  .  .  .  .  .  .  .  .  .  .  .  .  .  .  .  .  .  .  .  .  .  .  .  .  .  .  .  . 1
        The challenge . . . . . . . . . . . . . . . . . . . . . . . . . . . . . . . . . . . . . . . . . . . . . . . . . . . . . . . . . . . . . 1
        Reducing emissions. . . . . . . . . . . . . . . . . . . . . . . . . . . . . . . . . . . . . . . . . . . . . . . . . . . . . . . . . 2
        Benefits of emission reductions. . . . . . . . . . . . . . . . . . . . . . . . . . . . . . . . . . . . . . . . . . . . . . . . 3
        Responses. . . . . . . . . . . . . . . . . . . . . . . . . . . . . . . . . . . . . . . . . . . . . . . . . . . . . . . . . . . . . . . . . 3

Introduction .  .  .  .  .  .  .  .  .  .  .  .  .  .  .  .  .  .  .  .  .  .  .  .  .  .  .  .  .  .  .  .  .  .  .  .  .  .  .  .  .  .  .  .  .  .  .  .  .  .  .  .  .  .  . 5

Limiting Near-Term Climate Changes and Improving Air Quality.  .  .  .  .  .  .  .  .  .  .  .  . 8
        Identifying effective response measures . . . . . . . . . . . . . . . . . . . . . . . . . . . . . . . . . . . . . . . . . 8
        Achieving large emission reductions . . . . . . . . . . . . . . . . . . . . . . . . . . . . . . . . . . . . . . . . . . . . 8
        Reducing near-term global warming. . . . . . . . . . . . . . . . . . . . . . . . . . . . . . . . . . . . . . . . . . . 10
        Staying within critical temperature thresholds . . . . . . . . . . . . . . . . . . . . . . . . . . . . . . . . . . . 12
        Benefits of early implementation. . . . . . . . . . . . . . . . . . . . . . . . . . . . . . . . . . . . . . . . . . . . . . 13
        Regional climate benefits . . . . . . . . . . . . . . . . . . . . . . . . . . . . . . . . . . . . . . . . . . . . . . . . . . . 13
        Tropical rainfall patterns and the Asian monsoon . . . . . . . . . . . . . . . . . . . . . . . . . . . . . . . . 13
        Decreased warming in polar and other glaciated regions . . . . . . . . . . . . . . . . . . . . . . . . . . 15
        Benefits of the measures for human health. . . . . . . . . . . . . . . . . . . . . . . . . . . . . . . . . . . . . . 16
        Benefits of the measures for crop yields . . . . . . . . . . . . . . . . . . . . . . . . . . . . . . . . . . . . . . . . 16
        Relative importance and scientific confidence in the measures. . . . . . . . . . . . . . . . . . . . . . . 18
        Mechanisms for rapid implementation . . . . . . . . . . . . . . . . . . . . . . . . . . . . . . . . . . . . . . . . . 19
        Potential international regulatory responses . . . . . . . . . . . . . . . . . . . . . . . . . . . . . . . . . . . . . 22
        Opportunities for international financing and cooperation . . . . . . . . . . . . . . . . . . . . . . . . . 23

Concluding Remarks .  .  .  .  .  .  .  .  .  .  .  .  .  .  .  .  .  .  .  .  .  .  .  .  .  .  .  .  .  .  .  .  .  .  .  .  .  .  .  .  .  .  .  .  .  .  . 24

Glossary .  .  .  .  .  .  .  .  .  .  .  .  .  .  .  .  .  .  .  .  .  .  .  .  .  .  .  .  .  .  .  .  .  .  .  .  .  .  .  .  .  .  .  .  .  .  .  .  .  .  .  .  .  .  .  .  . 25

Acronyms and Abbreviations .  .  .  .  .  .  .  .  .  .  .  .  .  .  .  .  .  .  .  .  .  .  .  .  .  .  .  .  .  .  .  .  .  .  .  .  .  .  .  .  . 27

Acknowledgements.  .  .  .  .  .  .  .  .  .  .  .  .  .  .  .  .  .  .  .  .  .  .  .  .  .  .  .  .  .  .  .  .  .  .  .  .  .  .  .  .  .  .  .  .  .  .  .  . 28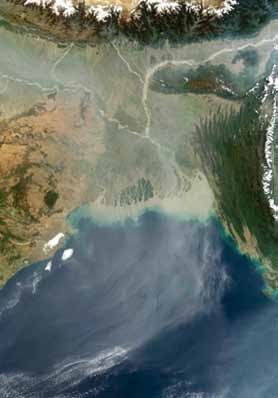
Main Messages
Scientific evidence and new analyses demonstrate that control of black carbon
particles and tropospheric ozone through rapid implementation of proven
emission reduction measures would have immediate and multiple benefits for
human well-being.

Black carbon exists as particles in the atmosphere and is a major component of soot; it has
significant human health and climate impacts. At ground level, ozone is an air pollutant harmful
to human health and ecosystems, and throughout the troposphere, or lower atmosphere, is also
a significant greenhouse gas. Ozone is not directly emitted, but is produced from emissions of
precursors of which methane and carbon monoxide are of particular interest here.

THE CHALLENGE
1.   The climate is changing now, warming at the highest rate in polar and high-
     altitude regions. Climate change, even in the near term, has the potential to trigger
     abrupt transitions such as the release of carbon from thawing permafrost and biodiversity
     loss. The world has warmed by about 0.8˚C from pre-industrial levels, as reported by the

                                                                                                                         Credit: Kevin Hicks

Traditional brick kilns in South Asia are a major source of black carbon. Improved kiln design in this region is
significantly reducing emissions.                                                                                                              1

                                                                                           Summary for Decision Makers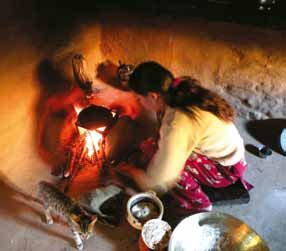
Intergovernmental Panel on Climate Change (IPCC). The Parties to the United Nations
         Framework Convention on Climate Change (UNFCCC) have agreed that warming should
         not exceed 2˚C above pre-industrial levels.

    2.   Black carbon and ozone in the lower atmosphere are harmful air pollutants
         that have substantial regional and global climate impacts. They disturb
         tropical rainfall and regional circulation patterns such as the Asian monsoon, affecting the
         livelihoods of millions of people.

    3.   Black carbon’s darkening of snow and ice surfaces increases their absorption
         of sunlight, which, along with atmospheric heating, exacerbates melting of
         snow and ice around the world, including in the Arctic, the Himalayas and
         other glaciated and snow-covered regions. This affects the water cycle and increases
         risks of flooding.

    4.   Black carbon, a component of particulate matter, and ozone both lead to
         adverse impacts on human health leading to premature deaths worldwide.
         Ozone is also the most important air pollutant responsible for reducing crop
         yields, and thus affects food security.

    REDUCING EMISSIONS
    5.   Reducing black carbon and tropospheric ozone now will slow the rate of
         climate change within the first half of this century. Climate benefits from
         reduced ozone are achieved by reducing emissions of some of its precursors,
         especially methane which is also a powerful greenhouse gas. These short-lived
         climate forcers – methane, black carbon and ozone – are fundamentally different from
         longer-lived greenhouse gases, remaining in the atmosphere for only a relatively short time.
         Deep and immediate carbon dioxide reductions are required to protect long-term climate,
         as this cannot be achieved by addressing short-lived climate forcers.

    6.   A small number of emission reduction measures targeting black carbon and
         ozone precursors could immediately begin to protect climate, public health,
         water and food security, and ecosystems. Measures include the recovery of methane
         from coal, oil and gas extraction and transport, methane capture in waste management, use
         of clean-burning stoves for residential cooking, diesel particulate filters for vehicles and the
         banning of field burning of agricultural waste. Widespread implementation is achievable
         with existing technology but would require significant strategic investment and institutional
         arrangements.

    7.   The identified measures complement but do not replace anticipated carbon
         dioxide reduction measures. Major carbon dioxide reduction strategies mainly
         target the energy and large industrial sectors and therefore would not necessarily result in
         significant reductions in emissions of black carbon or the ozone precursors methane and
         carbon monoxide. Significant reduction of the short-lived climate forcers requires a specific
         strategy, as many are emitted from a large number of small sources.

2

    Integrated Assessment of Black Carbon and Tropospheric Ozone
BENEFITS OF EMISSION REDUCTIONS
8.   Full implementation of the identified measures would reduce future global
     warming by 0.5˚C (within a range of 0.2–0.7˚C, Figure 1). If the measures were
     to be implemented by 2030, they could halve the potential increase in global temperature
     projected for 2050 compared to the Assessment’s reference scenario based on current
     policies and energy and fuel projections. The rate of regional temperature increase would
     also be reduced.

9.   Both near-term and long-term strategies are essential to protect climate.
     Reductions in near-term warming can be achieved by control of the short-lived climate
     forcers whereas carbon dioxide emission reductions, beginning now, are required to limit
     long-term climate change. Implementing both reduction strategies is needed to improve the
     chances of keeping the Earth’s global mean temperature increase to within the UNFCCC
     2˚C target.

10. Full implementation of the identified measures would have substantial
    benefits in the Arctic, the Himalayas and other glaciated and snow-covered
    regions. This could reduce warming in the Arctic in the next 30 years by about two-thirds
    compared to the projections of the Assessment’s reference scenario. This substantially
    decreases the risk of changes in weather patterns and amplification of global warming
    resulting from changes in the Arctic. Regional benefits of the black carbon measures, such
    as their effects on snow- and ice-covered regions or regional rainfall patterns, are largely
    independent of their impact on global mean warming.

11. Full implementation of the identified measures could avoid 2.4 million
    premature deaths (within a range of 0.7–4.6 million) and the loss of 52 million
    tonnes (within a range of 30–140 million tonnes), 1–4 per cent, of the global
    production of maize, rice, soybean and wheat each year (Figure 1).The most
    substantial benefits will be felt immediately in or close to the regions where action is taken
    to reduce emissions, with the greatest health and crop benefits expected in Asia.

RESPONSES
12. The identified measures are all currently in use in different regions around the world to
    achieve a variety of environment and development objectives. Much wider and more
    rapid implementation is required to achieve the full benefits identified in this
    Assessment.

13. Achieving widespread implementation of the identified measures would be
    most effective if it were country- and region-specific, and could be supported
    by the considerable existing body of knowledge and experience. Accounting
    for near-term climate co-benefits could leverage additional action and funding on a wider
    international scale which would facilitate more rapid implementation of the measures.
    Many measures achieve cost savings over time. However, initial capital investment could be
    problematic in some countries, necessitating additional support and investment.

                                                                                                      3

                                                                        Summary for Decision Makers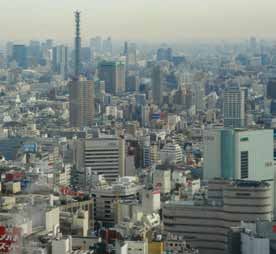
Climate change                         Human health                             Food security
              CH4         CH4 + BC                   CH4          CH4 + BC                   CH4         CH4 + BC
            measures      measures                 measures       measures                 measures      measures
        0                                      0                                       0

                                             0.5
     0.1
                                               1                                     25

     0.2                                     1.5
                                                                                     50
                                               2
     0.3
                                             2.5                                     75
     0.4
                                               3
                                                                                   100
     0.5                                     3.5

                                               4
     0.6                                                                           125
                                             4.5

     0.7                                       5                                   150

               Global mean                           Annually avoided                       Annually avoided
                 avoided                               premature                            crop yield losses
              warming in 2050                            deaths                                (total maize,
                   (˚C)                                 (million)                             rice, soybean
                                                                                                and wheat,
                                                                                             million tonnes)

    Figure 1. Global benefits from full implementation of the identified measures in 2030 compared to the reference
    scenario. The climate change benefit is estimated for a given year (2050) and human health and crop benefits are
    for 2030 and beyond.

    14. At national and sub-national scales many of the identified measures could
        be implemented under existing policies designed to address air quality and
        development concerns. Improved cooperation within and between regions
        would enhance widespread implementation and address transboundary
        climate and air quality issues. International policy and financing instruments
        to address the co-benefits of reducing emissions of short-lived climate forcers need
        development and strengthening. Supporting and extending existing relevant regional
        arrangements may provide an opportunity for more effective cooperation, implementation
        and assessment as well as additional monitoring and research.

    15. The Assessment concludes that there is confidence that immediate and
        multiple benefits will be realized upon implementation of the identified
        measures. The degree of confidence varies according to pollutant, impact and region.
        For example, there is higher confidence in the effect of methane measures on global
        temperatures than in the effect of black carbon measures, especially where these relate
        to the burning of biomass. There is also high confidence that benefits will be realized for
        human health from reducing particles, including black carbon, and to crop yields from
        reducing tropospheric ozone concentrations. Given the scientific complexity of the issues,
        further research is required to optimize near-term strategies in different regions and to
4       evaluate the cost-benefit ratio for individual measures.

    Integrated Assessment of Black Carbon and Tropospheric Ozone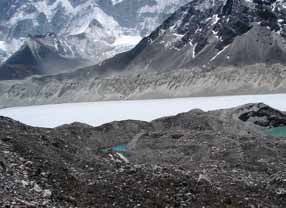
Introduction
Black carbon (BC, Box 1) and tropospheric                                        existing policy options for addressing these
ozone (O3, Box 2) are harmful air pollutants                                     pollutants. The Assessment team examined
that also contribute to climate change. In                                       policy responses and developed an outlook to
recent years, scientific understanding of how                                    2070 illustrating the benefits of political decisions
BC and O3 affect climate and public health                                       made today and the risks to climate, human
has significantly improved. This has catalysed                                   health and crop yields over the next decades if
a demand for information and action                                              action is delayed. Placing a premium on robust
from governments, civil society and other                                        science and analysis, the Assessment was driven
stakeholders. The United Nations (UN) has                                        by four main policy-relevant questions:
been requested to urgently provide science-
based advice on action to reduce the impacts                                     •      Which measures are likely to provide
of these pollutants1.                                                                   significant combined climate and air-
                                                                                        quality benefits?
The United Nations Environment Programme                                         •      How much can implementation of the
(UNEP), in consultation with partners, initiated                                        identified measures reduce the rate of
an assessment designed to provide an interface                                          global mean temperature increase by mid-
between knowledge and action, science                                                   century?
and policy, and to provide a scientifically                                      •      What are the multiple climate, health and
credible basis for informed decision-making.                                            crop-yield benefits that would be achieved
The result is a comprehensive analysis of                                               by implementing the measures?
drivers of emissions, trends in concentrations,                                  •      By what mechanisms could the measures
and impacts on climate, human health and                                                be rapidly implemented?
ecosystems of BC, tropospheric O3 and its
precursors. BC, tropospheric O3 and                                              In order to answer these questions, the
methane (CH4) are often referred to as                                           Assessment team determined that new analyses
short-lived climate forcers (SLCFs) as they have                                 were needed. The Assessment therefore relies
a short lifetime in the atmosphere                                               on published literature as much as possible
(days to about a decade) relative to carbon                                      and on new simulations by two independent
dioxide (CO2).                                                                   climate-chemistry-aerosol models: one
                                                                                 developed and run by the NASA-Goddard
The Assessment is an integrated analysis of                                      Institute for Space Studies (GISS) and the
multiple co-emitted pollutants reflecting the                                    other developed by the Max Planck Institute
fact that these pollutants are not emitted in                                    in Hamburg, Germany (ECHAM), and run
isolation (Boxes 1 and 2). The Assessment                                        at the Joint Research Centre of the European
determined that under current policies,                                          Commission in Ispra, Italy. The specific
emissions of BC and O3 precursors are                                            measures and emission estimates for use in
expected globally either to increase or to                                       developing this Assessment were selected using
remain roughly constant unless further                                           the International Institute for Applied Systems
mitigation action is taken.                                                      Analysis Greenhouse Gas and Air Pollution
                                                                                 Interactions and Synergies (IIASA GAINS)
The Integrated Assessment of Black Carbon and                                    model. For a more detailed description of the
Tropospheric Ozone convened more than 50                                         modelling see Chapter 1 of the underlying
authors to assess the state of science and                                       assessment report.
______________________________________________
1
    The Anchorage Declaration of 24 April 2009, adopted by the Indigenous People’s Global Summit on Climate Change; the Tromsø Declaration of 29 April
    2009, adopted by the Sixth Ministerial Meeting of the Arctic Council and the 8th Session of the Permanent Forum on Indigenous Issues under the United
    Nations Economic and Social Council (May 2009) called on UNEP to conduct a fast track assessment of short-term drivers of climate change, specifically
    BC, with a view to initiating the negotiation of an international agreement to reduce emissions of BC. A need to take rapid action to address significant
    climate forcing agents other than CO2, such as BC, was reflected in the 2009 declaration of the G8 leaders (Responsible Leadership for a Sustainable
    Future, L’Aquila, Italy, 2009).                                                                                                                             5

                                                                                                                   Summary for Decision Makers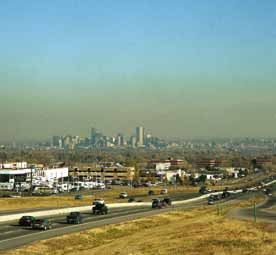
Box 1: What is black carbon?
Black carbon (BC) exists as particles in the atmosphere and is a major component of soot. BC is not
a greenhouse gas. Instead it warms the atmosphere by intercepting sunlight and absorbing it. BC
and other particles are emitted from many common sources, such as cars and trucks, residential
stoves, forest fires and some industrial facilities. BC particles have a strong warming effect in the
atmosphere, darken snow when they are deposited, and influence cloud formation. Other particles
may have a cooling effect in the atmosphere and all particles influence clouds. In addition to
having an impact on climate, anthropogenic particles are also known to have a negative impact
on human health.
Black carbon results from the incomplete combustion of fossil fuels, wood and other biomass.
Complete combustion would turn all carbon in the fuel into carbon dioxide (CO2). In practice,
combustion is never complete and CO2, carbon monoxide (CO), volatile organic compounds
(VOCs), organic carbon (OC) particles and BC particles are all formed. There is a close relationship
between emissions of BC (a warming agent) and OC (a cooling agent). They are always co-emitted,
but in different proportions for different sources. Similarly, mitigation measures will have varying
effects on the BC/OC mix.
The black in BC refers to the fact that these particles absorb visible light. This absorption leads to
a disturbance of the planetary radiation balance and eventually to warming. The contribution to
warming of 1 gramme of BC seen over a period of 100 years has been estimated to be anything
from 100 to 2 000 times higher than that of 1 gramme of CO2. An important aspect of BC particles
is that their lifetime in the atmosphere is short, days to weeks, and so emission reductions have an
immediate benefit for climate and health.
Credit: Caramel/flickr
Credit: NASA-MODIS
High emitting vehicles are a significant source of black
carbon and other pollutants in many countries.
200 km
N
Haze with high particulate matter concentrations
containing BC and OC, such as this over the Bay of
Bengal, is widespread in many regions.
6
Integrated Assessment of Black Carbon and Tropospheric OzoneNo retrofit system Retrofitted with Retrofitted with Retrofitted with
Uncontrolled Diesel Exhaust Diesel Oxidation Catalyst (DOC) Partial Filter Diesel Particulate Filter (DPF)
(Level 1) (Level 2) (Level 3)
Old technology Little black carbon removal New Technology
Little black carbon removal Little ultrafine PM removal Used on all new US trucks since 2007
Little ultrafine PM removal Does not remove lube oil ash >85% black carbon removal
Does not remove lube oil ash >85% ultrafine PM removal
>85% lube oil ash removal
Some of the largest emission reductions are obtained using diesel particle filters on high emitting vehicles. The exhibits
above are actual particulate matter (PM) collection samples from an engine testing laboratory (International Council of
Clean Transportation (ICCT)).
Box 2: What is tropospheric ozone?
Ozone (O3) is a reactive gas that exists in two layers of the atmosphere: the stratosphere (the upper
layer) and the troposphere (ground level to ~10–15 km). In the stratosphere, O3 is considered
to be beneficial as it protects life on Earth from the sun’s harmful ultraviolet (UV) radiation. In
contrast, at ground level, it is an air pollutant harmful to human health and ecosystems, and it is
a major component of urban smog. In the troposphere, O3 is also a significant greenhouse gas.
The threefold increase of the O3 concentration in the northern hemisphere during the past 100
years has made it the third most important contributor to the human enhancement of the global
greenhouse effect, after CO2 and CH4.
In the troposphere, O3 is formed by the action of sunlight on O3 precursors that have natural
and anthropogenic sources. These precursors are CH4, nitrogen oxides (NOX), VOCs and CO. It is
important to understand that reductions in both CH4 and CO emissions have the potential to
substantially reduce O3 concentrations and reduce global warming. In contrast, reducing VOCs
would clearly be beneficial but has a small impact on the global scale, while reducing NOX has
multiple additional effects that result in its net impact on climate being minimal.
Credit: Luisa Molina
Credit: Warren Gretz/DOE/NREL
Tropospheric ozone is a major constituent of urban smog, left Tokyo, Japan; right Denver, Colorado, USA
7
Summary for Decision MakersLimiting Near-Term Climate
Changes and Improving
Air Quality
Identifying effective response emissions of all substances resulting from the
measures full implementation of the identified measures
through the two global composition-climate
The Assessment identified those measures models GISS and ECHAM (see Chapter 4
most likely to provide combined benefits, of the underlying assessment report). One
taking into account the fact that BC and hundred per cent implementation of the
O3 precursors are co-emitted with different measures globally was used to illustrate the
gases and particles, some of which cause existing potential to reduce climate and air
warming and some of which, such as organic quality impacts, but this does not make any
carbon (OC) and sulphur dioxide (SO2), assumptions regarding the feasibility of full
lead to cooling. The selection criterion was implementation everywhere. A discussion
that the measure had to be likely to reduce of the challenges involved in widespread
global climate change and also provide air implementation of the measures follows after
quality benefits, so-called win-win measures. the potential benefit has been demonstrated.
Those measures that provided a benefit
for air quality but increased warming were Achieving large emission
not included in the selected measures. For reductions
example, measures that primarily reduce
emissions of SO2 were not included. The packages of policy measures in Table 1
were compared to a reference scenario (Table
The identified measures (Table 1) were 2). Figure 2 shows the effect of the packages
chosen from a subset of about 2 000 separate of policy measures and the reference scenario
measures that can be applied to sources in relative to 2005 emissions.
IIASA’s GAINS model. The selection was
based on the net influence on warming, There is tremendous regional variability
estimated using the metric Global Warming in how emissions are projected to change
Potential (GWP), of all of the gases and by the year 2030 under the reference
particles that are affected by the measure. scenario. Emissions of CH4 – a major O3
The selection gives a useful indication of the precursor and a potent greenhouse gas – are
potential for realizing a win for climate. All expected to increase in the future (Figure
emission reduction measures were assumed 2). This increase will occur despite current
to benefit air quality by reducing particulate and planned regulations, in large part due
matter and/or O3 concentrations. to anticipated economic growth and the
increase in fossil fuel production projected to
This selection process identified a relatively accompany it. In contrast, global emissions
small set of measures which nevertheless of BC and accompanying co-emitted
provide about 90 per cent of the climate pollutants are expected to remain relatively
benefit compared to the implementation constant through to 2030. Regionally,
of all 2 000 measures in GAINS. The final reductions in BC emissions are expected
analysis of the benefits for temperature, due to tighter standards on road transport
human health and crop yields considered the and more efficient combustion replacing use
8
Integrated Assessment of Black Carbon and Tropospheric OzoneTable 1. Measures that improve climate change mitigation and air quality and have a large
emission reduction potential
Measure1 Sector
CH4 measures
Extended pre-mine degasification and recovery and oxidation of CH4 from
ventilation air from coal mines
Extended recovery and utilization, rather than venting, of associated gas Extraction and
and improved control of unintended fugitive emissions from the production transport of fossil fuel
of oil and natural gas
Reduced gas leakage from long-distance transmission pipelines
Separation and treatment of biodegradable municipal waste through
recycling, composting and anaerobic digestion as well as landfill gas
collection with combustion/utilization Waste management
Upgrading primary wastewater treatment to secondary/tertiary treatment
with gas recovery and overflow control
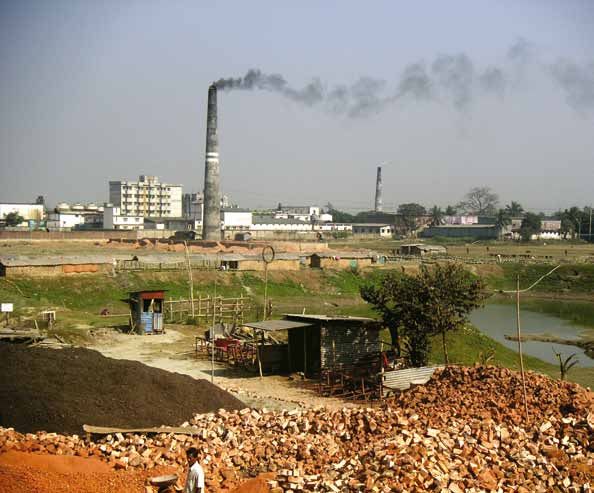
Control of CH4 emissions from livestock, mainly through farm-scale
anaerobic digestion of manure from cattle and pigs Agriculture
Intermittent aeration of continuously flooded rice paddies
BC measures (affecting BC and other co-emitted compounds)
Diesel particle filters as part of a Euro 6/VI package for road and off-road
diesel vehicles Transport
Elimination of high-emitting vehicles in road and off-road transport
Replacing coal by coal briquettes in cooking and heating stoves
Pellet stoves and boilers, using fuel made from recycled wood waste or
sawdust, to replace current wood-burning technologies in the residential
sector in industrialized countries
Residential
Introduction of clean-burning biomass stoves for cooking and heating in
developing countries2, 3
Substitution of clean-burning cookstoves using modern fuels for traditional
biomass cookstoves in developing countries2, 3
Replacing traditional brick kilns with vertical shaft kilns and Hoffman kilns
Replacing traditional coke ovens with modern recovery ovens, including the Industry
improvement of end-of-pipe abatement measures in developing countries
Ban of open field burning of agricultural waste2 Agriculture
1
There are measures other than those identified in the table that could be implemented. For example, electric cars would
have a similar impact to diesel particulate filters but these have not yet been widely introduced; forest fire controls could
also be important but are not included due to the difficulty in establishing the proportion of fires that are anthropogenic.
2
Motivated in part by its effect on health and regional climate, including areas of ice and snow.
3
For cookstoves, given their importance for BC emissions, two alternative measures are included.
of biofuels in the residential and commercial The full implementation of the selected
sectors, although these are offset to some extent measures by 2030 leads to significant
by increased activity and economic growth. The reductions of SLCF emissions relative to
regional BC emission trends, therefore, vary current emissions or to the 2030 emissions
significantly, with emissions expected to decrease in the reference scenario (Figure 2). It also
in North America and Europe, Latin America reduces a high proportion of the emissions
and the Caribbean, and in Northeast Asia, relative to the maximum reduction from the
Southeast Asia and the Pacific, and to increase in implementation of all 2 000 or so measures in 9
Africa and South, West and Central Asia. the GAINS model. The measures designed to
Summary for Decision Makersreduce BC also have a considerable impact the middle of this century, bringing the total
on OC, total fine particulate matter (PM2.5) warming from pre-industrial levels to about
and CO emissions, removing more than half 2.2˚C (Figure 3). The Assessment shows that
the total anthropogenic emissions. The largest the measures targeted to reduce emissions
BC emission reductions are obtained through of BC and CH4 could greatly reduce global
measures controlling incomplete combustion mean warming rates over the next few
of biomass and diesel particle filters as part of decades (Figure 3). Figure 1 shows that over
a Euro 6/VI package. half of the reduced global mean warming
is achieved by the CH4 measures and the
The major sources of CO2 are different from remainder by BC measures. The greater
those emitting most BC, OC, CH4 and CO. confidence in the effect of CH4 measures on
Even in the few cases where there is overlap, warming is reflected in the narrower range of
such as diesel vehicles, the particle filters that estimates.
reduce BC, OC and CO have minimal effect
on CO2. The measures to reduce CO2 over Full implementation of all measures would
the next 20 years (Table 2) therefore hardly half the warming during the 2030s relative
affect the emissions of BC, OC or CO. The to the present day compared with taking no
influence of the CH4 and BC measures is action. In contrast, even a fairly aggressive
thus the same regardless of whether the CO2 strategy to reduce CO2 emissions under the
measures are imposed or not. CO2 measures scenario does little to mitigate
warming over the next 20–30 years. In fact,
Reducing near-term global sulphate particles, reflecting particles that
warming offset some of the committed warming for
the short time they are in the atmosphere,
The Earth is projected to continue the are derived from SO2 that is co-emitted
rapid warming of the past several decades with CO2 in some of the highest-emitting
and, without additional mitigation efforts, activities, including coal burning in large-
under the reference scenario global mean scale combustion such as in power plants.
temperatures are projected to rise about a Hence, CO2 measures alone may temporarily
further 1.3˚C (with a range of 0.8–2.0˚C) by enhance near-term warming as sulphates are
Table 2. Policy packages used in the Assessment
Scenario Description1
Reference Based on energy and fuel projections of the International Energy Agency
(IEA) World Energy Outlook 2009 and incorporating all presently agreed
policies affecting emissions
CH4 measures Reference scenario plus the CH4 measures
BC measures Reference scenario plus the BC measures (the BC measures affect many
pollutants, especially BC, OC, and CO)
CH4 + BC measures Reference scenario plus the CH4 and BC measures
CO2 measures Emissions modelled using the assumptions of the IEA World Energy
Outlook 2009 450 Scenario2 and the IIASA GAINS database. Includes CO2
measures only. The CO2 measures affect other emissions, especially SO23
CO2 + CH4 + BC measures CO2 measures plus CH4 and BC measures
1
In all scenarios, trends in all pollutant emissions are included through 2030, after which only trends in CO2 are included.
2
The 450 Scenario is designed to keep total forcing due to long-lived greenhouse gases (including CH4 in this case) at a
level equivalent to 450 ppm CO2 by the end of the century.
3
Emissions of SO2 are reduced by 35–40 per cent by implementing CO2 measures. A further reduction in sulphur emissions
would be beneficial to health but would increase global warming. This is because sulphate particles cool the Earth by
10 reflecting sunlight back to space.
Integrated Assessment of Black Carbon and Tropospheric OzoneReference
BC
BC measures
Reference
OC
BC measures
Total PM 2.5
Reference
BC measures
Reference
CH4 measures
CH4
CH4 + BC
measures
Reference
SO2
BC measures
Reference
NOX
BC measures
Reference
CO
BC measures
Reference
CO2
BC measures
-90 -80 -70 -60 -50 -40 -30 -20 -10 0 10 20 30 40 50
Change in emissions in 2030 compared to 2005, %
Large-scale combustion Industrial processes
Transport Fossil fuel extraction and distribution
Agriculture Residential-commercial combustion
Waste /landfill
Figure 2. Percentage change in anthropogenic emissions of the indicated pollutants in 2030 relative to 2005 for
the reference, CH4, BC and CH4 + BC measures scenarios. The CH4 measures have minimal effect on emissions of
anything other than CH4. The identified BC measures reduce a large proportion of total BC, OC and CO emissions.
SO2 and CO2 emissions are hardly affected by the identified CH4 and BC measures, while NOX and other PM2.5
emissions are affected by the BC measures.
reduced (Figure 3; temperatures in the CO2 the CO2 measures both in that they target
measures scenario are slightly higher than different source sectors and in that their
those in the reference scenario during the impacts on climate change take place over
period 2020–2040). different timescales.
The CO2 measures clearly lead to long-term Near-term warming may occur in sensitive
benefits, with a dramatically lower warming regions and could cause essentially irreversible
rate in 2070 than under the scenario with changes, such as loss of Arctic land-ice, release
only near-term CH4 + BC measures. Owing of CH4 or CO2 from Arctic permafrost and
to the long residence time of CO2 in the species loss. Indeed, the projected warming
atmosphere, these long-term benefits will in the reference scenario is greater in the
only be achieved if CO2 emission reductions Arctic than globally. Reducing the near-term
are brought in quickly. In essence, the near- rate of warming hence decreases the risk of
term CH4 and BC measures examined in this irreversible transitions that could influence the
Assessment are effectively decoupled from global climate system for centuries. 11
Summary for Decision MakersStaying within critical consistently exceeded the most pessimistic
temperature thresholds emission scenarios of the IPCC. Thus, it seems
unlikely that reductions more stringent than
Adoption of the near-term emission control those in the CO2 measures scenario will take
measures described in this Assessment, together place during the next 20 years.
with measures to reduce CO2 emissions, would
greatly improve the chances of keeping Earth’s Examining the more stringent UNFCCC
temperature increase to less than 2˚C relative 1.5˚C threshold, the CO2 measures scenario
to pre-industrial levels (Figure 3). With the CO2 exceeds this by 2030, whereas the near-term
measures alone, warming exceeds 2˚C before measures proposed in the Assessment delay
2050. Even with both the CO2 measures and that exceedance until after 2040. Again, while
CH4 measures envisioned under the same substantially deeper early reductions in CO2
IEA 450 Scenario, warming exceeds 2˚C in emissions than those in the CO2 measures
the 2060s (see Chapter 5 of the undelying scenario could also delay the crossing of the
assessment report). However, the combination 1.5˚C temperature threshold, such reductions
of CO2, CH4, and BC measures holds the would undoubtedly be even more difficult to
temperature increase below 2˚C until around achieve. However, adoption of the Assessment’s
2070. While CO2 emission reductions even near-term measures (CH4 + BC) along with
larger than those in the CO2 measures scenario the CO2 reductions would provide a substantial
would of course mitigate more warming, actual chance of keeping the Earth’s temperature
CO2 emissions over the past decade have increase below 1.5˚C for the next 30 years.
4.0
3.5
Temperature (˚C) relative to 1890-1910
3.0 CO2 measures Reference
2.5
2.0
CH4 + BC measures
1.5
1.0
CO2 + CH4 + BC
0.5 measures
0.0
-0.5
1900 1950 2000 2050
Figure 3. Observed deviation of temperature to 2009 and projections under various scenarios. Implementation of
the identified BC and CH4 measures starting immediately, together with measures to reduce CO2 emissions, would
greatly improve the chances of keeping Earth’s temperature increase to less than 2˚C relative to pre-industrial
levels. The bulk of the benefits of CH4 and BC measure are realized by 2040 (dashed line).
Explanatory notes: Actual mean temperature observations through 2009, and projected mean temperature under
various scenarios thereafter, are shown relative to the 1890–1910 mean temperature. Estimated ranges for 2070 are
shown in the bars on the right. A portion of the uncertainty is common to all scenarios, so that overlapping ranges
do not mean there is no difference, for example, if climate sensitivity is large, it is large regardless of the scenario, so
12 temperatures in all scenarios would be towards the high-end of their ranges.
Integrated Assessment of Black Carbon and Tropospheric OzoneBenefits of early implementation evaporation. By absorbing sunlight in the
atmosphere, O3 and especially BC can affect
There would clearly be much less warming cloud formation, rainfall and weather patterns.
during 2020–2060 were the measures They can change wind patterns by affecting
implemented earlier rather than later (Figure the regional temperature contrasts that
4). Hence there is a substantial near-term drive the winds, influencing where rain and
climate benefit in accelerating implementation snow fall. While some aspects of these effects
of the identified measures even if some of are local, they can also affect temperature,
these might eventually be adopted owing cloudiness, and precipitation far away from the
to general air-quality and development emission sources. The regional changes in all
concerns. Clearly the earlier implementation these aspects of climate will be significant, but
will also have significant additional human are currently not well quantified.
health and crop-yield benefits.
Tropical rainfall patterns and
Accelerated adoption of the identified the Asian monsoon
measures has only a modest effect on long-
term climate change in comparison with Several detailed studies of the Asian monsoon
waiting 20 years, however (Figure 4). This suggest that regional forcing by absorbing
reinforces the conclusion that reducing particles substantially alters precipitation
emissions of O3 precursors and BC can have patterns (as explained in the previous section).
substantial benefits in the near term, but The fact that both O3 and particle changes are
that mitigating long-term climate change predominantly in the northern hemisphere
depends on reducing emissions of long-lived means that they cause temperature gradients
greenhouse gases such as CO2. between the two hemispheres that influence
rainfall patterns throughout the tropics.
Regional climate benefits Implementation of the measures analysed in
this Assessment would substantially decrease
While global mean temperatures provide the regional atmospheric heating by particles
some indication of climate impacts, (Figure 6), and are hence very likely to
temperature changes can vary dramatically reduce regional shifts in precipitation. As the
from place to place even in response to reductions of atmospheric forcing are greatest
relatively uniform forcing from long-lived over the Indian sub-continent and other parts
greenhouse gases. Figure 5 shows that of Asia, the emission reductions may have
warming is projected to increase for all a substantial effect on the Asian monsoon,
regions with some variation under the mitigating disruption of traditional rainfall
reference scenario, while the Assessment’s patterns. However, results from global climate
measures provide the benefit of reduced models are not yet robust for the magnitude
warming in all regions. or timing of monsoon shifts resulting from
either greenhouse gas increases or changes
Climate change also encompasses more than in absorbing particles. Nonetheless, results
just temperature changes. Precipitation, from climate models provide examples of the
melting rates of snow and ice, wind patterns, type of change that might be expected. Shifts
and clouds are all affected, and these in turn in the timing and strength of precipitation
have an impact on human well-being by can have significant impacts on human well-
influencing factors such as water availability, being because of changes in water supply and
agriculture and land use. agricultural productivity, drought and flooding.
The results shown in Figure 6 suggest that
Both O3 and BC, as well as other particles, implementation of the BC measures could
can influence many of the processes that lead also lead to a considerable reduction in the
to the formation of clouds and precipitation. disruption of traditional rainfall patterns in
They alter surface temperatures, affecting Africa. 13
Summary for Decision MakersTemperature (˚C) relative to 1890-1910
3
Reference
CH4 + BC measures
from 2030–2050
CH4 + BC measures
2 from 2010–2030
1
0
2010 2020 2030 2040 2050 2060 2070
Year
Figure 4. Projected global mean temperature changes for the reference scenario and for the CH4 and BC
measures scenario with emission reductions starting immediately or delayed by 20 years.
4.5 Reference
Temperature (˚C) relative to 1890-1910
4
CH4 + BC
3.5 measures
3
2.5
2
1.5
1
0.5
0
Africa Northeast Latin North South,
Asia, America America West and
Southeast and and Central Asia
Asia and Caribbean Europe
Pacific
Figure 5. Comparison of regional mean warming over land (˚C) showing the change in 2070 compared with 2005
for the reference scenario (Table 2) and the reference + CH4 + BC measures scenario. The lines on each bar show
the range of estimates.
14
Integrated Assessment of Black Carbon and Tropospheric OzoneDecreased warming in polar and for the Arctic under the reference scenario,
other glaciated regions and should substantially decrease the risk of
global impacts from changes in this sensitive
Implementation of the measures would region, such as sea ice loss, which affects
substantially slow, but not halt, the current global albedo, and permafrost melt. Although
rapid pace of temperature rise and other not identified as a measure for use in this
changes already occurring at the poles and Assessment, the control of boreal forest fires
high-altitude glaciated regions, and the may also be important in reducing impacts in
reduced warming in these regions would likely the Arctic.
be greater than that seen globally. The large
benefits occur in part because the snow/ice The Antarctic is a far less studied region
darkening effect of BC is substantially greater in terms of SLCF impacts. However, there
than the cooling effect of reflective particles are studies demonstrating BC deposition
co-emitted with BC, leading to greater even in central portions of the continent,
warming impacts in these areas than in areas and reductions in O3 and CH4 should
without snow and ice cover. slow warming in places like the Antarctic
Peninsula, currently the location on the globe
Studies in the Arctic indicate that it is highly showing the most rapid temperature rise
sensitive both to local pollutant emissions of all.
and those transported from sources close to
the Arctic, as well as to the climate impact of The Himalayas and the Tibetan Plateau are
pollutants in the mid-latitudes of the northern regions where BC is likely to have serious
hemisphere. Some of the need for mitigation impacts. In the high valleys of the Himalayas,
measures lies within Europe and North for example, BC levels can be as high as in
America. The identified measures could a mid-sized city. Reducing emissions from
reduce warming in the Arctic by about 0.7˚C local sources and those carried by long-range
(with a range of 0.2–1.3˚C) in 2040. This is transport should lower glacial melt in these
nearly two-thirds of the estimated 1.1˚C (with regions, decreasing the risk of impacts such as
a range of 0.7–1.7˚C) warming projected catastrophic glacial lake outbursts.
GISS ECHAM
50 50
0 0
-50 -50
-100 0 100 -100 0 100
-20 -10 -4 -3 -2 -1 1
W/m2
Figure 6. Change in atmospheric energy absorption (Watts per square metre, W/m2 as annual mean), an
important factor driving tropical rainfall and the monsoons, resulting from implementation of BC measures.
The changes in absorption of energy by the atmosphere are linked with changes in regional circulation and
precipitation patterns, leading to increased precipitation in some regions and decreases in others. BC solar
absorption increases the energy input to the atmosphere by as much as 5–15 per cent, with the BC measures
removing the bulk of that heating. Results are shown for two independent models to highlight the similarity in
the projections of where large regional decreases would occur.
15
Summary for Decision MakersBenefits of the measures for in indoor and outdoor air pollution. The
human health reductions in PM2.5 concentrations resulting
from the BC measures would, by 2030,
Fine particulate matter (measured as PM2.5, avoid an estimated 0.7–4.6 million annual
which includes BC) and ground-level premature deaths due to outdoor air pollution
O3 damage human health. PM2.5 causes (Figure 1).
premature deaths primarily from heart
disease and lung cancer, and O3 exposure Regionally, implementation of the identified
causes deaths primarily from respiratory measures would lead to greatly improved
illness. The health benefit estimates in air quality and fewer premature deaths,
the Assessment are limited to changes in especially in Asia (Figure 7). In fact, more
these specific causes of death and include than 80 per cent of the health benefits of
uncertainty in the estimation methods. implementing all measures occur in Asia.
However, these pollutants also contribute The benefits are large enough for all the
significantly to other health impacts worsening trends in human health due to
including acute and chronic bronchitis outdoor air pollution to be reversed and
and other respiratory illness, non-fatal turned into improvements, relative to 2005.
heart attacks, low birth weight and results In Africa, the benefit is substantial, although
in increased emergency room visits and not as great as in Asia.
hospital admissions, as well as loss of work
and school days. Benefits of the measures for
crop yields
Under the reference scenario, that is,
without implementation of the identified Ozone is toxic to plants. A vast body
measures, changes in concentrations of of literature describes experiments and
PM2.5 and O3 in 2030, relative to 2005, observations showing the substantial effects
would have substantial effects globally on of O3 on visible leaf health, growth and
premature deaths related to air pollution. productivity for a large number of crops,
By region, premature deaths from outdoor trees and other plants. Ozone also affects
pollution are projected to change in line vegetation composition and diversity.
with emissions. The latter are expected to Globally, the full implementation of CH4
decrease significantly over North America measures results in significant reductions in
and Europe due to implementation of O3 concentrations leading to avoided yield
the existing and expected legislation. losses of about 25 million tonnes of four
Over Africa and Latin America and the staple crops each year. The implementation
Caribbean, the number of premature deaths of the BC measures would account for about
from these pollutants is expected to show a further 25 million tonnes of avoided yield
modest changes under the reference scenario losses in comparison with the reference
(Figure 7). Over Northeast Asia, Southeast scenario (Figure 1). This is due to significant
Asia and Pacific, premature deaths are reductions in emissions of the precursors
projected to decrease substantially due to CO, VOCs and NOX that reduce O3
reductions in PM2.5 in some areas. However, concentrations.
in South, West and Central Asia, premature
deaths are projected to rise significantly due The regional picture shows considerable
to growth in emissions. differences. Under the reference scenario,
O3 concentrations over Northeast, Southeast
In contrast to the reference scenario, full Asia and Pacific are projected to increase,
implementation of the measures identified resulting in additional crop yield losses
in the Assessment would substantially (Figure 8). In South, West and Central Asia,
improve air quality and reduce premature both health and agricultural damage are
16 deaths globally due to significant reductions projected to rise (Figures 7 and 8). Damage
Integrated Assessment of Black Carbon and Tropospheric Ozoneto agriculture is projected to decrease strongly large enough to reverse all the worsening
over North America and Europe while trends seen in agricultural yields and turn
changing minimally over Africa and Latin them into improvements, relative to 2005,
America and the Caribbean. For the whole with the exception of crop yields in Northeast
Asian region maize yields show a decrease of and Southeast Asia and Pacific. Even in that
1–15 per cent, while yields decrease by less case, the benefits of full implementation are
than 5 per cent for wheat and rice. These quite large, with the measures reducing by
yield losses translate into nearly 40 million 60 per cent the crop losses envisaged in the
tonnes for all crops for the whole Asian region, reference scenario.
reflecting the substantial cultivated area
exposed to elevated O3 concentrations in India It should be stressed that the Assessment’s
– in particular the Indo-Gangetic Plain region. analyses include only the direct effect of
Rice production is also affected, particularly changes in atmospheric composition on health
in Asia where elevated O3 concentrations are and agriculture through changes in exposure
likely to continue to increase to 2030. Yield to pollutants. As such, they do not include
loss values for rice are uncertain, however, the benefits that avoided climate change
due to a lack of experimental evidence on would have on human health and agriculture
concentration-response functions. In contrast, due to factors such as reduced disruption of
the European and North American regional precipitation patterns, dimming, and reduced
analyses suggest that all crops will see an frequency of heat waves. Furthermore, even
improvement in yields under the reference the direct influence on yields are based on
scenario between 2005 and 2030. Even estimates for only four staple crops, and
greater improvements would be seen upon impacts on leafy crops, productive grasslands
implementation of the measures. and food quality were not included, so that
the calculated values are likely to be an
The identified measures lead to greatly underestimate of the total impact. In addition,
reduced O3 concentrations, with substantial extrapolation of results from a number of
benefits to crop yields, especially in Asia experimental studies to assess O3 impacts on
(Figure 8). The benefits of the measures are ecosystems strongly suggests that reductions
2 Reference
1.5
1 CH4 + BC
measures
0.5
0
-0.5
-1
-1.5
-2
-2.5
-3
Africa Northeast Latin North South,
Asia, America America West and
Southeast and and Central Asia
Asia and Caribbean Europe
Pacific
Figure 7. Comparison of premature mortality (millions of premature deaths annually) by region, showing the
change in 2030 in comparison with 2005 for the reference scenario emission trends and the reference plus CH4 +
BC measures. The lines on each bar show the range of estimates. 17
Summary for Decision MakersRelative importance and
Credit: Veerabhadran Ramanathan
scientific confidence in the
measures
Methane measures have a large impact
on global and regional warming, which is
achieved by reducing the greenhouse gases
CH4 and O3. The climate mitigation impacts
of the CH4 measures are also the most certain
because there is a high degree of confidence
in the warming effects of this greenhouse
gas. The reduced methane and hence O3
concentrations also lead to significant benefits
for crop yields.
The measures identified in the Assessment include
replacement of traditional cookstoves, such as that The BC measures identified here reduce
shown here, with clean burning stoves which would
substantially improve air quality and reduce premature concentrations of BC, OC and O3 (largely
deaths due to indoor and outdoor air pollution. through reductions in emissions of CO).
The warming effect of BC and O3 and
the compensating cooling effect of OC,
in O3 could lead to substantial increases in the introduces large uncertainty in the net effect
net primary productivity. This could have a of some BC measures on global warming
substantial impact on carbon sequestration, (Figure 1). Uncertainty in the impact of BC
providing additional climate benefits. measures is also larger than that for CH4
because BC and OC can influence clouds
that have multiple effects on climate that
are not fully understood. This uncertainly
in global impacts is particularly large for the
100 Reference
50 CH4 + BC
measures
0
-50
-100
-150
Africa Northeast Latin North South,
Asia, America America West and
Southeast and and Central Asia
Asia and Caribbean Europe
Pacific
Figure 8. Comparison of crop yield losses (million tonnes annually of four key crops – wheat, rice, maize and soy
combined) by region, showing the change in 2030 compared with 2005 for the reference emission trends and the
18 reference + CH4 + BC measures. The lines on each bar show the range of estimates.
Integrated Assessment of Black Carbon and Tropospheric OzoneCredit: Veerabhadran Ramanathan
Credit: Govind Joshi
Widespread haze over the Himalayas where BC Reducing emissions should lower glacial melt and
concentrations can be as high as in mid-sized cities. decrease the risk of outbursts from glacial lakes.
measures concerning biomass cookstoves and proportion of the health and crop benefits
open burning of biomass. Hence with respect would be realized in Asia.
to global warming, there is higher confidence
for measures that mitigate diesel emissions than Mechanisms for rapid
biomass burning because the proportion of co- implementation
emitted cooling OC particles is much lower for
diesel. In December 2010 the Parties to the
UNFCCC agreed that warming should not
On the other hand, there is higher confidence exceed 2˚C above pre-industrial levels during
that BC measures have large impacts on this century. This Assessment shows that
human health through reducing concentrations measures to reduce SLCFs, implemented
of inhalable particles, on crop yields through in combination with CO2 control measures,
reduced O3, and on climate phenomena such would increase the chances of staying below
as tropical rainfall, monsoons and snow-ice the 2˚C target. The measures would also
melt. These regional impacts are largely slow the rate of near-term temperature rise
independent of the measures’ impact on and also lead to significant improvements
global warming. In fact, regionally, biomass in health, decreased disruption of regional
cookstoves and open biomass burning can precipitation patterns and water supply, and
have much larger effects than fossil fuels. This in improved food security. The impacts of the
is because BC directly increases atmospheric measures on temperature change are felt over
heating by absorbing sunlight, which, large geographical areas, while the air quality
according to numerous published studies, impacts are more localized near the regions
affects the monsoon and tropical rainfall, and where changes in emissions take place.
this is largely separate from the effect of co- Therefore, areas that control their emissions
emitted OC. The same conclusion applies with will receive the greatest human health and
respect to the impact of BC measures on snow food supply benefits; additionally many of the
and ice. BC, because it is dark, significantly climate benefits will be felt close to the region
increases absorption of sunlight by snow and taking action.
ice when it is deposited on these bright surfaces.
OC that is deposited along with BC has very The benefits would be realized in the near
little effect on sunlight reflected by snow and term, thereby providing additional incentives
ice since these surfaces are already very white. to overcome financial and institutional
Hence knowledge of these regional impacts hurdles to the adoption of these measures.
is, in some cases, more robust than the global Countries in all regions have successfully
impacts, and with respect to reducing regional implemented the identified measures to
impacts, all of the BC measures are likely to be some degree for multiple environment and
significant. Confidence is also high that a large development objectives. These experiences 19
Summary for Decision MakersYou can also read