Organic iron complexes enhance iron transport capacity along estuarine salinity gradients of Baltic estuaries
←
→
Page content transcription
If your browser does not render page correctly, please read the page content below
Biogeosciences, 17, 331–344, 2020
https://doi.org/10.5194/bg-17-331-2020
© Author(s) 2020. This work is distributed under
the Creative Commons Attribution 4.0 License.

Organic iron complexes enhance iron transport capacity along
estuarine salinity gradients of Baltic estuaries
Simon David Herzog1 , Per Persson2 , Kristina Kvashnina3,4 , and Emma Sofia Kritzberg5
1 Department of Science and Environment, Roskilde University, 4000 Roskilde, Denmark
2 Centrefor Environmental and Climate Research, Department of Biology, Lund University, 223 62, Lund, Sweden
3 The European Synchrotron, CS40220, 38043 Grenoble CEDEX 9, France
4 Helmholtz Zentrum Dresden-Rossendorf (HZDR), Institute of Resource Ecology, P.O. Box 510119,

01314, Dresden, Germany
5 Aquatic Ecology, Department of Biology, Lund University, 223 62, Lund, Sweden

Correspondence: Simon David Herzog (simon.herzog@biol.lu.se)

Received: 8 June 2019 – Discussion started: 3 July 2019
Revised: 11 November 2019 – Accepted: 29 November 2019 – Published: 22 January 2020

Abstract. Rivers discharge a notable amount of dissolved Fe      1   Introduction
(1.5 × 10⁹ mol yr−1 ) to coastal waters but are still not con-
sidered important sources of bioavailable Fe to open ma-
rine waters. The reason is that the vast majority of particu-    Iron (Fe) mobility from the lithosphere and pedosphere into
lar and dissolved riverine Fe is considered to be lost to the    the hydrosphere and biosphere is controlled by physical,
sediment due to aggregation during estuarine mixing. Re-         chemical and biological processes. While Fe is the fourth
cently, however, several studies demonstrated relatively high    most abundant element in the Earth’s crust (Taylor, 1964),
stability of riverine Fe to salinity-induced aggregation, and    Fe concentrations in oxygenated aquatic systems are gen-
it has been proposed that organically complexed Fe (Fe-OM)       erally low (Johnson et al., 1997; Kraemer, 2004), but they
can “survive” the salinity gradient, while Fe (oxy)hydroxides    can be higher during high flow conditions and in boreal wa-
are more prone to aggregation and selectively removed. In        ters with high dissolved organic carbon (DOC) concentra-
this study, we directly identified, by X-ray absorption spec-    tions (Kritzberg et al., 2014; Ekström et al., 2016). The more
troscopy, the occurrence of these two Fe phases across eight     soluble form of Fe, i.e., Fe(II), is favored under strongly re-
boreal rivers draining into the Baltic Sea and confirmed a       ducing or highly acidic conditions (Waychunas et al., 2005).
significant but variable contribution of Fe-OM in relation to    At circumneutral pH and oxic conditions Fe(II) gets oxidized
Fe (oxy)hydroxides among river mouths. We further found          to Fe(III), which has a low solubility and precipitates as Fe
that Fe-OM was more prevalent at high flow conditions in         (oxy)hydroxides (Lofts et al., 2008; Liu and Millero, 2002).
spring than at low flow conditions during autumn and that        Thus, mobilization of Fe to surface waters requires either wa-
Fe-OM was more dominant upstream in a catchment than             ter flow through anoxic soil layers, favoring Fe(II), or that Fe
at the river mouth. The stability of Fe to increasing salin-     is complexed by organic ligands and also becomes mobile in
ity, as assessed by artificial mixing experiments, correlated    oxic soil layers (Tipping, 1981; Stumm and Morgan, 1970).
well to the relative contribution of Fe-OM, confirming that         Several studies report rising Fe concentrations in surface
organic complexes promote Fe transport capacity. This study      waters, especially in northern Europe (Neal et al., 2008;
suggests that boreal rivers may provide significant amounts      Kritzberg and Ekström, 2012; Sarkkola et al., 2013; Weyhen-
of potentially bioavailable Fe beyond the estuary, due to or-    meyer et al., 2014; Björnerås et al., 2017), suggesting that Fe
ganic matter complexes.                                          export from soils is increasing. As a consequence, Fe load-
                                                                 ing from boreal rivers to estuaries is increasing substantially
                                                                 (Kritzberg and Ekström, 2012; Kritzberg et al., 2014; Björn-
                                                                 erås et al., 2017). Given the key role that Fe plays in both

Published by Copernicus Publications on behalf of the European Geosciences Union.
332                                            S. D. Herzog et al.: Organic iron complexes enhance iron transport capacity

local and global biogeochemical cycles in coastal and ma-          gradient, as well as a range in Fe and DOC concentrations.
rine systems, this is a finding with major implications for the    The Fe speciation, organic speciation (organic vs. inorganic)
receiving systems. What the consequences may be, depends           and redox speciation were characterized by XAS. To be able
first and foremost on the fate of Fe in the estuarine salinity     to link Fe speciation to Fe transport capacity, the same river
gradient. To the extent that Fe is stable to salinity-induced      waters were exposed to artificial salinity gradients (mixing
aggregation and sedimentation, it may provide potentially          experiments). Four of the rivers were sampled under high
bioavailable Fe to the marine system. However, Fe is known         (spring) and low flow conditions (autumn). To reveal differ-
to behave nonconservatively in estuaries, and it has been sug-     ences along the flow path, two upstream sites were sampled
gested that at least 95 % of Fe is aggregated and lost to the      in addition to the river mouth in one river catchment.
sediments in the early part of estuarine mixing (Sholkovitz
et al., 1978; Haese, 2006). Fe can play an important role in
the sediment, e.g., by acting as a C and P sink (Lalonde et        2     Materials and methods
al., 2012; Lenstra et al., 2018). Moreover, benthic release of
Fe and subsequent lateral transport was recently found to be       2.1    Site description and sampling
a significant source of dissolved Fe to open marine waters
(van Hulten et al., 2017).                                         Eight rivers around the Swedish coast, with distinct differ-
   Fe transport capacity – the fraction of riverine Fe remain-     ences in climate and catchment characteristics (Fig. 1), were
ing in suspension at higher salinity – has been shown to           selected for this study. The annual temperature ranged from
vary widely and is in some instances much higher than pre-         5.8 ◦ C for the most northern (Öre) and 9.8 ◦ C for the most
dicted from prior work (Kritzberg et al., 2014; Krachler et al.,   southern river mouth (Helge). Forest is the most dominant
2005). Thus, the riverine Fe source to marine waters may be        land cover and peat soils are present to a varying extent in
underestimated, especially for boreal rivers, where high DOC       all the catchments (Table 1). While six of these river mouths
concentrations can affect Fe speciation. Fe in natural waters      were sampled for previous studies exploring Fe dynamics in
is known to occur in two main phases, mononuclear organic          response to increasing salinity (Kritzberg et al., 2014; Herzog
complexes (Fe-OM) and Fe-rich Fe (oxy)hydroxide colloids           et al., 2017), relating the XAS-assessed contribution of Fe-
associated with organic matter (Breitbarth et al., 2010; Has-      OM complexes to Fe transport capacity, was not previously
sellöv et al., 1999; Andersson et al., 2006). It has been sug-     done. Moreover, to investigate differences in Fe speciation
gested that variability in Fe transport capacity between rivers    along a river, two upstream locations in Helge river were in-
(1 % to 55 %) may be explained by the varying proportion of        cluded. The most upstream sample site, Svineö, which drains
these Fe phases (Kritzberg et al., 2014). Further, studies us-     from a peat bog, has a high percentage of peat soil. The sec-
ing cathodic stripping voltammetry (CSV) have underlined           ond site along the river path, Biveröd, is a small second-order
the importance of complexation by ligands for keeping Fe           stream in a predominantly forested landscape. In addition, to
in suspension in saline waters (Laglera and van den Berg,          understand the impact of high and low flow conditions on
2009; Sukekava et al., 2018). However, the postulated link         Fe speciation and transport capacity, sampling was carried
between Fe-OM and Fe transport capacity requires direct as-        out twice – during autumn and spring – in four of the river
sessment of Fe speciation to verify previous interpretations       mouths (Emån, Lyckby, Mörrum and Helge). A major dif-
based on Fe : OC ratios and molecular size (Stolpe and Has-        ference in the discharge between the autumn and spring sam-
sellöv, 2007; Krachler et al., 2010; Kritzberg et al., 2014). A    pling was observed (Table 1). Finally, for two rivers (Öre and
preferential loss of Fe (oxy)hydroxides by aggregation was         Örekil), transects were sampled starting at the river mouth
shown by Herzog et al. (2017) using X-ray absorbance spec-         and extending over the estuarine salinity gradient, to facili-
troscopy (XAS). While this infers that Fe-OM is more sta-          tate comparison of Fe transport capacity by mixing experi-
ble to salinity-induced aggregation, some Fe-OM was also           ments and in situ Fe concentrations along the natural salinity
found in aggregates, indicating that the control of Fe stabil-     gradient.
ity is more complex.                                                  Water was sampled by hand from half a meter below the
   Based on the previous findings, the aim of the current          surface into acid-cleaned polyethylene containers through a
study was to better understand what controls the fate of Fe        150 µm nylon mesh. The mesh was used to ensure homo-
from boreal rivers across estuarine salinity gradients by ex-      geneous samples free of large detritus. No further filtration
ploring (1) if variability in relative contribution of Fe-OM       steps were applied, to ensure that all suspended Fe was in-
and Fe (oxy)hydroxides can explain variation in Fe transport       cluded, which is critical when studying the stability of river-
capacity and (2) if the relative contribution of Fe-OM and         ine Fe across salinity gradients. Samples were stored cold
Fe (oxy)hydroxide is controlled by spatial factors and flow        and dark in a cooling box with freezing elements until they
conditions, within and among rivers.                               are returned to the lab.
   To this purpose, we sampled eight river mouths that drain          For the XAS analysis, a 1 L sample of water was frozen
at the Swedish coast into the brackish Baltic Sea. The rivers      as soon as possible and never more than 5 h after collection.
were chosen to encompass a wide geographical and climatic          The samples were later freeze-dried and stored dry in the

Biogeosciences, 17, 331–344, 2020                                                        www.biogeosciences.net/17/331/2020/
S. D. Herzog et al.: Organic iron complexes enhance iron transport capacity                                                                          333

Table 1. Catchment characteristics.

                       Site            Catchment          River            Dischargea             Water       Forest        Water      Peat
                                            areaa       lengtha       (autumn/spring)          retention      covera       covera      soila
                                                                                                   timeb
                                               km2            km                 m3 s−1              year           %           %          %
                       Öre                    3029           225                    8.2               0.5        71.8         3.1       25.3
                       Emån                   4471           220              24.1/65.4               1.4        73.3         6.1        8.4
                       Alster                 1525           100                    4.5               1.0        79.7         5.1        9.6
                       Ljungby                 758            62                    2.6               0.2        71.9         0.6        8.5
                       Lyckeby                 810            90               6.4/13.3               0.6        75.0         4.2        7.5
                       Mörrum                 3369           175              26.6/47.6               2.0        69.9        12.7        9.2
                       Svineöc                  28                                    0                          83.5        1.01       33.8
                       Biverödc                 44                                    1                          92.6         0.9       11.6
                       Helge                  4724           190              14.9/36.9               0.5        57.5         4.8       14.4
                       Örekil                 1340            70                    3.9               0.4        53.0         3.9       11.1
                     a Data obtained from http://vattenweb.smhi.se (last access: 23 June 2018). b Data from Lindström et al. (2018). c Upstream
                     sites in the Helge catchment.

                                                                                     tive samples, but this would not affect the distinction between
                                                                                     organically complexed Fe and Fe (oxy)hydroxides, which
                                                                                     was the focus here.
                                                                                        Oxygen and pH were measured in situ with OxyGuard
                                                                                     MkIII and SevenGo Duo pH meter (Mettler Toledo), respec-
                                                                                     tively. Only acid-washed material was used for sample han-
                                                                                     dling, and for XAS and total Fe measurement polycarbonate
                                                                                     bottles and containers were used.

                                                                                     2.2     Artificial seawater mixing experiments

                                                                                     Experiments mixing river water and artificial seawater were
                                                                                     initiated as soon as possible and no later than 3 h after sam-
                                                                                     pling. Water samples were mixed with artificial sea salt so-
                                                                                     lutions in a 6 : 1 ratio (vol : vol) in 50 mL Falcon tubes to
                                                                                     8 or 16 levels of salinity ranging from 0 to 35. To achieve
                                                                                     the desired final salinities the added concentration of the sea
                                                                                     salt solution varied. These were made from an artificial sea
                                                                                     salt stock solution produced using reagent grade salts (Sigma
                                                                                     Aldrich) following a standard protocol (Kester et al., 1967)
                                                                                     (mass fraction given in %: Cl− (55.05), Na+ (30.62), SO2−    4
                                                                                     (7.68), Mg2+ (3.69), Ca2+ (1.15), K+ (1.10), HCO−     3 (0.40),
                                                                                     Br− (0.19), H3 BO3 (0.07), Sr2+ (0.04), F− (0.003)). The
                                                                                     Fe contamination from the salts used was negligible, e.g.,
Figure 1. Map of all river catchments in Sweden with the ones con-                   the addition of salt to produce salinity 35 added a max-
sidered in this study named and marked blue.                                         imum of 0.0025 mg L−1 Fe, which corresponds to 0.1 %–
                                                                                     3.8 % of the Fe concentration in the river waters studied.
                                                                                     The stock solution was diluted to the desired concentration
dark until analyzed. Freeze-drying is commonly applied for                           by Milli-Q water (Millipore, 18.2 M). After mixing the
preservation and pre-concentration of XAS samples (Karls-                            river water with the salt solution, the samples were kept
son et al., 2008; Vilgé-Ritter et al., 1999). While the freezing                     in the dark on a shaker for at least 24 h to allow aggre-
may lead to changes in the physical properties of colloids                           gation. Salinity-induced aggregation of Fe consists of sev-
(Raiswell et al., 2010), the chemical composition should be                          eral reactions with a significant fraction aggregating within
less affected. For instance, drying or freeze-drying could in-                       a few seconds (Nowostawska et al., 2008). While aggrega-
crease the rate of crystallization of Fe (Bordas and Bourg,                          tion then continues at a slower rate after the first few hours
1998), reducing the amorphous Fe phase compared with na-                             (Nowostawska et al., 2008; Hunter and Leonard, 1988), the

www.biogeosciences.net/17/331/2020/                                                                                     Biogeosciences, 17, 331–344, 2020
334 S. D. Herzog et al.: Organic iron complexes enhance iron transport capacity
first 24 h should include the largest fraction of the Fe re- were restricted by correlating coordination numbers and fix-
moval. ing the Debye–Waller factors (σ 2 ). Also, the threshold en-
The aggregates were separated by centrifugation at 3000 g ergy (1E0 ) beyond the first was assumed to be identical for
for 8 h at 4 ◦ C. After centrifugation, Fe, DOC, pH and salinity all shells.
were measured in the supernatant. Fe transport capacity was A linear combination fitting (LCF) analysis was applied
calculated as the Fe concentration in the supernatant divided to the river mouth samples using SixPack. k 3 -weighted EX-
by the in situ Fe concentration and multiplied by 100 (%). AFS spectra (k3.0 to 12.0 Å−1 ) were used in the LCF analy-
sis. Reference spectra of ferrihydrite, goethite, hematite, lep-
2.3 Standard analytical methods idocrocite and a Fe(III) complexed to Suwannee Rives fulvic
acid were used as model compounds. This model provided
An ICP-AES Optima 3000DV (Perkin Elmer) was used good fits for all samples and further allowed us to distinguish
to determine total Fe concentration on acidified samples between organically complexed Fe and Fe (oxy)hydroxide.
(1 % vol, HNO3 ). A Shimadzu TOC V-CPN was used to ana- During the LCF analysis E0 was allowed to float, a nonneg-
lyze organic carbon by high-temperature catalytic-oxidation, ative boundary condition was applied and the sum of species
using the non-purgeable organic carbon (NPOC) method. For was not forced to equal 100 %. Components with a contribu-
calibration, a five-point standard curve was used and blanks tion less than 5 % were excluded from the models.
and standards were included in all runs. The pH of the mix- Fe K-edge high-energy-resolution fluorescence detection
ing experiment samples was measured with a 913 pH Meter (HERFD) XANES spectra and Fe Kβ2,5 emission spectra
(Metrohm) and salinity was determined by a WTW inoLab were collected at the high-brilliance X-ray absorption and
Cond730. X-ray emission spectroscopy undulator beamline ID26 of
the European Synchrotron Radiation Facility (ESRF, Greno-
2.4 XAS data collection and analysis ble) (Signorato et al., 1999). The incident X-ray beam
was monochromatized with a pair of cryogenically cooled
Synchrotron data were collected at the beam line I811 MaxII Si(111) crystals. The sample, analyzer crystal and photon
ring (Max Lab, Lund University). Fe K-edge XAS spectra detector (silicon drift diode) were arranged in a vertical
were collected on the river samples at fluorescence mode at Rowland geometry. The intensity was normalized to the in-
room temperature. A Lytle detector with an Mn filter (3 µx) cident flux. Both the HERFD and the Fe Kβ2,5 emission
was used to minimize unwanted scattering and fluorescence spectra were measured using the X-ray emission spectrome-
contributions. Aligned samples at 45◦ relative to the incident ter (Glatzel and Bergmann, 2005; Kvashnina and Scheinost,
beam guaranteed an optimal fluorescence signal. Depending 2016), and the HERFD measurements were performed by
on the Fe concentration 15 to 40 spectra for each samples recording the intensity of the Fe Kβ1 emission line (7058 eV)
were recorded taking approximately 5 min each. Transmis- as a function of the incident energy using five Ge (620) crys-
sion scans of a reference Fe foil were collected simultane- tal analyzers at 79◦ Bragg angle.
ously during all scans for energy calibration.
Data treatment and analysis for the extended X-ray ab-
2.5 Data treatment
sorption fine structure (EXAFS) and wavelet transform (WT)
spectra was performed according to Herzog et al. (2017). A
subset of the samples (6 out of 14) was previously analyzed The contribution of the single Fe-C and the multiple Fe-O/C
for EXAFS (Herzog et al., 2017), and reanalysis was per- scattering paths was statistically analyzed in the EXAFS fits
formed with consistent fitting parameters for the whole data by an F test with Viper (Klementev, 2001).
set to allow comparison among all samples. In short, all scans As a measure of the relative contribution of Fe-OM and
were checked for beam damage before being averaged with Fe (oxy)hydroxides in the water samples, two different ap-
SixPack (Webb, 2005). The averaged scans were normalized proaches using the k 3 -weighted EXAFS spectra were ap-
and the background was removed by subtracting a spline plied: (1) a ratio of the coordination numbers of the fitting re-
function in Viper (Klementiev, 2000). The same program was sults, between the Fe-C path and the shortest (edge-sharing)
used for investigation of self-absorbance and shell by shell Fe-Fe path (i.e., CNFe-C /CNFe-Fe ) and (2) a ratio of the Fe-
fitting of the EXAFS data. For the WT analysis Igor Pro OM fraction and the sum of Fe-oxide fractions from the LCF
script was used (Funke et al., 2005). The k 3 -weighted spectra analysis.
were modeled in k-space from 2.8 to 12.0 Å−1 using theoret- Relationships in the river mouth samples between Fe
ical phase and amplitude functions from FEFF7 (Zabinsky transport capacity at 35 salinity (corresponding to the salinity
et al., 1995). Goethite (O’day et al., 2004) and the trisoxala- of the open sea), CNFe-C /CNFe-Fe ratios, LCF ratio, Fe : OC
toiron(III) complex (Persson and Axe, 2005) were used as ratios, total Fe and DOC were tested by Pearson correlations.
input structures for calculations with FEFF. While fitting, the Assumptions of normality were verified by Shapiro–Wilk
amplitude reduction factor (S02 ) was set to 0.70. Further, with tests. Differences in Fe transport capacity between spring and
values found in the literature, the numbers of free variables autumn samples, as well as DOC concentrations at in situ and
Biogeosciences, 17, 331–344, 2020 www.biogeosciences.net/17/331/2020/S. D. Herzog et al.: Organic iron complexes enhance iron transport capacity 335
35 salinity in the mixing experiment, were tested by paired 3.7 Å, caused by single Fe-C and multiple Fe-C-C(O or N)
t tests. scattering, respectively (denoted in Fig. 2a as C and C/O),
Expected, or theoretical, values of in situ Fe across the es- and are in good agreement with previously identified Fe-OM
tuarine salinity gradient were calculated by accounting for complexes (Fig. S2) (Karlsson and Persson, 2010). In Fig. 2
the dilution of riverine water by seawater (estimated by salin- only a selection of the WT plots are shown; all WT plots of
ity) and the stability of Fe to aggregation as assessed by the the remaining samples can be found in Fig. S1.
artificial mixing experiments. The following equation Eq. (1) Guided by the WT results, the EXAFS spectra were quan-
was used to calculate the expected Fe concentration [Feexp ] titatively modeled by a shell-by-shell nonlinear least-squares
at a given salinity: fitting procedure (Table S2 in the Supplement) including
five paths (Fe-O, two Fe-Fe, Fe-C and a Fe-C/O multiple-
Feriver × salinity
Feexp =
Festability × salinitymarine end-member
scattering path). The two Fe-Fe paths were used to describe
the contribution of Fe (oxy)hydroxide and the Fe-C, and the
salinity
+ [Femarine end-member ] × 1 − , (1) Fe-C/O multiple-scattering paths were used for the Fe-OM
salinitymarine end-member
component. This modeling approach corroborated the qual-
where [Feriver ] is the Fe concentration at the river mouth, itative WT analyses and provided good fits to all spectra
salinitymarine end-member is the highest salinity in the estuarine (Fig. S3). For the river mouth samples the Fe-Fe edge- and
in situ gradient, [Femarine end-member ] is the Fe concentration corner-sharing distances were determined to 3.05–3.11 and
at the highest salinity in the estuarine gradient and Festability 3.41–3.46 Å, respectively (Table S1). The coordination num-
is the fraction that remained in suspension in the artificial ber (CN) of the short Fe-Fe path varied between 1.0 and 2.7,
seawater mixing experiments at the given salinity. indicating significant contribution from Fe (oxy)hydroxide,
as corroborated by the WT plots. The Fe-C distances varied
between 2.85 and 3.00 Å, and the CN of the Fe-C path varied
3 Results between 0.9 and 2.8 Å. To verify the contribution of the Fe-C
path, an F test comparing EXAFS models with and without
3.1 Water chemistry
the Fe-C and the Fe-C/O multiple-scattering paths was per-
At the time of sampling all river mouths were close to sat- formed, showing a significant contribution at the 92 % confi-
uration with dissolved oxygen (85 %–118 %) and pH val- dence level or better. While the EXAFS-fitting analyses con-
ues close to neutral (Table 2). For the river mouths that firmed the presence of both Fe (oxy)hydroxide and Fe-OM
were sampled twice, pH was consistently lower during spring complexes in all river mouth samples, the CN values indi-
than during autumn sampling, i.e., lower during higher dis- cated a large variation in the relative contribution of these Fe
charge. Total Fe concentrations in the river mouths varied species (Table S1).
from 0.22 to 2.28 mg L−1 and DOC concentrations from 8.8 LCF analysis supported the variable contribution of the
to 24.2 mg L−1 . Water chemistry in the two upstream sam- two Fe phases in the water samples (Table S2) and was in
ples from the Helge catchment differed strongly from those good agreement with the WT data. LCF analysis assigned the
of the river mouth. Oxygen saturation and pH were lower main components in the river mouth samples to Fe-OM, fer-
in the upstream sites, especially in Svineö (dissolved oxy- rihydrite and lepidocrocite. The contributions from goethite
gen saturation 41 % and pH 4.4), while Fe and DOC con- and hematite were below 5 % in all samples and therefore
centrations were markedly higher. Across all samples Fe excluded from the final analysis.
and DOC concentrations were strongly correlated (r = 0.96; The XAS data contain information on the local struc-
p < 0.001), but since Fe was more variable (32-fold) than ture around the selected element (Fe) that it is not strictly
DOC (6-fold), there was a wide range in Fe : DOC molar ra- quantitative. Therefore, the ratios were merely used to iden-
tios, from 0.005 to 0.035. tify trends in the relative contribution of Fe-OM vs. Fe
(oxy)hydroxides among the samples. Differences in the rela-
3.2 XAS characterization tive contribution of Fe-OM and Fe (oxy)hydroxide across the
samples were obvious from the WT plots (Figs. 2 and S1) and
The XAS analyses identified two main Fe phases, namely Fe supported by the CNFe-C /CNFe-Fe and LCF ratios (Table 2).
(oxy)hydroxide, and Fe ions associated with organic matter There was agreement between the two ratios, as indicated
as Fe-OM complexes. Both phases were qualitatively iden- by correlations across all samples (r = 0.58; p = 0.047) and
tified in the WT contour plots (Fig. 2). The feature in the river mouth samples only (r = 0.64; p = 0.033) (Fig. S4).
WT plots at ca. 7.5 Å−1 , 2.8 Å, originate from Fe-Fe scat- Low ratios, i.e., low contributions of Fe-OM, were indi-
tering paths (denoted Fig. 2a as Fe) and are similar to that cated by both approaches for the Öre, Alster, Lyckebyautumn
of ferrihydrite (Fig. S2 in the Supplement) (Sundman et al., and Örekil samples, for which the Fe (oxy)hydroxide fea-
2014; Yu et al., 2015) and goethite (Fig. S2) (Karlsson and ture was dominant in the WT plots. This was contrasted by
Persson, 2010; Sundman et al., 2014). Features for the Fe- Lyckebyspring and Mörrumspring samples, with high ratios and
OM complexes occurred at ca. 3 Å−1 , 2.5 Å and 3 Å−1 , 3.2– particularly strong Fe-OM signals in the WT plots. For the
www.biogeosciences.net/17/331/2020/ Biogeosciences, 17, 331–344, 2020336 S. D. Herzog et al.: Organic iron complexes enhance iron transport capacity
Table 2. Water chemistry and transport capacity at salinity 35 (corresponding to the salinity of the open sea) of collected samples.
Site Sampling date pH O2 Total Fe DOC Transport CN ratioa LCF ratiob
capacity at
35 salinity
% mg L−1 mg L−1 %
Öre 20 Apr 2015 7.45 – 1.365 10.6 9.5 0.5 0.54
Emån 3 Nov 2014 7.36 98 0.595 11.3 10.2 1.4 0.38
9 Mar 2015 7.24 – 0.857 12.8 18.7 1.6 0.50
Alster 3 Nov 2014 7.11 87 0.402 9.8 7.3 1.0 0.31
Ljungby 20 Oct 2014 7.01 118 1.76 24.2 17.9 1.0 0.64
Lyckeby 29 Oct 2014 6.99 101 2.095 19.4 6.6 1.0 0.50
9 Mar 2015 6.55 – 2.082 19.4 24.1 2.7 0.89
Mörrum 29 Oct 2014 7.43 103 0.449 10.2 7.3 1.5 0.53
23 Mar 2015 7.05 105 0.745 13.6 15.5 2.0 0.71
Svineöc 6 Nov 2014 4.44 41 7.011 49.3 12.4 – 1.00
Biverödc 6 Nov 2014 6.38 84 4.777 29.6 12.3 1.7 –
Helge 6 Oct 2014 7.58 86 1.22 – 0.7 –
23 Mar 2015 7.47 101 2.280 15.8 9.3 1.6 0.46
Örekil 14 Jul 2014 7.28 85 0.220 8.8 9.5 0.8 0.47
a Ratio of the coordination numbers of the fitting results, between the Fe-C path and the shortest (edge-sharing) Fe-Fe path (i.e.,
CNFe-C /CNFe-Fe ). b Ratio of the Fe-OM fraction and the sum of Fe-oxide fractions from the LCF analysis. c Upstream sites in the Helge
catchment.
Figure 2. Morlet wavelet transforms (η = 4, σ = 2) of EXAFS data collected on samples from the Lyckeby, Mörrum, Örekil and Öre rivers
(white represents autumn and red represents spring) and are plotted as a function of k (Å−1 ) on the x axis and R (Å) on the y axis. In
panel (a) (Lyckeby) areas representing the different Fe scattering paths are indicated by C (Fe-C), C/O (Fe-C-C/O) and Fe (Fe-Fe).
other river mouth samples, a more even contribution of the energy shoulder at 7.1135 kEv, which was most pronounced
two Fe species was found. for the Svineö sample (Fig. 3b). This effect was even more
Fe speciation in the two samples taken upstream in the obvious in the Kβ2,5 emission spectra (Fig. 3a) where the
Helge river catchment was distinctly different from the river peak at 7.105 kEv provided direct evidence for the presence
mouth. The HERFD and Kβ2,5 emission spectra (Fig. 3a and of Fe(II), based on comparison with the model compounds.
b) indicated a gradual change from low to high Fe oxidation The emission spectrum of the Svineö sample is very similar
state when approaching the river mouth. Due to low Fe con- to the organic Fe(II) complex Fe(acac)2 , which suggests that
centration there was more noise in the river mouth sample, Fe(II) was the predominant oxidation state at this site.
but the deviation from the Fe(II) spectra was still clear. In the The WT results of the Svineö sample indicated no Fe-Fe
HERFD spectra the presence of Fe(II) was shown by a low- scattering (Fig. 4), whereas further downstream at Biveröd
Biogeosciences, 17, 331–344, 2020 www.biogeosciences.net/17/331/2020/S. D. Herzog et al.: Organic iron complexes enhance iron transport capacity 337
Figure 3. Fe K-edge HERFD pre-edge spectra (a) and Kβ2,5 X-ray emission (XES) spectra (b) of the Helge river mouth sample, the Biveröd
sample, the Svineö sample, Fe(II)-acetylacetonate (Fe(acac)2 ) (green), and six-line Ferrihydrite (red). The spectra were normalized to the
maximum intensities. The dotted lines are included for visual guidance.
Figure 4. Morlet wavelet transforms (η = 4; σ = 2) of EXAFS data of the two upstream samples from Svineö and Biveröd and the river
mouth of the Helge catchment (white represents autumn and red represents spring), plotted as a function of k (Å−1 ) on the x axis and R (Å)
on the y axis.
both Fe-C and Fe-C-C(O or N) features were present. In the the LCF ratio was negatively correlated to pH (r = −0.69;
river mouth Fe-Fe was even further pronounced. Thus, the p = 0.019). Among all samples, no significant relationships
Fe-Fe signal increased in strength the further downstream the were found between CNFe-C /CNFe-Fe or LCF ratios and vari-
sample was taken. ables related to catchment size, land cover or soil type.
The LCF analysis corroborated the WT results; i.e., for
Svineö no Fe-oxides were identified, whereas in Biveröd 3.3 Fe transport capacity
both Fe-OM and Fe-oxides were present and in the Helge
river mouth Fe-oxides were dominating (Table S2). This The general pattern of the artificial seawater mixing exper-
trend was also obvious from the quantitative shell-by-shell iments was a nonconservative behavior of Fe with increas-
fitting results (Table S1). Finally, comparing the various EX- ing salinity (Fig. 5). Fe removal already took place at low
AFS analyses with the HERFED and Kβ2,5 emission spec- salinities, with more than 50 % of the Fe removed at salin-
troscopy results show that Fe(II) in the upstream samples of ity 2 for some river samples (Öre, Alster, Mörrumautumn and
the Helge river system is present as Fe-OM complexes. These Helgespring , Helgeautumn ). At a salinity corresponding to the
complexes are favored by low pH and low oxygen concentra- open ocean (35), between 76 % and 93 % of Fe was removed.
tions, as expected. High Fe transport capacity was measured for Lyckeby river,
For the river mouths that were sampled twice, samples with 24 % remaining in suspension at salinity 35. No signifi-
taken during high flow regime in spring displayed consis- cant loss of OC in response to increasing salinity was found
tently higher CNFe-C /CNFe-Fe and LCF ratios than samples for rivers where OC was analyzed in the mixing experiment
taken in the same river in autumn during lower discharge, in- (Öre, Örekil, Helge, Mörrum, Emån and Lyckeby: t5 = 1.38;
dicating a higher contribution of Fe-OM complexes during p = 0.17).
high flow conditions (Table S1). For the river mouth samples, the Fe transport capacity
Considering all samples, the relative contribution of Fe- at 35 salinity correlated positively with the Fe speciation
OM and Fe (oxy)hydroxide was not predicted by the mo- ratios (CNFe-C /CNFe-Fe : r = 0.675; p = 0.023; LCF ratio
lar Fe : OC, i.e., no correlation between the Fe : OC and the = 0.78; p = 0.005) (Fig. S5). Further, Fe transport capacity
Fe speciation ratios was found (CNFe-C /CNFe-Fe ratio: r = at 35 salinity was negatively correlated to pH (r = −0.730,
0.182, p = 0.570; LCF ratio: r = 0.53; p = 0.077). Instead, p = 0.007).
www.biogeosciences.net/17/331/2020/ Biogeosciences, 17, 331–344, 2020338 S. D. Herzog et al.: Organic iron complexes enhance iron transport capacity
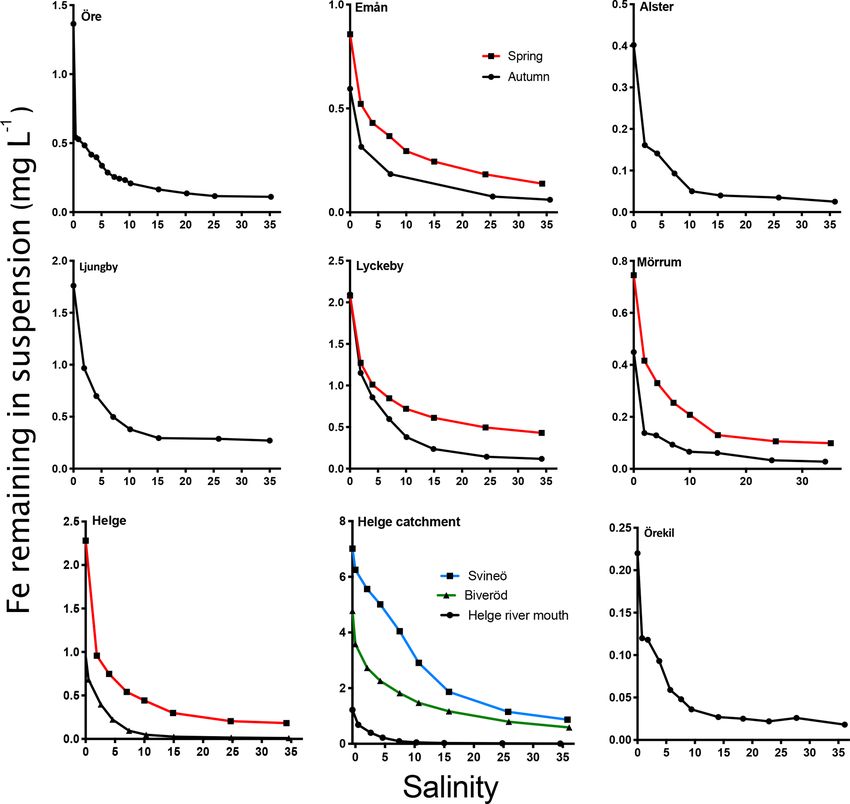
Figure 5. The change in Fe in suspension in response to increasing salinity (0–35). Black lines denote sampling in autumn and red lines
denote sampling in spring. For Helge river, the blue line denotes the most upstream sample (Svineö), the green line the other upstream sample
(Biveröd) and the black line the river mouth.
When comparing the samples taken within the Helge
catchment, upstream samples showed a higher Fe transport
capacity than the river mouth sample (Fig. 5). For the four
river mouths that were sampled twice, Fe transport capac-
ity (at 35) was consistently higher in spring than in autumn
(t3 = 4.696, p = 0.0183).
In addition to raising the salinity, the pH in the samples
also increased due to the experimental treatments from 6.4 to
7.5 in the river mouths to 7.4–8.3 in the high-salinity treat-
ments and from pH 4.7–6.5 to pH 7.1–7.7 for the upstream
samples.
In situ concentrations of total Fe declined with increasing Figure 6. Fe concentration in suspension at different salinities. The
salinity and distance from the river mouths (Fig. 6). The the- black line denotes in situ samples along a transect from the river
oretical values for Fe, calculated based on salinity-induced mouth and the brown line theoretical values based on mixing exper-
aggregation in the artificial seawater mixing experiments and iments.
dilution estimated by salinity, were only slightly lower than
the measured in situ values for Örekil river. The deviation
was larger for Öre river, where the Fe measured in situ was 4 Discussion
substantially higher than the theoretical values at the lower
levels of salinity. 4.1 In situ speciation of Fe
Two carrier phases associated with Fe transport in freshwater
in a boreal system – Fe-OM and Fe (oxy)hydroxides (Ander-
Biogeosciences, 17, 331–344, 2020 www.biogeosciences.net/17/331/2020/S. D. Herzog et al.: Organic iron complexes enhance iron transport capacity 339
sson et al., 2006; Hassellöv et al., 1999) – have been pre- an Fe concentration of around 1 µg L−1 (Baltic proper) (Gelt-
viously verified by XAS (Sundman et al., 2013; Herzog et ing et al., 2010).
al., 2017) and were also identified and detected in all river Previous studies using size separation and spectrometric
mouth samples in this study. The results of the quantitative methods (Stolpe and Hassellöv, 2007) but also XAS (Herzog
modeling of the EXAFS spectra and LCF analysis correlated, et al., 2017) have suggested that mainly Fe (oxy)hydroxide
which is satisfying considering the potential sources of error is affected by salinity and selectively lost from suspension
of both analyses. Results showed a wide variation in the rel- by aggregation and sedimentation (Herzog et al., 2017). In
ative contribution of the Fe phases across river mouths, with contrast, Fe complexed by terrigenous organic matter is sup-
some dominated by Fe-OM, e.g., Lyckebyspring river sam- posedly less affected and to a larger extent “surviving” estu-
ples, and some by Fe (oxy)hydroxide, e.g., Öre river. The arine mixing. Thereby, it can become a source of bioavailable
significant contribution of Fe-OM in the river mouth sam- Fe to marine waters (Krachler et al., 2010; Laglera and van
ples is in contrast to the thermodynamic modeling suggested den Berg, 2009; Batchelli et al., 2010). The positive corre-
by Wällstedt et al. (2010) for these systems that predicted a lation between the contribution of Fe-OM (as determined by
dominance of ferrihydrite (97 %). XAS) and Fe transport capacity (determined in artificial mix-
The contribution of the Fe phases changed markedly along ing experiments) adds direct support to the idea that organic
the Helge river catchment. In the water draining from a complexation of Fe enhances the stability across salinity gra-
peat bog (Svineö), Fe(II) was predominant and only Fe-OM dients.
was present. Neither EXAFS-fitting nor LCF identified Fe- In freshwater Fe (oxy)hydroxide is stabilized by surface
Fe paths to support the presence of Fe (oxy)hydroxide. The interactions with organic matter (OM), providing a nega-
sample showed similar features to groundwater in a north- tive surface charge (Tiller and O’Melia, 1993). With in-
ern boreal catchment (Sundman et al., 2014) or Fe(II) loaded creasing salinity, the surface charge gets neutralized, result-
onto peat humic acid (Yu et al., 2015). Further downstream ing in reduced colloidal repulsion (Mosley et al., 2003) and
(Biveröd), a mixture of the two phases could be seen, simi- formation aggregates containing both Fe and OM. Marine
lar to samples from soil waters from organic layers close to cations, like magnesium and calcium, which neutralize the
a boreal stream (Sundman et al., 2014). The Fe(III) and Fe negatively charged surface groups of the OM, weaken the
(oxy)hydroxide fraction was more prominent along the river interaction between colloidal Fe (oxy)hydroxide and OM
path and was highest at the river mouth. (Turner and Millward, 2002) and further promote the desta-
In addition to variation across river mouths and within bilization of Fe (oxy)hydroxides at increasing salinity. The
the Helge river catchment, XAS analyses revealed a clear same cations may favor release and hydrolysis of Fe-OM, by
variation between high and low flow regime in the river competing for the binding sites of the organic ligands (Fu-
mouth samples. Samples collected during high flow in spring jii et al., 2008). The stability of organically complexed Fe
showed a higher contribution of Fe-OM than the autumn may also be reduced at high ionic strength leading to com-
samples, which is a direct support for previous interpreta- pression of water and consequent “salting out” of the or-
tions made by ultra filtration (Pokrovsky et al., 2010; Stolpe ganic complexes (Turner and Millward, 2002; Turner et al.,
et al., 2013). This variation is likely to be driven by changes 2004). Accordingly, Herzog et al. (2017) also identified or-
in the source of the Fe depending on seasonal dynamics in ganically complexed Fe in salinity-induced aggregates espe-
hydrology (Dahlqvist et al., 2007). cially at high salinities. However, both the selective loss of Fe
(oxy)hydroxide at saline conditions and the positive correla-
4.2 Fe transport capacity and the link to Fe speciation tion between the relative contribution of Fe-OM and trans-
port capacity in the current study underpin the role of Fe
Nonconservative behavior of Fe was seen in the artificial speciation in controlling the fate of Fe across salinity gra-
mixing experiments, as well as in the estuarine gradients dients. It would be an advantage to directly measure Fe spe-
sampled, and is consistent with existing literature (Gustafs- ciation remaining in suspension in saline samples to see if Fe
son et al., 2000; Boyle et al., 1977; Sholkovitz, 1976). Fe (oxy)hydroxide is present, but this is currently hindered by
transport capacity varied from 0.7 % to 24 % among the methodological limitations. It has been suggested that Fe iso-
rivers. The high Fe transport capacity for most of the rivers topic ratios may reflect Fe speciation (Ingri et al., 2006; Ilina
studied go along with the existing literature showing that et al., 2013); however, this remains to be confirmed. More-
high-latitude DOC-rich rivers exhibit higher Fe-carrying ca- over, based on cathodic stripping voltammetry (CSV), ligand
pacities (Krachler et al., 2005; Muller, 2018). DOC was lit- concentrations have been found to be in excess of iron con-
tle affected by increasing salinity, as previously observed in centration, suggesting that organic ligands are complexing
high-latitude rivers with high DOC concentrations (Herzog et the Fe and keeping it in suspension in saline waters (Gledhill
al., 2017; Forsgren et al., 1996). Nevertheless, the high val- and Buck, 2012; Laglera et al., 2011).
ues of Fe remaining in suspension due to complexation with Results regarding Fe transport capacity derived from the
organic matter at high salinity (0.02–0.50 g L−1 ) supports the artificial seawater mixing experiments were in good agree-
importance of rivers as a source of Fe into the Baltic Sea with ment with the estuarine transects sampled. Theoretically cal-
www.biogeosciences.net/17/331/2020/ Biogeosciences, 17, 331–344, 2020340 S. D. Herzog et al.: Organic iron complexes enhance iron transport capacity
culated Fe concentrations, based on Fe loss in artificial sea- (oxy)hydroxide due to strong hydrolytic tendencies (Karls-
water mixing experiments with river water and the dilution son and Persson, 2012) as pH increases and OM declines
factor, showed only minor deviations from Fe concentra- and in part due to photo reduction of Fe(III)-OM (Fujii et
tions measured in the Gullmar Fjord. For the Öre estuary, on al., 2011; Waite and Morel, 1984; Neubauer et al., 2013).
the other hand, measured Fe concentrations were somewhat But the difference may also reflect different sources of Fe
higher than the theoretical calculations (Fig. 6). In the low- to the river along the flow path. Thus, while runoff from or-
salinity mixing regime present in the northern Baltic (Both- ganic soil layers may bring predominantly Fe-OM to low-
nian Bay), aggregation may occur without significant sedi- order streams (Lydersen et al., 2002; Abesser et al., 2006;
mentation (Forsgren and Jansson, 1992). This has been ob- Dahlqvist et al., 2007; Sundman et al., 2014), groundwa-
served in the plume of nearby Kalix river and was hypoth- ter inflow is more significant further downstream and may
esized to result from a high organic component of the ag- bring small Fe (oxy)hydroxides or Fe(II), which is rapidly
gregates, where low specific density may lead to transport of hydrolyzed in the riparian zone when anoxic groundwater
these aggregates far away from the river mouth (Gustafsson and oxic waters mix (Vasyukova et al., 2010). Hence, the
et al., 2000). Thus, the centrifugation used to efficiently sepa- speciation of Fe at the river mouth is determined both by the
rate aggregates in the mixing experiments, may overestimate properties of the inflowing water and the chemical processing
estuarine particle loss in this context. Despite the agreement along the river flow path.
between measured and theoretically estimated Fe concentra- A consistent pattern was that samples taken in spring,
tions, the artificial mixing experiments are unlikely to cap- when discharge was higher, showed a larger contribution of
ture all processes that affect the loss of Fe along the natural Fe-OM than autumn samples from the same river mouths.
salinity gradient. In the estuary, photoreduction may affect Temporal variation in river runoff is tightly linked to dif-
Fe speciation and affect its fate, as well as the occurrence ferent hydrogeological pathways (Andersson et al., 2006;
of ligands produced by marine biota, which may also influ- Pokrovsky et al., 2006; Neff et al., 2006). During autumn,
ence the behavior of riverine Fe. Indeed, the artificial mixing dominance of groundwater input and longer residence time
experiments capture the response of riverine Fe to increas- of ground water should promote input of Fe(II), which
ing salinity in isolation and how that response depends on Fe rapidly oxidizes to form Fe (oxy)hydroxides in surface water
speciation. in the absence of high OM concentrations (Dahlqvist et al.,
2007). During high discharge, on the other hand, like during
4.3 Control of spatial variation and flow conditions on spring flood or high precipitation events, organically com-
Fe speciation plexed Fe gets mobilized from the upper soil layers into the
river, due to raising water tables and surface runoff (Grabs et
The results of this study showed that Fe speciation is highly al., 2012; Dahlqvist et al., 2007). The lower pH and higher
variable across spatial scales and during different flow condi- DOC values in our spring samples agree with this reasoning
tions and is further linked to Fe stability across salinity gra- – that during higher discharge flow through organic-rich soil
dients. It is therefore imperative to understand what factors layers has a higher influence on river water chemistry and
govern Fe speciation. The largest variability in Fe speciation allows for the formation of more Fe-OM.
was observed between samples taken along the flow path of It was notable how Fe speciation and Fe stability matched
Helge river. In the most upstream location, which drains a pH across the entire data set. A high contribution of Fe-OM
major peat bog (Svineö), Fe(II) and Fe-OM dominated. This and high stability coincided with low pH across river mouths,
site also showed low oxygen and pH but high DOC concen- along the flow path of the Helge catchment and in the spring
tration – conditions that favor complexation over Fe(III) hy- samples compared to the autumn samples. pH should exert a
drolysis (Neubauer et al., 2013; Liu and Millero, 2002). The strong control on Fe speciation and increasing pH favors pre-
Fe speciation in the stream water close to the Fe sources cipitation of Fe (oxy)hydroxide due to the strong hydrolytic
is thus determined by the properties of the inflowing ter- tendency of Fe(III) (Karlsson and Persson, 2012). Moreover,
restrial Fe(II)/Fe(III)-OM complexes and of the conditions a low pH may reflect strong influence from organic soils
when anoxic, hydrated Fe(II) meets oxygenated DOC-rich where Fe prevails as Fe-OM on water chemistry, as seen in
waters (Sundman et al., 2014). The contribution of Fe(III) low-order systems and under high flow conditions (Dahlqvist
and Fe (oxy)hydroxide increased with pH and oxygen satura- et al., 2007; Neubauer et al., 2013). On the contrary, a high
tion along the flow path. This is in agreement with Neubauer pH in the river mouth in these boreal systems may reflect a
et al. (2013), who argued that pH and OM were the main higher influence of groundwater input further downstream,
factors controlling Fe speciation in a boreal catchment and possibly increasing the contribution of Fe (oxy)hydroxide.
explaining the dominance of Fe-OM in wetland-influenced The increasing pH downstream in parallel with photoreduc-
headwaters and increasing Fe (oxy)hydroxide downstream tion and declining DOC concentration may lower the stabil-
(based on molecular size and chemical equilibrium model- ity by promoting release and hydrolysis of organically com-
ing). The difference in speciation along the flow path may in plexed Fe originating from organic soils further upstream
part be due to organically complexed Fe precipitating as Fe
Biogeosciences, 17, 331–344, 2020 www.biogeosciences.net/17/331/2020/S. D. Herzog et al.: Organic iron complexes enhance iron transport capacity 341
(Neubauer et al., 2013; Waite and Morel, 1984; Fujii et al., Table S1 shows the k 3 -weighted Fe K-edge EXAFS fit results for
2011). all samples, and Table S2 contains the EXAFS LCF results for the
The temporal variability within rivers suggests that Fe spe- river mouth samples. Tables S3–S5 show the metadata for Figs. 3,
ciation at a given time is not well predicted by catchment 5 and 6. The supplement related to this article is available online
characteristics only. While characteristics such as land cover at: https://doi.org/10.5194/bg-17-331-2020-supplement.
and soil type most likely affect both quantity and speciation
of Fe exported from the catchment, the limited number of
Author contributions. SDH and ESK conceived of and designed the
rivers and sampling occasions of this study cannot accurately
study. SDH carried out the fieldwork and lab work. SDH, KK and
discern such relationships.
PP performed the XAS analyses and subsequent data treatment.
SDH, PP and ESK analyzed the data. SDH wrote the manuscript
with support from PP and ESK.
5 Conclusions, implications and future perspectives
The collective results from this study confirmed the existence Competing interests. The authors declare that they have no conflict
and wide variability in the contribution of two Fe phases – of interest.
Fe-OM complexes and Fe (oxy)hydroxides – among the bo-
real rivers included. It further confirmed that the response of
river-borne Fe to increasing salinity differed widely. Interest- Acknowledgements. Synchrotron work was done at beamline I811,
ingly, the differences in stability towards salinity-induced ag- MAX-lab synchrotron radiation source, Lund University, Swe-
gregation matched the differences in relative contribution of den, and at the high-brilliance X-ray absorption and X-ray emis-
Fe-OM well across the river mouths, between high and low sion spectroscopy undulator beamline ID26 of the European Syn-
flow conditions, and along the flow path of a river catchment. chrotron Radiation Facility (ESRF, Grenoble). We would like to
Thus, by assessing the Fe speciation by XAS, this study pro- thank Stefan Carlson for his support on site at the beamline I811.
vides direct evidence that Fe-OM enhances survival over es- Further, a special thanks to César Nicolás Cuevas for his assistance
with the analysis of the XAS data. We thank the Swedish University
tuarine salinity gradients.
of Agricultural Sciences (SLU) and Swedish Meteorological and
This would suggest that high and rising concentrations of Hydrological Institute (SMHI) for the monitoring data of Swedish
Fe from boreal rivers (Kritzberg and Ekström, 2012; Björn- rivers. Many thanks to all participants of the COCOA cruise in the
erås et al., 2017) may indeed result in increasing export of Öre estuary in April 2015. A special thanks to Daniel Conley for his
bioavailable Fe to the Baltic Sea and open waters, where efforts in the COCOA project and proofreading of the manuscript.
it may limit N-fixation and primary production (Stal et al., Thanks to Sofia Mebrahtu Wisén for analyzing the samples at the
1999; Stolte et al., 2006; Martin and Fitzwater, 1988). Major inorganic analytical laboratory.
hydrological events like spring floods and heavy storms have
been observed to increase in the Fe concentration by up to
a factor of 20 and alter the annual Fe load in northern rivers Financial support. This research has been supported by the
(Hölemann et al., 2005; Rember and Trefry, 2004; Dahlqvist Swedish Research Council (grant no. 2015-05450), the Swedish Re-
et al., 2007; Herzog et al., 2019). The hydrogeological con- search Council Formas (grant no. 207-2010-126), and the European
ditions during such events (Dahlqvist et al., 2007), may pro- Commission and FORMAS (grant no. 2112932-1).
mote a higher contribution of Fe-OM and thus a higher sta-
bility during estuarine mixing, resulting an increase in Fe ex-
Review statement. This paper was edited by Gwenaël Abril and re-
port into the open waters. However, sampling with higher
viewed by two anonymous referees.
temporal resolution would be required to substantiate such
an extrapolation.
References
Data availability. Data used to generate all figures are available as
tables in the Supplement. Abesser, C., Robinson, R., and Soulsby, C.: Iron and manganese
cycling in the storm runoff of a Scottish upland catchment, J.
Hydrol., 326, 59–78, 2006.
Supplement. The Supplement contains a high-resolution WT mod- Andersson, K., Dahlqvist, R., Turner, D., Stolpe, B., Larsson, T.,
ulus of EXAFS data from the Emån, Alster, and Ljungby river Ingri, J., and Andersson, P.: Colloidal rare earth elements in a
not shown in the paper (Fig. S1); k 3 -weighted EXAFS spectra and boreal river: changing sources and distributions during the spring
Fourier transformations of all samples and corresponding model fits flood, Geochim. Cosmochim. Ac., 70, 3261–3274, 2006.
of all samples (Fig. S3); the relationship between the LCF ratio and Batchelli, S., Muller, F. L., Chang, K.-C., and Lee, C.-L.: Evi-
CN ratio (Fig. S4); and the relationship between Fe transport ca- dence for strong but dynamic iron- humic colloidal associations
pacity at 35 salinity and relative contribution of organically com- in humic-rich coastal waters, Environ. Sci. Technol., 44, 8485–
plexed Fe, as assessed by the CN ratio and LCF ratio (Fig. S5). 8490, 2010.
www.biogeosciences.net/17/331/2020/ Biogeosciences, 17, 331–344, 2020342 S. D. Herzog et al.: Organic iron complexes enhance iron transport capacity
Björnerås, C., Weyhenmeyer, G. A., Evans, C. D., Gessner, M. O., of lateral riparian TOC exports, Biogeosciences, 9, 3901–3916,
Grossart, H. P., Kangur, K., Kokorite, I., Kortelainen, P., Laudon, https://doi.org/10.5194/bg-9-3901-2012, 2012.
H., and Lehtoranta, J.: Widespread increases in iron concentra- Gustafsson, Ö., Widerlund, A., Andersson, P. S., Ingri, J., Roos, P.,
tion in European and North American freshwaters, Global Bio- and Ledin, A.: Colloid dynamics and transport of major elements
geochem. Cy., 31, 1488–1500, 2017. through a boreal river–brackish bay mixing zone, Mar. Chem.,
Bordas, F. and Bourg, A. C.: A critical evaluation of sample pre- 71, 1–21, 2000.
treatment for storage of contaminated sediments to be investi- Haese, R. R.: The biogeochemistry of iron, in: Marine Geochem-
gated for the potential mobility of their heavy metal load, Water istry, Springer, 241–270, 2006.
Air Soil Poll., 103, 137–149, 1998. Hassellöv, M., Lyvén, B., Haraldsson, C., and Sirinawin, W.: Deter-
Boyle, E., Edmond, J., and Sholkovitz, E.: The mechanism of iron mination of continuous size and trace element distribution of col-
removal in estuaries, Geochim. Cosmochim. Ac., 41, 1313–1324, loidal material in natural water by on-line coupling of flow field-
1977. flow fractionation with ICPMS, Anal. Chem., 71, 3497–3502,
Breitbarth, E., Achterberg, E. P., Ardelan, M. V., Baker, A. R., 1999.
Bucciarelli, E., Chever, F., Croot, P. L., Duggen, S., Gledhill, Herzog, S. D., Persson, P., and Kritzberg, E. S.: Salinity Effects on
M., Hassellöv, M., Hassler, C., Hoffmann, L. J., Hunter, K. A., Iron Speciation in Boreal River Waters, Environ. Sci. Technol.,
Hutchins, D. A., Ingri, J., Jickells, T., Lohan, M. C., Nielsdót- 51, 9747–9755, 2017.
tir, M. C., Sarthou, G., Schoemann, V., Trapp, J. M., Turner, D. Herzog, S. D., Conrad, S., Ingri, J., Persson, P., and Kritzberg,
R., and Ye, Y.: Iron biogeochemistry across marine systems – E. S.: Spring flood induced shifts in Fe speciation and
progress from the past decade, Biogeosciences, 7, 1075–1097, fate at increased salinity, Appl. Geochem., 109, 104385,
https://doi.org/10.5194/bg-7-1075-2010, 2010. https://doi.org/10.1016/j.apgeochem.2019.104385, 2019.
Dahlqvist, R., Andersson, K., Ingri, J., Larsson, T., Stolpe, B., Hölemann, J. A., Schirmacher, M., and Prange, A.: Seasonal vari-
and Turner, D.: Temporal variations of colloidal carrier phases ability of trace metals in the Lena River and the southeastern
and associated trace elements in a boreal river, Geochim. Cos- Laptev Sea: Impact of the spring freshet, Global Planet. Change,
mochim. Ac., 71, 5339–5354, 2007. 48, 112–125, 2005.
Ekström, S. M., Regnell, O., Reader, H. E., Nilsson, P. A., Löf- Hunter, K. A. and Leonard, M. W.: Colloid stability and aggrega-
gren, S., and Kritzberg, E. S.: Increasing concentrations of iron tion in estuaries: 1. Aggregation kinetics of riverine dissolved
in surface waters as a consequence of reducing conditions in the iron after mixing with seawater, Geochim. Cosmochim. Ac., 52,
catchment area, J. Geophys. Res.-Biogeo., 121, 479–493, 2016. 1123–1130, 1988.
Forsgren, G. and Jansson, M.: The turnover of river-transported Ilina, S. M., Poitrasson, F., Lapitskiy, S. A., Alekhin, Y. V.,
iron, phosphorus and organic carbon in the Öre estuary, north- Viers, J., and Pokrovsky, O. S.: Extreme iron isotope fraction-
ern Sweden, in: Sediment/Water Interactions, Springer, 585–596, ation between colloids and particles of boreal and temperate
1992. organic-rich waters, Geochim. Cosmochim. Ac., 101, 96–111,
Forsgren, G., Jansson, M., and Nilsson, P.: Aggregation and sed- https://doi.org/10.1016/j.gca.2012.10.023, 2013.
imentation of iron, phosphorus and organic carbon in experi- Ingri, J., Malinovsky, D., Rodushkin, I., Baxter, D. C.,
mental mixtures of freshwater and estuarine water, Estuar. Coast. Widerlund, A., Andersson, P., Gustafsson, Ö., Forsling,
Shelf S., 43, 259–268, 1996. W., and Öhlander, B.: Iron isotope fractionation in river
Fujii, M., Ito, H., Rose, A. L., Waite, T. D., and Omura, T.: Trans- colloidal matter, Earth Planet. Sc. Lett., 245, 792–798,
formation dynamics and reactivity of dissolved and colloidal iron https://doi.org/10.1016/j.epsl.2006.03.031, 2006.
in coastal waters, Mar. Chem., 110, 165–175, 2008. Johnson, K. S., Gordon, R. M., and Coale, K. H.: What controls
Fujii, M., Dang, T., Rose, A. L., Omura, T., and Waite, T.: Effect of dissolved iron concentrations in the world ocean?, Mar. Chem.,
light on iron uptake by the freshwater cyanobacterium Microcys- 57, 137–161, 1997.
tis aeruginosa, Environ. Sci. Technol., 45, 1391–1398, 2011. Karlsson, T. and Persson, P.: Coordination chemistry and hydroly-
Funke, H., Scheinost, A., and Chukalina, M.: Wavelet analysis of sis of Fe (III) in a peat humic acid studied by X-ray absorption
extended x-ray absorption fine structure data, Phys. Rev. B, 71, spectroscopy, Geochim. Cosmochim. Ac., 74, 30–40, 2010.
094110, https://doi.org/10.1103/PhysRevB.71.094110, 2005. Karlsson, T. and Persson, P.: Complexes with aquatic
Gelting, J., Breitbarth, E., Stolpe, B., Hassellöv, M., and In- organic matter suppress hydrolysis and precipi-
gri, J.: Fractionation of iron species and iron isotopes in tation of Fe(III), Chem. Geol., 322–323, 19–27,
the Baltic Sea euphotic zone, Biogeosciences, 7, 2489–2508, https://doi.org/10.1016/j.chemgeo.2012.06.003, 2012.
https://doi.org/10.5194/bg-7-2489-2010, 2010. Karlsson, T., Persson, P., Skyllberg, U., Mo¨rth, C.-M., and Giesler,
Glatzel, P. and Bergmann, U.: High resolution 1s core hole X-ray R.: Characterization of iron (III) in organic soils using extended
spectroscopy in 3d transition metal complexes – electronic and X-ray absorption fine structure spectroscopy, Environ. Sci. Tech-
structural information, Coordin. Chem. Rev., 249, 65–95, 2005. nol., 42, 5449–5454, 2008.
Gledhill, M. and Buck, K. N.: The organic complexation of iron Kester, D. R., Duedall, I. W., Connors, D. N., and Pytkowicz, R. M.:
in the marine environment: a review, Front. Microbiol., 3, 69, Preparation of artifical seawater, Limnol. Oceanogr., 12, 176–
https://doi.org/10.3389/fmicb.2012.00069, 2012. 179, 1967.
Grabs, T., Bishop, K., Laudon, H., Lyon, S. W., and Seibert, Klementev, K.: Statistical evaluations in fitting problems, J. Syn-
J.: Riparian zone hydrology and soil water total organic car- chrotron Radiat., 8, 270–272, 2001.
bon (TOC): implications for spatial variability and upscaling Krachler, R., Jirsa, F., and Ayromlou, S.: Factors influencing
the dissolved iron input by river water to the open ocean,
Biogeosciences, 17, 331–344, 2020 www.biogeosciences.net/17/331/2020/You can also read