A Predictive Human Health Risk Assessment of Non-Choleraic Vibrio spp. during Hurricane-Driven Flooding Events in Coastal South Carolina, USA - MDPI
←
→
Page content transcription
If your browser does not render page correctly, please read the page content below
atmosphere

Article
A Predictive Human Health Risk Assessment of Non-Choleraic
Vibrio spp. during Hurricane-Driven Flooding Events in Coastal
South Carolina, USA
Alexandra M. Frank *, Mariana G. Cains                      and Diane S. Henshel

                                          O’Neill School of Public and Environmental Affairs, Indiana University, Bloomington, IN 47405, USA;
                                          mgcains@iu.edu (M.G.C.); dhenshel@iu.edu (D.S.H.)
                                          * Correspondence: franalma@iu.edu; Tel.: +1-317-965-3133

                                          Abstract: Densely populated, low-lying coastal areas are most at-risk for negative impacts from
                                          increasing intensity of storm-induced flooding. Due to the effects of global warming and subsequent
                                          climate change, coastal temperatures and the magnitude of storm-induced flooding are projected
                                          to increase, creating a hospitable environment for the aquatic Vibrio spp. bacteria. A relative risk
                                          model analysis was used to determine which census block groups in coastal South Carolina have the
                                          highest risk of Vibrio spp. exposure using storm surge flooding as a proxy. Coastal block groups with
                                          dense vulnerable sub-populations exposed to storm surge have the highest relative risk, while inland
                                          block groups away from riverine-mediated storm surge have the lowest relative risk. As Vibriosis
                                          infections may be extremely severe or even deadly, the best methods of infection control will be
                                          regular standardized coastal and estuarine water monitoring for Vibrio spp. to enable more informed

                                   and timely public health advisories and help prevent future exposure.

Citation: Frank, A.M.; Cains, M.G.;
                                          Keywords: sea level rise (SLR); storm surge; health vulnerability; septicemia; relative risk model (RRM)
Henshel, D.S. A Predictive Human
Health Risk Assessment of Non-
Choleraic Vibrio spp. during Hurricane-
Driven Flooding Events in Coastal
South Carolina, USA. Atmosphere
                                          1. Introduction
2021, 12, 269. https://doi.org/                 Climate change is projected to increase atmospheric and oceanic temperatures globally
10.3390/atmos12020269                     with increased microvariability, in turn affecting precipitation patterns, increasing the
                                          likelihood of extreme weather events and natural disasters, and accelerating sea level rise
Academic Editor: Arturo Sousa             (SLR) due to melting glaciers and seawater expansion [1,2]. The effects of climate change
                                          are already occurring in the United States as manifested by the increased number and
Received: 5 January 2021                  severity of hurricanes, wildfires, and extreme precipitation events. As global weather
Accepted: 12 February 2021
                                          patterns continue to shift, the weather and secondary phenomena are projected to become
Published: 17 February 2021
                                          even more unpredictable and hazardous [3]. The air and water warming also leads to
                                          melting of large ice formations (e.g., glaciers) which is leading to global ocean mean water
Publisher’s Note: MDPI stays neutral
                                          level increases, known as SLR [4]. As the sea level rises, the 40% of United States citizens
with regard to jurisdictional claims in
                                          living in dense urban coastal areas will be affected by flooding and inundation that can
published maps and institutional affil-
                                          negatively affect living conditions and human health. SLR can increase the prevalence of
iations.
                                          disease pathogens, such as Vibrio spp., further inland from the coastline [5,6].
                                                Flooding due to climate change is expected to be particularly severe on coastlines,
                                          because of a combination of SLR, storm surges, and precipitation [7–9]. As the sea level
                                          rises and hurricane intensity increases, storm surge flooding and increased precipitation
Copyright: © 2021 by the authors.         will likely intensify along coastlines already vulnerable to severe flooding. The South
Licensee MDPI, Basel, Switzerland.
                                          Carolina coastline is susceptible to severe coastal flooding due to populated low-lying
This article is an open access article
                                          floodplains and urbanized estuaries [10]. In addition, large population centers along the
distributed under the terms and
                                          South Carolina (SC) coastline, like Charleston, Myrtle Beach, and Hilton Head, are subject
conditions of the Creative Commons
                                          to flooding and its potential economic and health risks.
Attribution (CC BY) license (https://
                                                Historically, tropical storms and hurricanes occur between June and November, but the
creativecommons.org/licenses/by/
4.0/).
                                          severity and intensity of these storms has grown, and May hurricanes are becoming more

Atmosphere 2021, 12, 269. https://doi.org/10.3390/atmos12020269                                         https://www.mdpi.com/journal/atmosphere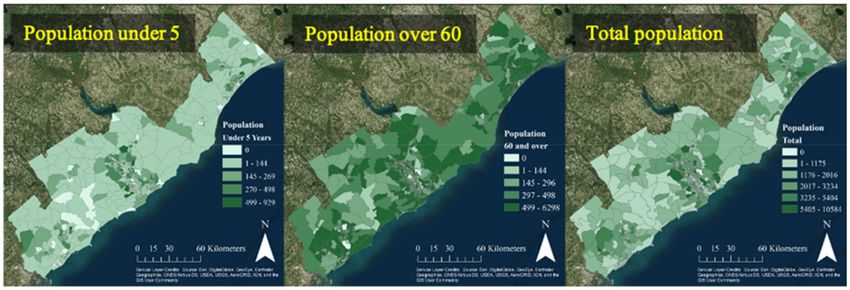
Atmosphere 2021, 12, 269                                                                                            2 of 17

                           common along the Atlantic coast [11]. The severity of flooding is proportional to both
                           the hurricane intensity and subsequent storm surges experienced by cities and regions
                           directly impacted by tropical storms [12]. This flooding, coupled with SLR projected by the
                           International Panel on Climate Change (IPCC) [13], will inundate estuaries characteristic of
                           South Carolina with both salt and freshwater, altering the human landscape and positively
                           or negatively affecting the Vibrio spp. habitat depending on the salinity of the water [14,15].
                                Halophilic bacteria (i.e., bacteria that can survive and grow in saline water), such as
                           Vibrio spp., grow best in salty waters typical of estuarine habitats in coastal South Carolina
                           (see Table 1). The warm waters of the southern coastal US also encourage Vibrio spp.
                           growth, and higher temperatures in southeastern (USA) coastal waters may alter the
                           acceptable salinity for Vibrio spp. habitat [16,17]. In the Northeastern coastal estuaries,
                           the optimal salinity for halophilic species of Vibrio spp. is between 15 and 25‰, while along
                           the southeast United States coast, Vibrio spp. may thrive in salinities as low as 10‰ [18,19].
                           This difference in optimal salinity may be related to regional water temperature and nutrient
                           differences [20]. As SLR occurs and ocean water advances further inland, the formerly
                           freshwater habitats and estuaries will become more saline, expanding optimal Vibrio spp.
                           habitat. Additionally, the predicted climate change related increases in southeastern United
                           States coastal average water temperature will also help Vibrio spp. to thrive. Modeling Vibrio
                           spp. has proved difficult because of varying global environmental conditions and the
                           issues with accounting for all varying conditions. Based on the equation and model
                           used [14,15,19], different concentrations of Vibrio spp. can be calculated for the same
                           estuarine region. Additional discussion of these modeling challenges for the Charleston
                           Harbor region are detailed in Appendix A.

                           Table 1. Salinity range for Vibrio spp. and potential habitat water types.

                                         Water Type                        Salinity Range               Citation
                                        Fresh Water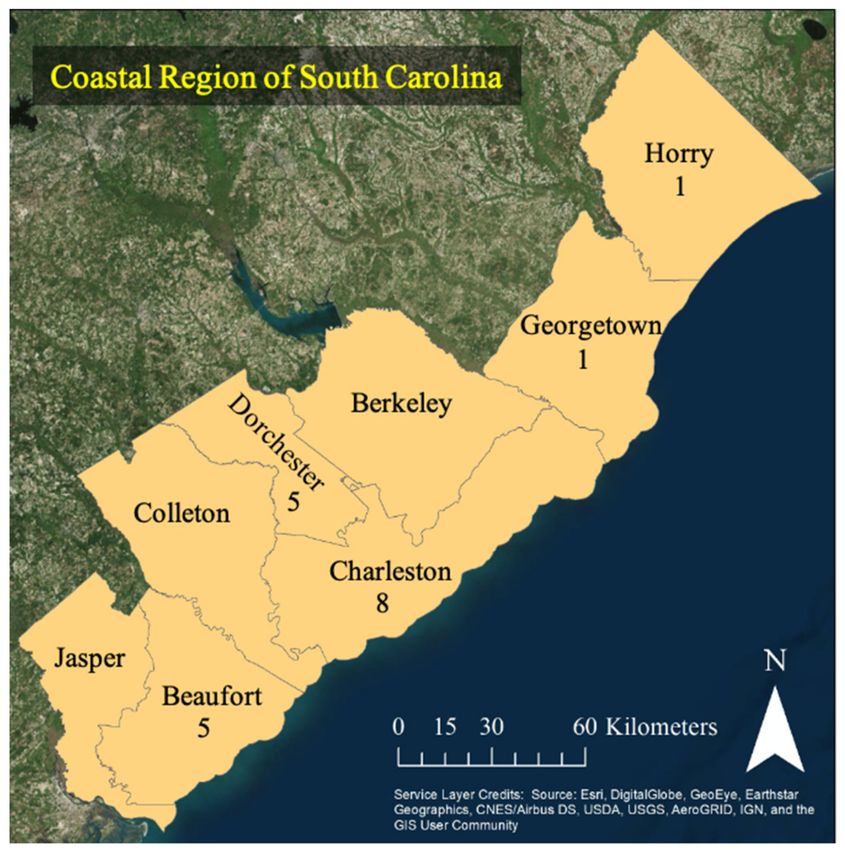
Atmosphere 2021, 12, 269                                                                                               3 of 17

                           Figure 1. Vibriosis cases caused by bacteria Vibrio spp. in the coastal counties of South Carolina
                           (USA) for 2018. Absence of number means no reported cases for the county [26].

                                 The main objective of this manuscript is to determine the areas of coastal South
                           Carolina that are inundated during storm surges and could be at higher risk of Vibrio spp.
                           infections and mortality due to storm surge impacts. This paper models the predicted
                           overlap between potential exposure to Vibrio spp. and denser, vulnerable populations based
                           on age throughout coastal South Carolina utilizing the relative risk assessment model [29].
                           The initial approach involved modeling Vibrio spp. concentrations using Hseih’s salinity
                           and temperature model [15]. However, since insufficient salinity data is available for South
                           Carolina, a more predictive approach was used. The relative risk model approach is used
                           in ecological risk assessment when multiple variables are used with units that do not match
                           well to determine areas most vulnerable to environmental threats. In this paper, extent of
                           flooding and socioeconomic vulnerability were used as the main stressor and vulnerability,
                           respectively. In the context of risk assessment, vulnerability is defined as a function of the
                           potential for adverse effects and the ability to cope [30]. Advanced age has been shown to
                           be a strong correlative metric for Vibrio spp. mortality, while small children under the age
                           of five have greater relative surface area exposed to flood waters, which increases potential
                           exposure to Vibrio spp. [23,24].

                           2. Materials and Methods
                           2.1. Study Area
                                 The geographic focus of this analysis is the eight coastal counties of South Carolina,
                           USA: Horry, Georgetown, Berkeley, Dorchester, Charleston, Colleton, Beaufort, and Jasper,
                           illustrated in Figure 1. These eight counties either border the Atlantic Ocean or are geo-
                           graphically vulnerable to severe flooding from upriver propagation of storm surges and
                           inundation from SLR [13].
                                 Charleston, SC, USA, has an average elevation of 6.10 m (20 ft) above sea level,
                           and lower (~3.05 m (10 ft) elevation) parts of the city bordering the harbor are at risk of
                           flooding with even just 0.30 m (1 ft) of SLR [10]. In addition to flood risk from SLR, the city
                           and watershed also frequently experience heavy rain and flooding from hurricanes and
                           storm surges. For example, in September 2018, Hurricane Florence made landfall in South
                           Carolina and battered the state with heavy rainfall and winds. The highest recorded rainfall
                           was 60.02 cm (23.63 inches) in Loris, SC [31].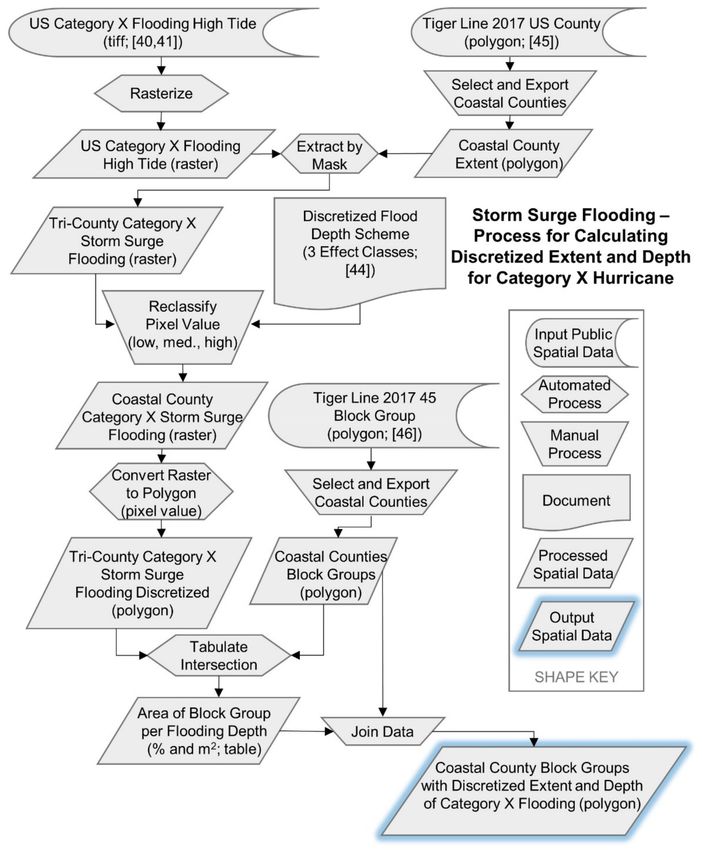
Atmosphere 2021, 12, 269                                                                                                           4 of 17

                                  2.2. Relative Risk Model
                                       Regional risk assessment is an analytical tool used to prioritize management focus on
                                  environmental stresses (i.e., stressors) and their potential impact on endpoints of value (e.g.,
                                  population health, ecological robustness, infrastructure integrity). Landscape scale analysis
                                  of a region must take into account the complexity of the components of the landscape,
                                  such as the human populations, ecological communities, and both the natural and built
                                  infrastructure of the region, thus requiring a method that integrates both across different
                                  units of measure and (often) metrics of different scale. Risk assessment methodology
                                  requires the identification of an endpoint of value (e.g., vulnerable population) and a route
                                  of potential exposure to a stressor (i.e., hazard, e.g., flooding). Next, a conceptual model
                                  is developed to causally link the stressor through exposure to the endpoint. Figure 2 il-
                                  lustrates the causal link between storm surge flooding (i.e., brackish water) and potential
                                  Vibrio spp. exposure for vulnerable populations.

      Figure 2. Conceptual model paralleling the relative risk model components (source, stressor, location, effect, and impact) and
      the pathway between the source of Vibrio spp. and vulnerable exposure conditions and production of Vibriosis infections.

                                        Over the past 20 years, the relative risk model has been applied in ecological, en-
                                  vironmental, and human health risk assessments of physical, chemical, and biological
                                  hazards [32–34]. The relative risk model is based on the assumption that regional risk is a
                                  function of an endpoint of value being exposed, in space and time, to a stressor/hazard and
                                  can incorporate the assessment of multiple levels of impact [35]. For example, a hurricane
                                  introduces both wind shear and precipitation as primary stressors, and then causes a storm
                                  surge as a secondary stressor and compounding effect. Both the precipitation and storm
                                  surge contribute to coastal flooding. The risk is calculated based on potential exposure
                                  to flood waters, stressor magnitude (i.e., inundation extent and depth), and vulnerability
                                  of the endpoint (i.e., human populations more likely to develop Vibriosis due to flood
                                  exposure). When multiple overlapping variables that are characterized by different units
                                  are used in a risk assessment, it can be difficult to calculate the overall risk, which is why
                                  the relative risk model was selected for this analysis.
                                        The first component of the relative risk model is the Stressor Score, the product of the
                                  effect rank and exposure rank, or the depth of flooding and area of inundation, respectively.
                                  The Stressor Score is multiplied by the vulnerability rank, which is based on the percentage
                                  of at-risk population by age. Ranks are used to transform quantitative data into relative
                                  risk rankings based on magnitude of impact. The magnitude of impact is quantified using
                                  a scale from 0 to 6. A relative risk rank of zero is 0, low is 2, medium is 4, and high is
                                  6. Any numerical range can be used so long as it is consistent across stressors, exposure,
                                  effect, and impact, thus making the calculated risk relative to the assessed components.
                                  A detailed explanation of this methodology is provided by Wiegers et al. [34]. The inclusion
                                  of GIS (Geographic Information Systems) analysis allowed us to calculate the relative risk
                                  for individual areas of land on or near the coastline rather than just the entire coast.
                                        For this paper, age-related vulnerability was used to define vulnerability to flooding,
                                  and flooding exposure defined potential exposure to Vibrio spp. Age-related vulnerability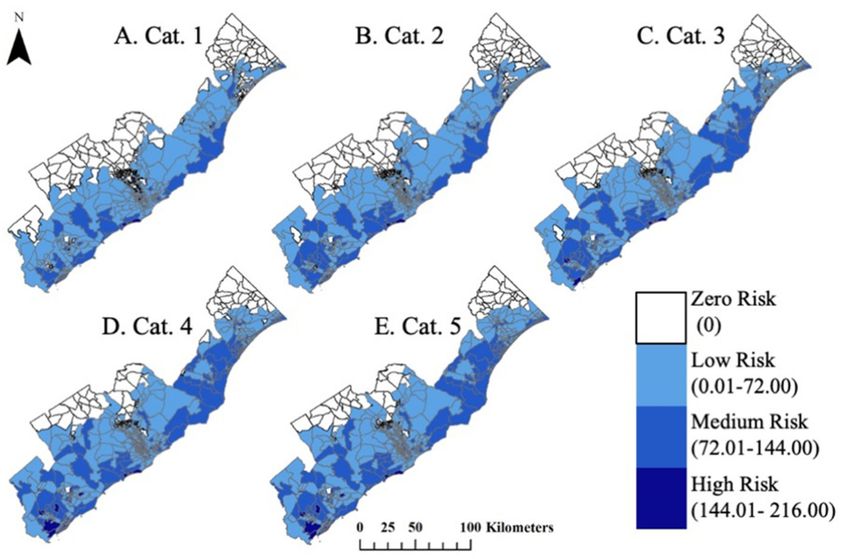
Atmosphere 2021, 12, 269                                                                                          5 of 17

                           and flood exposure were combined to determine risk of dermal exposure to Vibrio spp.
                           Areas where health-related flooding vulnerability (health risk due to Vibrio spp. exposure)
                           and socioeconomic vulnerability as defined by Cutter et al. (Social Vulnerability Index
                           (SoVI) [36]) and Flanagan et al. (Social Vulnerability Index (SVI) [37]) overlap, will also
                           be areas of higher vulnerability to Vibrio spp. infections and adverse health impacts,
                           particularly for subsistence fishers [38]. We assume that hurricane-induced storm surge
                           inundation, which tends to occur in the warmer seasons, produces the appropriate mix of
                           water temperature and salinity to support Vibrio spp. growth, given the known presence of
                           Vibrio spp. in the South Carolina coastal waterways (see Figure 1 and Table A1).

                           2.3. Data Sources
                                Spatial data were analyzed, and maps were created using ArcGIS (ESRI, Redlands,
                           CA, USA) [39]. Storm surge modeling data, updated in 2018, were downloaded from the
                           US National Oceanic and Atmospheric Administration [40,41]. Population distribution by
                           block group for 2018 was gathered for the eight coastal counties of South Carolina from
                           the Census Bureau, where a block group is defined as the next level above a census block,
                           but below a census tract in the geographic hierarchy [42,43]. Flooding-related vulnerability
                           is highly age-dependent because young people (who are short) would have difficulty
                           escaping the water and older people (who are more likely to have reduced physical
                           capabilities) would have more difficulty navigating and escaping the water; therefore,
                           vulnerability was assessed based on the percent of the population in these two age groups:
                           ≤5 years and ≥60 years.

                           2.4. ArcGIS and Relative Risk Model Analysis and Visualization
                                 ArcGIS was used to integrate the data and perform a relative risk analysis [29].
                           Storm surge flooding for each category of hurricane was applied to the eight coastal
                           counties of South Carolina to determine which block groups could potentially be most
                           exposed to Vibrio spp. by surface area of inundated land. Relative population vulnerability
                           is determined by the percent of the populace under 5 (short and less mobile in a flood)
                           and over 60 (weaker and also less mobile in a flood). The “tabulate intersection” function
                           was used to calculate the percent of the block group flooded (“Exposure Rank”) and the
                           percent of flooded area in each depth category per census block group (“Effect Rank”).
                           Exposure Ranks for a given block group were classified as: 0–33% inundation was ranked
                           as 2, 34–66% exposure was ranked as 4, and 67–100% was ranked as 6. The Effect Rank
                           was weighted based on the percent of flooded area in each depth category per census block
                           group (e.g., (66% × 2) + (23% × 4) + (11% × 6) = 2.66). The Effect Ranks were classified
                           as follows: 0–1 ft of flooding was classified as 2 or low risk, 1–2 ft was classified as 4 or
                           medium risk, and 2+ ft was classified as 6 or high risk. Below 1 foot of water pedestrian
                           movement is impeded, between 1 and 2 feet of inundation movement of both pedestrians
                           and motor vehicles are impeded, and above 2 feet of inundation only boats can move
                           readily through the flood waters [44]. Figure 3 is a flowchart illustrating the geographical
                           analysis and integration of the storm surge, block group, and demographic data.
                                 Using the relative risk model approach, the Exposure Rank and Effect Rank were
                           multiplied to calculate the Stressor Score (= Exposure Rank × Effect Rank) per block
                           group [34]. The final Relative Risk Score was calculated by multiplying the Stressor Score
                           and the ranked percent of vulnerable populations. Vulnerable populations (i.e., ≤5 and
                           ≥60) were ranked as follows: 0% vulnerable population was ranked as 0, 0 ≤ x < 34%
                           vulnerable population was ranked as 2, 34 ≤ x < 67% vulnerable population was ranked
                           as 4, and x > 67% was ranked as 6. The final relative risk scores were used to create maps
                           of the geographic distribution of risk to vulnerable populations due to exposure to storm
                           surge flooding as a proxy for Vibrio spp. exposure along the South Carolina, USA, coastline
                           (Maps are included in the Results Section).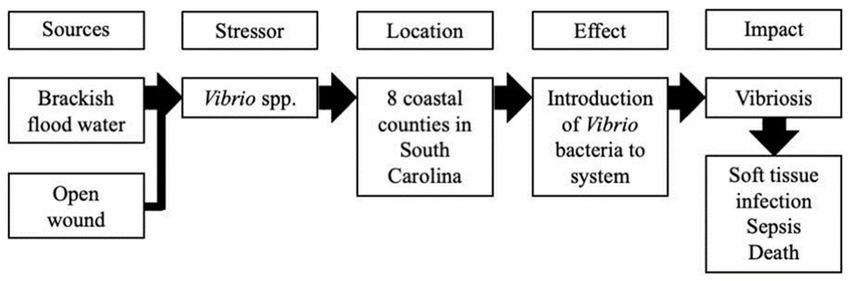
Atmosphere 2021, 12, 269                                                                                                     6 of 17

      Figure 3. Geospatial analysis process for calculating discretized extent and depth of storm surge flooding for any given
      hurricane category for block groups of coastal counties in South Carolina.

                                 3. Results
                                       A typical risk assessment would start with quantifying the amount of the stressor
                                 (in this case Vibrio spp.) to which the vulnerable population is exposed. As a first approach
                                 to quantifying the Vibrio spp. concentrations in flood waters, we estimated the probable
                                 Vibrio spp. concentrations for three estuarine monitoring sites in the Charleston Harbor
                                 watershed based on temperature and salinity since the state monitoring data for Vibrio
                                 spp. in coastal waters is not publicly available. These results are included in Appendix A
                                 (see Figure A1). Evaluating the conditions for Vibrio spp. growth in the South Carolina
                                 coastal waters indicates that summer hydrological conditions are conducive to Vibrio spp.
                                 growth; however, during Hurricane Florence, Vibrio spp. concentrations were likely to de-
                                 crease for the duration of the hurricane but increase shortly after due to water temperature
                                 and salinity fluctuations.
                                       These estimations were not included in the risk assessment because calculations could
                                 only be completed for the three monitoring sites in Charleston Harbor and not the full
                                 coastline. The USGS only provided salinity data for these three sites in South Carolina
Atmosphere 2021, 12, 269 7 of 17
waters. Any other monitoring sites with any indication of ion concentrations only recorded
conductivity rather than salinity. Conductivity records any ionic activity and not just
salinity. The Vibrio spp. model depends on salinity and not on conductivity. The difference
between measured salinity and calculated salinity from conductivity measurements hit 5%
error below approximate 0.5 PSU salinity (see Figure A2).
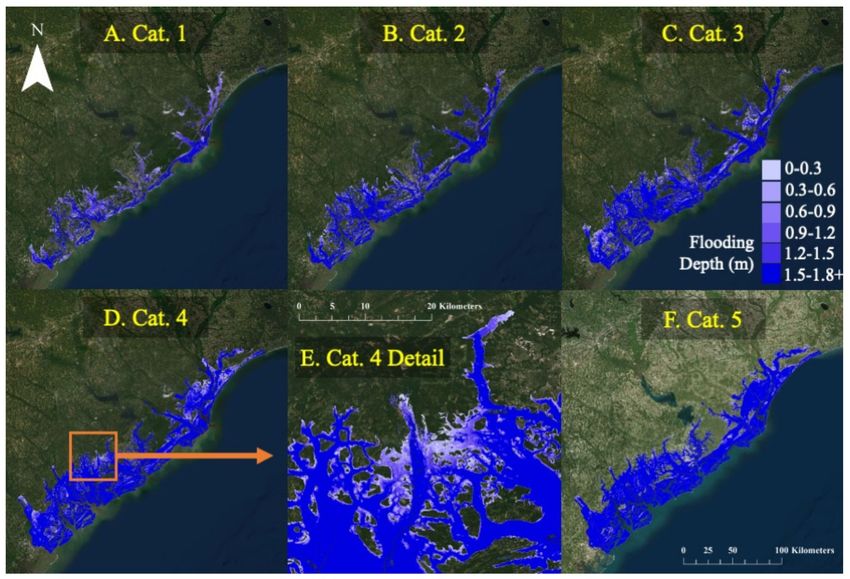
Storm surge flooding according to hurricane intensity was mapped across the eight
South Carolina counties included in this study as the proxy for Vibrio spp. dermal exposure.
Figure 4 illustrates the projected storm surge flooding for the eight coastal counties in South
Carolina based on the US Sea, Lake, and Overland Surges from Hurricanes model data
for Categories 1 through 5 hurricanes [40,41]. The spatial storm surge inundation analysis
(Figure 4) indicates that as storm intensity increases, so will storm surge intensity, causing
further inland flooding. As more clearly visible in the Category 4 close-up map (Figure 4E),
the storm surge flooding gradient rapidly changes from low to high inundation due to the
fact that the South Carolina coastline is a relatively flat (low slope) and low-altitude area
that remains near sea level, hence the regional moniker “The Lowcountry.”
Figure 4. Hurricane-induced storm surge inundation maps of the coastal counties of South Carolina
based on hurricane intensity: Category 1 (A); Category 2 (B); Category 3 (C); Category 4 (D);
Category 5 (F). Map (E) shows a “blow up” of parts of Dorchester and Colleton counties illustrating
the storm surge for a Category 4 storm with greater differentiation visible between the flooding
depth categories. Service Layer Credits: Source: Esri, Maxar, GeoEye, Earthstar Geographics,
CNES/Airbus DS, USDA, USGS, AeroGRID, IGN, and the GIS User Community.
These maps under-represent the maximum modeled flooding depth, which can reach
7.62 m (25 ft) deep around all the rivers and near the coastline for a Category 5 storm.
Inundation depths of ≥1.83 m (6 ft) were aggregated into the same dermal exposure
category because the vast majority of vulnerable people considered in this study are below
1.83 m (6 ft) in height. The average height for a male in SC, USA, is 1.78 m (50 10”) and female
is 1.63 m (50 4”) [45]. Figure 4E visualizes the rapid change in depths from 0.30–1.52 m
(1–5 ft) inundation to ≥1.83 m (6 ft) inundation.
Figure 5 shows the total population age distribution by block group used for analysis
in the eight coastal counties of South Carolina. Denser populations, shown in dark green,
are concentrated around metropolitan areas, Myrtle Beach, Charleston, and Hilton Head.
It is particularly noteworthy that some of the denser populations of citizens over the age
of 60 are close to the coastline. These citizens are more vulnerable to Vibrio spp. exposure
during flooding events and are at risk of adverse effects from subsequent infections due to
decreased mobility, decreased immune efficiency, and thinner skin [23,46–48].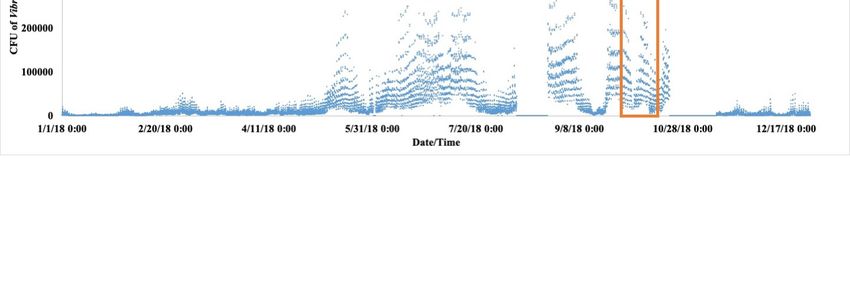
Atmosphere 2021, 12, 269                                                                                                    8 of 17

      Figure 5. Population under 5, over 60, and total population for eight counties of interest in South Carolina, mapped
      by US Census block group [49,50]. Note that the color scale changes for the total population map versus the two sub–
      population graphs.

                                      Figure 6A–E shows areas of overlap between highest concentrations of population
                                vulnerable to flooding and susceptibility to Vibrio spp. infection (i.e., citizens below the
                                age of 5 and above the age of 60). The darker the blue, the higher the relative risk to Vibrio
                                spp. exposure by proxy. High-risk block groups increase in number close to the coastline
                                with hurricane category increases as a result of higher magnitude storm surges associated
                                with the high winds and king tides brought on by the more intense hurricanes. As storm
                                surge inundation increases with hurricane category, the relative risk in inland South
                                Carolina block groups [50] also increases from no risk to low or medium risk until only
                                the furthest inland block groups do not appear vulnerable to storm surge (Figure 6A–E).
                                There are a few outlying block groups in each analysis that have no apparent risk even
                                when surrounding block groups are at low to medium risk. The Census block groups
                                with no vulnerable population have a relative risk of 0 despite the presence of storm surge
                                flooding, as no exposure to vulnerable populations occurs. Without exposure, there is
                                no risk. The Merritt Field (Marine Corps Air Station) in Beaufort County and the 841st
                                Transportation Battalion in Charleston County are locations of zero relative risk due to
                                lack of vulnerable populations, despite being completely surrounded by areas of higher
                                relative risk. These two block groups are white throughout all five categories of hurricane
                                intensity (Figure 6A–E).

                                Figure 6. (A–E) Images A through E illustrate the spatial Relative Risk Model results of hurricane-
                                induced storm-surge flood risk for the more vulnerable younger (60 years)
                                populations of the eight coastal South Carolina counties, mapped by US Census block group [49,50].
Atmosphere 2021, 12, 269 9 of 17
We know that changes in risk in each block group are a direct result of changes in
hurricane intensity and resulting storm surge because the vulnerable population by block
group remains static for the year analyzed. Other block groups with no risk during low-
intensity hurricanes due to minimal encroachment of storm surges have the potential to
become low- to high-risk as hurricane intensity increases. Block groups to the north and
south of Charleston County have the highest increase in relative risk, as we see some block
groups in neighboring counties going from low-risk to high-risk and some going from no
risk to medium-risk. The block groups with the greatest changes in risk in Figure 6A–E
align with areas of greatest increase in storm surge depth and area in Figure 4A–E.
4. Discussion
This relative risk assessment is based on vulnerable population (age-related) and depth
and extent of hurricane-induced storm surge flooding and illustrates both the potential risk
for Vibriosis for the population of the coastal South Carolina region and the need for further
studies on the risk from Vibrio spp. exposure posed to coastal communities. The relative
risk in this region will increase with the predicted intensification of Atlantic hurricanes and
coastal flooding due to climate change. In addition, the coastal South Carolina population
is both increasing and aging [51,52]. Inland block groups within coastal South Carolina
counties currently at zero to no risk may remain at low risk of flooding and therefore low
risk of Vibrio spp. exposure due to a lack of inland propagation storm surges. However,
the modeled storm surge flooding data used in the relative risk analysis did not include
sea level rise (SLR) in its calculation, meaning the full extent of climate change effects is not
captured in this analysis. Over the period of 1920 to the present, global SLR has increased
approximately 18 cm (7 inches [1]), while “nuisance flooding” in Charleston has increased
from rare (none to a few times a year in 1920) by at least an order of magnitude [53,54].
In 2019, for example, Charleston experienced 77 days of nuisance flood events [55].
The distinction between no risk due to no vulnerable population and no risk due
to no storm surge flooding is important because as sea levels rise due to climate change,
storm surges will intensify and propagate further inland, exposing more block groups
to Vibrio spp. This risk will likely increase from no risk to low/medium risk in the block
groups with vulnerable populations, and block groups already at risk will likely experience
increased risk. This exacerbates the risk of Vibrio spp. exposure on inland vulnerable
populations that may need to wade through storm surges to escape dangerous flooding
at risk where they previously were not at risk. Other social determinants of health like
occupation and income can also affect vulnerability to Vibrio spp. and could be used in
future analysis [37].
The South Carolina coastline on the Atlantic Ocean is a popular vacation destination
for many Americans, so there are many state parks along the coastline, including the
Edisto Beach State Park and the Huntington Beach State Park [56]. These state parks may
contribute to the lack of population in multiple coastal block groups. In addition to state
parks, the Waccamaw National Wildlife Refuge, Francis Marion National Forest, and 841st
Trans Battalion in Charleston are all areas with little to no population that would affect
the relative risk calculations. The block groups with no vulnerable populations due to the
presence of state parks, wildlife refuges, and military facilities would be more likely to
have increased vulnerable populations if the land uses change.
Flooding is used as a proxy for Vibrio spp. exposure and infection in this analysis,
so civilians most vulnerable to both flooding and infection are considered at risk. Children
under five are very vulnerable to flooding because even at a low-depth floodwaters can be
incredibly hazardous to them. A greater surface area of a child’s skin will be exposed to
bacterial infection in a lower depth than will be exposed for an adult. Adults over 60 are at
greater risk of more severe Vibriosis infections leading to complications such as septicemia
and death. Older adults also have thinner, more fragile skin and are more vulnerable to
having pre-existing or concurrent wounds when wading through floodwater. In addition,
adults over the age of 60 have a higher population prevalence of comorbidities like liverAtmosphere 2021, 12, 269 10 of 17
and heart disease. While underlying health conditions can enable a worse outcome for
Vibrio spp. infections, health of an individual cannot totally predict clinical outcome, so not
all vulnerable populations were included in this study [46,57].
The South Carolina USA population over the age of 60 is expected to more than double
by the year 2030, as projected by the South Carolina Revenue and Fiscal Affairs Office.
In addition, the population has more than doubled since 1970 (2,590,516 to 5,148,714),
with a majority of the change coming from the 60 and older age group [52]. An aging
population experiencing increased relative risk of exposure to Vibrio spp. by flooding
proxy will both place greater strain on the healthcare system and negatively impact the
population itself.
Vibrio spp. concentrations are projected to increase to as much as four times the levels
they are now in already hospitable areas such as South Carolina [14]. An interesting trend
observed in this research was that while many different environments lining coastlines
are hospitable to Vibrio spp., some models developed in specific regional climates cannot
be extrapolated to other climates. For example, the model developed by Lanerolle in the
Chesapeake Bay area was used initially in this analysis, and every output predicted a
greater than 99.9% probable presence of Vibrio spp. using Charleston Harbor water quality
data as the input [58]. While some models can be extrapolated, like the model used by
the European Centre for Disease Prevention and Control (ECDC) for forecasting global
suitability for Vibrio spp., many models are geographically specified and cannot be used
for extrapolation, thus increasing the need for further studies on Vibrio spp. exposure
and infection.
As climate change and rising sea levels expose more vulnerable populations to Vib-
rio spp., the conditions for Vibrio spp. growth and survival also become more favorable.
Impending SLR is an important factor to consider in Vibrio spp. exposure and risk mod-
els. SLR was not quantified in this study because the US National Hurricane Center’s
National Storm Surge Hazards Maps did not include projected sea level rise. The modeling
capabilities needed for such an integrated analysis were beyond the scope of this paper.
In recently published First Street Foundation data, storm surge, precipitation, and SLR
are incorporated into the same model and produced a dataset that encompasses more the
flood factors associated with climate change [59]. Future collaborations with First Street
Foundation’s Flood Lab could provide the additional information needed to model the
Vibrio spp. concentrations inclusive of climate change compounded flooding.
The influence of SLR on local Vibrio spp. concentrations may be variable due to local
geophysical differences and variability in weather patterns. In South Carolina, higher ocean
temperatures, rising sea levels, and more severe hurricanes will drive the warm brackish
waters that sustain Vibrio spp. populations further inland. However, this phenomenon
depends on salinity. Heavy inland precipitation during hurricanes can result in freshwater
being driven out to the sea through the river system, thus temporarily reducing both
salinity and viable Vibrio spp. concentrations in the estuaries and along the coasts [14,60–62].
The current analysis utilized a relative risk approach in large part because salinity data for
the South Carolina coastal watershed is extremely limited. This weather driven change in
salinity affecting Vibrio spp. concentrations could be modeled if salinity was monitored
consistently along the coast.
While the lack of dose-response curves for dermal exposure to Vibrio spp. limits
the specificity of this risk assessment, a relative risk assessment identifying areas of high
vulnerability and potential risk can be achieved. Epidemiological monitoring is currently
problematic given that by the time people present with Vibriosis, the sources and concen-
trations of exposure can no longer be definitely identified. In a typical human health risk
assessment, a dose-response curve is used to quantify the probable health effects posed
to humans from exposure to the stressor of interest. The lack of Vibrio spp. dose-response
curves limits the effectiveness of this research in translating the concentration of Vibrio spp.
in floodwaters to human health risk for vulnerable populations. Possible approaches to
developing dose-response data include human studies, animal studies, or meta-analysis.Atmosphere 2021, 12, 269 11 of 17
However, due to ethical considerations about the severity of Vibrio spp. infections, both hu-
man and animal studies are not recommended. Meta-analysis of global cases of Vibrio
spp. exposure and infection is the preferred method of developing exposure-response
curves. For any future meta-analysis, consistent Vibrio spp. monitoring alongside existing
Escherichia coli and Vibrio cholerae monitoring will be essential. Public health officials in
susceptible regions (e.g., warm coastal waters) should develop a mandatory, ongoing,
standardized Vibrio spp. monitoring system due to the potentially severe health impacts
of Vibrio spp. growth. Monitoring should be paired with a global warning system as is
currently used for E. coli contamination, harmful algal blooms, and severe air pollution.
5. Conclusions
Climate change is adversely affecting human health, in part by increasing the vi-
able habitat for disease pathogen growth, contributing to greater frequency of disease
transmission [63]. The results of this study indicate that coastal census block groups with
dense vulnerable sub-populations exposed to storm surge have the highest relative risk,
while most inland block groups away from riverine-mediated storm surge have the lowest
relative risk. The higher risk for densely populated coastal areas is driven by vulnerability,
while the risk for less populated areas is lower due to a lack of exposure. The pathogenic
Vibrio species are a noted public health concern in the recent Lancet Countdown Report
on Health and Climate Change [63]. As climate and weather conditions in South Carolina
create more hospitable estuarine conditions for Vibrio spp. and increase the range and
concentrations of the bacteria, more people (and seafood) will become infected.
Public health and environmental managers will need to develop new management
strategies to prevent these negative public health externalities of climate change. As Vibrio-
sis infections may be extremely severe or even deadly (35% mortality rate after developing
septicemia [23,24]), the best methods of infection control will be regular standardized
coastal and estuarine water monitoring for Vibrio spp. to enable more informed and timely
public health advisories and help prevent future exposure.
Prevention requires providing the public with information before or as exposure poten-
tial increases and needs to include actionable advice to be most effective [64]. The European
Centre for Disease Prevention and Control (ECDC) Vibrio Map Viewer Geoportal provides
near real-time (up through the day before) and predictive (five-day forecast) estimates of
Vibrio spp. risk based on remotely sensed sea surface temperature and sea surface salinity
using a model standardized to the Baltic Sea [65–68]. As indicated in the description about
the Vibrio Map Viewer, this system can only be used for prediction of Vibrio spp. in regions
for which the Vibrio spp. growth model has been standardized.
The US Centers for Disease Control and Prevention (US CDC) tracks waterborne Vibrio
spp. infections using the Cholera and Other Vibrio Illness Surveillance (COVIS) system [69],
the National Notifiable Diseases Surveillance System (NNDSS) [70], and the Top of Form.
National Outbreak Reporting System (NORS) [71]. None of the US surveillance
systems for Vibrio spp. provide up to date information and cannot be used as the basis
for a warning or prevention system, like the ECDC Vibrio Map Viewer. We recommend
that the US CDC fund studies to standardize Vibrio spp. growth models based on remotely
sensed sea surface temperature and salinity data normalized to salinity monitoring data,
and either feed that model to the ECDC Vibrio Map Viewer or create a similar Vibrio Map
Viewer calibrated to U.S. water conditions.
Author Contributions: A.M.F. was the primary author, primary researcher, and primary producer of
figures and graphs. A.M.F. and M.G.C. conceptualized the project. M.G.C. was the direct supervisor
for data acquisition and analysis, ArcGIS analysis and map production, produced some figures,
and was a co-editor. D.S.H. was the direct supervisor for writing, was the research consultant,
produced one graph, and was a co-editor. All authors have read and agreed to the published version
of the manuscript.
Funding: This research received no external funding.Atmosphere 2021, 12, 269 12 of 17
Institutional Review Board Statement: Not applicable.
Informed Consent Statement: Not applicable.
Data Availability Statement: The input data for this study are all publicly available through the
links provided in the references.
Acknowledgments: The authors thank Madison Howell and Kate Zhang for advice, suggestions,
and support. The authors also appreciate the reviewers’ comments; addressing the comments
strengthened the paper. Maps throughout this article were created using ArcGIS® software by
Esri. ArcGIS® and ArcMap™ are the intellectual property of Esri and are used herein under license.
Copyright © Esri. All rights reserved. For more information about Esri® software, please visit
www.esri.com.
Conflicts of Interest: The authors declare no conflict of interest.
Appendix A
Vibrio spp. concentration calculations for three USGS water monitoring sites in
Charleston Harbor watershed (Charleston, South Carolina, USA).
Appendix A.1 Methods
Data were collected from USGS hydrologic unit codes (HUC) 021720709 (1) and
021720710 (2) in watershed 03050201 (HUC name “Cooper”), and 02172053 (3) in water-
shed 03050202 (HUC name “South Carolina Coastal”). Climate-related water data (2018;
15-min intervals) used to model the Vibrio spp. concentrations were downloaded from the
United States Geological Survey (USGS) website on water quality [17].
Vibrio spp. concentrations were estimated using the concentration prediction equations
based on water temperature and salinity derived by Hsieh et al. [15] applying water
temperature and salinity data from 2018 for Charleston, SC [17]. The Hseih model coastal
data was built on North Carolina coastal data, and no model for all Vibrio spp. is available
for South Carolina. The following equation was used to predict Vibrio spp. concentrations:
−log (Vibrio spp.) Colony Forming Units [CFUs] = −0.304 + (0.116 × S) + (0.0739 * T) (A1)
where S = Salinity (ppm) and T = Temperature (◦ C)
USGS site data from within the Charleston Harbor Watershed were selected because
the datasets included temperature and salinity profiles for the full year. The year chosen
(2018) had two intense weather events that led to severe flooding (Hurricane Florence and
Hurricane Michael), and two less severe flooding events, according to the US National
Weather Service Significant Weather Archive [72]. For this analysis, only the month in
which Hurricane Florence landed (September) was analyzed in detail. The temperature and
salinity data were applied to the Hsieh model to estimate the predicted Vibrio spp. CFUs for
the full year and for the two weeks before and after Hurricane Florence (see Figure A1).
As the USGS reported data for every 15 min during and after the storm event, our model
predicted Vibrio concentrations every 15 min, which were plotted as time vs. Colony
Forming Units (CFUs).
A.2. Results
Figure A1 shows example Vibrio spp. concentrations calculated every 15 min for the
full year for site 1 (021720709). The insets in the upper right corner of the graph detail
the period in 2018 during which Hurricane Florence made landfall in South Carolina
(28 September 2018 to 18 October 2018). Hurricane Florence dynamically altered both the
temperature and the salinity at each site, altering the predicted Vibrio spp. concentrations
for up to a week before landfall and up to two weeks after moving on for the more
central harbor site. Predicted Vibrio spp. concentrations changed within three days of
Hurricane Florence landfall for the edge of the harbor and the up-river sites (data not
shown) which are not as directly influenced by the ocean currents as is the central harbor.
After Hurricane Florence made landfall, the central harbor site returned to pre-hurricaneAtmosphere 2021, 12, 269 13 of 17
Atmosphere 2021, 12, 269 14 of 19
Vibrio spp. concentration conditions faster than the edge of the harbor and the up-river
sites, up to three weeks after Hurricane Florence moved inland.
Site 1 (021720709; central harbor) shows high predicted Vibrio spp. concentrations
in the summer, with peak concentration on 14 July at 497,348 CFUs/100 mL (Figure A1).
The effects of Hurricane Florence appear to be a sharp decrease in predicted Vibrio spp.
concentrations seen at the times leading up to and where Hurricane Florence made landfall.
The predicted concentrations of Vibrio spp. then increased afterwards.
Figure A1. Calculated Vibrio spp. concentrations for site 021720709 CFUs/100 mL for 2018 including Hurricane Florence
(top right corner inset, (B)). (A) Calculated Vibrio spp. concentrations (in CFUs) for site 021720709 for all of 2018. Each point
represents a 15-min detection window. (B) Calculated Vibrio spp. concentrations (in CFUs) for site 021720709 for the period
during and after Hurricane Florence. The time window for (B) is indicated in (A) by the red box.
The USGS water monitoring program does not consistently measure all of the same
Figure A1. Calculated Vibrio spp. concentrations
metrics at all of the for site 021720709
sites. Salinity CFUs/100 mL for 2018 including
data is particularly sparseHurricane FlorenceSouth Car-
for the USGS
(top right corner inset, (B)). (A) Calculated Vibrio spp. concentrations (in CFUs) for site 021720709 for all of 2018. Each
olina water quality data, having been measured only for three sites in the Charleston
point represents a 15-min detection window. (B) Calculated Vibrio spp. concentrations (in CFUs) for site 021720709 for the
period during and after Harbor
Hurricanewatershed. Conductivity,
Florence. The time window for (B)however, isinmeasured
is indicated at box.
(A) by the red most South Carolina water
monitoring sites.
The USGS water monitoring program does not consistently measure all of the same
metrics at all of the sites. Salinity data is particularly sparse for the USGS South Carolina
water quality data, having been measured only for three sites in the Charleston Harbor
watershed. Conductivity, however, is measured at most South Carolina water monitoring
sites.
Figure A2. Plot of measured salinity against the percent error of salinity calculated from conductivity compared to the
salinity directly measured at the same site (site 021720709) at the same time. Percent error is the difference between measured
salinity and calculated salinity divided by the measured salinity. Data for conductivity and salinity were measured every
hour throughout 2018. The full 2018 hourly dataset was used for this analysis.Atmosphere 2021, 12, 269 14 of 17
Optimal growth conditions for Vibrio spp. in water seem to be based specifically
on salinity, and not on all of the ions that might be assessed in conductivity measure-
ments [15,16]. In order to calculate Vibrio spp. concentrations from salinity and tempera-
ture, conductivity needs to be converted to salinity because most USGS water monitoring
sites in South Carolina record conductivity but not salinity. We calculated salinity from
conductivity for a site for which we had co-collected salinity and conductivity data using
the equation used for Practical Salinity Scale of 1978 and then compared the calculated
against measured values (Figure A2). Details about the development and parameterization
of the equation are documented in Lewis [73]. The generic equation to calculate salinity
from conductivity is as follows:
S(‰) = a0 + a1 K15 1/2 + a2 K15 + a3K15 3/2 + a4 K15 2 + a5 K15 5/2 (A2)
To assess the appropriateness of using the calculated salinity (Equation (A2)) for a
classical dose-response-based risk assessment, we determined the accuracy of the calculated
salinity by comparing the calculated salinity against the measured salinity for a single
monitoring site in Charleston Harbor, SC, USA, using all of the data collected hourly over
a single year (n = 4990 data points). The percent error for calculated salinity exceeds 5%
at salinities below approximately 0.5 PSU. As the salinity decreases below this inflection
point (~0.5 PSU), the percent error exponentially increases. As the estuarine salinity
concentrations were less than 0.5 PSU for approximately a third of the measurements,
we determined that using salinity calculated from conductivity would not be accurate
enough to use in classic risk assessment models.
Appendix B
Recorded Vibriosis cases in South Carolina, USA for 2018.
Table A1. The following data on confirmed Vibriosis cases were collected by the CDC’s COVIS
monitoring program and obtained via personal communication from Claire Youngblood and Marya
Barker [26]. The cases are for the year 2018: the eight coastal or near-coastal counties included in this
analysis typically comprise over half of the total cases of Vibriosis in South Carolina.
County Cases 2014 Cases 2015 Cases 2016 Cases 2017 Cases 2018
Beaufort 3 2 5 4 5
Berkeley 0 0 2 1 0
Charleston 6 1 6 9 8
Colleton 0 0 1 1 0
Dorchester 0 0 1 3 5
Georgetown 0 0 0 1 1
Horry 3 3 1 2 1
Jasper 1 1 0 0 0
8 County Totals 13 7 16 21 20
South Carolina Totals 18 11 22 37 39
Percent of SC Cases 72% 64% 73% 57% 51%
References
1. Lindsey, R. Arizona Energy: News 2017. Available online: http://arizonaenergy.org/News_17/News_Sep17/ClimateChangeGl
obalSeaLevel.html (accessed on 25 October 2020).
2. The National Aeronautics and Space Administration (NASA): Global Climate Change 2020 August. Available online: https://cl
imate.nasa.gov/vital-signs/sea-level/#:~{}:text=Sea%20level%20rise%20is%20caused,of%20seawater%20as%20it%20warms (ac-
cessed on 29 December 2020).
3. Mitchell, J.K.; Ericksen, N.J. Effects of Climate Change on Weather-Related Disasters. In Confronting Climate Change: Risks,
Implications and Responses; Cambridge University Press: Cambridge, UK, 1992; pp. 141–151.Atmosphere 2021, 12, 269 15 of 17
4. Church, J.A.; Clark, P.U.; Cazenave, A.; Gregory, J.M.; Jevrejeva, S.; Levermann, A.; Merrifield, M.A.; Milne, G.A.; Nerem, R.S.;
Nunn, P.D.; et al. Sea Level Change. In Climate Change 2013: The Physical Science Basis; Cambridge University Press: Cambridge,
UK, 2013.
5. Ivers, L.C.; Ryan, E.T. Infectious diseases of severe weather-related and flood-related natural disasters. Curr. Opin. Infect. Dis.
2006, 19, 408–414. [CrossRef]
6. McMichael, A.J. Extreme weather events and infectious disease outbreaks. Virulence 2015, 6, 543–547. [CrossRef] [PubMed]
7. Hirabayashi, Y.; Mahendran, R.; Koirala, S.; Konoshima, L.; Yamazaki, D.; Watanabe, S.; Kim, H.; Kanae, S. Global flood risk
under climate change. Nat. Clim. Chang. 2013, 3, 816–821. [CrossRef]
8. Li, X.; Yan, D.; Wang, K.; Weng, B.; Qin, T.; Liu, S. Flood Risk Assessment of Global Watersheds Based on Multiple Machine
Learning Models. Water 2019, 11, 1654. [CrossRef]
9. (FSF) First Street Foundation Flood Factor: Flood Risk is increasing for South Carolina 2020. Available online: https://floodfactor
.com/state/southcarolina/45_fsid (accessed on 12 November 2020).
10. Strauss, B.; Tebaldi, C.; Kulp, S.; Cutter, S.; Emrich, C.; Rizza, D.; Yawitz, D. South Carolina and the Surging Sea: A Vulnerability
Assessment with Projections for Sea Level Rise and Coastal Flood Risk. Climate Central Research Report. 2020. Available online: ht
tps://riskfinder.climatecentral.org/api/reports/state/south-carolina.us/state-report?lang=en (accessed on 12 November 2020).
11. Elsner, J.B. Evidence in support of the climate change–Atlantic hurricane hypothesis. Geophys. Res. Lett. 2006, 33. [CrossRef]
12. Kossin, J.P.; Hall, T.; Knutson, T.; Kunkel, K.E.; Trapp, R.J.; Waliser, D.E.; Wehner, M.F. Extreme storms. In Climate Science
Special Report: Fourth National Climate Assessment; U.S. Global Change Research Program: Washington, DC, USA, 2017; Volume I,
pp. 257–276. [CrossRef]
13. Intergovernmental Panel on Climate Change (IPCC). Climate Change 2007: Synthesis Report. Contribution of Working Groups I, II and
III to the Fourth Assessment Report of the Intergovernmental Panel on Climate Change; IPCC: Geneva, Switzerland, 2007; Available
online: https://www.ipcc.ch/report/ar4/syr/ (accessed on 12 November 2020).
14. Deeb, R.; Tufford, D.; Scott, G.I.; Moore, J.G.; Dow, K. Impact of climate change on Vibrio vulnificus abundance and exposure risk.
Estuaries Coast. 2018, 41, 2289–2303. [CrossRef]
15. Hsieh, J.L.; Fries, J.S.; Noble, R.T. Dynamics and predictive modelling of Vibrio spp. in the Neuse River Estuary, North Carolina,
USA. Environ. Microbiol. 2008, 10, 57–64. [CrossRef] [PubMed]
16. Randa, M.A.; Polz, M.F.; Lim, E. Effects of temperature and salinity on Vibrio vulnificus population dynamics as assessed by
quantitative PCR. Appl. Environ. Microbiol. 2004, 70, 5469–5476. [CrossRef] [PubMed]
17. United States Geological Survey (USGS). USGS Water–Quality Historical Instantaneous Data for South Carolina: Build Time
Series. National Water Information System: Web Interface. 2020. Available online: https://waterdata.usgs.gov/sc/nwis/uv/?ref
erred_module=qw (accessed on 12 November 2020).
18. Horseman, M.A.; Surani, S. A comprehensive review of Vibrio vulnificus: An important cause of severe sepsis and skin and
soft–tissue infection. Int. J. Infect. Dis. 2011, 15, 157–166. [CrossRef]
19. Jacobs, J.M.; Rhodes, M.; Brown, C.W.; Hood, R.R.; Leight, A.; Long, W.; Wood, R. Modeling and forecasting the distribution of
Vibrio vulnificus in Chesapeake Bay. J. Appl. Microbiol. 2014, 117, 1312–1327. [CrossRef]
20. Johnson, C.N.; Bowers, J.C.; Griffittt, K.J.; Molina, V.; Clostio, R.W.; Pei, S.; Laws, E.; Paranjpye, R.N.; Strom, M.S.; Chen, A.; et al.
Ecology of Vibrio parahaemolyticus and Vibrio vulnificus in the coastal and estuarine waters of Louisiana, Maryland, Mississippi,
and Washington (United States). Appl. Environ. Microbiol. 2012, 78, 7249–7257. [CrossRef] [PubMed]
21. Ohrel, R.L., Jr.; Register, K.M. Volunteer Estuary Monitoring: A Methods Manual, 2nd Ed. 2007. Available online: https:
//www.epa.gov/sites/production/files/2015-09/documents/2007_04_09_estuaries_monitoruments_manual.pdf (accessed on
12 November 2020).
22. Baker-Austin, C.; Stockley, L.; Rangdale, R.; Martinez-Urtaza, J. Environmental occurrence and clinical impact of Vibrio vulnificus
and Vibrio parahaemolyticus: A European perspective. Environ. Microbiol. Rep. 2010, 2, 7–18. [CrossRef] [PubMed]
23. Oliver, J.D. Wound infections caused by Vibrio vulnificus and other marine bacteria. Epidemiol. Infect. 2005, 133, 383–391. [CrossRef]
[PubMed]
24. Dechet, A.M.; Yu, P.A.; Koram, N.; Painter, J. Nonfoodborne Vibrio infections: An important cause of morbidity and mortality in
the United States, 1997–2006. Clin. Infect. Dis. 2008, 46, 970–976. [CrossRef]
25. United States Centers for Disease Control and Prevention. Cholera and Other Vibrio Illness Surveillance (COVIS): COVIS Annual
Summaries on Human Vibrio Cases Reported to CDC, 1997–2014. 2019. Available online: https://www.cdc.gov/vibrio/surveilla
nce.html (accessed on 12 November 2020).
26. Youngblood, C.; Barker, M.; (South Carolina Department of Health and Environmental Control, 2100 Bull Street, Columbia, SC,
USA). Personal communication, 2019.
27. European Centre for Disease Prevention and Control. ECDC Geoportal: Vibrio Map Viewer. 2020. Available online: https:
//geoportal.ecdc.europa.eu/vibriomapviewer/ (accessed on 12 November 2020).
28. United States National Oceanic and Atmospheric Administration Tropical Cyclone Climatology. National Hurricane Center and
Central Pacific Hurricane Center. 2020. Available online: https://www.nhc.noaa.gov/climo/ (accessed on 29 December 2020).
29. Landis, W.G.; Wiegers, J.A. Design considerations and a suggested approach for regional and comparative ecological risk
assessment. Hum. Ecol. Risk Assess. 1997, 3, 287–297. [CrossRef]
30. Kumpulainen, S. Vulnerability concepts in hazard and risk assessment. Geol. Surv. Finl. 2006, 42, 65.Atmosphere 2021, 12, 269 16 of 17
31. Feaster, T.D.; Weaver, J.C.; Gotvald, A.J.; Kolb, K.R. Preliminary peak stage and streamflow data for selected US Geological Survey
stream gaging stations in North and South Carolina for flooding following Hurricane Florence, September 2018 (No. 2018–1172).
US Geol. Surv. 2018, 9. [CrossRef]
32. Landis, W.G.; Ayre, K.K.; Johns, A.F.; Summers, H.M.; Stinson, J.; Harris, M.J.; Herring, C.E.; Markiewicz, A.J. The multiple
stressor ecological risk assessment for the mercury-contaminated South River and upper Shenandoah River using the Bayesian
network-relative risk model. Integr. Environ. Assess. Manag. 2017, 13, 85–99. [CrossRef]
33. Hines, E.E.; Landis, W.G. Regional risk assessment of the Puyallup River Watershed and the evaluation of low impact development
in meeting management goals. Integr. Environ. Assess. Manag. 2014, 10, 269–278. [CrossRef] [PubMed]
34. Wiegers, J.K.; Feder, H.M.; Mortensen, L.S.; Shaw, D.G.; Wilson, V.J.; Landis, W.G. A regional multiple–stressor rank–based
ecological risk assessment for the fjord of Port Valdez, Alaska. Hum. Ecol. Risk Assess. 1998, 4, 1125–1173. [CrossRef]
35. Landis, W.G.; Wiegers, J.K. Introduction to the regional risk assessment using the relative risk model. In Regional Scale Ecological
Risk Assessment–Using the Relative Risk Model; CRC Press: Boca Raton, FL, USA, 2005; pp. 11–36.
36. Cutter, S.L.; Boruff, B.J.; Shirley, W.L. Social vulnerability to environmental hazards. Soc. Sci. Q. 2003, 84, 242–261. [CrossRef]
37. Flanagan, B.E.; Gregory, E.W.; Hallisey, E.J.; Heitgerd, J.L.; Lewis, B. A social vulnerability index for disaster management.
J. Homel. Secur. Emerg. Manag. 2011, 8, 3. [CrossRef]
38. World Fisheries Trust: Subsistence Fishing. Available online: http://www.worldfish.org/GCI/gci_assets_moz/Fact%20Card%2
0-%20Subsistence%20Fishing.pdf (accessed on 12 November 2020).
39. Environmental Systems Research Institute (ESRI). ArcGIS Desktop: Release 10; Environmental Systems Research Institute: Redlands,
CA, USA, 2011.
40. Zachry, B.C.; Booth, W.J.; Rhome, J.R.; Sharon, T.M. A national view of storm surge risk and inundation. Weather Clim. Soc. 2015,
7, 109–117. [CrossRef]
41. United States National Oceanic and Atmospheric Administration: National Storm Surge Hazards Maps Version 2—Texas
to Maine. US National Hurricane Center, 2019. Available online: https://www.nhc.noaa.gov/nationalsurge/ (accessed on
29 December 2020).
42. United States Census Bureau. Geographic Areas Reference Manual; US Dept. of Commerce, Economics and Statistics Administration,
Bureau of the Census: Suitland, MA, USA, 1994.
43. United States Census Bureau. American Community Survey 5–Year Estimates, Table B01003; Generated by Alexandra Frank;
Using Data.Census.Gov. 2018. Available online: https://data.census.gov/cedsci/ (accessed on 6 April 2020).
44. Knapp, L.; Levine, N.S. Developing High–Resolution Data and Neighborhood–Scale Flood Modeling in Charleston County, SC.
2019. Available online: https://gacoast.uga.edu/wp-content/uploads/2019/07/05-Knapp-CPASW19-ThursSession07-Neigh
borhoodFloods.pdf (accessed on 15 December 2020).
45. World Population Review: US States. Available online: https://worldpopulationreview.com/state-rankings/average-height-by
-state (accessed on 5 December 2020).
46. Gerba, C.P.; Rose, J.B.; Haas, C.N. Sensitive populations: Who is at the greatest risk? Int. J. Food Microbiol. 1996, 30, 113–123.
[CrossRef]
47. Bukvic, A.; Gohlke, J.; Borate, A.; Suggs, J. Aging in flood–prone coastal areas: Discerning the health and well–being risk for
older residents. Int. J. Environ. Res. Public Health 2018, 15, 2900. [CrossRef]
48. Lee, H.K.; Hong, W.H.; Lee, Y.H. Experimental study on the influence of water depth on the evacuation speed of elderly people
in flood conditions. Int. J. Disaster Risk Reduct. 2019, 39, 101198. [CrossRef]
49. United States Census Bureau. TIGER/Line® Shapefiles: Counties (and Equivalent), 2018. Available online: https://ww
w.census.gov/cgi--bin/geo/shapefiles/index.php?year=2018&layergroup=Counties+%28and+equivalent%29 (accessed on
5 December 2020).
50. United States Census Bureau. TIGER/Line® Shapefiles: Block Groups—South Carolina, 2018. Available online: https://www.ce
nsus.gov/cgi--bin/geo/shapefiles/index.php?year=2018&layergroup=Block+Groups (accessed on 5 December 2020).
51. Williams, E. People Moving from Other States Made SC 6th–Fastest–Growing as US Birth Rates Slow. The Post and Courier, 2019.
Available online: https://www.postandcourier.com/business/real_estate/people-moving-from-other-states-made-sc-6th-fa
stest-growing-as-us-birth-rates-slow/article_c9af2b82-2b2b-11ea-8097-23a834338579.html (accessed on 29 December 2020).
52. South Carolina Association of Counties. Available online: https://www.sccounties.org/sites/default/files/uploads/services/ed
ucation-and-training/planning-and-zoning-education/051419_webcast/south_carolinas_changing_demographics_sc_assoc
_of_counties_5--14--19.pdf (accessed on 5 December 2020).
53. National Ocean Service: What Is High Tide Flooding? Available online: https://oceanservice.noaa.gov/facts/nuisance-flooding.
html (accessed on 29 December 2020).
54. Runkle, J.; Kunkel, K.; Stevens, L.; Frankson, R.; Stewart, B.; Sweet, W. South Carolina State Climate Summary. NOAA Technical
Report NESDIS 2017. Available online: https://statesummaries.ncics.org/chapter/sc/ (accessed on 29 December 2020).
55. Morris, J.T.; Renken, K.A. Past, present, and future nuisance flooding on the Charleston peninsula. PLoS ONE 2020, 15, e0238770.
[CrossRef]
56. South Carolina Department of Parks, Recreation & Tourism. South Carolina State Parks. Available online: https://southcarolin
aparks.com/ (accessed on 30 December 2020).You can also read


