DWS ON TOUR RENTA VARIABLE ! NO HAY ALTERNATIVA ! TINA - THERE IS NO ALTERNATIVE TO EQUITIES
←
→
Page content transcription
If your browser does not render page correctly, please read the page content below
DWS ON TOUR
RENTA VARIABLE ………! NO HAY ALTERNATIVA !
TINA – THERE IS NO ALTERNATIVE TO EQUITIES
Irene López | 11 de Febrero 2020 Barcelona

For Professional Clients MiFID Directive 2014/65/EU Annex II) only. No distribution to private/retail investors. For Qualified Investors (Art. 10 Para. 3 of the Swiss Federal Collective Investment Schemes Act
(CISA)). For institutional investors only. Further distribution of this material is strictly prohibited. APAC Australia: For professional clients only.

“La Vida Comienza Donde Termina Tu Zona De Confort”
Neale Donald Walsh

“El Cambio Tiene 3 Etapas:

        En La Primera, Es Imposible
        En La Segunda, Es Improbable
        En La Tercera, Es Inevitable”
Barak Obama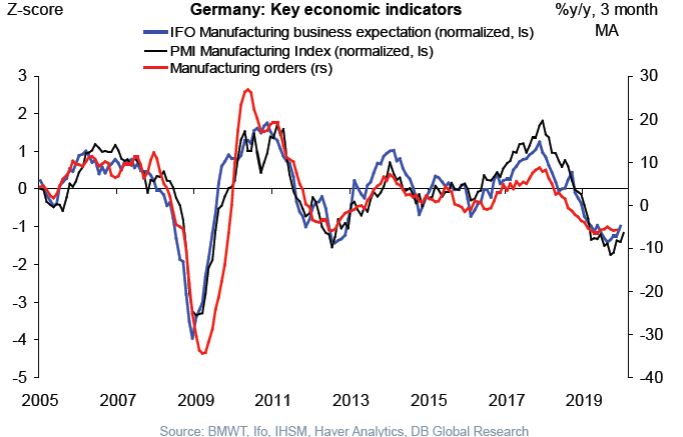
CIO VIEW 2020

For Professional Clients MiFID Directive 2014/65/EU Annex II) only. No distribution to private/retail investors. For Qualified Investors (Art. 10 Para. 3 of the Swiss Federal Collective Investment Schemes Act
(CISA)). For institutional investors only. Further distribution of this material is strictly prohibited. APAC Australia: For professional clients only.
GLOBAL ECONOMY
Not too fast – not too slow – growth is stabilizing through EM

       UNITED STATES                                            EUROZONE                                                  CHINA                               EMERGING MARKETS

                                                                                                                                                                                                               60%
                                                                                                                                                                                                           Share of
                                                                                                                                                                                                            global
                                                                                                                   6.2%                                                                                     GDP1
                                                                                                                                         5.8%
                                                                                                                                                                       4.2%                 4.4%
          2.2%
                                1.6%
                                                              1.1%                  0.9%

        2019 F                2020 F                         2019 F                2020 F                         2019 F               2020 F                        2019 F                2020 F

 2020: SLOWDOWN                                      2020: STABILIZATION                                 2020: SLOWDOWN                                      2020: RECOVERY

 ↓   Impact of tax cuts fading                       ↓   Expected trough in exports                      ↓    Various trade-conflict effects                 ↓    Idiosyncratic risks2
                                                         / manufacturing
 ↓   Economy-wide corporate                                                                              ↓    High debt prevents more                        ↑    Fiscal / monetary support &
     profits (NIPA) decreasing                       ↑   Fiscal stimulus in Germany                           monetary stimulus                                   less dependency on the U.S.

                                               3.1%                  3.1%
                                                                                            2020: NO GLOBAL RECESSION EXPECTED
  WORLD
                                                                                            ↓    Economic policy uncertainty weighs on global economic decisions,
                                              2019 F                2020 F                       emerging-markets recovery stabilizes

F = DWS forecast 1) IMF World Economic Outlook as of December 2019 2) In Brazil, Argentina, Chile / Forecasts are not a reliable indicator of future returns. Forecasts are based on assumptions, estimates,
opinions and hypothetical models or analysis which may prove to be incorrect. Sources: International Monetary Fund, DWS Investment GmbH as of December 2019

CIO View / Stefan Kreuzkamp / January 2020                                                                                                                                                                     /4
GLOBAL ECONOMY
Manufacturing dismal – service sector still keeping up its mood

PURCHASING MANAGERS‘ INDICES (PMI)
                                        Composite                                         Manufacturing                                                        Service
                 Jun-19   Jul-19 Aug-19 Sep-19 Oct-19   Nov-19   Dec-19   Jun-19   Jul-19 Aug-19 Sep-19     Oct-19   Nov-19 Dec-19          Jun-19   Jul-19 Aug-19 Sep-19 Oct-19 Nov-19 Dec-19

World            51.2     51.6   51.3    51.1   50.8    51.4     51.7      49.4    49.3    49.5    49.7     49.8     50.3     50.1          51.9     52.5    51.8     51.4    51.0    51.6   52.1

United States    51.5     52.6   50.7    51.0   50.9    52.0     52.7      50.6    50.4    50.3    51.1     51.3     52.6     52.4          51.5     53.0    50.7     50.9    50.6    51.6   52.8

Eurozone         52.2     51.5   51.9    50.1   50.6    50.6     50.9      47.6    46.5    47.0    45.7     45.9     46.9     46.3          53.6     53.2    53.5     51.6    52.2    51.9   52.8

France           52.7     51.9   52.9    50.8   52.6    52.1     52.0      51.9    49.7    51.1    50.1     50.7     51.7     50.4          52.9     52.6    53.4     51.1    52.9    52.2   52.4

Germany          52.6     50.9   51.7    48.5   48.9    49.4     50.2      45.0    43.2    43.5    41.7     42.1     44.1     43.7          55.8     54.5    54.8     51.4    51.6    51.7   52.9

United Kingdom 49.7       50.7   50.2    49.3   50.0    49.3     49.3      48.0    48.0    47.4    48.3     49.6     48.9     47.5          50.2     51.4    50.6     49.5    50.0    49.3   50.0

Japan            50.8     50.6   51.9    51.5   49.1    49.8     48.6      49.3    49.4    49.3    48.9     48.4     48.9     48.4          51.9     51.8    53.3     52.8    49.7    50.3   49.4

Spain            52.1     51.7   52.6    51.7   51.2    51.9     52.7      47.9    48.2    48.8    47.7     46.8     47.5     47.4          53.6     52.9    54.3     53.3    52.7    53.2   54.9

Italy            50.1     51.0   50.3    50.6   50.8    49.6     49.3      48.4    48.5    48.7    47.8     47.7     47.6     46.2          50.5     51.7    50.6     51.4    52.2    50.4   51.1

Brazil           49.0     51.6   51.9    52.5   51.8    51.8     50.9      51.0    49.9    52.5    53.4     52.2     52.9     50.2          48.2     52.2    51.4     51.8    51.2    50.9   51.0

Russia           49.2     50.2   51.5    51.4   53.3    52.9     51.8      48.6    49.3    49.1    46.3     47.2     45.6     47.5          49.7     50.4    52.1     53.6    55.8    55.6   53.1

China            50.6     50.9   51.6    51.9   52.0    53.2     52.6      49.4    49.9    50.4    51.4     51.7     51.8     51.5          52.0     51.6    52.1     51.3    51.1    53.5   52.5

India            50.8     53.9   52.6    49.8   49.6    52.7     53.7      52.1    52.5    51.4    51.4     50.6     51.2     52.7          49.6     53.8    52.4     48.7    49.2    52.7   53.3

South Korea                                                                47.5    47.3    49.0    48.0     48.4     49.4     50.1

Taiwan                                                                     45.5    48.1    47.9    50.0     49.8     49.8     50.8

Turkey                                                                     47.9    46.7    48.0    50.0     49.0     49.5     49.5

                                                                          >50 and increasing                                              50 and falling or unchanged
CENTRAL BANKS
Reacted to slowing economies and will stay accommodative

CENTRAL BANKS AGAIN IN CUTTING MODE                                                               2020F: EASING BIAS BUT CB POLICY REACHING ITS LIMITS
Net number of interest rate moves, rolling 3-months average1

   20
                                                                                                     ECB                 MONETARY STIMULUS
   15                                                                                                                    _ QE extension (€20bn. volume/month)
                                                                                                                         _ Policy rates on hold, no cut in 2020 expected
   10

     5                                                                                                                   TIERING SYSTEM
                                                                                                                         _ Two-tired system, exempting part of banks´
     0                                                                                                                     excess liquidity from negative deposit rate
    -5

  -10
                                                                                                      FED                MONETARY STIMULUS
  -15
                                                                                                                         _ Pause after successful "insurance cuts" cycle
  -20
                                                                                                                         _ On hold, no cut in 2020 expected

  -25
                                                                                                                         BALANCE-SHEET EXPANSION
  -30
                                                                                                                         _ Treasury-bill purchases with $60bn. at least into
     2009            2011           2013           2015           2017           2019                                      Q2 2020 (not QE, liquidity injection)
            G10 central banks              Emerging-Markets central banks

1) Moving average of 3-months change in interest rates / Past performance is not a reliable indicator of future returns. Forecasts are not a reliable indicator of future returns. Forecasts are based on
assumptions, estimates, opinions and hypothetical models or analysis which may prove to be incorrect. Sources: Bloomberg Finance L.P., DWS Investment GmbH as of December 2019

CIO View / Stefan Kreuzkamp / January 2020                                                                                                                                                                  /6
FISCAL STIMULUS IN EUROPE
Not much to be expected
DEBT-TO-GDP RATIOS ACROSS EU COUNTRIES
In % of GDP, 2019 GERMANY 2020 & BEYOND
133% _ Fiscal policy already supportive due to income tax relief,
99% 96% social security spending, and increased child benefits
86%
59% _ Plans to abolish the solidarity surcharge
Germany UK France Spain Italy SELF-IMPOSED RESTRICTIONS IN GERMANY
GERMANY ALREADY GENEROUS BY ITS STANDARDS _ Debt brake (constitution)
Fiscal impulse (EU Commission estimate), % of potential GDP _ Commitment not to run a public-sector deficit ("black
1.0 zero") is part of the coalition treaty
Forecast1
0.5
0.0
-0.5 LIMITED GROWTH IMPACT
-1.0 _ Not a real impulse that boosts private sector activity
-1.5 _ German households tend to save additional income
-2.0
2011 2012 2013 2014 2015 2016 2017 2018 2019 2020
1) Forecast EU Commission / Past performance is not a reliable indicator of future returns. Forecasts are not a reliable indicator of future returns. Forecasts are based on assumptions, estimates, opinions and
hypothetical models or analysis which may prove to be incorrect. Sources: International Monetary Fund, EU Commission, DWS Investment GmbH as of December 2019
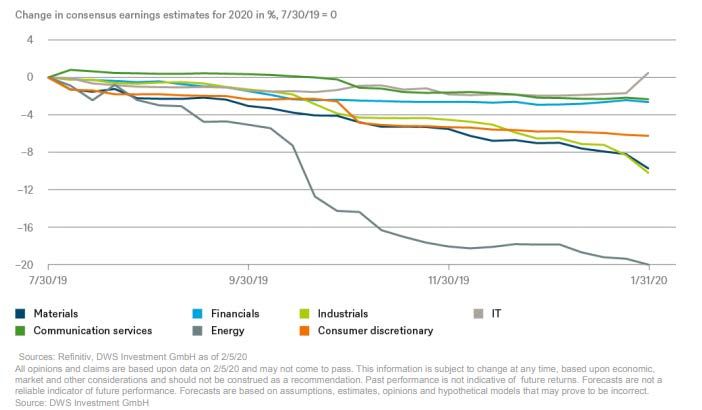
CIO View / Stefan Kreuzkamp / January 2020 /7HOW CONTAGIOUS ARE EARNINGS ESTIMATES? Change in consensus earnings estimates for 2020 Name of speaker / Name of event / Date /8
OUTLOOK 2020
Risks and opportunities

RISKS                                                     OPPORTUNITIES

             PRESIDENTIAL ELECTION                              LOW INTEREST RATE ENVIRONMENT
             Tax reform at risk: downside potential for         Ongoing allocation shifts due to low or
             equities                                           negative rates

                                                                CAPITAL FLOWS
             VALUATION SPREADS
                                                                Inflows in passive and active investment
             Bullish sentiment, huge valuation spreads
                                                                funds as well as share buy backs

             GEOPOLITICAL RISKS
                                                                LOW VOLATILITY
             Middle East, Iran, Russia, Turkey gaining
                                                                Low volatility in almost every asset class
             influence

             RATES & INFLATION
             Rise in capital market rates due to
             accelerating inflation

As of: December 2019; Source: DWS International GmbH

                                                                                                             /9
OUTLOOK 2020
Peak pessimism behind us – 2020 could surprise positively
ECONOMY INFLATION CENTRAL BANKS POLITICS
Growth slowdown in DM, Close, but below CB target Globally in easing mode Tariff agreement expected
recovery in EM No inflation overshoot ECB & Fed on hold Less uncertainty from
No recession European politics
EQUITIES FIXED INCOME CURRENCIES ALTERNATIVES
Higher EPS growth Low for longer EUR/USD continue Illiquidity premium
Europe with upside potential Focus on Asian bonds sideways trading
JPY as hedge
ESG
Smart Integration of ESG criteria into the investment process
Forecasts are not a reliable indicator of future returns. Forecasts are based on assumptions, estimates, opinions and hypothetical models or analysis which may prove to be incorrect.
Source: DWS Investment GmbH as of December 2019
CIO View / Stefan Kreuzkamp / January 2020 / 10ESG – THE REGULATORY PERSPECTIVE
Regulation is affecting investment management
EU COMMISSION TCFD EU COMMISSION EU COMMISSION
TASK FORCE ON
CLIMATE-RELATED
TCFD FINANCIAL
DISCLOSURES
SRD II1 GOVERNANCE & DISCLOSURE REGULATION SUSTAINABILITY IN THE
_ Requirement to report & MANAGEMENT AROUND _ Processes and policies for INVESTMENT ADVICE
track engagement activities CLIMATE-RELATED RISKS reducing sustainability risks _ Consistent product
_ Reporting to become classification based on
BaFin mandatory for PRI signatories MiFID II target market
Bundesanstalt für EU TAXONOMY
Finanzleistungsaufsicht
_ Definition of economic
BULLETIN ON INTEGRATING activities with substantial
SUSTAINABILITY RISK contribution to climate change
_ "Good practices" on
integrating sustainability risks
across the value chain
Q4 2019 Q1 2020 Q1 2021 Q4 2021 & 2022
1) Shareholder Rights Directive II / Forecasts are based on assumptions, estimates, opinions and hypothetical models or analysis which may prove to be incorrect.
Source: DWS Investment GmbH as of December 2019
CIO View / Stefan Kreuzkamp / January 2020 / 11SOLUCIONES DWS 2020 For Professional Clients MiFID Directive 2014/65/EU Annex II) only. No distribution to private/retail investors. For Qualified Investors (Art. 10 Para. 3 of the Swiss Federal Collective Investment Schemes Act (CISA)). For institutional investors only. Further distribution of this material is strictly prohibited. APAC Australia: For professional clients only.
RENTA VARIABLE
TINA (THERE IS NO ALTERNATIVE) …. NO HAY ALTERNATIVA

                              MULTIACTIVO

 VALUE                                                 GROWTH

               DEFENSIVO                CÍCLICO

                        ESG             DIGITALIZACIÓN
SOLUCIONES 2020
Investment opportunities based on sustainable growth drivers
MULTIACTIVO TEMÁTICOS
DWS Concept Kaldemorgen Industria 4.0
DWS Invest Smart Tech Industrials
Infraestructuras
DWS Invest Global Infrastructure
INCOME
DWS Invest Top Dividend Nutrición, Demografía &
Hábitos de Consumo
DWS Invest ESG Global DWS Invest
Equity Income
2020 Global Agribusiness
ESG
ALEMANIA
DWS Invest German Equities Cambio Climático & Escasez de
Recursos
DWS Deutschland
DWS Invest Climate Tech
Integración ESG & Impacto Positivo
As of: December 2019; source: DWS Investment GmbH
DWS Invest SDG Global Equities
/ 14DWS CONCEPT KALDEMORGEN CONVIRTIENDO VOLATILIDAD EN OPORTUNIDAD For Professional Clients MiFID Directive 2014/65/EU Annex II) only. No distribution to private/retail investors. For Qualified Investors (Art. 10 Para. 3 of the Swiss Federal Collective Investment Schemes Act (CISA)). For institutional investors only. Further distribution of this material is strictly prohibited. APAC Australia: For professional clients only.
DWS CONCEPT KALDEMORGEN
Performance since inception

PERFORMANCE IN EUR SINCE INCEPTION (MAY 2, 2011)
(02.05.2011 = 100 points)

 170                                                                                                                + 61.5%
 160                                                                                                              (5.7% p.a.)
                                                                                                                   Vol.: 5.4%
 150
 140                                                                                                                 2019
                                                                                                                   + 12.8%
 130
 120
 110
 100
   90
    May-11          May-12          May-13          May-14          May-15    May-16   May-17   May-18   May-19
                                                           DWS Concept Kaldemorgen FC

Past performance is not a reliable indicator of future returns.
As of: End of December, 2019; Source: DWS International GmbH, daily figures

                                                                                                                                / 16
DWS CONCEPT KALDEMORGEN
Competitive Edge
FLEXIBILITY FOCUS ON DOWNSIDE
Unconstrained allocation RISK MANAGEMENT
across asset classes & State-of-the art
geographies without proprietary shortfall model
regional bias an integral part of the
investment process
DWS Concept
Kaldemorgen
TRACK RECORD EXPERIENCE
Robust risk-adjusted A seasoned team of
returns since 2011 across investment professionals
market cycles under strong leadership
Past performance is not a reliable estimator for future returns.
Source: DWS International GmbH, May 2019
/ 17DEDICATED INVESTMENT TEAM
Boutique-style approach combined with resources of a global player
MULTI ASSET TOTAL RETURN TEAM
Portfolio Manager
37 37
Klaus Kaldemorgen
Co-Head Multi Asset Total Return Teams
Managing Director
Co-Manager
14 14 11 11
Henning Potstada Christoph Schmidt, CFA
Co-Head Multi Asset Total Return Team Global Sector Focus:
Global Sector focus: Energy, Materials | Global Convertibles Industrials, Health Care
Portfolio Management
Risk Management & Data Analytics
Equities & Sector Gatekeeper Fixed Income & Currencies Gatekeeper
Dr. Gunnar 22 22 Stefan 26 15 Bernhard 31 19 Stefanie 23 3 Heike 30 17 Thomas 6 6
Friede, Flasdick Falk Holtze-Jen Fornefett Graby
CEFA CIIA
Global Sector Focus: Global Sector Focus: Fixed Income Currencies Risk Management, Performance- Risk Management, Performance-
IT, Telekom., Utilities, Consumers Contribution, Portfolio Analytics Contribution, Portfolio Analytics
ESG
Sascha 19 19 Tanja 8 8
Halicki, Siegrist, CFA
CEFA, CIIA
Industry experience (years) with DWS (years)
Institutional Mandates Fixed Income & Institutional
Mandates
DWS GLOBAL RESEARCH NETWORK
Equities Core Fixed Income Credit Alternatives Fund Selection
Sector/ Geo Coverage Sovereign IG, HY, EM, Hybrids Hedge funds, infrastructure,
convertibles, commodities
125 59 70 220 14
As of: September 2019; Source: DWS International GmbH
/ 18DWS CONCEPT KALDEMORGEN
Risk/Return profile of DWS Concept Kaldemorgen over time
ANNUAL PERFORMANCE, VOLATILITY AND DRAWDOWNS* SINCE INCEPTION (MAY, 2011)
15%
12.84%
11.87%
10%
8.16% 7.65%
6.42%
5% 3.55%
1.56%
0.46%
0%
-2.23%
-5%
-10%
2011 2012 2013 2014 2015 2016 2017 2018 2019
(partial,
inception May
Performance Max Drawdown Volatility
2011)
Inception date: May, 2011
DWS Concept Kaldemorgen FC share class; Calculation of performance is based on the time-weighted return and excludes front-end fees. Individual costs for funds such as
management / performance fee, commissions and other charges have been included in this presentation. Past performance is not a reliable indicator of future returns.
* On a calendar year basis
As of: December 2019; Source: DWS International GmbH, daily figures
/ 19ASSET CLASS STEERING DURING THE YEAR
With success through different market phases thanks to flexibility
ASSET ALLOCATION
100% 100%
90% 90%
80% 80%
70% 70%
60% 60%
50% 50%
40% 40%
30% 30%
20% 20%
10% 10%
0% 0%
12/18 01/19 02/19 03/19 04/19 05/19 06/19 07/19 08/19 09/19 10/19 11/19 12/19
Cash Gold Certificates Government Bonds Corporate Bonds Equities Net Exposure Equities (RS)
Past performance is not a reliable indicator of future returns. Allocations are subject to change without prior notice.
As of: end of December 2019; Source: DWS International GmbH, Thomson Reuters Datastream.
/ 20DWS CONCEPT KALDEMORGEN
Contribution overview (before costs)
PERFORMANCE CONTRIBUTION – YTD
All asset classes in positive territory in 2019:
Equities (local) 10.9%
_ Equity as the major performance contributor in
H1
Equity index futures (local) -1.3%
_ Increase in corporate bond allocation paying off
Corporate bonds (local) 2.2%
_ Profits from government bonds in the US, Russia
Government bonds (local) 0.9% and Turkey
_ Gold with a positive contribution especially in Q2
Bond index futures (local) 0.0%
_ FX also contributing positively, mainly due to
Gold (local) 1.4% strengthening of the USD, GBP and RUB
Cash/MM (local) -0.1%
FX 1.3%
TOP 3 CONTRIBUTORS YTD
FX Forwards -0.4% AT&T INC 83 BP
TAIWAN SEMICONDUCTOR MAN. 62 BP
ALPHABET INC 57 BP
Past performance is not a reliable indicator of future returns.
As of end of December 2019, Source: DWS International GmbH
/ 21DWS CONCEPT KALDEMORGEN
Navigating markets effectively
NET EQUITY NET DURATION NET EUR-POSITION
50% 5 120%
4
40%
100%
3
30% 2
80%
1
20%
0 60%
10%
-1
40%
0% -2
-3
-10% 20%
-4
-20% -5 0%
05/11
05/12
05/13
05/14
05/15
05/16
05/17
05/18
05/19
05/11
05/12
05/13
05/14
05/15
05/16
05/17
05/18
05/19
05/11
05/12
05/13
05/14
05/15
05/16
05/17
05/18
05/19
Allocations are subject to change without notice.
As of: Dezember 2019; Source: DWS International GmbH
/ 22OUTLOOK 2020
Peak pessimism behind us – 2020 could surprise positively
ECONOMY INFLATION CENTRAL BANKS POLITICS
Growth slowdown in DM, Close, but below CB target Globally in easing mode Tariff agreement expected
recovery in EM No inflation overshoot ECB & Fed on hold Less uncertainty from
No recession European politics
EQUITIES FIXED INCOME CURRENCIES ALTERNATIVES
Higher EPS growth Low for longer EUR/USD continue Illiquidity premium
Europe with upside potential Focus on Asian bonds sideways trading
JPY as hedge
ESG
Smart Integration of ESG criteria into the investment process
Forecasts are not a reliable indicator of future returns. Forecasts are based on assumptions, estimates, opinions and hypothetical models or analysis which may prove to be incorrect.
Source: DWS Investment GmbH as of December 2019
CIO View / Stefan Kreuzkamp / January 2020 / 23OUTLOOK 2020
Structural trends and changes
DIGITALIZATION CLIMATE CHANGE
Almost every sector affected! Big driver for ESG / sustainable
Disruptive in particular for financial investments
and automobile sector
As of: December 2019; Source: DWS International GmbH
/ 24OUTLOOK 2020
Increase of asset classes with low or negative correlation to equities
ASSET CLASS EXPOSURE IN 2020 DIVERSIFIERS
50%
Equity Listed Residential Property, stable dividend stocks
31%
18%
Government Bonds US Treasuries, Norway Government, EM Government
12%
13% Reduction of Corporate Bonds high correlation with
Corporate Bonds
26% equities
9% Diversification benefits, profit from geopolitical risks &
Gold
7% low/negative interest rates
10%
Cash Avoid negative interests
24%
28% Increase of „Safe Haven“ currencies (USD, CHF, JPY),
Foreign Currencies
24% NOK, strategic short position in GBP
2020 Beginning 2019
Allocations are subject to change without prior warning
Source: DWS International GmbH, as of: January 2020
/ 25DWS CONCEPT KALDEMORGEN
Current portfolio positioning – Equity
BREAKDOWN BY REGION BREAKDOWN BY SECTOR
Eurozone 19.5% Health Care 12.3%
Comm. Services 7.5%
North America 15.8% InfoTech 5.8%
Financials 4.1%
United Kingdom 3.2%
Consumer Discretionary 3.9%
Asia ex. Japan 3.1% Energy 2.8%
Real Estate 2.6%
Switzerland 2.6%
Consumer Staples 1.8%
Japan 1.0% Industrials 1.7%
Utilities 1.7%
EM/Others 0.6% Materials 1.6%
KEY RATIOS*
Dividend Yield (12M Forward) 3.25% Net Debt to Equity 66.81%
EV/EBITDA (12M Forward) 9.28 EPS Growth (12M Forward) 4.97%
Data shown in % of fund volume. Allocations are subject to change without notice.
* Data based on the equity part of the fund.
As of: December 2019; source: DWS International GmbH
/ 26DWS CONCEPT KALDEMORGEN
Current portfolio positioning – Fixed Income
BREAKDOWN BY MARKET SEGMENTS BREAKDOWN BY REGIONS BREAKDOWN BY SECTORS
North America 14.3% Comm. Services 2.7%
Emerging Markets 9.1%
Industrials 2.5%
Europe ex Eurozone 6.3% Energy 2.5%
Sovereigns 8.6% Health Care 2.3%
Eurozone 4.7% Consumer Staples 1.4%
InfoTech 0.9%
HY Corporates 8.0% Latin America 2.2%
Financials* 0.9%
Others Materials 0.5%
1.2%
IG Corporates 2.1% Consumer Disc. 0.2%
Asia ex Japan 0.1% Real Estate 0.1%
Utilities 0.1%
Convertibles 0.9%
Japan 0.0% None 0.0%
KEY RATIOS*
Average Bond Rating BBB Duration excl. Derivatives (years) 3.84
Ø Coupon excl. Derivatives 4.29% Duration incl. Derivatives (years) 3.81
Ø Yield-to-maturity excl. Derivatives 3.42%
Data shown in % of fund volume. Allocations are subject to change without notice.
* Data based on the fixed income part of the fund.
As of: December 2019; source: DWS International GmbH
/ 27ALLOCATION TO EMERGING MARKETS
Select opportunities paying off
FIXED INCOME
RUSSIAN GOVERNMENT BOND (01.01.2019 = 100)
_ Profits from the appreciation of the Russian
Ruble as well as from positions in the equity and 112
fixed income buckets in Russia 110
108 +11.2%
_ Increase of Mexican corporate bonds exposure 106
(carry) 104
_ Turkish government bonds in hard currency (EUR 102
and USD) 100
98
RUSSIAN RUBLE APPRECIATION (EUR/RUB) EXPOSURE IN THE FIXED INCOME PORTFOLIO
80 4,0%
78
3,0%
76
RUB loses
74
+13.7% 2,0%
RUB gains 72
70
1,0%
68
0,0%
Brazil Mexico Russia Turkey
Past performance is not a reliable indicator of future returns. Allocations are subject to change without prior notice.
As of: end of December 2019; Source: DWS International GmbH, Bloomberg
/ 28DWS CONCEPT KALDEMORGEN
Current portfolio positioning – Currency
BREAKDOWN BY CURRENCY*
EUR 66.7%
42.7%
USD 17.7%
34.7%
GBP -1.8%
5.2%
CHF 2.6%
2.6%
JPY 1.5%
1.5%
TWD 1.5%
1.5%
Gold 6.9%
6.9%
RUB 2.2%
2.2%
HKD 1.4%
1.4%
Others 1.3%
1.3%
-10% 0% 10% 20% 30% 40% 50% 60% 70% 80%
Net Gross
Allocations are subject to change without notice.
* refers to foreign currency accounts and securities held in the respective currency .
As of: December 2019; source: DWS International GmbH, BarraOne
/ 29ESTRATEGIAS INCOME DWS INVEST TOP DIVIDEND DWS INVEST ESG EQUITY INCOME For Professional Clients MiFID Directive 2014/65/EU Annex II) only. No distribution to private/retail investors. For Qualified Investors (Art. 10 Para. 3 of the Swiss Federal Collective Investment Schemes Act (CISA)). For institutional investors only. Further distribution of this material is strictly prohibited. APAC Australia: For professional clients only.
CONSERVATIVE EQUITY INVESTMENT
The stock market year 2018 as an example

         INVESTOR: EQUITIES GLOBAL1                           INVESTOR: DWS TOP DIVIDENDE

                                           Recession?
                                                                          Distribution
                                           „Interest                          „Interest
                                            fears“?                             fears“?

1 measured  by the MSCI World Index
As of: End of December 2019. Source: DWS International GmbH

                                                                                            / 31
WHAT SHOULD BE THE VALUE OF A
DIVIDEND STRATEGY IN THE LONG-TERM?
1 Real asset (“inflation hedge”)
2 High dividend yield and regular income
3 Asymmetric risk return profile
4 Less volatile than “traditional” equity investments
5 Superior risk-adjusted returns
Source: DWS International GmbH
/ 32DIVIDENDS – WHERE ELSE IS THERE YIELD?
Dividend yield
Bond yield (5Y.) Company
(current)
2.2 % PFIZER 3.7 %
2.6 % VERIZON 4.1 %
0.0 % UNILEVER 3.3 %
0.0 % ALLIANZ 4.1 %
-0.1 % TOTAL 5.2 %
For illustrative purposes only.
As of: End of December 2019; source: DWS International GmbH, Bloomberg, www.euwax.de
/ 33DWS TOP DIVIDENDE LD
Attractive and regular income
AVERAGE DISTRIBUTION YIELDS CLEARLY HIGHER THAN INFLATION RATES
Distribution per share DWS Top Dividende LD in EUR:
1.101 2.50 2.90 2.90 2.90 2.65 2.65 2.65 2.75 2.75 2.80 2.90 3.00 3.10 3.20 3.40 3.60
6%
5% 4,8%
4,3%
4,1% 4,0%
4% 3,6% 3,6% 3,5%
3,2% 3,1% 3,3% 3,1%
3,0% 2,9% 2,9%
3% 2,7% 2,7% 2,6%
2%
1%
0%
1
2003 2004 2005 2006 2007 2008 2009 2010 2011 2012 2013 2014 2015 2016 2017 2018 2019
Distribution yield per share DWS Top Dividende2 Inflation rate Eurozone
Past performance is not a reliable indicator of future returns.
1 Short fiscal year (04/28/2003 – 09/30/2003)
2 Based on the average NAV of the fiscal year (10/01 – 09/30)
3 Based on the average NAV of DWS Top Dividende since inception (04/28/2003 – 09/30/2019), Inception date: 04/28/2003
As of: End of December 2019; source: DWS International GmbH, Refinitiv Datastream
/ 34HIGH DIVIDEND YIELD IS NOT ALWAYS BETTER
DIVIDEND YIELD
ESTIMATED VERSUS REALIZED YIELD BY DIVIDEND YIELD (IBES CONSENSUS FTSE WORLD SINCE 1995)
(in %)
25
Realized yield (clearly) below
Our preferred investment universe
expected yield
20
Dividend yield (%)
15
10
5
0DWS TOP DIVIDENDE
Clearly lower downside risk and volatility
DWS TOP DIVIDENDE LD – SINCE INCEPTION*
100%
81%
Down
Up
-65%
-100%
DWS Top Dividende LD MSCI World (RI)-Index**
Past performance is not a reliable indicator of future returns. Upside Capture Ratio measures a manager's performance in up markets relative to the market (benchmark) itself. It is
calculated by taking the security’s upside capture return and dividing it by the benchmark’s upside capture return. Downside Capture Ratio measures manager's performance in down
markets. A down-market is defined as those periods (months or quarters) in which market return is less than 0. In essence, it tells you what percentage of the down market was
captured by the manager. For example, if the ratio is 110 %, the manager has captured 110 % of the down-market and therefore underperformed the market on the Downside.
As of: End of December 2019; * April 28th, 2003 ** No official benchmark
Source: DWS International GmbH
/ 36THE GOLDEN RULES OF DIVIDEND INVESTING –
TIPS AND HINTS
1. Stick to your STYLE
especially in growth/momentum driven
markets
2. PATIENCE and DISCIPLINE are key
Dividend investing is not a sprint, it´s a marathon
3. DON´T GET TOO GREEDY
Avoid dividend cutter
4. FOCUS ON CAPITAL PRESERVATION
Winning more by losing less
5. SUSTAINABLE BUSINESS MODEL
Stability of revenues/earnings, strong balance
sheet
Forecasts are based on assumptions, estimates, views and hypothetical models or analyses, which might prove inaccurate or incorrect.
As of end of December 2019; source: DWS International GmbH
/ 37INCOME STRATEGIES
Characteristics, Investment rationale and Investment strategy
“Consistent dividend growers”:
Strong track record of
Dividend growing dividends
“Defensive yield”: Defensive champions / combined with decent
stocks with higher yield but Aristocrats dividend yield
lower growth (mature
business models)
(Dividend) growth at a
Dividend Dividend
reasonable yield
Strong balance sheet and free yielders growers
cash flow, low
net debt / good credit rating
Quality
Our Global equity income strategy focusing on companies with above average dividend yield, reasonable dividend growth
and sustainable dividend coverage.
© 2019 Morningstar, Inc. All rights reserved. The information contained herein:
(1) is proprietary to Morningstar and/or its content providers; (2) may not be copied or distributed; and (3) is not warranted to be accurate, complete, or timely. Neither Morningstar nor
its content providers are responsible for any damages or losses arising from any use of this information. Past performance is no guarantee of future results.
* (vs. peers in global equity income category by Morningstar and broad market combined with top rankings and ratings )
Note: Not all Deutsche AM products and services are offered in all jurisdictions and availability is subject to local regulatory restrictions and requirements. Past performance is not
necessarily indicative of future returns.
Source: DWS International GmbH
/ 38SIMILARITIES & DIFFERENCES
DWS Invest Top Dividend & DWS Invest ESG Equity Income
DWS Invest Top Dividend DWS Invest ESG Equity Income
Morningstar Peer group Global Equity Income Global Equity Income
Benchmark None None
Use of derivatives / FX
Generally not Generally not
hedging
Focus on large caps,
Focus on mega / large caps
Market capitalization partially mid caps
(Ø market cap: 103 bn EUR)
(Ø market cap: 97 bn EUR)
Number of holdings 60 – 100 60 – 100
Single stock weight 1–3% 1–4%
Sector restrictions / None – focus on defensive None – focus on ESG conform
sector bias dividend payer defensive dividend payer
Regional restrictions None None
Liquidity ~ 7% ~ 5%
Ø Current dividend yield Ø 3.9% Ø 3.2%
Ø Median dividend
7.0% 8.7%
growth 1 year
Turnover Ratio ~ 20 % p.a. < 50 % p.a.
Past performance is no guarantee of future results..
AuM EUR 24 bn
As of: End of December 2019; source: DWS International GmbH, Aladdin Research
EUR 293 mn
No assurance can be given that investment objective or any target will be achieved. © 2020 Morningstar, Inc. All rights reserved. The information contained herein: (1) is proprietary to Morningstar and/or its content providers; (2) may not
be copied or distributed; and (3) is not warranted to be accurate, complete, or timely. Neither Morningstar nor its content providers are responsible for any damages or losses arising from any use of this information.
/ 39DWS ESG CONSENSUS RATING
scanning for cross-vendor concordance in ESG assessments
DISCRETIONARY BEST-IN-CLASS
APPROACH
100 points
A ESG true leaders
concordant rank order ►
B ESG leaders
C ESG upper midfield
D ESG lower midfield
DWS is licensed user of the data from
those ESG-data-vendors.
0 points E ESG laggards
F ESG true laggards
HARD EXCLUSIONS
DWS’ ESG Consensus Ratings seek to identify the true ESG leaders and ESG laggards by peer group, consistently assessed as such by the top ESG agencies in a 360 degree
review.
As of: December 2019; source: DWS International GmbH
/ 40DETAILING OUR MINIMUM ESG STANDARDS (MESGS)
Exclusion and best-in-class criteria that apply to all ESG labeled DWS mutual funds
Sector screens Norm screen and Best-in-Class ranking
Controversial weapons UNGC Norm Compliance
_ Nuclear weapons _ Human rights
_ Cluster munitions _ Child / forced labor
_ Anti personnel mines _ Work conditions
_ Depleted uranium _ Environmental impact
_ Business ethics
Ownership and production of
Rating: A – E2
weapons and components
Controversial sectors
_ Tobacco
X
Exclusion
Climate Transition Risk
Investment
_ Military defense
Rating: A – E3 universe
_ Adult entertainment
_ Gambling Security selection
_ Nuclear power from those issuers
_ Coal* ESG overall SynRating that meet all
requirements
Max. revenue threshold
Rating: A – D4
≤ 5%
1 Max. revenue threshold: ≤ 25%, 2 max. 5% E in portfolio, 3 E max 5%, F excluded 4 ESG SynRating: max. 15% D in portfolio; max. 5% unrated
As of: December 2019; source: DWS Investment GmbH
/ 41DWS INVEST ESG EQUITY INCOME
Sector and country allocation – absolute to DWS Top Dividende
Portfolio
overlap
SECTOR ALLOCATION approx. COUNTRY ALLOCATION
16,9%
1/2 - 2/3 USA 33,3%
Financials 15,2% 36,1%
15,3% Germany 9,5%
Health Care 14,5% 7,4%
Great Britain 6,6%
IT 12,8% 5,6%
7,1% 6,2%
9,2% Exclusion of
Netherlands 5,9%
Consumer Staples 12,4% tobacco e.g. 5,2%
Canada 6,3%
Utilities 7,6% Greener European Utilities vs.
8,6% coal intensive US utilities
Japan 5,0%
7,6% 5,7%
Communication 9,0% 4,5%
Norway 4,0%
Industrials 7,0%
5,5% 4,4%
Denmark 0,0%
Materials 6,5% Chemical sector vs. Mining 3,6% In general overweight in Europe due to better
4,7% Switzerland
Companies 5,4% ESG data availability, better transparency and
pioneering role of Europe in the field of ESG
Consumer Disc. 4,0% 3,3%
1,6% France 5,4%
Energy 3,3% Primarily indirect oil exposure 2,7%
11,3% Finland 1,4%
vs. European Oil Majors
Real Estate 0,0% 5,8%
0,5% Other Countries 7,3%
ESG Equity Income DWS Top Dividende ESG Equity Income DWS Top Dividende
In % of fund volume. Allocations are subject to change without notice.
As of: End of December 2019; source: DWS International GmbH, Report Finder
/ 42DWS INVEST ESG EQUITY INCOME
ESG quality versus DWS Top Dividende and MSCI World
ESG Best in Class Exclusion
50% 42%
39%
40% 34%
30% 25% 27%
23% 20%
19%
20% 14%11%
8% 8% 10%10%
10%
0% 0% 0% 0% 1% 2%
0%
A B C D E F Kasse
Ø SynRating: B Ø SynRating: C Ø SynRating: C
ESG-Score: 77 ESG-Score: 68 ESG-Score: 61
DWS Invest ESG DWS
MSCI Welt
Equity Income Top Dividende
Especially ESG Equity Income scores best within the Morningstar Peer Group “Global Equity Income”. It is
leading on the first rank and has 5 out of 5 sustainability globes.
ESG SynScore and ESG SynRating are based on proprietary ESG Engine.
No assurance can be given that investment objective or any target will be achieved. © 2019 Morningstar, Inc. All rights reserved. The information contained herein: (1) is proprietary to
Morningstar and/or its content providers; (2) may not be copied or distributed; and (3) is not warranted to be accurate, complete, or timely. Neither Morningstar nor its content providers
are responsible for any damages or losses arising from any use of this information.
As of: End of December 2019; source: DWS International GmbH, Aladdin Research, Update Quarterly
/ 43ESG GLOBAL EQUITY INCOME MANDATE
Performance since inception (May 27, 2013)
PERFORMANCE SINCE INCEPTION1 OF “ESG GLOBAL EQUITY INCOME” MANDATE VS. MARKET
100 + 94.9%
Vola 12.5%
80 SR: 0.88
+ 82.3%
60 Vola 8.8%
SR: 1.11
40 + 80.1%
Vola 8.8%
20 SR: 1.08
+ 73.9%
0
Vola 11.1%
SR: 0.81
-20
05/13 11/13 05/14 11/14 05/15 11/15 05/16 11/16 05/17 11/17 05/18 11/18 05/19
MSCI World TR Net (EUR) ESG Global Equity Income Mandat
MSCI World High Dividend Yield TR Net (EUR) DWS Top Dividende (brutto)
1) May 27th, 2013
Past performance is no guarantee of future results. Calculation of performance is based on the time-weighted return and excludes front-end fees. Individual costs such as fees,
commissions and other charges have not been included in this presentation and would have an adverse impact on returns if they were included. Sharpe Ratio (SR) = measure to
calculate risk-adjusted return
As of: End of September 2019; source: DWS International GmbH, monthly data, update quartely
/ 44RENTA VARIABLE ALEMANA DWS INVEST GERMAN EQUITIES / DWS DEUTSCHLAND For Professional Clients MiFID Directive 2014/65/EU Annex II) only. No distribution to private/retail investors. For Qualified Investors (Art. 10 Para. 3 of the Swiss Federal Collective Investment Schemes Act (CISA)). For institutional investors only. Further distribution of this material is strictly prohibited. APAC Australia: For professional clients only.
GERMAN GDP IS HEALTHIER THAN SOME MAY THINK
125
120
115
110
105
100
2000 2002 2004 2006 2008 2010 2012 2014 2016 2018
Germany United States
GDP per capita, index: 2000 = 100
The information herein reflects our current views only, are subject to change, and are not intended to be promissory or relied upon by the reader. There can be no certainty that events will turn out as we have
opined herein. Forecasts are not a reliable indicator of future returns. Forecasts are based on assumptions, estimates, opinions and hypothetical models or analysis which may prove to be incorrect.
*+: high expected market impact; O: neutral expected market impact; -: low expected market impact // Source: Bloomberg Finance L.P., DWS Investment GmbH as of January 2020
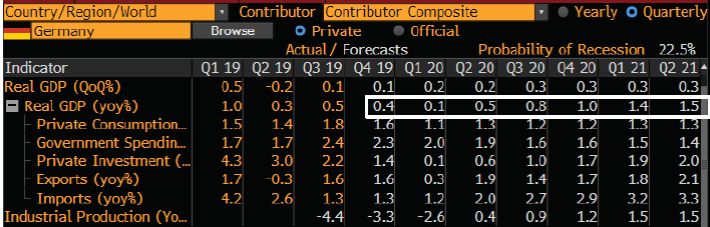
CIO Office / Market Outlook Slides / January 2020 / 46GERMANY BOTTOMING Key Economic Indicators Consensus expects strong rebound in growth in 2020 Source: Bloomberg CIO Office / Market Outlook Slides / January 2020 / 47
DWS INVEST GERMAN EQUITIES / DWS DEUTSCHLAND
Characteristics, Investment rationale and Investment strategy

CHARACTERISTICS & INVESTMENT RATIONALE
_ Investment style: Blend                                                     INVESTMENT STRATEGY
_ Investment approach: Bottom-up/stock picking                                _ German equity strategy focusing on firms sustainable business models and
_ Benchmark: CDAX Index                                                         strong balance sheets.

_ Tracking error: No formal tracking error target
                                                                                                            CDAX UNIVERSE (minimum 500mn € market cap)
_ Holdings: 40 – 60 stocks
                                                                                     Investment focus                    Quality                    Fundamentals                   Sustainability
_ Market capitalization: Large-Caps and flexible addition
  of high quality Small/Mid Caps (30% on average)
                                                                               _ Combination of value and      _ Earnings quality           _ Growth at a reasonable        _ ESG aspects
                                                                                 growth stocks                 _ Management track record      price
_ Use of derivatives: 1) DAX futures for active steering of                    _ Flexible addition of                                       _ Attractive dividend yield
                                                                                                               _ Strong balance sheets
  investment ratio to tactically benefit from short term                         small/mid caps
  market movements and to manage risk as well as
                                                                                                                            Opportunistic “blend” approach
  2) options to generate premium intakes (max. 3% of
  portfolio delta adjusted)
                                                                                                               DWS Deutschland / DWS Invest German Equities
_                                                                                                                               ~60 stocks

_ One of the largest and most experienced German
                                                                                                               Monitoring                                 Risk Management
  equity teams with direct access and close long-term
  relationships to the most important German companies.
_ Excellent stock picking expertise with a focus on                                                         High Conviction German equity portfolios
  structural growth and positive earnings momentum

Note: Not all Deutsche AM products and services are offered in all jurisdictions and availability is subject to local regulatory restrictions and requirements.
Source: DWS International GmbH

                                                                                                                                                                                                    / 48
DWS INVEST GERMAN EQUITIES / DWS DEUTSCHLAND
Portfolio allocation
BY SECTORS / ASSET CLASSES* BY MARKET CAPITALIZATION*
IT Mega caps
Financials (> 10 bn .)
Industr ials
Consumer Disc. Larg e cap s
(> 5 bn. < 10 bn.)
Materials
Por tfolio
Health Ca re Por tfolio
Mid cap s
Commu nicatio n Ben chmar k
(> 1 bn. < 5 b n.)
Real Estate
Utili ties Small caps
Consumer Sta ples (< 1 bn.)
0% 5% 10% 15% 20% 25% 30%
0% 20% 40% 60% 80% 100 %
BY TOP TEN*
Allia nz SE
SAP S E
Wirecard AG
Siemen s AG
Adid as AG
Muenchen er… Por tfolio
Infin eon…
KION G roup AG
BAS F SE
Fresenius SE…
0% 2% 4% 6% 8% 10% 12%
This allocation data comprises a mutual fund benchmarked against CDAX (RI).
* In % of fund volume; Reference index: 100% CDAX
Allocations are subject to change without notice.
As of: December 30, 2019; source: DWS International GmbH, Report Finder FIS XP
/ 49DWS INVEST GERMAN EQUITIES / DWS DEUTSCHLAND
Performance & risk figures
CALENDAR YEAR PERFORMANCE 7-YEAR CUMULATIVE PERFORMANCE
40% 250 108.09%
30%
220 84.05%
20%
10% 190
0% 160
-10%
130
-20%
-30% 100
Yea r to 201 9 201 8 201 7 201 6 201 5 201 4 201 3 201 2
Date Strategy Ben chmar k Strategy Ben chmar k
YTD 2019 2018 2017 2016 2015 2014 2013 2012 12/14 - 12/15 12/15 - 12/16 12/16 - 12/17 12/17 - 12/18 12/18 - 12/19
Strategy 25.78% 25.78% -23.03% 20.03% 9.52% 17.54% 5.25% 32.19% 37.97% Strategy 17.54% 9.52% 20.03% -23.03% 25.78%
Benchmark 25.08% 25.08% -18.11% 15.98% 6.50% 11.33% 3.09% 26.75% 29.26%
Spread
Benchmark 11.33% 6.50% 15.98% -18.11% 25.08%
0.70% 0.70% -4.92% 4.05% 3.01% 6.21% 2.15% 5.44% 8.71%
ANNUALISED PERFORMANCE STATISTICS
Return p.a. Annualised volatility (p.a.)
Strategy Benchmark Spread Strategy Benchmark Tracking error Information ratio Sharpe ratio Max Drawdown Beta Var (99%/10day/1y)
1 Year 25.78% 25.08% 0.70% 15.65% 12.83% 3.28 0.21 1.67 6.91 1.21 10.53%
3 Years 5.13% 5.90% -0.78% 15.52% 12.41% 3.45 -0.23 0.35 25.24 1.24 -
5 Years 8.38% 7.09% 1.29% 17.69% 15.14% 3.31 0.39 0.49 25.24 1.16 -
7 Years 11.03% 9.10% 1.93% 16.20% 14.02% 3.01 0.64 0.69 25.24 1.14 -
This data comprises a mutual fund benchmarked against CDAX (RI). Calculation of performance is based on the time-weighted return. Possible previous benchmark changes have
already been reflected in benchmark performance. Individual costs such as fees, commissions and other charges have not been included in this presentation and would have an
adverse impact on returns if they were included. Past performance is not a reliable indicator of future returns.
Reference index: 100% CDAX
As of: December 30, 2019; source: DWS International GmbH
/ 50TEMÁTICOS For Professional Clients MiFID Directive 2014/65/EU Annex II) only. No distribution to private/retail investors. For Qualified Investors (Art. 10 Para. 3 of the Swiss Federal Collective Investment Schemes Act (CISA)). For institutional investors only. Further distribution of this material is strictly prohibited. APAC Australia: For professional clients only.
Translating global challenges into investable themes
Investment opportunities based on sustainable growth drivers

Technolical breakthrough                                         Climate Change and resource scarcity
DWS Invest Artificial                                                DWS Invest Climate Tech
Intelligence

Interconnectivity of tech                                                  Nutrition, demography and
themes and globalisation                              Global                            eating habbits
DWS (Invest) Smart                                  Megatrends               DWS Invest Global
Industrial Technologies                                                          Agribusiness

                                                                    ESG and positive impact investing
Urbanisation, demography and
modernisation
                                                                       DWS Invest SDG Global
                                                                                    Equities
DWS Invest Global
Infrastructure
As of: December 2019; source: DWS Investment GmbH

                                                                                                   / 52
For Professional Clients (MiFID Directive 2014/65/EC Annex II) only. No distribution to private/retail customers.
For Qualified Investors (Art. 10 Para. 3 of the Swiss Federal Collective Investment Schemes Act (CISA)).
Thematic Equities – Smart Technologies
DWS Invest Smart Industrial Technologies
Automation & Digitalization are only two megatrends that shape our current world. The fund invests in
industrial companies that drive these changes. “Smart Tech” operates in various fields: Automation,
Digitalization, Energy Efficiency, Global Trade, MedTech and Infrastructure. The fund management team
has a strong focus on growth stocks while ensuring risk diversification on a portfolio level.
Automation & Robotics Infrastructure
More use of software & robotics to High demand for infrastructure due to
improve efficiency, quality and to allow demographic trends and
a higher degree of customization modernization requirements
E-Commerce & Global trade Digitalisation & Cyber Security
Increasing air travel and freight Demand for software applications to
volumes because of globalization improve efficiency and to distinguish
and demographic trends products and services
Smart Energy Medical Technology
Reduction of energy costs and emissions Rapidly rising health care costs,
to fulfill global emission standards leads healthier lifestyle and appearance of
to “Smart Cities” and “Smart homes” Millennials are influencing changes in
consumer behavior.
As of: December 2019
Source: DWS International GmbH
/ 53For Professional Clients (MiFID Directive 2014/65/EC Annex II) only. No distribution to private/retail customers.
For Qualified Investors (Art. 10 Para. 3 of the Swiss Federal Collective Investment Schemes Act (CISA)).
Thematic Equities – Impact Investing & ESG Integration
DWS (Invest) SDG Global Equities
We seek exposure to companies which operate in SDG-related business sectors and have a meaningful
positive impact on the United Nations Sustainable Development Goals (SDGs). Comprehensive analysis
and evaluation of the SDG impact is based on our proprietary ESG-Engine. The average proportion of
SDG-related revenue of the companies in the fund must be more than 50%.
Measuring what matters Making a positive impact
Integrating the UN SDGs into
investment portfolios through our
proprietary SDG-Rating.
Stocks are only eligible for the fund´s
investment universe if they are
relative and absolute SDG-
Champions.
The SDGs at an investor level Application of ESG standards
Achieving the SDGs may require up to Consideration of ESG aspects (Best-in-Class-
$7tn in investment each year from 2015 to Approach, Exclusion, Norm Compliance,
2030 – of which up to $6tn is reliant on the Carbon Rating, Engagement) based on the
unique ESG Engine.
private sector.
Excellent proprietary ESG engine, which
received the Insurance ERM Award 2017
As of: December 2018
Source: DWS International GmbH
/ 54DWS INVEST SDG GLOBAL EQUITIES
High positive link to UN SDGs versus MSCI World
DWS Invest SDG Global Equities MSCI World
50% 9%
SDG related revenues SDG related revenues
More than every Only about every
second euro invested twentieth euro invested
is aligned with is aligned with
the UN SDGs the UN SDGs
Forecasts are not a reliable indicator of future returns. Forecasts are based on assumptions, estimates, views and hypothetical models or analyses, which might prove inaccurate or
incorrect. Number is average of SDG related revenue contribution since inception of the fund.
As of: December 2019; source: DWS International GmbH, quarterly updated
/ 55DWS INVEST SDG GLOBAL EQUITIES
Allocation
Portfolio allocation by SDG related revenues and by SDG theme (in %)
13 23,2%
3 10,5%
6 6,6%
12 4,7%
4 3,0%
2 2,0%
11 0,3%
8 0,1%
More than every second euro invested is aligned with the UN SDGs
Pictures illustrative purposes only.
As of: December 2019; source: DWS International GmbH; quarterly updated
/ 56Thematic Equities – Agribusiness
DWS Invest Global Agribusiness
We need to improve the efficiency in Agribusiness and invest in solutions to feed the planet. A two-
pronged investment approach via equity both upstream and downstream holds the key to generate a
superb risk-return profile for investors in our strategy.
Upstream Downstream
_ Fertilizer companies _ Protein producers (beef, chicken, pork)
_ Agricultural chemicals, _ Fishery & Aquaculture
_ Seed producers _ Packaged foods
_ Farm equipment _ Retail foods
_ machinery
_ Breweries and soft drink producers,
_ Restaurants
_ Supermarkets
Agribusiness Tech
Midstream
_ Data management (field monitoring)
_ Processors
_ Monitoring and communication
_ Distributors technology
_ Railways _ GPS Tracking
_ Port operators _ Precision AG (Irrigation, Planting,
Spraying)
As of: December 2019
Source: DWS International GmbH
/ 57For Professional Clients (MiFID Directive 2014/65/EC Annex II) only. No distribution to private/retail customers.
For Qualified Investors (Art. 10 Para. 3 of the Swiss Federal Collective Investment Schemes Act (CISA)).
Thematic Equities – Climate Technology
DWS Invest Climate Tech
We need to address the global climate change and invest in solutions that mitigate and adapt its
implications on the planet. A versatile investment approach via listed equity focusing on proprietary
climate change sector universe holds the key to generate a superb risk-return profile for investors.
Climate Change Impact Management Consumption of Energy
Health: Diseases/pest control, air Industry: Combined heat and power,
quality, environmental sensing advanced boilers, pumps, compressors
Agribusiness: Precision Ag, drip Buildings: Thermal insulation, building
irrigation, drought resistance plants automation, lighting systems
Water: Re-use/desalination, leak Vehicles: Hybrid & electric vehicles,
detection, Smart Water infrastructure battery technology, improved
Disaster Prevention/Recovery combustion engine technology
Transportation of Energy
Generation of Energy
Electricity transmission and distribution
Solar poly, wafer, module, inverter
Smart grid / Energy storage
Solar and wind farm developers/owners
Data management
Wind turbine manufacturers
Monitoring/communication technology
Hydro value chain / Waste-to-Energy
New Materials
As of: December 2018
Source: DWS International GmbH
/ 58Thematic Equities – Infrastructure
DWS Invest Global Infrastructure
Historical underinvestment and future investment gaps in infrastructure spending coupled with significant
structural drivers create investment opportunities. Infrastructure securities are backed by tangible
assets with sustainable inflation-linked underlying cash flows that can effectively diversify a multi-assets
portfolio. We invest in listed infrastructure companies that generates at least 70% of the operational cash
flow is from owning or leasing hard infrastructure assets.
The Opportunity “Pure-Play” Focus
_ Strong tailwinds from investor and “real world” _ Regulated Utilities: e.g. Water, electricity
demand networks
_ Communications: e.g. Mobile Towers, Satellites
_ Invest with the pioneer of the asset class – _ Energy: e.g. Oil and gas pipelines
“Pure Play” infrastructure
_ Ports: e.g. Sea ports, airports
_ Transportation: e.g. Rail roads, toll roads
Characteristics of Pure-Play
The Benefits Assets
_ “Pure play” infrastructure allows “smart access” to _ Focus on hard assets that provide efficient
the asset class movement of people and products
_ Stable & inflation linked cash flows and attractive _ Low pricing risk owing to fixed, contracted, or
income regulated revenue models
_ Perfect fit in a Multi-Asset-Portfolio _ Provision of essentials services such as water or
_ Complement to direct investments, allowing for power result in highly inelastic demand profiles
instant diversification & capital deployment _ Long-dated assets with perpetual lives, low
_ Long duration assets & cash flows operating costs which leads to high operating
margins
_ Sustainable performance and alpha
_ Inflation protection from inflation-adjusted
As of: December 2019 revenues
Source: DWS International GmbH
/ 59APÉNDICE For Professional Clients MiFID Directive 2014/65/EU Annex II) only. No distribution to private/retail investors. For Qualified Investors (Art. 10 Para. 3 of the Swiss Federal Collective Investment Schemes Act (CISA)). For institutional investors only. Further distribution of this material is strictly prohibited. APAC Australia: For professional clients only.
TACTICAL VIEW(2) & STRATEGIC FORECAST(3)
Level Tactical View Dec '20 F -1W YTD
Rates percentage points
GER 2yr -0.66 -0.60 -0.05 -0.06
GER 10yr -0.41 -0.35 -0.08 -0.23
GER 30yr 0.09 0.15 -0.10 -0.26
UK 10yr 0.52 0.95 -0.04 -0.34
UST 2yr 1.39 1.50 -0.11 -0.18
UST 10yr 1.56 1.85 -0.13 -0.32
UST 30yr 2.02 2.25 -0.11 -0.31
JGB 10yr -0.07 -0.10 -0.05 -0.06
Spreads basis points
EUR IG Corp 104 90 3 1
EUR HY 350 360 26 36
US IG Corp 96 110 4 5
US HY 382 400 26 52
EM Credit 317 320 10 9
EM Sovereign 313 320 11 17
Italy 10yr 135 150 -22 -25
Spain 10yr 68 70 0 2
Currencies
EUR vs USD 1.10 1.15 0.00 -0.02
USD vs JPY 108.90 105.00 -0.38 0.02
EUR vs GBP 0.84 0.89 0.00 -0.01
EUR vs JPY 120.12 121.00 -0.37 -1.84
GBP vs USD 1.31 1.29 0.00 0.00
USD vs CNY 6.94 7.10 0.00 -0.04
Equity* & Commodities
S&P 500 3,284 3,300 -0.4% 1.9%
Stoxx 600 414 420 -2.3% -0.6%
Euro Stoxx 50 3,674 3,770 -2.8% -2.0%
DAX 30 13,120 14,000 -3.4% -1.0%
SMI 10,734 10,450 -1.1% 1.1%
FTSE 100 7,321 7,510 -3.5% -3.5%
MSCI EM 1,073 1,120 -4.2% -4.1%
MSCI AC Asia xJ 662 700 -4.5% -4.1%
MSCI Australia 1,407 1,355 -1.1% 3.3%
MSCI Japan 1,015 1,060 -3.1% -2.2%
Gold 1,581 - 1,550 0.6% 4.3%
Crude Oil (WTI) 52 - 54 -3.7% -15.5%
The information herein reflects our current views only, is subject to change, and is not intended to be promissory or relied upon by the reader. There can be no certainty that events will turn out as we have
opined herein. Past performance is not a reliable indicator of future returns. Forecasts are not a reliable indicator of future returns. Forecasts are based on assumptions, estimates, opinions and hypothetical
models or analysis which may prove to be incorrect. *Relative to MSCI World Index, Sources: Bloomberg Finance L.P., DWS Investment GmbH as of 1/31/20 // (1) Outcome: A - above expectations, B - below
expectations, O - on expectations (2) = underweight; = neutral; = overweight // (3) F = Forecast
61DWS CONCEPT KALDEMORGEN
OPPORTUNITIES RISKS
_ Market, industry and company-specific price increases
on the equity markets.
+ _ At any time, the price of the shares can fall below the price
at which the investor acquired them (up to the risk of total loss).
-
_ Drops in yields or increases in prices in the bond markets and/or _ Market, industry and company-specific price fluctuations on the equity
reductions in yield spreads for high-yield securities. markets.
_ Opportunities for additional income through the use of derivative _ Interest rate, price and currency fluctuations in the bond markets. A
investment instruments. creditworthiness risk exists with regard to the issuers of bonds. In
general terms, this is the risk of over-indebtedness or insolvency, i.e.
the potential temporary or permanent inability to fulfil interest and/or
repayment obligations on schedule. This can have a negative impact
on the fund's performance.
_ Asset-backed securities may be less liquid than corporate debt; in
addition, there is the risk of early repayment, which can lead to
fluctuations in the unit price.
_ The use of derivatives involves counterparty risks, i.e. the
creditworthiness risk of the counterparties (see the above risk notice
on creditworthiness risk). Derivatives are subject neither to statutory
nor voluntary deposit insurance.
_ Investments in the commodities sector may be associated with illiquid
markets and high volatility.
_ The fund has the option of achieving leverage through the use of
derivatives. The use of leverage can result in the increase in potential
losses.
_ The fund can invest in assets with different currencies. This gives rise
to exchange rate risks, which may be hedged.
Source: DWS International GmbH
/ 62DWS TOP DIVIDENDE / DWS INVEST TOP DIVIDEND
OPPORTUNITIES RISKS
_ Market-, sector- and company-specific price gains + _ Market-, sector- and company-specific -
price volatility
_ Possible exchange- rate chances
_ Possible exchange-rate risk
_ Above-average dividend yields
_ Possible dividend cuts
_ Because of its composition or the techniques used by its
managers, the fund is subject to heightened volatility.
Consequently, unit prices may fluctuate sharply in either
direction within short periods of time.
_ The value of the fund's shares may fall below the price at
which the client originally bought them
Source: DWS International GmbH
/ 63DWS INVEST ESG EQUITY INCOME /
DWS TOP DIVIDENDE
OPPORTUNITIES RISKS
_ Market-, sector- and company-specific _ Market-, sector- and company-specific
price gains price volatility
_ Possible exchange- rate chances _ Possible exchange-rate risk
_ Above-average dividend yields _ Possible dividend cuts
_ Because of its composition or the techniques used by its
managers, the
fund is subject to heightened volatility. Consequently, unit
prices may fluctuate sharply in either direction within short
periods of time.
_ The value of the fund's shares may fall below the price at
which the client originally bought them.
Source: DWS International GmbH
/ 64DWS INVEST GLOBAL INFRASTRUCTURE
Opportunities and risks
OPPORTUNITIES RISKS
_ Increase in demand for infrastructure due + _ Market, industry and business-related price losses
-
to rising world population and urbanization
_ Exchange rate losses
_ Trends in increased mobile data use in developed countries-
particularly in the United States _ Stronger regulation in the field of infrastructure worldwide
_ Increased demand for the transport of goods, energy and _ Weakening of underlying trends (urbanization/mobile data
people; Due to economic growth and new technologies in use/higher transport needs of people and goods or of energy)
energy production _ Concentration risk: By concentrating on shares in the
_ Market, industry and business-related price increases infrastructure sector, there is a limited diversification within the
fund.
_ Exchange rate gains
_ The fund includes a significant amount of derivative
transactions with various Contracting Parties. If a Contracting
Party does not make any payments, for example due to
insolvency, this may cause the investment to suffer a loss.
Financial derivatives are not subject to the statutory or
voluntary deposit guarantee
_ Due to its composition/the techniques used by the fund
management, the Special Fund has a significantly increased
volatility, i.e., the share prices may also be subject to
significant fluctuations downwards or upward within a short
period of time.
_ The share value may at any time fall below the purchase price
at which the client has acquired the share.
Source: DWS International GmbH, as of: end of December 2019
/ 65DWS INVEST GLOBAL AGRIBUSINESS
Opportunities and risks
OPPORTUNITIES RISKS
_ Market, sector and company-specific _ Market, sector and company-specific
price gains price volatility
_ Possible exchange-rate risk
_ Because of its composition or the techniques used by its
managers, the fund is subject to heightened volatility.
Consequently, unit prices may fluctuate sharply in either
direction within short periods of time
_ The value of the fund's shares may fall below the price at
which the client originally bought them
As of: September 2019; source: DWS International GmbH
/ 66You can also read