BAI-Webinar: Auswirkungen der Corona Krise auf Private Debt - Chancen und Risiken - Bundesverband Alternative Investments
←
→
Page content transcription
If your browser does not render page correctly, please read the page content below

BAI-Webinar: Auswirkungen der Corona Krise auf Private Debt – Chancen und Risiken

Referenten:
Marcel Schindler, CEO Private Debt, StepStone Group
Dr. Jan Kuhlmann, Partner Corporate Private Debt, StepStone Group
                                                                                              13. April 2021

                                                                    Philipp Bunnenberg
                                                                    Marktanalyst/
                                                                    Referent

                                                                    Poppelsdorfer Allee 106
                                                                    53115 Bonn
                                                                    +49 (0) 228 96987-52
                                                                    bunnenberg@bvai.de
BAI – unser nächstes Webinar

     15. April 2021
                        Thema: Wie reagiert Private Equity in einem sich wandelnden Markt?
   11:00 – 12:15 Uhr

                       https://www.bvai.de/veranstaltungen/bai-webinare

                                                                                        2
Unser heutiger Kooperationspartner und BAI Mitgliedsunternehmen

                                                                  3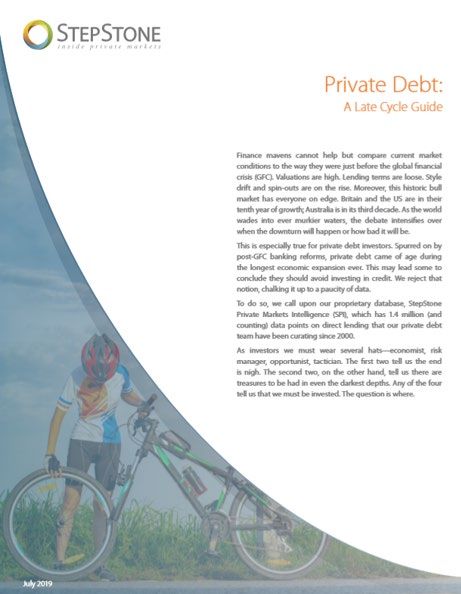
Sprecher

           Marcel Schindler ist der Swiss Capital alternative Investments AG vor über
           17 Jahren beigetreten. Zu Beginn des Jahres 2017 wurde diese komplett in
           die StepStone Group integriert und ist seither verantwortlich für die globale
           Private Debt Abteilung. Von 2004 bis 2016 war Herr Schindler zunächst
           COO, später CIO und ist seit 3 Jahren CEO StepStone Private Debt und
           Hedge Funds. Weiter ist Herr Schindler in verschiedenste Investment- und
           Managementaktivitäten involviert. Vor seiner Tätigkeit für StepStone hat
           Herr Schindler die Position als CFO bei einem öffentlichen Schweizer
           Finanzinstitut innegehalten. Der Fokus dieser Firma lag auf Equity
           Investments. Vorangehend war er Mitglied des Europäischen
           Risikomanagement Teams bei Arthur Andersen. Weiter hatte Herr Schindler
           sich in seiner Vergangenheit auf das kommerzielle Kreditgeschäft und die
           Hypothekarvergabe bei der UBS konzentriert.

                                                                                           4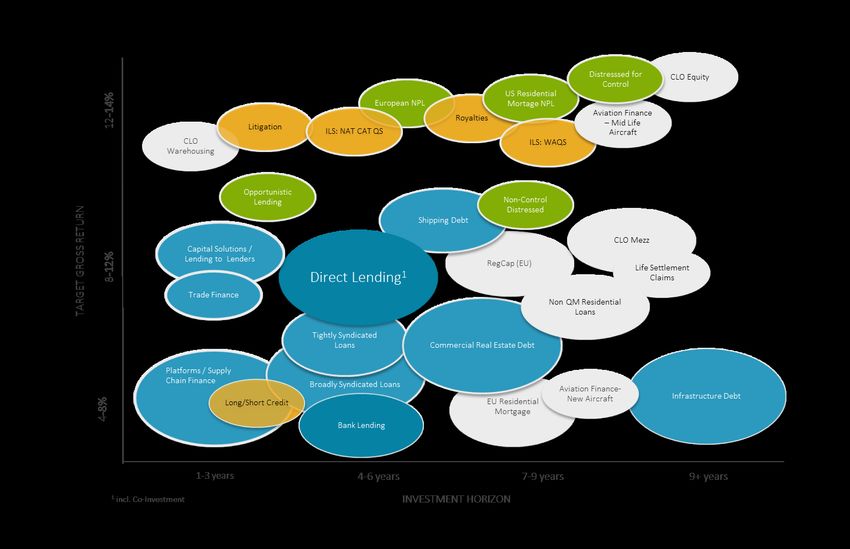
Sprecher

           Dr. Jan Kuhlmann ist Partner des Corporate Private Debt Teams und
           konzentriert sich auf Direct Lending Strategien in den USA und Europa. Vor
           seiner Tätigkeit bei StepStone war Herr Kuhlmann als Vice President bei MV
           Credit (fka MezzVest), einem Investor für Subordinated Debt. Davor arbeitete
           er für die Investmentbanking-Abteilungen der Credit Suisse und der
           Commerzbank in London und Frankfurt. Herr Kuhlmann hat einen Master und
           Doktortitel in Betriebswirtschaftslehre von der Universität Kiel.

                                                                                      5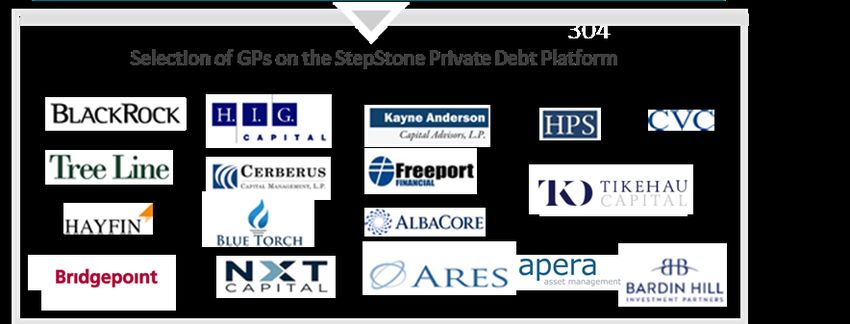
Kontakt

 Marcel Schindler                 Dr. Jan Kuhlmann
 StepStone Group                  StepStone Group
 mschindler@stepstoneglobal.com   jkuhlmann@stepstoneglobal.com
 +41 44 226 5248                  +41 44 226 5211

                                                                  6
EFFECTS OF COVID-19 ON
PRIVATE DEBT –
OPPORTUNITIES & RISKS
April 13, 2021

                     LP/Investor Advisor of
                           the Year
Disclosure
This document is meant only to provide a broad overview for discussion purposes. All information provided here is subject to change. This document is for informational
purposes only and does not constitute an offer to sell, a solicitation to buy, or a recommendation for any security, or as an offer to provide advisory or other services by
StepStone Group LP, StepStone Group Real Assets LP, StepStone Group Real Estate LP, StepStone Conversus LLC, Swiss Capital Alternative Investments AG and StepStone Group
Europe Alternative Investments Limited or their subsidiaries or affiliates (collectively, “StepStone”) in any jurisdiction in which such offer, solicitation, purchase or sale would be
unlawful under the securities laws of such jurisdiction. The information contained in this document should not be construed as financial or investment advice on any subject
matter. StepStone expressly disclaims all liability in respect to actions taken based on any or all of the information in this document. This document is confidential and solely for
the use of StepStone and the existing and potential clients of StepStone to whom it has been delivered, where permitted. By accepting delivery of this presentation, each
recipient undertakes not to reproduce or distribute this presentation in whole or in part, nor to disclose any of its contents (except to its professional advisors), without the prior
written consent of StepStone. While some information used in the presentation has been obtained from various published and unpublished sources considered to be reliable,
StepStone does not guarantee its accuracy or completeness and accepts no liability for any direct or consequential losses arising from its use. Thus, all such information is
subject to independent verification by prospective investors.
The presentation is being made based on the understanding that each recipient has sufficient knowledge and experience to evaluate the merits and risks of investing in private
market products. All expressions of opinion are intended solely as general market commentary and do not constitute investment advice or a guarantee of returns. All
expressions of opinion are as of the date of this document, are subject to change without notice and may differ from views held by other businesses of StepStone.
All valuations are based on current values calculated in accordance with StepStone’s Valuation Policies and may include both realized and unrealized investments. Due to the
inherent uncertainty of valuation, the stated value may differ significantly from the value that would have been used had a ready market existed for all of the portfolio
investments, and the difference could be material. The long-term value of these investments may be lesser or greater than the valuations provided.
StepStone Group LP, its affiliates and employees are not in the business of providing tax, legal or accounting advice. Any tax-related statements contained in these materials are
provided for illustration purposes only and cannot be relied upon for the purpose of avoiding tax penalties. Any taxpayer should seek advice based on the taxpayer’s particular
circumstances from an independent tax advisor.
Prospective investors should inform themselves and take appropriate advice as to any applicable legal requirements and any applicable taxation and exchange control
regulations in the countries of their citizenship, residence or domicile which might be relevant to the subscription, purchase, holding, exchange, redemption or disposal of any
investments. Each prospective investor is urged to discuss any prospective investment with its legal, tax and regulatory advisors in order to make an independent determination
of the suitability and consequences of such an investment.
An investment involves a number of risks and there are conflicts of interest. Please refer to the risks and conflicts disclosed herein.
Each of StepStone Group LP, StepStone Group Real Assets LP, StepStone Group Real Estate LP and StepStone Conversus LLC is an investment adviser registered with the
Securities and Exchange Commission (“SEC”). StepStone Group Europe LLP is authorized and regulated by the Financial Conduct Authority, firm reference number 551580.
StepStone Group Europe Alternative Investments Limited (“SGEAIL”) is an SEC Registered Investment Advisor and an Alternative Investment Fund Manager authorized by the
Central Bank of Ireland and Swiss Capital Alternative Investments AG (“SCAI”) is an SEC Exempt Reporting Adviser and is licensed in Switzerland as an Asset Manager for
Collective Investment Schemes by the Swiss Financial Markets Authority FINMA. Such registrations do not imply a certain level of skill or training and no inference to the contrary
should be made.
In relation to Switzerland only, this document may qualify as "advertising" in terms of Art. 68 of the Swiss Financial Services Act (FinSA). To the extent that financial instruments
mentioned herein are offered to investors by SCAI, the prospectus/offering document and key information document (if applicable) of such financial instrument(s) can be
obtained free of charge from SCAI or from the GP or investment manager of the relevant collective investment scheme(s). Further information about SCAI is available in the SCAI
Information Booklet which is available from SCAI free of charge.
All data is as of February 2021 unless otherwise noted.
PAST PERFORMANCE IS NOT NECESSARILY INDICATIVE OF FUTURE RESULTS. ACTUAL PERFORMANCE MAY VARY.

StepStone Group Overview

  StepStone is a global private markets investment
  firm offering customized solutions and advisory
                                                                                                                                      $
                                                                                                                                        333B                      $
                                                                                                                                                                   80B+                    $
                                                                                                                                                                                            50B+ 560+
                                                                                                                                      in private capital          assets under               annual               professionals
                                                                                                                                         allocations1
  and data services to our clients                                                                                                                               management1              commitments2

  Private Markets Access                                      Research Focused                                             Investment Strategies                                   Sophisticated Client Base
Comprehensive coverage across:                          StepStone annually conducts:3                                     Specialized teams covering:                             Creating solutions for:
• Private Equity                                        • 4,300 manager meetings                                          • Fund Investments                                      • Corporations
• Real Estate                                           • 340 investment committee                                        • Secondaries                                           • Defined Contribution Plans
• Infrastructure & Real Assets                             approvals                                                      • Co-Investments                                        • Endowments/Foundations
• Private Debt                                                                                                                                                                    • Insurance Companies
                                                        Market intelligence on over:
                                                                                                                                                                                  • Pension Funds
                                                        • 14,000 GPs
                                                                                                                                                                                  • Private Wealth/Family Offices
                                                        • 36,000 funds
                                                                                                                                                                                  • Sovereign Wealth Funds
                                                        • 61,000 companies

All dollars are USD.
1. $333B indicates total assets which includes $80B+ in assets under management as of December 31, 2020. Reflects final data for the prior period (September 30, 2020), adjusted for net new client account activity through
December 31, 2020. Does not include post-period investment valuation or cash activity.
2. StepStone approved over $50B+ in 2020. Represents StepStone-approved investment commitments on behalf of discretionary and non-discretionary advisory clients. Excludes clientele
that receive research-only, non-advisory services. Ultimate client investment commitment figures may vary following completion of final GP acceptance/closing processes.                               CONFIDENTIAL |          3
3. Last twelve months through December 31, 2020.
StepStone Private Debt Platform – Unique Sourcing
Capabilities & Flexibility
Broad sourcing capabilities with existing GP relationships, flexible SOURCING
allocations (no hard commitments) allow SSG to shift allocations to GPs
with strongest pipeline Established reputation since 1998
Largest manager selection and
PARTNERING WITH GP’S VIA STEPSTONE PLATFORM portfolio monitoring team in the
industry
GP Managed Secondary Co-Investment
Accounts Access to StepStone GP Managed
Transactions Transactions
(Primary Transactions) Accounts, Secondaries and Co-
> 25 GPs > 20 GPs > 30 GPs
Investments
DEAL FLOW ORGINATION
230+ # of transactions executed
on the platform last 12
months
$3’400m Total amount of executed
deals last 12 months
55+
# of direct lending GPs
FLEXIBILITY TRANSACTION approved on SSG platform
QUALITY from which deals are
sourced
TRANSPARENCY & YIELD
CONTROL GENERATION
Note: Manager references are for illustrative purposes only and do not constitute investment recommendations
Source: StepStone, last 12 months (LTM) through December 31, 2020.
CONFIDENTIAL | 4EDITORIAL
COVID-19 – LONGER THAN EXPECTED
In our first survey, early in the pandemic, we provided estimates of COVID-19 first order
impacts, observations from GPs and borrowers. To handle the unprecedented, we
created a framework with multiple scenarios.
Although the framework is still valid, the 1st order impacts differed from our
expectations. Not in the areas / sectors and borrowers where we expected the highest
impact, but in terms of ‘ripple effects’ on other sectors and the overall economy. This
was partially due to central bank interventions and fiscal stimulus as unprecedented as
the event itself.
Our update provides you with our most recent market observations, loan market data
and scenario analysis. We are convinced that COVID-19 will:
- Dominate our lives and behavior for longer than expected and
- Continues to drive fundamental market changes (the so-called 2nd order effects
discussed in our first survey) for business models (borrowers), GPs and investors
BACK TO NORMAL – AT LEAST ON THE SURFACE
Markets seem to be back to normal. At least on the surface, measuring transaction
flows and market pricing. Below the surface though, we see bifurcation, dispersion and
fundamental changes in all areas:
- Bifurcation of sectors and borrowers. The lower tier will struggle to be financed by
‘traditional’ markets or methods and needs alternatives
- Dispersion among GPs, affected differently in their existing portfolios, ability to raise
capital and to source deals
- Lower rates for longer and increased valuations (for how long?) ‘forcing’ investors to
continue their hunt for yield
CONFIDENTIAL | 5A LATE CYCLE GUIDE
WHITE PAPER FROM JULY 2019
The current credit cycle may be long in the tooth, but investors in private debt don’t
need to panic. Spurred on by banking reforms after the GFC, direct lending has
emerged as a stalwart asset class, delivering attractive yields across the cycle—but
STEPSTONE PRIVATE DEBT RESEARCH
there are a few GPs who have been investing in this space since at least 2000. In
uncertain times, experience matters.
Even in the face of an impending downturn, direct lending may be a beacon of hope.
Like any investor, we believe strongly in the value of having a disciplined commitment
to our due diligence process. We find the value of limiting risk and reducing the
variance of outcomes to be well worth the effort. Diversification, remaining invested,
credit quality, and insisting upon covenants are critical disciplines to maintain late in
the cycle.
COVID-19 MARKET SURVEY
RESEARCH FROM MAY 2020
In response to the COVID-19 pandemic, and in addition to previous market updates,
StepStone has undertaken a comprehensive analysis of the direct lending market.
The analysis is based on StepStone’s database and research, discussions with lending
participants, GPs and banks, and analysis of individual borrowers, as well as external
research studies.
Building out our private debt database over several years has proven to be very
valuable, especially in a situation like this. We believe that our database, which has
data on more than 15,000 loans, provides us with a significant advantage in assessing
the broader market impact and its consequences.
CONFIDENTIAL |
The opinions expressed herein reflect the current opinions of Stepstone as of the date appearing in this material only. There can be no
assurance that views and opinions expressed in this document will come to pass. Diversification does not ensure from market loss.
6STEPSTONE PRIVATE DEBT DATABASE
DATA – PRIVATE MARKETS INTELLIGENCE
BROAD MARKET COVERAGE AND EXTENSIVE PRIVATE
DEBT DATABASE 1
1’565+ Private Debt General Partners
23’963+ # of Private Debt Investments
3’826+ # of Private Debt Funds
459+ # of Private Debt Fund Summaries
CONFIDENTIAL |
Source: StepStone as of December 2020
1. StepStone Private Markets Intelligence Database (SPI™) provides extensive analytics, increased transparency and enhanced insights. Data since inception as of February 2021 7PRIVATE DEBT MARKET OBSERVATIONS
Resilience of Corporate Private Debt through Crisis

 PRIVATE DEBT MARKET RESILIENCY

                                      GFC PERFORMANCE                                                                                                     COVID PERFORMANCE

120                                                                                                              120

110                                                                                                              115

100                                                                                                              110

 90                                                                                                              105

 80                                                                                                              100

 70                                                                                                                95

 60                                                                                                                90
  Dec-06          Jul-07         Dec-07         Jun-08         Dec-08          Jun-09        Dec-09                 Dec-18                       Jul-19                     Dec-19                    Jun-20

              Cliffwater Direct Lending Index               Credit Suisse Levered Loan Index                                      Cliffwater Direct Lending Index               Credit Suisse Levered Loan Index
              Credit Suisse High Yield Index                                                                                      Credit Suisse High Yield Index

 MAXIMUM DRAWDOWN
                                                                                                                           OBSERVATIONS

                                                                                                                        • Direct lending exhibited robust performance in both the GFC
        MARKET
        PRIVATE

                                              -4,8%                                         COVID-19
                    Cliffwater DL                                                                                         and COVID environment
                         Index                     -7.7%                                    GFC

                                                                                                                        • In both periods, private debt experienced significantly lower
                                                            -13.2%
                      CS LL Index                                                                                         drawdowns relative to the traded public markets
        MARKET

                                                                                        -29.9%
        PUBLIC

                                                             -13.9%
                                                                                                                        • Even in periods of stress, private debt provided relatively
                     CS HY Index
                                                                                   -26.9%                                 smooth returns without creating excessive volatility

Source: all the data is as of Q4 2020
Syndicated loans data is based on Credit Suisse Leveraged Loan Index; High yield bonds data is based on Credit Suisse High Yield Index; Direct Lending data is based on Cliffwater Direct Lending   CONFIDENTIAL |   9
Index
Private Markets Attractive on a Relative Value Basis
CORPORATE DIRECT LENDING REMAINS ATTRACTIVE – YIELD PREMIUM PRIVATE VS. PUBLIC MARKET
4%
PRIVATE MARKET
MORE ATTRACTIVE 2%
0%
-2%
-4%
PUBLIC MARKET -6% • Record level yield differential
MORE ATTRACTIVE
between Private & Public Market
-8%
• Private Market more attractive on a
-10% relative value basis
-12%
Mar-05 Mar-07 Mar-09 Mar-11 Mar-13 Mar-15 Mar-17 Mar-19
Yield Difference Between DL and SL Yield Difference Between DL and HY
ASSET CLASS ENTRY YIELD DIFFERENCE VS DL
OBSERVATIONS
Direct Lending1 8.3% n/a • Public markets are relatively expensive due to unprecedented
monetary and fiscal stimulus activity
Syndicated Loans2 5.1% 3.2% • On a relative value basis, private markets reached historical highs
High Yield2 4.6% 3.7%
versus public markets
Source: Data as of Q4 2020. Historical yields are based on StepStone internal database for direct lending and on Credit Suisse Leveraged Loan Index and on Credit Suisse High Yield Index for
Syndicated Loans and High Yield Bonds, respectively CONFIDENTIAL | 10
1 Direct Lending yields are the weighted average yield of the deals which were originated in Q4 2020 and in which StepStone has invested
2 For syndicated loans and HY bonds, traded yields are presented as the investors would enter the market at those yieldsCoporate Direct Lending - Yields and Risk Parameters through
COVID-19
PRIMARY MARKET YIELDS – SPIKE CONTAINED BY ‘SEARCH FOR YIELD’
9,2%
9,0% 9,0%
8,8% 8,8%
Primary Yields
DEPLOYMENT
8,6%
8,4%
8,3%
8,2%
8,1%
8,0%
7,8% 7,8%
7,6%
Dec-19 Mar-20 Jun-20 Sep-20 Dec-20
LTV & LEVERAGE – COVID-19 PROVIDED LENDER WITH STRONGER NEGOTIATION POWER FOR A SHORT WHILE
48% 4,0
46% 4,0
45% 3,9
45% 45% 44%
44% 3,9
3,9
Risk Parameters
42% 3,9
40% 3,8
38% 3,8
3,7
36% 3,7
35%
34% 3,7
3,7
3,6
32% 3,6
30% 3,6
Dec-19 Mar-20 Jun-20 Sep-20 Dec-20 Dec-19 Mar-20 Jun-20 Sep-20 Dec-20
Source: StepStone, as of Q4 2020; presented stats are based on the deals in which StepStone is invested in CONFIDENTIAL | 11Corporate Direct Lending Dispersion through COVID-19
(US and Europe combined)
DEPLOYMENT DISPERSION RETURN DISPERSION
90%
80%
70%
60%
50%
40%
30%
20%
10%
0%
Q1 2020 Q2 2020 Q3 2020 Q4 2020
-10%
GP 1 GP 2 GP 3 GP 4 GP 5 GP 6
GP 7 GP 8 GP 9 GP 10 GP 11 GP 12
GP 13 GP 14 GP 15 GP 16
CONFIDENTIAL | 12
Source: StepStone, as of Q4 2020;Development of Transaction Characteristics —
Expectations & Outlook on Sr. Corporate Direct Lending
STEPSTONE EXPECTATIONS IN
WHAT HAPPENED OUTLOOK FOR 2021
APRIL 2020
• Generally, StepStone believes that • We are tracking the market • There is still significant uncertainty in
COVID-19 may move the pendulum developments closely and discussing the market about future developments
back from ‘borrower friendly’ to the expectations for 2021 with our GPs as the crisis may have further downlegs
‘lender friendly’
• Newly originated transactions increase • Some yield gains in the US, partly given • Yields further tighten back to pre-COVID
of 150–250bps of gross asset yield back; little flexibility in the EU levels in the US and remain fairly
depending on borrower constant in the EU
PRICING characteristics • However, yield for severely impacted
• Performing secondaries expected to borrowers will likely be wider once they
be offered more frequently and are able to access the market again
priced to yield in the low to mid-teens
• Newly originated transactions based • LTV and leverage levels relatively • Structuring and documentation in
on more conservative forecasts (e.g., unchanged in the US; leverage levels general to revert to pre-COVID trends
EBITDA adjustments) and credit significantly lower in the EU at the
metrics (e.g., level of leverage, outset but more competitive again
DOCUMENTATION covenants) • Amended documentation benefitted
UNDERWRITING • Required amendments on documents from stricter terms and often additional
STANDARDS expected to become more restricted covenants
• Newly originated transactions: default • Q3: # of impairment charges have • Expectation of further reduction of built
rates likely not below average due to further reduced provisions; some borrowers continue
tighter structures (e.g., covenants, • Charges on a small number of through the process of being
covenant headroom) individual borrowers had to be restructured
• Loss rates of COVID-vintage expected increased
EXPECTED
DEFAULT AND to be below long-term average • The two contrasting developments
LOSS RATES cancel each other out
Source: StepStone, as of January 2021
CONFIDENTIAL | 13Senior Corporate Lending Transaction Characteristics —
US vs. EU
OBSERVED CHANGES ACROSS REGIONS
• The table illustrates the changes in the US and EU direct lending • Overall, it shows that direct lending GPs were initially more
transaction characteristics. It depicts the early changes until the conservative in their structuring approach and asked for higher risk
end of August, i.e., just after the transaction volume picked up premia; however, due to the competitive nature of the market in
again in July and the changes through to end of December the latter part of the year, especially Q4, these gains in terms of
lender-friendliness were somewhat eroded
• In the US initially the yields picked up quite considerably by 1.21
percentage points. This gain was halfway given back to the market • In contrast, in the EU, yield remained constant throughout the year
by the end of the year compared with the pre-COVID period
• LTVs and leverage levels remained fairly constant • The structuring approach changed, however, with European GPs
structuring with significantly lower leverage levels. Nonetheless,
• Included # of transactions in the analysis:
these gains were also partly given back to the market through the
− Pre-2020: 391 (US: 289 / EU 102) latter half of 2020
− 2020: 292 (US: 192 / EU 100) • An interesting increase in permitted EBITDA adjustments may point
• Further, accepted levels of EBITDA adjustments dropped quite towards European lenders being willing to allow certain COVID add-
significantly by 17.8 percentage points through August although backs during the earlier transactions; a stance that on average has
this gain was also largely lost by the end of December reverted to pre-COVID levels by the end of the year
YIELD LTV LEVERAGE EBITDA ADJUSTMENTS
US EU US EU US EU US EU
Changes through
1.21% 0.09% -1.85% -1.80% -0.10x -0.93x -17.80% 9.82%
August
Changes through
0.60% -0.12% 1.28% -0.63% 0.06x -0.39x -6.57% -0.15%
December
Source: StepStone Platform as of December 2020. The opinions expressed herein reflect the current opinions of Stepstone as of the date appearing in this material only. There can be no CONFIDENTIAL | 14
assurance that views and opinions expressed in this document will come to pass.WINNERS & LOSERS?
LARGER GPS WITH LONGER
TRACK RECORD
PUBLIC
BANKS? MARKETS?
SMALLER GPS / FIRST TIME
FUNDS
Confidential | 15
Source: Refinitiv LPC as of January 2021Private Debt - GP Fundraising
GLOBAL PRIVATE DEBT FUNDRAISING
250 150 • 200 private debt funds reached a final close,
raising an aggregate $118 billion, down from the
Aggregate Capital Raised ($bn)
No. of Funds Closed
200 120 $132 billion raised in 2019
150 90
• The majority of capital raised by private debt
100 60 funds in 2020 is focused on North America
50 30
• Funds targeting the region accounted for 63% of
0 0 total capital raised (a 12 percentage-point
2001
2002
2003
2004
2005
2006
2007
2008
2009
2010
2011
2012
2013
2014
2015
2016
2017
2018
2019
2020
increase on 2019)
No. of Funds Closed Aggregate Capital Raised ($bn)
CAPITAL RAISED BY THE LARGEST PRIVATE DEBT FUNDS
100%
• Another result of the pandemic is compounded
capital consolidation
Proportion of Aggregate Capital Raised
90%
80%
• Larger funds have become even more prevalent
70%
in the private debt space, and the 10 largest funds
60%
accounted for 39% of the capital raised in 2020, up
50%
40%
from 31% in 2019
30%
• At the other end of the scale, funds outside of
20%
the top 50 constituted only 21% of aggregate
10%
capital raised, a fall of four percentage points on
0%
2011 2012 2013 2014 2015 2016 2017 2018 2019 2020 the previous year
Top 10 11-20 21-50 Outside Top 50
Source: Preqin Private Debt Report February 2021 CONFIDENTIAL | 16INDUSTRY / BORROWER BIFURCATION
AVERAGE EBITDA GAIN + 22.1%
eCommerce
COVID BUMPS
Semiconductors
(6%)
Electricity producers
Paper and forest products
Comm. Equipment
Household products
Etc.
AVERAGE EBITDA DROP -1.5%
NO IMPACT
Food
(42%)
Utilities
Air fright
Logistics
Etc.
AVERAGE EBITDA DROP -24.3%
RECESSION IMPACT
Machinery
Electrical Equipment
(42%)
Media
Auto Components
Textiles
Luxury Goods
Etc.
AVERAGE EBITDA DROP -62.4%
COVID IMPACT
Airlines
Hotels, Restaurants & Leisure
(10%)
Entertainment
Mortgage REITs
Oil & Gas
Etc.
Confidential | 17
Source: StepStone as of Q3 2020
.Direct Lending — Rating Migrations by Impacted
Industry Segment
CREDIT RATINGS FOR INDUSTRIES WITH COVID IMPACT CREDIT RATINGS FOR INDUSTRIES WITH RECESSION IMPACT
Lower tier
exposure Upper tier
70% increased 66% 60% 56% 57%
exposure
Upper tier significantly decreased
60% exposure is 50% significantly
almost gone 50%
50% 46%
40% 36%
39%
40%
29% 30%
30% 23%
18%
20%
20% 13%
10% 10%
2%
0% 0%
Upper Tier Exposure Mid Tier Exposure Lower Tier Exposure Upper Tier Exposure Mid Tier Exposure Lower Tier Exposure
Q4 2019 Q3 2020 Q4 2019 Q3 2020
CREDIT RATINGS FOR INDUSTRIES WITH NO IMPACT CREDIT RATINGS FOR INDUSTRIES WITH COVID BUMPS
No significant change in the average
80% credit quality for the industry with 80%
68% moderate impact Upper tier 69%
70% 70%
exposure
60% 55% 60% increased 56%
50% 50%
40% 40%
27% 30%
30% 30% 23% 23%
19% 17% 19%
20% 20% 11%
10% 10%
0% 0%
Upper Tier Exposure Mid Tier Exposure Lower Tier Exposure Upper Tier Exposure Mid Tier Exposure Lower Tier Exposure
Q4 2019 Q3 2020 Q4 2019 Q3 2020
Source: StepStone invested StepStone deals and the as of date is November 2020 CONFIDENTIAL | 18Various Outcomes for Provisioned First Lien Loans – Example
ACCOUNTING LOSS TO FULL RECOVERY AFTER FULL REPAYMENT
EQUITY UPSIDE COMPANY SALE DESPITE PROVISION
Borrower Borrower Borrower
• Provider of rental equipment, labor, • Provider of in-store/ -restaurant • Global provider of loyalty/ reward
production management, and other background music and marketing program services, customer
products for events and trade shows solutions engagement solutions and insurance
brokerage services
Situation that led to provision Situation that led to provision
• Poorly integrated acquisition causing • Non-essential stores and restaurants Situation that led to provision
underperformance ahead of COVID closures due to COVID leading to • Sustained reduction in travel volumes
• COVID basically shut the business down significant drop in revenues and cancellation of bookings impacted
and company ran out of liquidity • Liquidity issues resulted in PIK’ing of 50% of the business’ revenues
despite significant cost reductions interest and need for restructuring • Leverage spiked but no liquidity issues
due to sponsor cash injection
• Loan marked down from 70 to 50 to 35 • Built provision and held loan at 90% of
over the first three quarters par value of the loan • Built provision and held loan at 68% of
par value based on recovery
Main steps of the process Main steps of the process expectations
• A restructuring was completed in • Shareholders and junior lenders
which agreed to a consensual restructuring in Main steps of the process
which • No restructuring was necessary
− Lenders provided fresh liquidity
• Sponsor was able to refinance the debt
− Converted c. 68% of the original − junior lenders lost their investment
leading to full early repayment
loan tranche into equity in return for warrants on the equity
− Senior lender took over the equity Ultimate outcome
Ultimate outcome of the business (held at 75% of par) • Received prepayment penalties of 3%
• Lenders control the equity • Received make-whole interest for non-
• Based on current valuation, expected Ultimate outcome call features of c. 2%
recovery on the original debt is c.43%* • Senior lender was able to sell the • Resulting in full recovery and
business leading to full recovery annualized IRR of 11.9% on the original
• Significant upside remains through the
• Creating an annualized IRR for this debt tranche
equity holding in case of recovery of
investment of 10.4%
performance**
* Excluding fresh liquidity provided by lenders
** Lenders receive c. 85% of the first level of equity proceeds and 50% thereafter CONFIDENTIAL | 19
Past performance is not necessarily indicative of future results and there can be no assurance that the investment will achieve comparable results or avoid substantial losses.
Source : GP Information as of February 2021PRIVATE DEBT - RISK SCENARIOS
COVID-19: Updated Stress Scenario Assumptions for
Senior Corporate Lending Portfolios issued PRE COVID

                                                                        BASE CASE SCENARIO                                                                                           BAD CASE SCENARIO
                                           •    No full lock downs need to be imposed. Broad economic activity                                       Reasons that could lead to a worse outcome are:
                                                below summer activity but above spring level. COVID depressed                                        • Winter lockdowns need to be harsher than currently expected and
                                                sectors remain depressed                                                                                closer to spring situation than summer (bigger activity declines in Q4
                                           •    Vaccination of high risk and systemic relevant individuals starts in                                    and Q1)
                                                January. No setbacks in production, due to side effects or                                           • Vaccination campaign slower than currently projected or virus mutates
                                                distribution issues. Critical part of population vaccinated by end of                                   to a degree where current vaccines are not fully effective
              Scenario                          Q1                                                                                                   • Damage to economies more substantial than currently expected (e.g.,
                                           •    Government fiscal and CB monetary support remains                                                       more defaults and higher job losses) and recovery
                                                accommodative enough to prevent large scale defaults and layoffs
                                           •    After Q1 (warm weather, vaccination) even depressed sectors are
                                                allowed to operate more normally. Normal course of business
                                                possible mid 2021

                                                     Q4                                                                                                             Q4
                                                               Q1                                      Q2      Q3      Q4                                                    Q1                                       Q2          Q3   Q4
ASSUMPTIONS

              Economic Activity                                        Q2     Q3      Q4      Q1                                                                                      Q2      Q3
                                                                                                                                                                                                      Q4       Q1
              / GDP

                                                                             2020                            2021                                                                             2020                            2021

                                                           COVID impact                                -32%                                                        COVID impact                                            -47%

              EBITDA                                                                               -18%
                                                      Recession impact                                                                                          Recession impact                                    -27%
              (additional
              from                                            No impact                    -3%                                                                         No impact                         -6%
               Q3 2020)
                                                          Positive impact     +20%                                                                                Positive impact       +31%

              Default Rate                                                           6.7%                                                                                                               11.0%

              Recovery Rate                            65%, 70%, 75%, 90% (according to 4 industry groups)                                                      50%, 65%, 70%, 90% (according to 4 industry groups)
                                                                                                                                                                                                                                  CONFIDENTIAL |          21
Source: StepStone as of December 2020
For illustrative purposes only. The opinions expressed herein reflect the current opinions of Stepstone as of the date appearing in this material only. There can be no assurance that views and opinions expressed in this document will come to pass.
Hypothetical Stress Scenario for Senior Corporate
Lending Portfolios issued PRE COVID: BASE CASE
HYPOTHETICAL RISK RETURN PROFILE : 2020-2022
Impairment Charges: Impairment Charges: Impairment Charges:
1.5x Realized Loss 2x Realized Loss 2.5x Realized Loss
Annualized Return 4.8% 4.8% 4.8%
Max DD -2.1% -2.1% -2.1%
Annualized Loss NAV & REALIZED / UNREALIZED LOSS RATES
-1.2% -1.2% -1.2%
Rate
120 20%
Q1 - Q3 2020
2020 2,2% 2020 2,2% 2020 2,2%
115 15%
2021 6,6% 2021 6,6% 2021 6,7%
Total Net Return
110 10%
2022 5,9% 2022 5,8% 2022 5,8%
105 5%
100 0%
PEAK SCENARIO - DEFAULT & LOSSES
95 -5%
No Stress Scenario
Sep. 20
Sep. 21
Sep. 22
Mar. 20
Mar. 21
Mar. 22
Dec. 19
Jun. 20
Dec. 20
Jun. 21
Dec. 21
Jun. 22
Dec. 22
stress ‘Base Case’
Expected Loss* 0.8% 1.6%
2020 - 2022 NAV Range Cumulative Interest Return
Default Rate 2.9% 6.7%
Unrealized Loss (2x the Realized Loss) Realized Loss
Expected
Impairment - 2.4– 4.0%
Change
*expected peak loss rate over 12 month stress period
Source: StepStone as of December 2020. The following model is entirely hypothetical and an illustration of returns that could be earned if the assumptions specified above occurred. Investors are advised that actual returns
could vary significantly from those shown herein. Any return contained herein is hypothetical and is not a guarantee of future performance. The returns set forth herein do not constitute a forecast; rather they are
indicative of the internal transaction analysis regarding outcome potentials. Any returns set forth herein are based on the belief about the returns that may be achievable on investments that the it intends to pursue. Such
CONFIDENTIAL | 22
returns are based on the current view in relation to future events and financial performance of potential investments and various models and estimations assumptions made, including estimations and assumptions about
events that have not occurred. Actual events and conditions may differ materially from the assumptions used to establish returns and there is no guarantee that the assumptions will be applicable to the investments.Hypothetical Stress Scenario for Senior Corporate
Lending Portfolios issued PRE COVID: BAD CASE
HYPOTHETICAL RISK RETURN PROFILE : 2020-2022
Impairment Charges: Impairment Charges: Impairment Charges:
1.5x Realized Loss 2x Realized Loss 2.5x Realized Loss
Annualized Return 3.9% 3.9% 3.9%
Max DD -2.1% -2.1% -2.1%
Annualized Loss NAV & REALIZED / UNREALIZED LOSS RATES
-2.0% -2.0% -2.0%
Rate
120 20%
2020 1,5% Q1 - Q3 2020
2020 1,3%
2020 1,2%
2021
115 15%
3,7% 2021 3,5% 2021 3,3%
Total Net Return
2022 6,9%
2022 7,2% 110 10%
2022 7,5%
105 5%
PEAK SCENARIO - DEFAULT & LOSSES 100 0%
No Stress Scenario 95 -5%
Sep. 20
Sep. 21
Sep. 22
Mar. 20
Mar. 21
Mar. 22
Dec. 19
Jun. 20
Dec. 20
Jun. 21
Dec. 21
Jun. 22
Dec. 22
stress ‘Bad Case’
Expected Loss* 0.8% 3.3%
2020 - 2022 NAV Range Cumulative Interest Return
Default Rate 2.9% 11.0%
Unrealized Loss (2x the Realized Loss) Realized Loss
Expected
Impairment - 4.9 – 8.2%
Change
*expected peak loss rate over 12 month stress period
Source: StepStone as of December 2020. The following model is entirely hypothetical and an illustration of returns that could be earned if the assumptions specified above occurred. Investors are advised that actual returns
could vary significantly from those shown herein. Any return contained herein is hypothetical and is not a guarantee of future performance. The returns set forth herein do not constitute a forecast; rather they are
indicative of the internal transaction analysis regarding outcome potentials. Any returns set forth herein are based on the belief about the returns that may be achievable on investments that the it intends to pursue. Such
CONFIDENTIAL | 23
returns are based on the current view in relation to future events and financial performance of potential investments and various models and estimations assumptions made, including estimations and assumptions about
events that have not occurred. Actual events and conditions may differ materially from the assumptions used to establish returns and there is no guarantee that the assumptions will be applicable to the investments.INVESTMENT IMPLICATIONS
Investment Implications
MARKET ENVIRONMENT
MONETARY (FOR LONGER THAN EXPECTED)
FISCAL
INTERVENTIONS
STIMULUS
ELEVATED EQUITY VALUATIONS LONG-TERM LOW INTEREST RATE ENVIRONMENT LOAN DEFAULTS LIKELY TO INCREASE FURTHER
EXPECTED CHANGES AND CHALLENGES
RELATIVE ATTRACTIVENESS
• Relative attractiveness of Private vs
Public Market
• But at lower yields / returns
GP’S / SUPPLY LP’S / DEMAND
• Withdrawal of banks & public • Long-term liability funding gap continued
markets (market growth) Diversification (multi-credit-GP to drive search for yield
• New funding gaps and investment • Increase in private debt allocation /
portfolio construction)
opportunities (more complex) systematic integration into SAA / risk
• Industry consolidation and Cost / Deployment efficiency mgmt. / M&R
institutionalization (larger funds / • Consolidation of providers
Time to market implementation
lower returns?) • Openness for new investment concepts
• Sourcing / fee pressure Transparency / customized M&R • Return expectations (private equity vs.
• Portfolio & borrower restructurings fixed income driven allocations)
CONFIDENTIAL | 25
For illustraive purposes only
Source: StepStone as of January 2021
.Return Projections (5y) across Asset Classes
Expected Annualized Return
-15% -10% -5% 0% 5% 10% 15% 20% 25% 30% 35% 40%
U.S. private equity (buyout)
Direct Lending
Direct lending
U.S. real estate
Hedge funds (global)
Infrastructure debt
Europe equities
China A shares
EM equities
China equities
U.S. Small cap
U.S.Equities
U.S. equities
Global 60/40 portfolio
High yield
Local EM debt
China government bond
USD EM debt
Ination-linked bonds
Agency MBS
Aggregate bonds
Credit
Government bonds
ExU.S. gov. bonds
Credit (10+ years)
Government Bonds
Long government bonds
Historical long-term return (15y, annualized)
Expected annualised return as of Sep 2020 Range from mean uncertainty lower to mean uncertainty upper return Range from interquartile lower/upper to mean uncertainty lower/upper return
CONFIDENTIAL | 26
Source: Blackrock Capital Market assumptions and uncertainty, return time period selected for expected annualized returns: 5years as of February 2021Portfolio Construction — Multi-Credit Opportunities
Scenario to materialize will determine the mix and timing of the portfolio (deployment speed & entry levels)
OPPORTUNISTIC
CORE
Short-term tactical opportunities have
Direct lending is driven by demand gone from the market. However, we see
and supply in the lending space. an attractive opportunity set and
Alternative lenders will continue investment topics over the mid to long
profiting from: term.
• The continued bank
disintermediation MID TO LONG-TERM OPPORTUNITIES
• The retreat of ‘public / traded’ • Primarily dependent on the
markets in the high yield space fundamental development and
• A consolidation across the industry accordingly the scenario.
• These will drive ultimate defaults and
recoveries
• Fiscal programs influence overall
impact and especially recovery times
(IRRs).
DIVERSIFICATION
Multi-credit approach enhance the
portfolios by creating diversification in
terms of:
• Risk / return profile
• Deployment and re-investment
• Real estate and infra debt
• Other lending strategies ….
CONFIDENTIAL | 27
For illustrative purposesPrivate Debt — Returns, Investment Horizon & Portfolio
Construction
The broad range of strategies in private debt provides the building blocks to construct diversified portfolios with
different risk profiles that is optimally adjusted to the various stages of the credit cycle
STRATEGY FUNCTION
CORE CARRY
CAPITAL GAIN, RETURN
CYCLICAL
ENHANCEMENT
LOW / NON- DIVERSIFICATION, RETURN
CORRELATED SMOOTHENING
1 includes Co-Investment
Note: Bubble size represents deployment capacity (small, mid, large). Target returns are hypothetical and are neither guarantees nor predictions or projections of future performance. Future performance indications CONFIDENTIAL | 28
and financial market scenarios are no guarantee of current or future performance. There can be no assurance that such target gross IRRs will be achieved or that the investment will be able to implement its
investment strategy, achieve its investment objectives or avoid substantial losses. Further information regarding IRR calculation is available upon request. Gross IRR will ultimately be reduced by management fees,
carried interest, taxes, and other fees and expenses. Data as of December 2019Private Debt Risk/Return Spectrum — Multi Credit
Portfolio Construction
16%
14% Corp Distressed • The private debt universe
consists of a broad spectrum
of sub-asset classes and
12% strategies
Corp Opportunistic
Lending • This allows the construction
10% Opportunistic
of optimal portfolios across
a wide range of risk and
Net Return
8% return
Capital Solutions
Lower MM Direct Loans • Optimal portfolios are
6% Enhanced Credit Mid MM Direct Loans RE Debt Mezz shown as an efficient
Upper MM Direct Loans frontier where stress loss1 is
Trade Finance
4% Corp Bank Debt used as risk dimension
RE Debt WL
Absolute Return
INFR Debt BB
• Suggested portfolios take
2% RE Debt Senior
INFR Debt BBB qualitative diversification
INFR Debt A Supply Chain Finance
Optimal Portfolios
aspects into account
RE Debt Super Senior
0%
0% 1% 2% 3% 4% 5% 6% 7% 8% 9% 10%
Stress loss
1. Stress loss = peak realized credit loss over a 12 months period
Source: StepStone as of February 2021
Target returns provided by fund managers are hypothetical and are neither guarantees nor predictions or projections of future performance. Future performance indications and financial market scenarios are no guarantee of
current or future performance. There can be no assurance that such target IRRs will be achieved or that the investment will be able to implement its investment strategy, achieve its investment objectives or avoid substantial CONFIDENTIAL | 29
losses. Stepstone does not assume any responsibility for fund manager's methodology in determining target returns. Investors should be aware that different methodologies could result in different returns. Further
information regarding target IRR calculation is available upon request.Multi-Credit Model Portfolios — To Meet Specific Client
Needs
OPPORTUNISTIC ENHANCED CREDIT ABSOLUTE RETURN
Corp Debt Bank
10% Corp Debt Direct Corp Debt Direct Lending
20% Lending 15% Lending 20%
Corp Debt Opp Alternative Lenders 30% Supply Chain Finance
20% Lending 40%
15% Trade Finance 1
Corp Debt Distressed Real Estate Debt IG
20%
Real Estate Debt WL
30% Multi Credit Co-Invest 10% Infra Debt IG
20% & Secondaries 2
20% Infra Debt Sub IG 30%
Real Estate Debt
Mezz
PORTFOLIO CHARACTERISTICS PORTFOLIO CHARACTERISTICS PORTFOLIO CHARACTERISTICS
• Target Return +9% • Target Return 5–6% • Target Return 2.5–3%
• Cash Distribution 4–5% p.a. • Cash Distribution 5–6% p.a. • Cash Distribution 2.5–3% p.a.
• Drawdown Risk 4.7% • Drawdown Risk 1.9% • Drawdown Risk 0.5%
The portfolio is focused on sub The portfolio is broadly diversified across The portfolio consist of investment grade
investment grade corporate and real private debt assets. A big portion of the and investment grade like debt
estate credit assets. Strong emphasis is returns are generated in the form of instruments across all asset classes. The
put on opportunistic investments, income. focus is on reliable income generation
secondaries and co-investments. with low credit loss potential.
1 Includes strategies as lending to lenders, claims and litigation finance, ABL strategies CONFIDENTIAL | 30
2 Includes regulatory capital trades,
Source: StepStone as of January 2021Risks and Other Considerations
Risks Associated with Investments. Identifying attractive investment opportunities and the right underlying fund managers is difficult and involves a high degree of uncertainty. There is no
assurance that the investments will be profitable and there is a substantial risk that losses and expenses will exceed income and gains.
Restrictions on Transfer and Withdrawal; Illiquidity of Interests; Interests Not Registered. The investment is highly illiquid and subject to transfer restrictions and should only be acquired by an
investor able to commit its funds for a significant period of time and to bear the risk inherent in such investment, with no certainty of return. Interests in the investment have not been and will
not be registered under the laws of any jurisdiction. Investment has not been recommended by any securities commission or regulatory authority. Furthermore, the aforementioned authorities
have not confirmed the accuracy or determined the adequacy of this document.
Limited Diversification of Investments. The investment opportunity does not have fixed guidelines for diversification and may make a limited number of investments.
Reliance on Third Parties. StepStone will require, and rely upon, the services of a variety of third parties, including but not limited to attorneys, accountants, brokers, custodians, consultants and
other agents and failure by any of these third parties to perform their duties could have a material adverse effect on the investment.
Reliance on Managers. The investment will be highly dependent on the capabilities of the managers.
Risk Associated with Portfolio Companies. The environment in which the investors directly or indirectly invests will sometimes involve a high degree of business and financial risk. StepStone
generally will not seek control over the management of the portfolio companies in which investments are made, and the success of each investment generally will depend on the ability and
success of the management of the portfolio company.
Uncertainty Due to Public Health Crisis. A public health crisis, such as the recent outbreak of the COVID-19 global pandemic, can have unpredictable and adverse impacts on global, national and
local economies, which can, in turn, negatively impact StepStone and its investment performance. Disruptions to commercial activity (such as the imposition of quarantines or travel
restrictions) or, more generally, a failure to contain or effectively manage a public health crisis, have the ability to adversely impact the businesses of StepStone’s investments. In addition, such
disruptions can negatively impact the ability of StepStone’s personnel to effectively identify, monitor, operate and dispose of investments. Finally, the outbreak of COVID-19 has contributed to,
and could continue to contribute to, extreme volatility in financial markets. Such volatility could adversely affect StepStone’s ability to raise funds, find financing or identify potential purchasers
of its investments, all of which could have material and adverse impact on StepStone’s performance. The impact of a public health crisis such as COVID-19 (or any future pandemic, epidemic or
outbreak of a contagious disease) is difficult to predict and presents material uncertainty and risk with respect to StepStone’s performance.
Taxation. An investment involves numerous tax risks. Please consult with your independent tax advisor.
Conflicts of Interest. Conflicts of interest may arise between StepStone and investors. Certain potential conflicts of interest are described below; however, they are by no means exhaustive.
There can be no assurance that any particular conflict of interest will be resolved in favor of an investor.
Allocation of Investment Opportunities. StepStone currently makes investments, and in the future will make investments, for separate accounts having overlapping investment objectives. In
making investments for separate accounts, these accounts may be in competition for investment opportunities.
Existing Relationships. StepStone and its principals have long-term relationships with many private equity managers. StepStone clients may seek to invest in the pooled investment vehicles
and/or the portfolio companies managed by those managers.
Carried Interest. In those instances where StepStone and/or the underlying portfolio fund managers receive carried interest over and above their basic management fees, receipt of carried
interest could create an incentive for StepStone and the portfolio fund managers to make investments that are riskier or more speculative than would otherwise be the case. StepStone does
not receive any carried interest with respect to advice provided to, or investments made on behalf, of its advisory clients.
Other Activities. Employees of StepStone are not required to devote all of their time to the investment and may spend a substantial portion of their time on matters other than the investment.
Material, Non-Public Information. From time to time, StepStone may come into possession of material, non-public information that would limit their ability to buy and sell investments.
CONFIDENTIAL | 31Global Offices
BEIJING LA JOLLA PERTH SYDNEY
Kerry Centre, South Tower, 16th Floor 4275 Executive Square, Suite 500 Level 24, Allendale Square Level 43 Governor Phillip Tower
1 Guang Hua Road La Jolla, CA 92037 77 St George’s Terrace One Farrer Place
Chaoyang District Perth, WA 6000, Australia Sydney NSW 2000 Australia
Beijing, China 100020
CHARLOTTE LIMA ROME TOKYO
128 S Tryon Street, Suite 880 Av Jorge Basadre 607 Via Crescenzio, 14 Level 1 Yusen Building
Charlotte, NC 28202 San Isidro, Lima, Peru 00193 Rome, Italy 2-3-2 Marunouchi
Chiyoda-ku, Tokyo 100-0005, Japan
CLEVELAND LONDON SAN FRANCISCO TORONTO
127 Public Square, Suite 5050 2 St James’s Market Two Embarcadero Center, Suite 480 130 King Street West, Suite 1205
Cleveland, Ohio 44114 London SW1Y 4AH San Francisco, CA 94111 Exchange Tower
Toronto, ON Canada M5X 1A9
DUBLIN LUXEMBOURG SÃO PAULO ZURICH
Newmount House 124 Boulevard de la Pétrusse Av. Brigadeiro Faria Lima 3355, 8th Floor Klausstrasse 4
22-24 Lower Mount Street L-2330 Luxembourg Itaim Bibi - São Paulo SP, CH-8008 Zurich, Switzerland
Dublin 2, Ireland Brazil 04538-133
HONG KONG NEW YORK SEOUL
Level 15 Nexxus Building 450 Lexington Ave, 31st Floor Three IFC Level 43
41 Connaught Road Central New York, NY 10017 10 Gukjegeumyung-ro
Central, Hong Kong Yeoungdeungpo-gu,
Seoul 07326 KoreaYou can also read