Integrated transport sector budgeting - Developing a business case for - April 2018 - Shakti Sustainable Energy ...
←
→
Page content transcription
If your browser does not render page correctly, please read the page content below

Developing a business case for
Integrated transport sector budgeting
                                                                               in states

                                  April 2018
      KPMG Advisory Services Private Limited is the knowledge partner for this report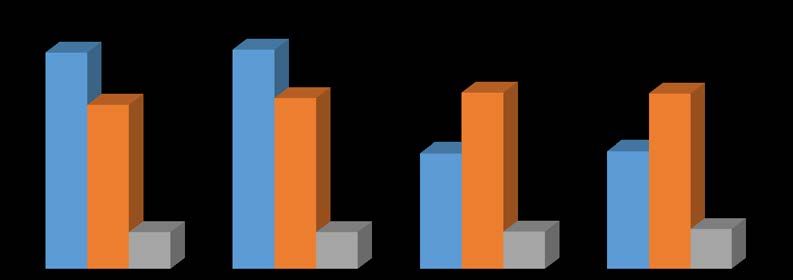
About Shakti Sustainable Energy Foundation
Shakti Sustainable Energy Foundation works to strengthen the energy security of India by aiding
the design and implementation of policies that support renewable energy, energy efficiency and
sustainable transport solutions.

Disclaimer
•   The views/analysis expressed in this report/document do not necessarily reflect the views of
    Shakti Sustainable Energy Foundation. The Foundation also does not guarantee the accuracy
    of any data included in this publication nor does it accept any responsibility for the
    consequences of its use.
•   The information contained herein is of a general nature and is not intended to address the
    circumstances of any particular individual or entity. Although KPMG endeavor to provide
    accurate and timely information, there can be no guarantee that such information is accurate
    and as of the date it is received or that it will continue to be accurate in the future. No one
    should act on such information without appropriate professional advice after a thorough
    examination of the particular situation.

*For private circulation only

                                                1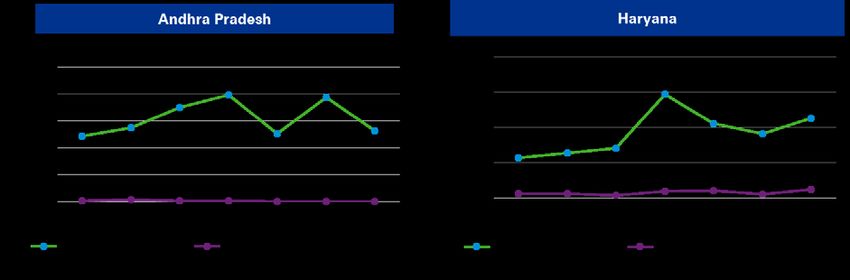
Contents

EXECUTIVE SUMMARY                                                         6

1.   BACKGROUND                                                          11

2.   SELECTION OF STATES FOR THE STUDY                                   16

3.   ANALYSIS OF STATE TRANSPORT BUDGETS                                 24

4.   WORK STREAMS FOR DEVELOPMENT OF BUSINESS CASE                       33

5.   FINANCIAL AND INDEPENDENT ECONOMIC ANALYSIS - INVESTMENT IN ROADS AND
BUSES                                                                    41

6.   BUSINESS CASE FOR INTEGRATED TRANSPORT BUDGET IN STATES             52

7.   CONCLUSION                                                          58

ANNEXURES                                                                60

                                     2
List of tables
Table 1 Data of select parameters of various states ........................................................................ 16
Table 2 Macroeconomic Parameters- Budget of Andhra Pradesh ................................................. 24
Table 3: Sources of funds from transport sector and expenditure on roads for the state of
Andhra Pradesh (INR Cr) ............................................................................................................ 25
Table 4: Sources of funds/ revenue and expenditure on buses for the state of Andhra Pradesh
(INR cr) .......................................................................................................................................... 26
Table 5 Macroeconomic Parameters- Budget of Maharashtra ....................................................... 27
Table 6: Sources of funds from transport sector and expenditure on roads for the state of
Maharashtra (INR Cr) .................................................................................................................. 27
Table 7: Sources of funds/ revenue and expenditure on buses for the state of Maharashtra (INR
cr) .................................................................................................................................................. 28
Table 8: Macroeconomic Parameters- Budget of Haryana .............................................................. 29
Table 9: Sources of funds from transport sector and expenditure on roads for the state of
Haryana (INR Cr) .......................................................................................................................... 29
Table 10: Sources of funds/ revenue and expenditure on buses for the state of Haryana (INR cr)
...................................................................................................................................................... 30
Table 14 Shadow prices...................................................................................................................... 42
Table 15 Capacity Utilization of the road .......................................................................................... 42
Table 16 Assumptions ........................................................................................................................ 43
Table 17 Value of inputs (INR cr) ....................................................................................................... 44
Table 18 Assumptions ........................................................................................................................ 45
Table 19 Impact due to generation of employment ......................................................................... 46
Table 20 Phased reduction of cars ..................................................................................................... 46
Table 21 Assumptions ........................................................................................................................ 47
Table 22 Impact of emissions ............................................................................................................ 48
Table 23 Assumptions ........................................................................................................................ 49
Table 24 Impact due to vehicle operating costs ............................................................................... 49
Table 25 Assumptions ........................................................................................................................ 50
Table 26 Impact due to road fatalities ............................................................................................... 50
Table 27: Summary of Economic Benefits ........................................................................................ 51
Table 28 Selection of Highways ......................................................................................................... 55
Table 29 Value of Parameters ............................................................................................................ 55
Table 30 Values of Parameters (INR Cr) ............................................................................................ 56
Table 31 Sensitivity Analysis ............................................................................................................. 57
Table 32 Growth Rates ........................................................................................................................ 60
3List of figures
Figure 1 Snapshot of SRTUs in India ................................................................................................ 12
Figure 2: Comparison of availability of buses across select countries .......................................... 13
Figure 3: Comparison of Road Network across the globe ............................................................... 13
Figure 4: Growth in road network and bus fleet in select states of India ...................................... 14
Figure 5: Spending on Roads in select states of India ..................................................................... 15
Figure 6 Fleet size ................................................................................................................................ 18
Figure 7: Financial parameters of APSRTC ....................................................................................... 18
Figure 8: Financial parameters of MSRTC ........................................................................................ 19
Figure 9: Financial parameters of Haryana Roadways .................................................................... 19
Figure 10: Composition of CPKM - APSRTC ..................................................................................... 20
Figure 11: Composition of CPKM – Haryana Roadways .................................................................. 20
Figure 12: Composition of CPKM - MSRTC ....................................................................................... 21
Figure 13 Comparison of Tax and Losses-APSRTC ......................................................................... 21
Figure 14 Comparison of Tax and Losses-MSRTC ........................................................................... 22
Figure 15 Comparison of Tax and Losses-Haryana Roadways....................................................... 22
Figure 16 Comparison of Tax as percentage of revenue................................................................. 23
Figure 17: Work Streams .................................................................................................................... 33
Figure 18: Structure of SCBA ............................................................................................................. 35
Figure 19: Employment Multiplier ..................................................................................................... 35
Figure 20: Broad methodology of economic analysis ..................................................................... 38
Figure 21 Input and Output parameters in ERR analysis of bus and road investments ............... 38
Figure 22: Depiction of Cases ............................................................................................................. 39
Figure 23: Comparison of FIRR- roads and buses ............................................................................ 41
Figure 24 Comparison of ERR-roads and buses ............................................................................... 51
Figure 25 Relation between roads and vehicles ............................................................................... 61
Figure 26 Composition of Tax Receipts 2017-18-Andhra Pradesh ................................................. 70
Figure 27 Composition of Tax receipts 2017-18- Maharashtra ....................................................... 70
Figure 28 Composition of Tax receipts 2017-18- Haryana ............................................................... 71
4Abbreviations
APSRTC Andhra Pradesh State Road Transport Corporation
BCR Benefit Cost Ratio
Capex Capital Expenditure
CAGR Compound annual growth rate
ERR Economic Internal Rate of Return
FIRR Financial Internal Rate of Return
GDP Gross Domestic Product
I/O Input-Output
MSRTC Maharashtra State Road Transport Corporation
NH National Highway
NHAI National Highways Authority of India
NPV Net Present Value
NSDP Net State Domestic Product
OPEX Operational expenditure
O&M Operation and Maintenance
P&L Profit and Loss
SCBA Social Cost Benefit Analysis
SH State Highway
SRTU State Road Transport Undertaking
VOC Vehicle Operating Cost
5Executive Summary
Introduction
Transportation infrastructure is the engine of economic growth for the economy. In the past few
years, there have been increased investments in the sector. However, there has been increased
focus on building roads resulting in less funds being available for development of bus based public
transport systems. For instance, expenditure on the construction of roads and bridges for Andhra
Pradesh, Maharashtra and Haryana has been up to a maximum of 4% of the total state budget
whereas the capital expenditure SRTUs and other infrastructure has never exceeded 0.5% in
these states. This lesser allocation of funds in SRTUs needs to be seen alongside the impact that
they create. As per data published by Ministry of Road Transport and Highways (MoRTH) 1, during
2014-15, the SRTUs carried more than 2,500 crore passengers, nearly 7 crores each day, which
is more than three times that carried by Indian Railways.
There is therefore a need for development of integrated transport budgets by the state
governments. This is important because state governments are currently focusing more on
building roads with limited investments in development of bus based public transport systems
which are critical for ensuring sustainable passenger mobility. An integrated budget would lead
to a balanced allocation of funds ensuring both road infrastructure creation as well optimum
road infrastructure use.
Objective of the study
The objective of this study is to build a rationale for integrated transport sector budgeting in
states by analysing the budgets of three state governments with respect to the expenditures and
revenues attributable to the transport sector and also by developing a quantitative model which
brings out the impact of considering road investments and investments in buses together in the
three states.
Methodology
Literature review has been conducted for determining the appropriate methodology for
conducting the economic analysis of road infrastructure and public transport related projects.
Methods to conduct economic analysis and parameters for conducting cost-benefit analysis for
road investment as well as public transport projects are the areas studied in the literature review.
Based on the above, Social Cost Benefit Analysis (SCBA) and Input-Output Analysis (I-O Analysis)
were identified as the most commonly used methods for economic assessment of investment in
road infrastructure and public transport projects. The key parameters considered in these
methods of analysis are capital costs, operating costs, travel time savings, vehicle operating cost,
accident costs and environmental impacts.
Both SCBA and I-O Analysis methods and parameters have been used for the economic analysis
and for development of an integrated business model. The “input” and the “output” flows for
investments in roads and buses have been separately estimated and the “net benefit” has been
1
Review of the performance of SRTU for April 2014 – March 2015, MoRTH publication dated February 2016
6calculated. The economic rate of return (ERR) has then been arrived at from the stream of net
benefits over a period of time. The broad methodology of economic analysis is shown below.
In preparing a model for the case in which road infrastructure and bus investment are considered
in an integrated manner the following method has been adopted.
The first step is to select three states for which the analysis is to be carried out. This has been
done taking into consideration the following parameters
• Presence of a strong SRTU in the state – Physical parameters such as fleet size and
percentage of over aged buses have been considered. Operational parameters such as
ridership per bus per day, staff productivity and fuel efficiency have been looked at. Financial
performance in terms of profit / loss per bus is also a key determinant of the strength of the
SRTU in the state.
• Road infrastructure per lakh of population and outlay for roads in the state government’s
budget.
• Net State Domestic product.
Based on the above parameters and a discussion with Shakti Sustainable Energy Foundation
(Shakti), three states have been chosen, viz. Andhra Pradesh, Maharashtra and Haryana. The
state transport budgets of these states have been analyzed mapping the revenue and
expenditure on buses and roads.
Post the selection of the states, one highway each in the three states of Andhra Pradesh,
Maharashtra and Haryana has been selected and details of traffic (number of buses, cars,
average km operated, passenger occupancy etc.) plying on the same have been collected. The
vehicular share of buses and cars has been determined on the basis of traffic data. This is termed
as ‘base case’. Based on the methodology described above the ERR has been calculated for the
base case. Post this an “alternative case” has been prepared. In the alternate case, share of buses
on the same highway has been increased and a corresponding proportionate reduction in the
number of cars has been assumed. This is termed as ‘alternate case’. ERR has been calculated
for the alternate case and compared with that of the base case.
7Major Findings
Analysis of SRTUs
It was found from the analysis of different costs associated with SRTUs that the taxes levied on
them constitute about 11-14% of their total costs. In case of MSRTC, the organization was making
operating profits before imposition of taxes.
Financial analysis of investments in roads & buses
It has been estimated from an indicative financial analysis that the FIRR for investment in roads
is positive (about 8%), while that for buses is negative. The current cost structures for operating
buses in combination with the ticket prices that can be levied by SRTUs on the travelling public,
render buses to be a loss making investment.
Analysis of budgets of the three states
• In all the three states viz. Andhra Pradesh, Maharashtra and Haryana, there exists a surplus
of funds received from transportation sector vis-à-vis the expenditure on roads. Proportions
of such surplus of sources of funds over expenditure are different for the three states and are
broadly in the range of 60-80% of the overall sources of funds.
• When all fund inflows and outflows for buses are considered at the state level (i.e. clubbing
both capital outlays and operating expenditure vis-à-vis total source of funds/ revenue), there
exists a deficit in sources of funds/ revenues from buses vis-à-vis their overall expenditure.
Proportions of such deficit for buses are different for different states and are broadly in the
range of 9-17% of the overall sources of funds for buses.
• In all the three states, the growth rate of state expenditure is higher than the growth rate of
GSDP. This indicates the pressure on state government finances to meet obligations under
various schemes. Andhra Pradesh is a new state and it can be seen that the expenditure of
the state government constitutes a larger percentage of the state GSDP (about 24-25% for
Andhra Pradesh during 2014-15 to 2016-17) as compared to the other states (12% for
Maharashtra and 12-16% for Haryana during 2014-15 to 2016-17).
• Looking at the trend of surplus funds alongside increasing expenditure of state governments,
the pressure to deploy surplus funds under various schemes perceived to be socially and
politically important can be observed. However, in all the three states, majority of the total
capital outlay towards transportation services is allocated to roads and bridges and a very
small portion gets allocated to road based transportation (primarily buses).
Economic analysis of investments in roads & buses
(i) Independent economic analysis 2
ERR for investment in roads was observed to be 21.7%, while that for buses it was observed to
be 24.5%. ERR for investment in buses is higher than that in roads because the economic benefits
such as reduction in road fatalities, employment generation and savings on account of reduction
in emissions are higher for investment in buses as compared to investment in roads. Looking at
only the financial IRR and therefore not investing adequately in buses might not be justified
looking at the socio economic benefits of investments in buses.
(ii) Integrated economic analysis for Andhra Pradesh, Maharashtra & Haryana
2
Independent economic analysis has been done considering select traffic data for the state of Andhra Pradesh.
8An integrated economic analysis has been performed for the three states mentioned above,
wherein combined investments in roads and buses have been analyzed under the two cases viz.
base case and alternate case. It has been observed that as the vehicular shift increases in favor
of buses, the ERR in the alternate cases increases. The results of the integrated economic analysis
under three scenarios of vehicular shift for each state are tabulated below.
Andhra Pradesh Maharashtra Haryana
Vehicular
Shift Alternate Alternate Alternate
Base case Base case Base case
Case Case Case
5% 28.68% 29.19% 23.71% 24.23% 23.25% 23.77%
10% 28.68% 29.71% 23.71% 24.74% 23.25% 24.29%
20% 28.68% 30.74% 23.71% 25.76% 23.25% 25.31%
Conclusion
The higher ERR supports the philosophy of looking at roads and public transport infrastructure
in an integrated manner. There is a need for considering investments in public transport in
tandem with investments in intercity roads in states. This could be done either by higher
allocation of transport budget towards buses or having conducive polices and incentives to
encourage private sector to invest and participate in public transport services.
Development of an integrated transport model will aid in presenting the societal logic on
investing in road infrastructure services and not just on roads. The analysis of the state budgets
indicates that surplus funds get generated from the transportation sector, but an inadequate
proportion of that surplus is directed towards investments into bus-based public transport. An
integrated transportation sector view would assist the states in transitioning from the current
skewed capital outlay to a more integrated/ balanced capital outlay with higher than current
outlays towards road based transportation.
Suggestions from stakeholders
Interactions were held with various stakeholders (including officials of The World Bank, NITI
Aayog and officials of the state transport departments) to gather inputs, present the analysis
undertaken as part of this study and its outcomes. The stakeholders were in agreement with the
findings of the study. Some of the salient suggestions from various stakeholders are enlisted
below.
• The provision of road infrastructure is the responsibility of states. Having created the road
infrastructure, the efficient use of road assets is also an objective that is important for states.
Efficient use of road assets would come from higher proportion of public transport and this
would maximize the returns on government’s investments.
• The current conditions of SRTU buses are not up to the mark thereby resulting in lower
utilization and poor service levels. To attract the travelling public and induce them to shift to
buses, better services will be a key requirement.
• An integrated transport budgeting will be relevant for the rural roads being developed under
the Pradhan Mantri Gram Sadak Yojna (PMGSY) as the availability of public transport in the
rural areas is minimal.
9• There should be a certain percentage of investment in roads which should be allocated
towards public transport.
• Specific strategies might need to be formulated to encourage public transport on routes that
are loss making/not lucrative.
• An appropriate level of tax exemption / relief may be looked into for SRTUs to improve their
financial situation.
• Further, it may be considered to develop an ecosystem wherein government bodies should
create technical capacity in terms of having transport planners on their rolls. This would
enhance monitoring capabilities at the apex level and assist in ensuring efficient operations
and investments in SRTUs.
101. Background
1.1. Introduction
Transport sector attracts major investments from the national and state governments. However,
in the past few years, there has been increased focus on building roads resulting in less funds
being available for development of bus based public transport systems. This lesser allocation of
funds in SRTUs needs to be seen alongside the impact that they create. As per data published
by Ministry of Road Transport and Highways (MoRTH) 3, during 2014-15, the SRTUs carried more
than 2,500 crore passengers, nearly 7 crores each day, which is more than three times that carried
by Indian Railways.
1.2. Need for the study and its scope
In order to address the issue of disaggregated nature of transport sector investment, there is a
need to revisit the criteria adopted for transport budget allocation by states and to build a
business case for integrated transport budgeting with adequate allocation towards public
transport systems. An integrated budget would lead to a balanced allocation of funds ensuring
both road infrastructure creation as well optimum use of road infrastructure.
The objective of this study is to build a rationale for integrated transport sector budgeting in
states by analyzing the budgets of three state governments with respect to the expenditures and
revenues attributable to the transport sector and also by developing a quantitative model which
brings out the impact of considering road investments and investments in buses together in the
three states.
The various elements of scope of the study are enlisted below:
• Identify three case states with functional SRTUs in consultation with Shakti.
• Review the annual budgets of the three selected states with respect to the expenditures and
revenues from the transport sector.
• Map various revenues sources and expenditure venues of the state governments which are
directed towards development of transport systems.
• Conduct a cost-benefit analysis of the expenditures made in subsectors within transport at
the state level like road building and bus systems and develop metrics for economic returns
in such sub-sectors (i.e. benefits will be in the terms of economic and environmental gains
such as reduction in emissions, savings in fuel and reduction in accidents/ fatalities).
• Develop a business case for integrated transport budgeting in states and provide
recommendations commensurate to the economic benefits of various subsectors within
transport.
The ensuing sections in this chapter include the following:
• A broad overview of SRTUs in India (in terms of number of SRTUs in India, total fleet size,
total number of passengers carried, average occupancy levels, total revenues, etc.).
• Comparison of India vis-à-vis other developing countries in terms of availability of buses and
roads.
• Comparison of growth in road network and fleet size of buses and fund allocations from state
budget towards road network and public transport (buses).
3
Review of the performance of SRTU for April 2014 – March 2015, MoRTH publication dated February 2016
111.3. SRTUs in India
It is a well acknowledged fact that mobility plays an important role in the economic and social
development of any country. In India, bus-based public transport system continues to be
dominated by SRTUs in terms of coverage. During 2014-15, the SRTUs carried more than 2,500
crore passengers, nearly 7 crores each day on 140,000 buses, which is more than three times
those carried by Indian Railways.
Different states in India have their own SRTUs for urban and intra-state movement. SRTUs vary
extensively in their fleet sizes, intensity of operations and penetration in terms of connectivity.
Figure 1 presents a snapshot of the SRTUs in India.
Figure 1 Snapshot of SRTUs in India
Source: Review of the performance of State Road Transport Undertaking for April 2014 – March 2015,
MoRTH publication dated February 2016
It is observed that only 3 out of 46 SRTUs in the country made profits in the year 2014-15 and
on an aggregate level, the losses of SRTUs were to the tune of INR 10,800 crore.
1.4. Availability of roads and buses - Comparison of India with other
developing countries
India offers an average of 1.66 buses per thousand people whereas in countries such as Brazil,
Malaysia, Mexico, an average of 3-4 buses are available per thousand people. The comparison
of availability of buses and road network in different countries is provided below.
12Figure 2: Comparison of availability of buses across select countries
Source: Review of the performance of State Road Transport Undertaking for April 2014 – March
2015, MoRTH publication dated February 2016
Figure 3: Comparison of Road Network across the globe
Source: Review of the performance of State Road Transport Undertaking for April 2014 – March 2015,
MoRTH publication dated February 2016
The situation in India seems to be counter intuitive. Among the major developing nations, India
has one of the lowest availability of buses per thousand persons, whereas it has the highest road
network per hundred sq. km of area.
1.5. Need for more investment in bus transport
13There is a mismatch in the growth of road network within states and size of fleets held by SRTUs.
On comparing the growth of road network (State Highways [SH] and National Highways [NH]) in
the states of Andhra Pradesh, Haryana and Maharashtra with the fleet size of the respective
SRTUs, it is seen that although road construction has steadily improved over the years; the fleet
size of SRTUs has remained practically stagnant. The following figure presents this comparison
for the period from FY 2011 to FY 2015.
Figure 4: Growth in road network and bus fleet in select states of India
Source: Indiastat database
The fund allocations from the state budgets towards SRTUs have been sporadic over the period
from 2011 to 2017. The following figure shows the comparison of share of capital expenditure
on roads and bridges against that on other transportation services (which include investment in
SRTUs), as a percentage of the total budget expenditure.
14Figure 5: Spending on roads in select states of India
Source: Reserve Bank of India
The capital expenditure on construction of roads and bridges for the selected states is seen to
vary between 0.6% and 4% of the total state budgets whereas the capital expenditure on other
transport heads (which includes investment in SRTUs) is seen to vary between 0% and 0.5% of
the total state budgets.
There is thus a clear preference for investment in construction of roads over investment in public
transport in the selected states. In order to address the issue of disaggregated nature of transport
sector investment, there is a need to revisit the criteria adopted for transport budget allocation
by states. It is essential that economic and environmental benefits of various subsectors within
transport (road building and bus systems) be analyzed both at independent and integrated levels
to ascertain the societal impact of such subsectors.
152. Selection of states for the study
The data for ten states was collected based on the following parameters:
I. Presence of a strong State Road Transport Undertaking(SRTU)
The sub parameters used for measuring the performance of the SRTU are:
a. Physical - Fleet size and percentage of over aged buses
b. Operational - Ridership per bus per day, staff productivity (measured in staff per
productive km) and fuel efficiency (kms per litre)
c. Financial - Profit/loss per bus(INR)
II. Road Infrastructure in terms of extent of road network and outlay on the same
a. Road length per one lakh population
b. Outlay on roads and bridges
III. Economic Parameter
a. Net State Domestic Product
The data pertaining to above parameters is depicted below.
Table 1 Data of select parameters of various states
Financial
Parameter NSDP/
Fleet Ridership/ Fuel Efficiency
Sl. No. State Profit/Loss/ Capita
Size bus/day (km/l)
Bus (INR)
(INR)
1 Telangana 10329 (3,88,227) 885 95361 5.1
2 Orissa 446 1,15,471 39 52559 4.6
Uttar
3 9415 2632 158 36250 5.1
Pradesh
4 Gujarat 765 (1,71,281) 272 106831 5.4
5 Maharashtra 17957 (2,17,742) 374 117091 4.7
6 Karnataka 8321 (51,676) 333 89545 4.2
7 Haryana 4079 (11,82,863) 315 113427 4.7
8 Rajasthan 4704 (6,59,014) 208 65974 5.0
Andhra
9 12079 (4,92,590) 526 81397 5.2
Pradesh
10 Kerala 5691 (13,26,707) 532 103820 4.2
16Staff %of Road Outlay on Roads and
Sl No. State Productivity overaged Length/100,000 Bridges(2009-10) (INR
(km/staff/day) buses Persons(2011) Bn)
1 Telangana 60.1 8.8 NA NA
2 Orissa 141.0 6 617.0 9.0
Uttar
3 127.2 0.03 195.5 41.3
Pradesh
4 Gujarat 73.6 2.8 258.6 19.1
5 Maharashtra 53.1 5.43 365.6 39.2
6 Karnataka 72.5 6.4 460.9 26.9
7 Haryana 70.0 20 164.5 10.1
8 Rajasthan 83.4 5.9 351.6 6.1
Andhra
9 72.9 16.3 281.1 11.7
Pradesh
10 Kerala 37.0 25 692.8 5.8
Source: Review of the performance of State Road Transport Undertaking for April 2014 – March 2015,
MoRTH publication dated February 2016
It is evident from table 1 that:
Andhra Pradesh has a sizeable fleet (12,079) with reasonable passenger ridership and NSDP per
capita. Maharashtra has the highest fleet size and the least quantum of losses. Moreover, it has
the highest outlay on roads and is one among the financially well performing states. Haryana
has decent coverage of road network and outlay on roads.
Based on discussions with Shakti, following three states were selected for the study:
• Andhra Pradesh
• Maharashtra
• Haryana
Analysis of operations and financials of SRTUs in the selected states
APSRTC had the highest fleet size (approximately 22,400) in 2012-13, thereafter in 2014 the state
of Andhra Pradesh got bifurcated, therefore the SRTU also got bifurcated. Consequently APSRTC
was left with approximately 12,000 buses.
Maharashtra State Road Transport Undertaking (MSRTC) had the highest fleet size amongst all
SRTUs (~18,000 buses) in 2015, while the fleet of Haryana Roadways ranged over 3,700-4,100
buses during 2012-15.
1722170 22477
16801 17497 18055 17957
11857 12079
3755 3755 3816 4079
2012 2013 2014 2015
Andhra Pradesh Maharashtra Haryana
Figure 6 Fleet size
Source: Review of the performance of State Road Transport Undertaking for April 2014 – March 2015,
April 2013-March 2014, MoRTH publication
The cost per km (CPKM) of APSRTC varied from about INR 25 in 2012 to about INR 33 in 2015.
The earning per km (EPKM) of APSRTC varied from about INR 23 in 2012 to about INR 29 in 2015.
APSRTC financial parameters
60.41
53.87
32.82
29.21
25.29 23.25 22.49 22.36
CPKM EPKM CPKM EPKM CPKM EPKM CPKM EPKM
2012 2013 2014 2015
Figure 7: Financial parameters of APSRTC
Source: Review of the performance of State Road Transport Undertaking for April 2014 – March 2015,
April 2013-March 2014, MoRTH publication
The CPKM of MSRTC varied from about INR 28 in 2012 to about INR 36 in 2015. The EPKM of
MSRTC varied from about INR 28 in 2012 to about INR 35 in 2015.The CPKM and EPKM have
exhibited an increasing trend during the period.
18MSRTC- financial parameters
35.71 36.69
34.81
32.73 32.92
30.58
27.9 28.22
CPKM EPKM CPKM EPKM CPKM EPKM CPKM EPKM
2012 2013 2014 2015
Figure 8: Financial parameters of MSRTC
Source: Review of the performance of State Road Transport Undertaking for April 2014 – March 2015,
April 2013-March 2014, MoRTH publication
CPKM of Haryana Roadways varied from about INR 31 in 2012 to about INR 41 in 2015. The EPKM
of Haryana Roadways varied from about INR 25 in 2012 to about INR 30 in 2015. The CPKM and
EPKM have exhibited an increasing trend during the period.
Haryana Roadways- finanacial parameters
40.6
39.16
33.53
31.25 30.26
29.5
25.52 26.79
CPKM EPKM CPKM EPKM CPKM EPKM CPKM EPKM
2012 2013 2014 2015
Figure 9: Financial parameters of Haryana Roadways
Source: Review of the performance of State Road Transport Undertaking for April 2014 – March 2015,
April 2013-March 2014, MoRTH publication
It can be seen from figures 10-12 that staff costs and fuel costs account for 66-75% of the total
costs per km across the SRTUs, while tax accounts for 9-14% of the total costs per km. Thus staff
and fuel costs account for a major proportion of the total cost.
19Compostion of CPKM-APSRTC
Others
20%
Staff
Depreciation 37%
5%
Tax
9%
Fuel
29%
Figure 10: Composition of CPKM - APSRTC
Source: Review of the performance of State Road Transport Undertaking for April 2014 – March 2015,
April 2013-March 2014, MoRTH publication
Composition of CPKM-Haryana Roadways
Depreciation
2%
Others
9%
Tax
13% Staff
46%
Fuel
30%
Figure 11: Composition of CPKM – Haryana Roadways
Source: Review of the performance of State Road Transport Undertaking for April 2014 – March 2015,
April 2013-March 2014, MoRTH publication
20Composition of CPKM-MSRTC
Depreciation
6%
Others
8%
Staff
Tax 38%
14%
Fuel
34%
Figure 12: Composition of CPKM - MSRTC
Source: Review of the performance of State Road Transport Undertaking for April 2014 – March 2015,
April 2013-March 2014, MoRTH publication
It is interesting to note that in case of MSRTC for the period 2012-15, tax outgo is greater than
the losses for each year and for APSRTC the tax outgo is greater than the losses in the year 2013.
Figure 13 Comparison of Tax and Losses-APSRTC
Source: Review of the performance of State Road Transport Undertaking for April 2014 – March 2015,
April 2013-March 2014, MoRTH publication
21Figure 14 Comparison of Tax and Losses-MSRTC
Source: Review of the performance of State Road Transport Undertaking for April 2014 – March 2015,
April 2013-March 2014, MoRTH publication
Figure 15 Comparison of Tax and Losses-Haryana Roadways
Source: Review of the performance of State Road Transport Undertaking for April 2014 – March 2015,
April 2013-March 2014, MoRTH publication
Tax as a percentage to revenue ranges from 1%-8% in Andhra Pradesh, 14-15% in Maharashtra
and 18-21% in Haryana.
22Tax/Revenue
20% 21%
18% 18%
15% 15% 15% 14%
8% 8%
7%
1%
2012-13 2013-14 2014-15 2015-16
Andhra Pradesh Maharashtra Haryana
Figure 16 Comparison of Tax as percentage of revenue
Details of transport budget of the selected states are presented in the next chapter.
233. Analysis of state transport budgets
This chapter details the analysis of transport budgets of the three selected states viz. Andhra
Pradesh, Maharashtra and Haryana. The analysis has been done to ascertain the following:
a) Expenditure incurred on the roads,
b) Sources of funds (i.e. various receipts) from the transportation sector and
c) Surplus or deficit of sources of funds over expenditure on the roads, if any.
The above three aspects are also analyzed for the buses. Below are the steps which have been
undertaken to conduct the analysis.
First up, expenditure incurred on the roads is obtained by summing up revenue expenditure,
capital outlay and loans towards roads and bridges from the budgets of respective states.
Thereafter, sources of funds are obtained by summing up taxes on vehicles (under Indian Motor
Vehicles Act including various fees such as driving license fees, permit fees and other receipts
associated with state Motor Vehicles Act), taxes on goods and passengers (such as toll tax and
tax on entry of goods), VAT receipts on sale of petroleum products and grants (such as grants
under PMGSY scheme). Surplus or deficit is obtained by subtracting the expenditure from the
sources of funds.
For buses, expenditure for a state is obtained by summing up capital outlays, loans, subsidies
and operating expenditure of each of the three state transport corporations/ undertakings.
Sources of funds/ revenues for a state is obtained by summing up taxes so received from the
state transport corporations/ undertakings and their operating revenues (both traffic and non-
traffic revenues). Thereafter, surplus or deficit is obtained by subtracting the overall expenditure
from the overall revenues.
Apart from the above analysis, snapshots of major macroeconomic parameters such as GSDP,
its growth rate, per capita income, fiscal deficit, etc. for each of the three states have been looked
at.
3.1 Andhra Pradesh
Snapshot of major macroeconomic parameters of Andhra Pradesh’s budget are shown below.
Table 2 Macroeconomic Parameters- Budget of Andhra Pradesh
Parameters 2011-12 2012-13 2013-14 2014-15 2015-16 2016-17
GSDP (INR Cr)
at 2011-12 379,402 380,629 407,114 441,741 490,134 547,021
constant prices
GSDP Growth
- 0.3% 7.0% 8.5% 11.0% 11.6%
Rate (%)
Per capita
Income (INR 69,000 74,688 74,062 79,441 87,487 122,376
per annum)
Total
Receipts(INR 81,000 103,830 127,770 92,080 85,808 110,578
Cr)
24Parameters 2011-12 2012-13 2013-14 2014-15 2015-16 2016-17
Total
Expenditure 92,800 121,340 152,260 104,140 108,415 135,689
(INR Cr)
Fiscal
11,800 17,510 24,490 12,060 22,606 25,111
Deficit(INR Cr)
Fiscal Deficit % 3.1% 4.6% 6.0% 2.7% 4.6% 4.6%
Source: Socio Economic Survey 2016-17, Government of Andhra Pradesh, RBI
GSDP of Andhra Pradesh increased by about 23% during the period from 2014-15 to 2016-17,
while, during the same period, the per capita income increased by about 54%. The expenditure
has increased from INR 104,140 crores in 2014-15 to INR 135,689 crores in 2016-17, an increase
of around 30%. The expenditure of the state as a percentage of the state GSDP is around 24%
to 25% for the years from 2014 to 2017.
The analysis of the transport budget of Andhra Pradesh for ascertaining the expenditure on roads
and their sources of funds is provided below.
Table 3: Sources of funds from transport sector and expenditure on roads for the state of
Andhra Pradesh (INR Cr 4)
Parameters 2015-16 2016-17
Sources of funds from transport sector
Tax on vehicles under Indian Motor Vehicles Act (including various
fees such as driving license fees, permit fees and other associated 525 421
receipts)
Receipts under State Motor Vehicles Act (including receipts in the
1,470 1,915
form of quarterly tax, life tax and other associated receipts)
VAT receipts^ on account of sale of petroleum products (motor spirit
5,480 5,861
and diesel)
Taxes on goods and passengers (such as toll tax and tax on entry of
10 18
goods)
Grants (such as receipts under Pradhan Mantri Gram Sadak Yojna
688 490
(PMGSY) and other grants for state roads)
A. Total of sources of funds on account of roads 8,173 8,705
B. Total of expenditure on roads and bridges 3,237 3,497
C. Surplus/ (deficit) of sources over expenditure (A-B) 4,936 5,208
D. Surplus as a percentage of sources of funds (C/A) 60.4% 59.8%
Source: Andhra Pradesh Budget
^ VAT receipts are computed by utilizing (i) annual sales of petroleum products (motor spirit, diesel oil) in
Andhra Pradesh from the annual statistics of Ministry of Petroleum and Natural Gas, (ii) applicable VAT
rates on sale of petroleum products in Andhra Pradesh and (iii) pre-VAT prices of petroleum products.
4
The likely impact of GST on tax revenues of states is explained in Annexure 3
25Majority of such VAT receipts would be on account of the transportation sector and hence, they have been
considered in the sources of funds from the transportation sector. Same methodology has been used for
computation of VAT receipts for other states also.
As can be seen above, there is a surplus of funds received from the transportation sector over
the expenditure on roads and bridges in the state. Such surplus is to the tune of 60% of funds
received and is adequate to fund the expenditure on roads and bridges. It may be noted that
majority of such surplus is attributable to the VAT receipts on account of sale of petroleum
products (motor spirit and diesel) and tax receipts on vehicles.
An analysis of sources of funds/ revenues and expenditure on account of buses in Andhra
Pradesh has also been done and is as under.
Table 4: Sources of funds/ revenue and expenditure on buses for the state of Andhra Pradesh
(INR cr)
Parameters (INR crores) 2014-15 2015-16
Expenditure for the state
Capital outlay/ loans to APSRTC 124 249
Subsidies paid to APSRTC 322 404
Operating expenditure 4,129 5,166
A. Total expenditure for the state to buses 4,576 5,819
Sources of funds/ revenue for the state
Taxes so received from APSRTC 319 399
Operating revenue of APSRTC 3,686 4,613
Traffic revenue 3,428 4,272
Non-traffic revenue 257 341
B. Total sources of funds/ revenue for the state 4,005 5,011
C. Surplus/ (Deficit) of sources of funds over expenditure (B-A) (571) (808)
D. Percentage of surplus/ (deficit) over total sources of funds (C/B) -ve 14.3% -ve 16.1%
E. Ratio 5 of operating expenditure to operating revenue 112% 112%
Source: Andhra Pradesh budget, MoRTH – Review of performance of SRTUs
As shown above, there is a deficit of sources of funds/ revenue over the expenditure on buses in
Andhra Pradesh. Such deficit is to the tune of 14-16% of the overall sources of funds/ revenue on
account of buses. It may be noted that the deficits so shown above are not only depicting the
operating losses of APSRTC (as operating revenues are less than the operating expenditures),
5
Operating ratio has been computed by excluding the taxes so paid by APSRTC to the state government of
Andhra Pradesh. This has been done to consolidate all the expenditures and revenues at the state level
towards buses. If such taxes are included in the operating expenditure of APSRTC, the operating ratio would
deteriorate further to 120%
26but also showing a deficit situation for the state when analyzed with all expenditures/inflows
towards buses clubbed together (irrespective of their nature i.e. capital/operating).
Further, as per the state budget of Andhra Pradesh, it may be noted that the capital outlay on
roads and bridges account for about 84% whereas outlay towards road transport account for a
mere 10% of the overall capital expenditure towards various transportation services.
3.2 Maharashtra
Snapshot of major macroeconomic parameters of Maharashtra’s budget are shown below.
Table 5 Macroeconomic Parameters- Budget of Maharashtra
Parameters 2011-12 2012-13 2013-14 2014-15 2015-16 2016-17
GSDP
(current
prices) INR 1,272,967 1,448,466 1,647,506 1,792,122 1,967,171 2,203,231
Crore
GSDP
Growth Rate - 13.8% 13.7% 8.8% 9.8% 12.0%
(%)
Per capita
Income-
-
(INR per 98,910 111,005 125,146 134,081 147,939
annum)
Total
Receipts-
122,301 143,810 151,400 166,401 199,378 221,961
INR Cr
Total
Expenditure-
149,228 165,469 187,982 217,748 247,325 270,764
INR Cr
Fiscal Deficit
-INR Cr 19,969 13,740 26,018 31,827 37,950 35,031
Fiscal Deficit
1.6% 0.9% 1.6% 1.8% 1.9% 1.6%
%
Source: Socio Economic Survey 2016-17, Government of Maharashtra, RBI
GSDP of Maharashtra increased by about 23% during the period 2014-15 to 2016-17.The
expenditure of the state increased by 24% in the same period. As a share of the state GSDP the
expenditure is around 12%.
The analysis of sources of funds from transport sector and expenditure on roads for Maharashtra
has been performed on similar lines as presented in case of Andhra Pradesh.
Table 6: Sources of funds from transport sector and expenditure on roads for the state of
Maharashtra (INR Cr)
Parameters 2014-15 2015-16
Sources of funds from transport sector
Tax on vehicles under Indian Motor Vehicles Act (including various
fees such as driving license fees, permit fees and other associated 860 931
receipts)
Receipts under State Motor Vehicles Act (including receipts in the
4,565 4,793
form of quarterly tax, life tax and other associated receipts)
27Parameters 2014-15 2015-16
VAT receipts on account of sale of petroleum products (motor spirit
12,316 13,430
and diesel)
Taxes on goods and passengers (such as toll tax and tax on entry of
418 451
goods)
Grants (such as receipts under Pradhan Mantri Gram Sadak Yojna
171 1,740
(PMGSY) and other grants for state roads)
A. Total of sources of funds on account of roads 18,330 21,345
B. Expenditure on roads and bridges 3,042 3,976
C. Surplus/ (deficit) of sources over expenditure (A-B) 15,288 17,369
D. Surplus as a percentage of sources of funds (C/A) 83.4% 81.4%
Source: Maharashtra state budget, https://mahades.maharashtra.gov.in/MPSIMS/
The analysis of sources of funds/ revenue and expenditure on buses in the state of Maharashtra
is as under.
Table 7: Sources of funds/ revenue and expenditure on buses for the state of Maharashtra (INR
cr)
Parameters (INR crores) 2014-15 2015-16
Expenditure for the state
Capital outlay/ loans to MSRTC 18 16
Subsidies paid to MSRTC 1,334 1,335
Operating expenditure 6,821 6,459
A. Total expenditure for the state to buses 8,174 7,810
Sources of funds/ revenue for the state
Taxes so received from MSRTC 1,079 1,038
Operating revenue of MSRTC 5,924 5,925
Traffic revenue 5,727 5,714
Non-traffic revenue 197 211
B. Total sources of funds/ revenue for the state 7,003 6,963
C. Surplus/ (Deficit) of sources of funds over expenditure (B-A) (1,170) (846)
D. Percentage of surplus/ (deficit) over total sources of funds (C/B) -ve 16.7% -ve 12.2%
E. Ratio 6 of operating expenditure to operating revenue 119% 113%
Source: Maharashtra budget, MoRTH – Review of performance of SRTUs
6
As explained in the analysis of Andhra Pradesh, operating ratio has been computed by excluding the taxes so paid by
MSRTC to the state government of Maharashtra. If such taxes are included in the operating expenditure of MSRTC, the
operating ratio would deteriorate further to 138% in 2015 and 131% in 2016.
28The deficit of sources of funds over expenditure on buses in Maharashtra is in-line with the trend
so observed for the state of Andhra Pradesh. As per the state budget of Maharashtra, it may be
noted that majority of the capital outlay on various transportation services is allocated towards
roads and bridges (which accounts for about 79-80%) whereas a minor share is allocated towards
road based transport (which accounts for about 0.3-0.5%).
3.3 Haryana
Snapshot of major macroeconomic parameters of Haryana’s budget are shown below.
Table 8: Macroeconomic Parameters- Budget of Haryana
Parameters 2011-12 2012-13 2013-14 2014-15 2015-16 2016-17
GSDP
(current
297,539 347,032 400,662 437,462 485,184 547,396
prices) INR
Crore
GSDP
- 16.6% 15.5% 9.2% 10.9% 12.8%
Growth Rate
Per capita
Income- INR 106,085 121,269 138,300 148,485 162,034 180,174
per annum
Total
Receipts- 30,861 38,281 38,284 41,090 54,642 63,666
INR Cr
Total
Expenditure- 38,014 46,413 46,597 53,676 85,037 88,782
INR Cr
Fiscal Deficit
7,153 8,133 8,313 12,586 30,396 25,116
INR Crore
Fiscal Deficit
2.4% 2.3% 2.1% 2.9% 6.3% 4.6%
%
Source: Socio Economic Survey 2016-17, Government of Haryana, RBI
GSDP increased by about 25% during the period from 2014-15 to 2016-17, while the per capita
income increased by 21%. Expenditure of the state has increased by close to 65% in the same
period. As a share of the state GSDP the state’s expenditure has increased from 12% to 16%.
The analysis of sources of funds from transport sector and expenditure on roads and buses for
Haryana are presented in table numbers 9 and 10 respectively.
Table 9: Sources of funds from transport sector and expenditure on roads for the state of
Haryana (INR Cr)
Parameters 2015-16 2016-17
Sources of funds from transport sector
Tax on vehicles under Indian Motor Vehicles Act (including various
fees such as driving license fees, permit fees and other associated 596 600
receipts)
Receipts under State Motor Vehicles Act (including receipts in the
803 1,000
form of quarterly tax, life tax and other associated receipts)
29Parameters 2015-16 2016-17
VAT receipts on account of sale of petroleum products (motor spirit
4,146 4,209
and diesel)
Taxes on goods and passengers (such as toll tax and tax on entry of
673 825
goods)
Grants (such as receipts under Pradhan Mantri Gram Sadak Yojna
382 156
(PMGSY) and other grants for state roads)
A. Total of sources of funds on account of roads 6,600 6,790
B. Expenditure on roads and bridges 1,898 1,552
C. Surplus/ (deficit) of sources over expenditure (A-B) 4,702 5,238
D. Surplus as a percentage of sources of funds (C/A) 71.2% 77.1%
Source: Haryana state budget
Table 10: Sources of funds/ revenue and expenditure on buses for the state of Haryana (INR cr)
Parameters (INR crores) 2014-15 2015-16
Expenditure for the state
Capital outlay/ loans to Haryana Roadways 62 111
Subsidies paid to Haryana Roadways - -
Operating expenditure 1,636 1,627
A. Total expenditure for the state to buses 1,698 1,738
Sources of funds/ revenue for the state
Taxes so received from Haryana Roadways 265 275
Operating revenue of Haryana Roadways 1,298 1,324
Traffic revenue 1,288 1,314
Non-traffic revenue 10 10
B. Total sources of funds/ revenue for the state 1,563 1,599
C. Surplus/ (Deficit) of sources of funds over expenditure (B-A) (135) (139)
D. Percentage of surplus/ (deficit) over total sources of funds (C/B) -ve 8.6% -ve 8.7%
E. Ratio 7 of operating expenditure to operating revenue 127% 124%
Source: Haryana budget, MoRTH – Review of performance of SRTUs
As per the state budget of Haryana, the capital outlay on roads and bridges account for about
94% whereas outlay towards road transport account for a low 5% of the overall capital
expenditure towards various transportation services.
7
As explained in the analysis of Andhra Pradesh and Maharashtra, operating ratio has been computed by excluding the
taxes so paid by Haryana Roadways to the state government of Haryana. If such taxes are included in the operating
expenditure of Haryana Roadways, the operating ratio would deteriorate further to 148% in 2015 and 145% in 2016.
30Following observations may be deduced from the above analysis on sources of funds and
expenditure for roads and buses for the three states:
• In all the three states viz. Andhra Pradesh, Maharashtra and Haryana, there exists a surplus
of funds received from transportation sector vis-à-vis the expenditure on roads.
• Proportions of such surplus of sources of funds over expenditure are different for the three
states and are broadly in the range of 60-80% of the overall sources of funds.
• When all fund inflows and outflows are considered (i.e. clubbing both capital outlays and
operating expenditure vis-à-vis total source of funds/ revenue) for buses in the three states,
there exists a deficit in sources of funds/ revenues from buses vis-à-vis their overall
expenditure.
• Proportions of such deficit for buses are different for different states and are broadly in the
range of 9-17% of the overall sources of funds for buses. Difference in proportions is on
account of several factors including varying operating efficiencies of road transport
corporations, difference in capital outlays in different years, etc.
• In all the three states, majority of the total capital outlay towards transportation services is
allocated to roads and bridges and a very small portion gets allocated to road based
transportation (primarily buses).
• The table below captures the a few parameters for each state.
Haryana Maharashtra Andhra Pradesh
Growth rate of GSDP in
the period 2014-15 to 25% 23% 24%
2016-17
Growth rate of state
expenditure in the
65% 24% 30%
period 2014-15 to 2016-
17
Expenditure as a
percentage of state
12%-16% 12% 24%-25%
GSDP in the period
2014-15 to 2016-17
Surplus of funds
received from transport
sector over the 77% 81% 60%
expenditure on roads
infrastructure
In all states the growth rate of state expenditure is higher than the growth rate of GSDP. This
indicates the pressure on state government finances to meet obligations under various schemes
and to make the state budget arithmetic to work. Andhra Pradesh is a new state and it can be
seen that the expenditure of the state government constitutes a larger percentage of the state
GSDP as compared to the other states. The surplus from the transportation sector is higher as
well in the other established states as compared to Andhra Pradesh. Looking at the surplus funds
alongside the increasing expenditure trend of state governments, the pressure to deploy surplus
funds under various schemes perceived to be socially and politically important can be perceived.
At entity level, all the three road transport corporations are loss making mostly on account of
higher cost of operations and higher taxes. Also, the states are in an overall situation of financial
deficit when all sources of funds from buses are compared with all streams of expenditure.
In this scenario, development of an integrated transport model will aid in presenting the societal
logic on investing in road infrastructure services and not just on roads. As has been indicated,
surplus does get generated from the transportation sector, but that surplus is not directed
31towards investments into bus based public transport. An integrated transportation sector view
would assist the states in transiting from the current skewed capital outlay to a more integrated/
balanced capital outlay with higher than current outlays towards road based transportation.
The subsequent chapter presents different work streams which are carried out for development
of business case for integrated budgeting.
324. Work streams for development of business case
The different work streams adopted for development of business case for integrated transport sector budgeting are shown in the below figure.
Selection of States Development of
Methodology for
Literature Review and Data Financial and Recommendations
Economic Analysis
Collection Economic Models
• Review of Indian • Computation of • Identification of • Development of • Results of
& international ERR for bus and parameters for Financial model validation of
literature road investment shortlisting
separately states
• Development of the case for
• Based on above integrated
economic model
derive: • Discussion with
and detailed transport
• Validate the case Shakti to finalize
assumptions budget with
A. Methodology for integrated states
and explanation higher capital
for economic budget by • Finalization of
of results of allocation for
analysis comparing ‘as-is’ states
economic buses vis-à-vis
case(base case) • Data collection
models: roads
B. Identification with the one on identified
A. Independent
of parameters where there is parameters and
economic
for Social Cost mode shift and review of state
analysis for
Benefit proportion of budgets based
roads and
Analysis buses is on selected
buses
(SCBA) & higher(alternate parameters
B. Integrated
Input-Output case)
economic
analysis
analysis
Figure 17: Work Streams
33You can also read