Managing Transport System Investment Risk - Enhancing patronage predictions and adapting strategic asset management and appraisal processes to ...
←
→
Page content transcription
If your browser does not render page correctly, please read the page content below
Managing Transport System
Investment Risk
Enhancing patronage predictions and
adapting strategic asset management and
appraisal processes to account for emerging
trends and uncertainty: Close-out Report
January 2021
Managing Transport System Investment Risk
Enhancing patronage predictions and adapting strategic
asset management and appraisal processes to account for
emerging trends and uncertainty: Close-out Report
Prepared by
Sharon Biermann, Brett Smith, Tristan Reed, Kerry Brown
and Sae Chi
Keywords
Patronage trends, journey planners, disruptive change,
asset management, infrastructure investment prioritisation
Version control
Final
Project No
iMOVE Project 3.007 Milestone 4
Project steering committee
Claire Thompson – Department of Transport
Jane Millar – Department of Transport
Flori Mihai - Main Roads WA
Camilla Galbraith – Department of Transport
Acknowledgment
This research is funded by PATREC and the iMOVE CRC
and supported by the Cooperative Research Centres
program, an Australian Government initiative.
About PATREC
The Planning and Transport Research Centre (PATREC)
is a collaboration between the Government of Western
Australia and local universities, constituted to conduct
collaborative, applied research and teaching in support of
policy in the connected spaces of transport and land use
planning. The collaborating parties are: The University of
Western Australia, Curtin University, Edith Cowan
University, Department of Transport, Main Roads Western
Australia, Western Australian Planning Commission and
the Western Australian Local Government Association.
Publisher
Planning and Transport Research Centre
The University of Western Australia (M087)
35 Stirling Highway, Crawley, WA 6009
+61 8 6488 3385
patrec@uwa.edu.au
https://patrec.org/
Managing Transport System Investment Risk

Table of Contents
1.      Introduction ............................................................................................................................... 2
     1.1.      Overall policy need ........................................................................................................... 2
     1.2.      Specific policy needs ........................................................................................................ 2
        1.2.1.         Factors influencing patronage trends ....................................................................... 2
        1.2.2.         Digital journey planning impact on travel choice ...................................................... 3
        1.2.3.         Asset management ................................................................................................... 3
        1.2.4.         Infrastructure project appraisal ................................................................................. 3
     1.3.      Project aims and objectives .............................................................................................. 3
     1.4.      Purpose of this report ....................................................................................................... 4
2.      Research approach .................................................................................................................. 4
        2.1.1.         Understanding systemic factors driving patronage shifts ......................................... 4
        2.1.2.         Determining digital journey planning impacts on patronage..................................... 4
        2.1.3.     Adapting strategic road asset management practice to account for uncertainty
        relating to CAVs........................................................................................................................ 5
        2.1.4.    Adapting infrastructure project prioritisation to account for uncertainty relating to
        disruptive technology................................................................................................................ 5
3.      Summary of findings................................................................................................................. 6
     3.1.      Factors influencing public transport patronage trends ..................................................... 6
     3.2.      Digital journey planning impacts on patronage ................................................................ 7
     3.3. Adapting strategic road asset management practice to account for uncertainty relating to
     CAVs .......................................................................................................................................... 9
     3.4.      Prioritisation of infrastructure investment proposals in the face of uncertainty.............. 10
4.      Dissemination ......................................................................................................................... 11
     4.1.      Academic publications .................................................................................................... 11
     4.2.      Industry stakeholder presentations ................................................................................ 12
     Factors influencing public transport patronage trends............................................................... 12
     Prioritisation of infrastructure investment proposals in the face of uncertainty ......................... 12
     4.3.      PATREC PSS platform visualisation .............................................................................. 12
5.      Policy impacts......................................................................................................................... 14
     5.1.      Factors influencing public transport patronage trends ................................................... 14
     5.2.      Digital journey planning impacts on patronage .............................................................. 14
     5.3. Adapting strategic road asset management practice to account for uncertainty relating to
     CAVs ........................................................................................................................................ 15
     5.4.      Prioritisation of infrastructure investment proposals in the face of uncertainty.............. 15
6.      Recommendations for further research ................................................................................. 16
Appendix A: User Guide for viewing data layers on PATREC PSS platform (extension to RailSmart)
    ................................................................................................................................................ 17

                                                                                                                                          Page 1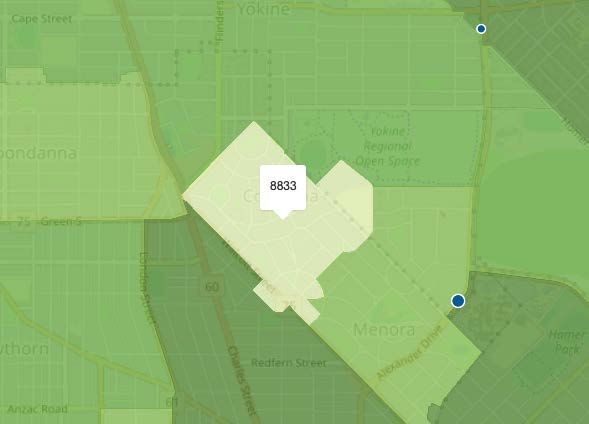
Managing Transport System Investment Risk

1.       Introduction
1.1. Overall policy need
The context for transport planning activities is changing, as technology development, consumer
demand and transport service business models change, and it is expected that there will be further
changes on the horizon due to connected, shared, electric and automated vehicles, as well as other
new and future changes in travel behaviour. Long term transport infrastructure, planning and policy
decisions are increasingly made in an environment that is volatile, uncertain, complex and ambiguous.

At the same time, the quantity and quality of public and privately-owned transport data is increasing
and there are emerging opportunities to improve our planning tools. Changes in technology also open
avenues to improve transport service options (e.g. mobility as a service) and better optimise the use of
the transport system. The assumptions that underlie existing public transport prediction models have
not yet been adjusted to account for recent and emerging trends in the transport environment

Given the changing context for transport planning, the Transport Portfolio needs to consider what
improvements can be made to existing practice and processes to ensure decision makers have the
best possible advice, considering potential changes in the transport system.

Adapting portfolio-wide strategic infrastructure investment planning and management tools, guidelines
and frameworks is required to account for recent trends and emerging risks, in particular:

     •   patronage forecasting tools through an advanced understanding of factors influencing
         patronage trends;
     •   digital journey planning tools;
     •   asset management guidelines; and
     •   project assessment and prioritisation frameworks.

1.2. Specific policy needs
1.2.1. Factors influencing patronage trends
Public transport patronage forecasting models currently used have previously been adequate in
predicting public transport patronage with reasonable levels of accuracy. These models were however
unable to predict the decline in fare-paying boardings, evident since 2012/13 (although there are signs
of some improvement in patronage from 2019). This has significant implications for prediction of fare
revenues, provision of operating subsidies and the ability to anticipate changes in public transport
demand to inform levels of service provision and future investment decision making. Contributing
factors proposed to date include CBD office vacancy rates, fuel prices, public transport fares and the
uptake of ride sharing. The significance of these relationships has not been statistically confirmed and
there is a need to undertake more robust and detailed analyses

A range of socio demographic trends which are likely to have a bearing on public transport use are also
emerging (e.g. lower licence acquisition and car ownership amongst millennials, greater casualisation
of the workforce, increased working from home etc.). Research and analysis to explore the relationship
between public transport usage and these broader trends is warranted to inform transport and economic
models as well as policy and project development. In particular, the research is required to inform the
work of the Transport Portfolio’s Public Transport Optimisation (PTO) project. Another driver for this
research is to facilitate the development of a range of customer-centric initiatives to optimise (public
transport related) travel behaviour in the short term as a precursor to development work on longer term
service innovation initiatives.

                                                                                               Page 2
Managing Transport System Investment Risk

1.2.2. Digital journey planning impact on travel choice

Individual transport customers rely on various digital information sources to plan and maintain
routine travel. At present these sources include private journey planners such as Google Maps
and State Government services such as the Transperth Journey Planner. Despite the popularity
of these services, their use and associated impact on mode share is not well understood within the
Perth context. Do these services facilitate mode change, or have they contributed to the changes
in mode share observed between the 2011 and 2016 Censuses? How can these services be
improved or supplemented to optimise use of the transport network?

As Perth continues to see changing trends in the usage of differing transport modes – with both
the introduction of Mobility as a Service (MaaS) options and a decrease in public transport
patronage – the impact of digital journey planners continues to remain unexplored. These journey
planners, software applications which run on a variety of systems including now-ubiquitous
smartphones, allow transport consumers to better understand and interact with the operational
characteristics of differing transport modes. The research will inform planning and decision-making
processes throughout the Transport Portfolio, particularly digital journey planning services, MaaS,
travel behaviour change, public transport optimisation with associated business case development
and project prioritisation.

1.2.3. Asset management

Road asset planners and managers are guided in their work by international, national and state
standards and guidelines such as ISO 550000 series and PAS 55 on asset management, ISO
31000 on risk management, Austroads GAM and Austroads Road Design Guidelines, WA
Treasury Asset Management Guidelines, to name the most relevant. Disruptive technologies such
as CAV may result in changes to the established practice of asset planning and management
resulting in the need to revise and adapt relevant guidelines. The findings of this research will offer
a strategic perspective on how to rethink the way transport infrastructure assets facilitate the
delivery of services into the future; and how to plan for and manage transport infrastructure assets
in the future.

1.2.4. Infrastructure project appraisal

Decision making about infrastructure investment is based on the net impacts measured by the host
government through project evaluation. Project evaluation is a process of measuring impacts and
risks of a project for the purpose of assessing and prioritising projects, in order to ensure that the
project is beneficial with respect to the public good. The Transport Portfolio needs to consider
future uncertainties within their project assessment and prioritisation framework to ensure that their
advice to the decision makers considers potential future changes to the transport systems. The
research will also complement other initiatives within the Transport Portfolio including the update
of the Investment Decision Framework.

1.3. Project aims and objectives
The project aim was to enhance and adapt selected portfolio-wide, strategic transport
infrastructure investment planning and management tools, guidelines and frameworks, to account
for emerging risks and trends in order to ensure that decision makers have the best possible advice
on which to base infrastructure investment decisions, considering the uncertainty of potential
changes impacting the transport system.

The project objectives were to:

    1. determine the systemic factors driving patronage shifts (including long term labour
       market characteristics, post GFC demographic shifts, increased capacity in road

                                                                                              Page 3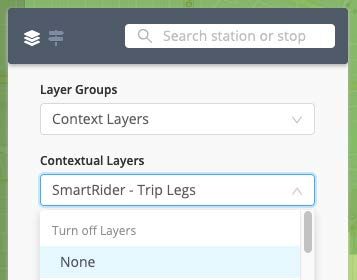
Managing Transport System Investment Risk

        infrastructure, CBD parking costs and transport trends such as: ridesharing, licenses, fuel
        prices, vehicle ownership), to: (i) enhance the public transport patronage forecasting model
        for the improved prediction of fare revenues, operating subsidy requirements, levels of
        service provision and service innovations; and (ii) to facilitate the development of a range
        of customer centric initiatives to optimise (public transport related) travel behavior;
     2. understand customer experiences of digital journey planning services and influence on
        mode share for all routine trip purposes (work, school, shopping, recreation, etc) and
        identify potential improvements to journey planning services in order to ultimately inform
        the development of a range of customer centric initiatives to optimise ( non-car based)
        travel behavior;
     3. identify specific impacts of specifically, CAV, disruptive technologies on road (and road/rail
        interface) asset management practice as well as response actions and opportunities for
        innovation in order to adapt templates and guidelines; and
     4. propose adaptation strategies to appraise the uncertainties of emerging technologies
        within the project assessment and prioritisation framework to ensure that advice to decision
        makers explicitly considers potential future changes to the transport systems.

1.4. Purpose of this report
The research was conducted through four separate sub-projects corresponding with the four
research objectives. Each sub-project has a final report, including Executive Summary, detailing
the specific objectives, methodology and results. The intention with this close-out report is to
provide a consolidated summary of findings across the four sub-projects as well report on the
dissemination of the research, policy impacts and recommendations for further research.

2.       Research approach
2.1.1. Understanding systemic factors driving patronage shifts

Bus and train patronage data were investigated using spatial regression, latent growth and
difference-in-difference analysis; and pattern recognition clustering techniques, to understand and
estimate public transport demand relationships in relation to:

     •   factors influencing public transport patronage trends over the period 2009 to 2019 (Phase
         1)
              o Internal – fares, price of competing modes (e.g., car ownership and use, fuel price,
                  quality of service (service kilometres), journey distance (O-D)); and
              o External - economic activity indicators (unemployment, state national product,
                  wage index, transport price index, office vacancy rates, number of visa workers,
                  CPI, mining jobs), and city-wide accessibility (travel time between origins and
                  destinations).
     •   a more detailed assessment of factors associated with changes in public transport ridership
         in terms of spatial variation and variation across different user profiles between January
         2015 and August 2019 (Phase 2)
              o Internal (to transport system) factors – fares, extent of service (service kilometres),
                  provision of park-and-ride bays, road congestion, and journey distance (origin-
                  destination O-D); and
              o External – socio-economic activity indicators (population density, unemployment,
                  vacancy rates), city-wide accessibility (travel time between O and D), as well as
                  urban facilities present within suburbs.

2.1.2. Determining digital journey planning impacts on patronage

An understanding of the use of journey planning apps and associated impact on mode share within
the Perth context was obtained through:
                                                                                              Page 4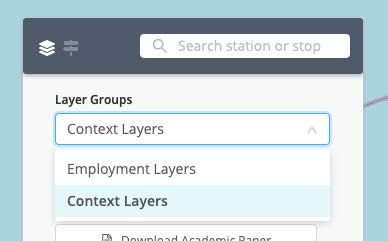
Managing Transport System Investment Risk

   •   building a comprehensive understanding of customer use and experiences of digital
       journey planning services for all routine trip purposes (work, school, shopping, recreation,
       etc),
   •   determining the influence of journey planning on mode share;
   •   identifying gaps in journey planning information and their influence on mode choice; and
   •   making recommendations relevant to journey planning services within the context of MaaS.

Firstly, a literature review was undertaken to ascertain survey techniques for travel behaviour and
mobile app usage. This led to the use of a stated preference-style survey where respondents
described what they had done with respect to transport and journey planner usage and what their
preferences were in the future.

Next, a market analysis of journey planning applications was undertaken of approximately 40 apps
and websites to understand what features they provided and which apps provided which features.

A computer assisted telephone interview survey was then undertaken of 402 Perth residents over
the age of 18, which was considered representative when considering the parameters of the
sample, which were considered ‘standard’ for a survey of this scope. Due to the COVID-19
pandemic, the scope of the survey was extended to also understand how travel behaviour had
changed due to the pandemic.

2.1.3. Adapting strategic road asset management practice to account for
       uncertainty relating to CAVs

Guidance on strategic asset management planning for transport infrastructure and service delivery
in the future to account for uncertainty of CAVs was provided through:

   •   offering a strategic perspective to rethink the way transport assets facilitate the delivery of
       services into the future; and
   •   establishing a guideline for setting business development objectives and contributing to
       desired strategic asset management outcomes in the next generation transport context.

This sub-project explores how they may affect the asset and the business of managing the asset,
throughout its life cycle. More specifically, the impact of CAV on asset management is assessed
according to:

   •   two CAV uptake scenarios: less than 100% uptake and 100% uptake; and
   •   six key asset management areas: policy, strategy, planning, legislation and statutory
       requirements, customer and stakeholder expectations and risk management.

2.1.4. Adapting infrastructure project prioritisation to account for uncertainty
       relating to disruptive technology

Strategies to assess the uncertainties of emerging technologies within the assessment and
prioritisation framework were determined through an investigation of:

   •   potential impacts and implications of emerging technologies on transport infrastructure,
       planning and policy;
   •   how the uncertainties of emerging technologies can be assessed within infrastructure
       investment assessment and prioritisation; and
   •   how the assessment of uncertainties can be incorporated into the revised infrastructure
       investment assessment and prioritisation framework.

This study explores literature to first determine a Transport Infrastructure Investment Assessment
(TIIA) framework that is used typically in practice, and second to identify the impacts and
uncertainties of future mobility and transport (FMT). It then proposes a methodology that can

                                                                                             Page 5
Managing Transport System Investment Risk

improve the TIIA framework. The proposed methodology is then applied to a real-life context using
recent major transport projects. Through this, its limitations are identified and the conclusion is
developed.

The literature review aims to provide sufficient knowledge of TIIA frameworks, particularly those
that are used in practice, and the impacts and uncertainties of FMT. The scope of the review
includes the literature that describes the TIIA frameworks that are used in Australian practice and
the impacts and uncertainties of FMT. The implications for infrastructure investment assessment
and prioritisation processes are explored by examining how the potential impacts can change the
assessment outcomes.

Through reviewing existing TIIA frameworks, this study will explore appropriate ways to improve
the framework to account for the uncertainties of FMT. The proposed additional tasks should not
disrupt the existing process and/or require substantial additional resources. Therefore, this study
needs to identify the TIIA tools currently used, the data required in the assessment and the tasks
involved in the activities. Also, the appropriateness will be determined, while considering the
impacts and uncertainties of FMT to ensure that the proposed methodology effectively assess
them.

Once the proposed methodology is defined, it is applied in a real-life context by assessing existing
transport investment proposals to test its applicability and practicality. This process can improve
the methodology and identifies its limitations. Three recent major transport investment proposals
from Australia are used. These are Brisbane Metro (QLD), METRONET: Yanchep Rail Extension
(WA) and North East Link (VIC), which are all identified as high priority by Infrastructure Australia
(Infrastructure Australia, 2020).

3.     Summary of findings
3.1. Factors influencing public transport patronage trends
Perth patronage trends during the period 2009-2019 follow an S-shape curve with three periods of
change: growth, decline, and recovery, consistent with the variation of the economic indicators.

For the metropolitan areas as a whole:
    • For all journeys across the metropolitan area (for commuting and other purposes, all ticket
        types, all times) fare is a significant contributing factor to patronage numbers, second in
        importance only to bus service coverage and frequency.
    • For all journeys across all areas, bus service frequency and coverage (measured by bus
        service kilometres) is the most important factor, followed by fare and then economic factors
        (worker migration rates (worker visas) and employment rates).
    • For commuting journeys, the most important contributing factors are, as with the case of
        all journeys, bus service frequency and coverage (measured by bus service kilometres),
        followed by fare, then economic conditions (CBD office vacancy rates plays an important
        role here because it is a strong indicator for the number of jobs in the city).
    • Demand elasticities with respect to fares are -0.62 for all fares and -0.78 for commuting.

Spatial variation:
   • Fare is relatively more important for commuting journeys from outer areas – that is fare
        is relatively more important on longer commutes.
   • For commuting journeys, second to bus service frequency and coverage, fares are most
        important in outer areas while in inner areas, economic conditions (CBD office vacancy,
        employment rates) are more important than fares.
   • Bus service frequency and coverage matters most. For all fares, service km (which include
        local trips) the fares to bus service ratio is smallest for outer suburbs. However, when
        considering commuting journeys to the CBD and inner suburbs, the fare to bus service
        km is lowest for these outer suburbs.
                                                                                            Page 6
Managing Transport System Investment Risk
• For commuting journeys from outer areas, fare is twice as important as CBD office
vacancy rates for outer areas.
• For commuting journeys from inner areas, fare is approximately half as important as
office vacancy rates.
• Commuting elasticities are higher for ‘Outer’ zones.
• Whilst there are statistically significant differences across the three zones it is difficult to
argue that the magnitudes are sufficiently different to affect policy.
The more refined analysis (for different spatial areas, fare type, and factors) for the more recent
period (2014 – 2019) has shown that:
• Congestion on the roads is a significant factor some fare types indicating that continuous
improvement of road conditions (additional lanes, widening, traffic signalling etc.) can
increase driving and decrease public transport patronage.
• Park & Ride (PnR) bays at stations play an important part of Perth’s public transport
network, i.e., the count of bays is a significant explanatory variable for where standard fare
travellers commence their journeys.
• Level of service as measured by bus service km is significant for all fare types.
• Destinations with good public transport accessibility – as measured by the average journey
time to reach the destination – are associated with higher demand.
Applying the advanced regression analysis results, a number of forecasting scenarios were used
to explore the effects of changing selected internal factors (fare, bus service kilometres) on
patronage. The various scenarios produced a range of patronage effects from a decline in number
of journeys of -1.5% to an increase of 1.7%.
3.2. Digital journey planning impacts on patronage
The research showed that approximately two-thirds of respondents used journey planners at least
‘occasionally’, indicating that these systems are an important service and hence their ability to
function consistently and accurately impacts the travel decisions made by respondents.
A wide range of journey planners were found to be used on a variety of devices, with Google Maps
and the Transperth apps most common, with many users also using Apple Maps and Uber.
Primarily, this was on smartphones such as the Apple iPhone.
Many consider journey planners only relevant to shared and active transport modes. It was found
that the vast majority of respondents (approximately 88%) used them for car trips taken as a driver.
Approximately one-fifth of respondents who used journey planners used them for journeys
including a bus and one-quarter of respondents used journey planners for journeys including a
train.
Approximately 90% of respondents that used journey planners used them for new journeys they
had not undertaken before, approximately three-fifths of these respondents did not use journey
planners for regular journeys undertaken. Interestingly, a third of respondents indicated that they
had used journey planners within multi-modal journeys.
While travel time estimation and routing/navigation were deemed useful by most respondents,
there was also a level of importance given to live journey information such as live travel time. There
was, however, an unmet need of information regarding the destination within journey planners
such as search and discovery of the destination – such as attractions at the destination or ‘services’
such as food or petrol along the way.
New information such as weather information, environmental impact, booking and paying in
advance alongside alternate formats (such as smart speakers) were also of interest to
Page 7Managing Transport System Investment Risk
respondents. Many suggestions were provided for rewards systems, however the most popular
suggestions either involved money or equivalents or were related to discounts on travel.
Most respondents indicated that their behaviour would not be changed by these improvements.
However, approximately one-fifth of respondents indicated that there was at least a moderate
likelihood that these changes would lead to behaviour change.
The COVID-19 related questions showed that:
• Travel demand markedly decreased during the pandemic, with over two-thirds of
respondents indicating that they had reduced the number of journeys taken with only 3.7%
of respondents indicating that they had increased their journeys. This was to be expected
with restrictions introduced and reductions in activities due to the pandemic.
• The number of respondents working from home approximately doubled compared to
before the pandemic, with a drop of approximately two-thirds in the number of respondents
who used public transport to get to work during the pandemic, compared to before. Similar
changes were seen for journeys undertaken for social/recreational purposes.
• Most responses indicated the return of activities in some manner would be an impetus to
increase journeys undertaken again, however there was a reasonable number of
respondents (approximately 8%) who indicated that the fear of catching the virus would
prevent them from using shared modes and hence it is implied they would wait for the virus
to disappear before using these modes.
Recommendations to ensure the continued use and availability of journey planners:
• Ensure the continued supply of accurate and timely transport data in an open format - there
is a desire for live and timely transport data from respondents, and the survey has shown
that respondents use many different apps to access this data. As such, making ‘live’
information about the transport network – road, active and public transport – available to
third-party apps will ensure that it is spread as widely as possible to end users of the
system.
• Ensure the continued supply of accurate ‘secondary’ data in an open format - the provision
of information regarding the accessibility of infrastructure in a standardised format will also
ensure maximum usability of shared transport modes by those with accessibility difficulties
eg. number of park and ride bays at railway stations, condition and slope of cycle and
walking paths.
• Continue development of the Transperth app - the Transperth app remains a popular
choice of transport users within Perth. As such, its use should be continued to be
encouraged and supported as to not alienate existing users. Integration of weather
information within journey planners was identified as a popular feature by respondents and
could be implemented within the Transperth app, providing not only an enticement to public
transport users but a novel innovation compared with most other journey planners. Such
changes will not only improve the attractiveness and usage of the Transperth app through
increased functionality but can also provide a base for mobility-as-a-service systems in the
future.
• Investigate travel discounts for continued use of public and active transport modes - there
is a desire from respondents to be rewarded for continued ‘good’ use of transport systems.
While monetary incentives are a common reward identified by respondents, providing
travel discounts is a popular response that encourages further use of said desirable modes.
• Investigate provision of data in new and novel formats - many respondents identified the
provision of transport data in alternate formats as a desirable feature within journey
planners. While this could take many forms, one popular format that has been used by
other transport operators – notably airlines including Virgin Australia and Qantas – is
integration with ‘smart speaker’ assistant systems such as Amazon Alexa to provide
information regarding transport services.
Page 8Managing Transport System Investment Risk
• Provision of pre-booking of public transport including integration with Apple Pay and
Google Pay - also identified by respondents was a desire to integrate transport use with
digital wallets such as Google Pay and Apple Pay. This can be taken further to allow for
the purchasing of tickets through a smartphone, providing further convenience for transport
users. Pre-booking a service, while separate to this, can be integrated with such digital
wallets to reduce the friction of public transport usage and also to provide one component
of a mobility-as-a-service system.
3.3. Adapting strategic road asset management practice to
account for uncertainty relating to CAVs
The findings of the project are that CAV uptake will:
• Affect asset management in many areas including policy, strategy planning, customer and
stakeholder expectation, statute and legislation and risk management.
• Provide several opportunities for improving asset management outcomes including
improved road safety, decreased carbon emission, reduced traffic congestion, improve
mobility, intermodal integration, optimised supply chains and reduced transport cost.
• Present also some challenges, particularly in relation to managing a rapidly changing
transport market with a transition to Mobility as a Service (MaaS) and the rapid increase in
micro-mobility, fueled by technology changes and increased customer expectations re:
improved mobility.
In terms of the big picture for CAV uptake, asset managers need to be proactively engaged with
three key areas:
• Development of a framework for digital infrastructure to support safe, cybercrime protected
vehicle-to-vehicle and vehicle-infrastructure communication:
o Apart from sensors that capture data about an AV’s physical environment, the use
of data from other sources external to the vehicle must be included to support a
comprehensive understanding of the data.
o The provisions for collecting, sharing, storing and owning data require interventions
from the government to introduce protocols to control the data related to CAV.
o The introduction of legislation and associated regulations should align with the
global technology to ensure Australia as a key player in the global market for CAV.
o Data could provide key insights for manufacturers and consumers. This approach
could include the availability of data in real-time and post real-time for specific
platforms such as CAV and AVs. This approach will help the asset managers to
better plan infrastructure forManaging Transport System Investment Risk
driving and other causes of crashes. Further, there are issues related to safety
incidents caused by the technology – e.g. Tesla fatalities caused by automated
driving systems. These situations provide a case for policies designed to
encourage 100% uptake of CAV. Sufficient evidence on a safe, efficient and
equitable transport system by the introduction of CAVs will help government
commit to spending funds on CAV infrastructure.
o Computer hacking and terrorism by malicious hackers of both CAV and smart
infrastructure are serious concerns.
o The existence of other policy options such as pricing could ensure people are
discouraged from using non-AVs or non-shared private travel.
Overall, it is difficult to predict with a high degree of confidence all the implications for asset
management resulting from the uptake of CAV especially at the 100% uptake point. Asset
managers need to constantly monitor CAV technology progression, capture results of trials and
any relevant information available, be involved and contribute to national policies and be ready to
adapt their practice as required.
3.4. Prioritisation of infrastructure investment proposals in the
face of uncertainty
The study recommended scenario testing using a MCA approach, incorporated within the existing
Infrastructure Australia framework (Infrastructure Australia, 2018a), as the most suitable tool for
assessing the uncertainties of FMT due to technical, practicality and applicability advantages.
Testing the applicability and practicality of the recommended framework in relation to a) existing
strategic transport scenarios (Transport Portfolio, WA) and b) three large infrastructure projects
found:
• Overall, the following assumptions typically used in scenario assessment, are found as the
key factors that can influence the assessment outcomes:
o Changes in demand for PT;
o Electric vehicle and AV uptake;
o Assumption relating to congestion and pollution;
o Strategic objectives/directions; and
o Assumptions relating to economic growth.
• Assessment outcome is considerably influenced by certain features of the project scope:
o The nature of the work, whether the project is a road, PT or active travel project;
o Integration of technology features, such as better journey planning tools and more
efficient operation management systems;
o Being integrated within wider transport optimisation and service integrations, such
as being part of the MaaS scheme; and
o The testing revealed that the uncertainties associated with social value were not
fully captured. This can be due to the lack of comprehensiveness of the scenarios,
leading to a shortage of assumptions relating to social value in the scenarios used
in this study. This limits the assessment’s ability to assess the uncertainties
associated with social value. Similarly, across all scenarios, the changes in
deliverability criterion also suffered from lacking related assumptions. Additionally,
the assessment suffers from a key limitation of MCA, which is the risk of
subjectivity.
Through the testing, first, considerable demand uncertainties were evident, which can lead to
uncertainty in all benefits and disbenefits. This emphasises that all resulting impacts due to
changes in demand need to be exclusively assessed under the “changes in utilisation” criterion. It
Page 10Managing Transport System Investment Risk
also suggests that the disruption of FMT needs to be fully understood when undertaking the
assessment. Second, it found that the projects that are often inflexible in the way they can be used,
are exposed to more uncertainties than others. Third, the comprehensiveness of the assessment
depends on the comprehensiveness of the scenarios. Fourth, identifying “triggers’ would be useful
as it can flag potential loss of utilisations without any detailed analyses, which can be identified
through the assessment of FMT uncertainty.
This study considered both an increase and decrease of utilisation. This is particularly important,
given that the increase can offset the decrease, because overall network-wide impacts need to be
considered in infrastructure planning, even when assessing at project-level.
4. Dissemination
4.1. Academic publications
A number of publications have been planned and commenced. Academic publication based on the
research conducted in this project will proceed long after the closure of this project. In accordance
with the PATREC and iMOVE CRC agreements, drafts will be shared with industry partners and
iMOVE prior to publication.
Journal paper – working title Journal/s to be targeted Sub-project
Forecasting patronage using spatial- Transportation Research A Patronage trends
temporal series
A spatial model for patronage demand Transportation
Passenger churn and long-term behaviour To be decided
of public transport usage using micro-data
Analysis of views and behaviours of Case Studies in Transport Digital journey
Journey Planners in Perth, Australia Policy planning
Incorporating the Future Mobility and Transportation Research: Factors influencing
Transport Uncertainty Assessment into Part A: Policy and public transport
Current Transport Infrastructure Practice or Transport patronage trends
Investment Assessment Frameworks Policy
Uncertainties of Autonomous Vehicles as Asia Pacific Journal of Asset management
disruptive technology in transport Marketing and Logistics
infrastructure planning and policy” paper
Adapting Strategic Asset Management Transport Reviews
Practice for Autonomous Vehicles
Redefining Strategic Asset Management Public Management
for Connected and Autonomous Vehicles Review
using Policy Delphi Techniques
Do Effective Policies and Practices in Reliability Engineering &
Connected and Autonomous Vehicles System Safety
support Effective Safety Outcomes
Page 11Managing Transport System Investment Risk
The “Now, Near and Next” of Construction Management
Autonomous Vehicles (AVs): A Document and Economics
Analysis on current practices on AVs
Conference paper Australian and New
Zealand Academy of
Management (ANZAM)
Annual Conference, Perth,
December 2021.
4.2. Industry stakeholder presentations
Sub-project focussed dissemination took place in the form of presentations to and discussions with
small targeted stakeholders. A PATREC seminar planned to be held in the first half of 2021, will
showcase all sub-projects at a high level, to a wider audience. In addition, In addition, as the
opportunity arises, sub-project outcomes will be disseminated more widely eg. iMOVE forums and
government forums eg. further presentation to PTOPS committee and National webinar via
Engineers Australia and Asset Institute (early 2021).
Sub-project Form and Date Participation
Factors influencing public Presentation to the Public Members of the state
transport patronage trends Transport Optimisation government’s PTOPS
Steering Group (PTOPS) committee including from DoT,
held on 16 November 2020 MRWA, Treasury and PTA
Digital journey planning ‘Lunch and learn’ Over 30 participants from
impacts on patronage presentation – face-to-face primarily DoT and PTA
and online held on 2
December 2020
Adapting strategic road asset Online seminar: The Nexus Around ten representatives from
management practice to between Strategic Asset DoT, MRWA and some
account for uncertainty Management practice and participants of the policy Delphi
relating to CAVs Connected Autonomous eg ARRB
Vehicles (CAVs) held on 16
December 2020
Prioritisation of infrastructure Key stakeholder face-to- Around ten representatives from
investment proposals in the face presentation and DoT, PTA, Metronet, MRWA
face of uncertainty discussion held on 24 and IWA
September 2020
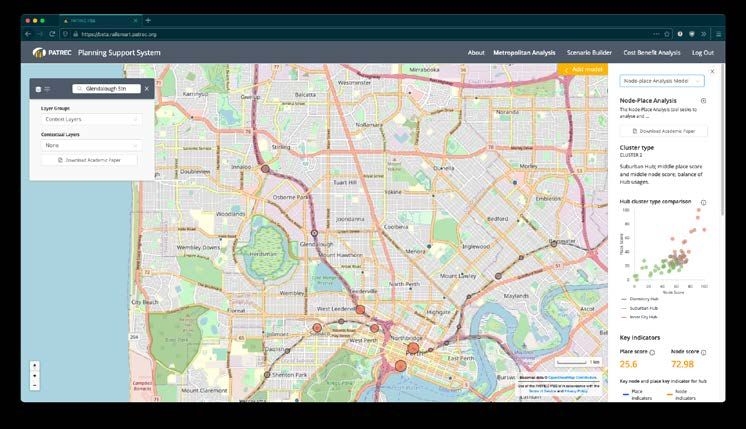
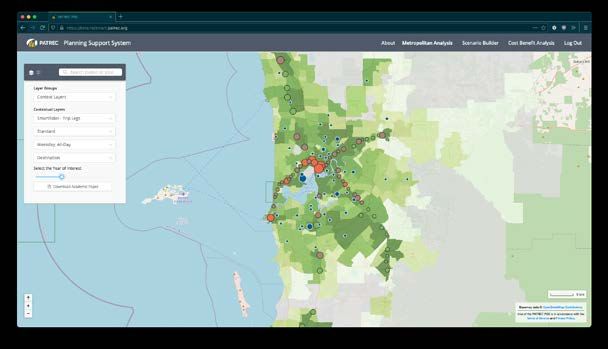
4.3. PATREC PSS platform visualisation
The PATREC Planning Support System (PSS) online platform (originally developed as part of the
RailSmart Smart Cities and Suburbs project) has been further augmented to contain the outputs
of the ‘Understanding Patronage Trends’ research project for exploration and use
(https://beta.railsmart.patrec.org/). New data layers and a hub visualisation tool have been
included.
Page 12Managing Transport System Investment Risk
The new data layers included in the platform are:
• Population density: the number of under 20’s/over 60’s/all persons per square kilometre
in each suburb for the years 2015 to 2018 inclusive, sourced from the ABS.
• Residential vacancy rate: the percentage of residences vacant in each suburb for the
years 2015 to 2019 inclusive, sourced from SQM Research.
• Petrol prices: the average sale price of unleaded petrol, in real terms (referenced to 2012)
for all petrol stations in the suburb or nearest suburb with petrol stations, for the years 2015
to 2019 inclusive, sourced from FuelWatch.
• Arterial road congestion: the weighted average speed of measured locations on the Main
Roads network in each of PATREC’s ’15 Zones’ for the years 2015 to 2019 inclusive,
sourced from Main Roads.
• Arterial road vehicle kilometres: the total vehicle kilometres travelled on the Main Roads
network in each of PATREC’s ’15 Zones’ for the years 2015 to 2019 inclusive, sourced
from Main Roads.
• SmartRider - trip legs: a trip leg is defined as a component of a public transport journey
that begins with boarding a service and ends with alighting the same service. The number
of legs taken by SmartRider users in each suburb for the years 2015 to 2018 (as is the
case for all SmartRider data layers described below) are detailed. This is split by the ticket
type – standard, student (all types), senior and concession (all other concessions), the time
period (either weekday or weekend) and the directionality (whether measured from where
boarded – origin or alighted – destination). This data is sourced from the PTA in the suburb
origin-destination format.
• SmartRider – journeys: a journey consists of a series of trip legs which is limited by the
fare rules (either 2hrs or 3rs depending on distance) to approximate the journey between
an origin and destination on the public transport system. The number of journeys taken by
SmartRider users in each suburb for the years 2015 to 2018 are detailed. This is split by
the ticket type – standard, student (all types), senior and concession (all other
concessions), the time period (either weekday or weekend) and the directionality (whether
measured from where first boarded – origin or last alighted – destination). This data is
sourced from the PTA in the suburb origin-destination format.
• SmartRider - journey to service ratio: the Journey to Service ratio divides the number of
journeys as detailed above by the number of services which run through the suburb in the
specified time period. This is split by the ticket type – standard, student (all types), senior
and concession (all other concessions), the time period (either weekday or weekend) and
the directionality (whether measured from where first boarded – origin or last alighted –
destination). This data is sourced from the PTA in the suburb origin-destination format.
• SmartRider - estimated average fare: the estimated average fare (fare at the time in
nominal dollars) is determined through modelling of the fares between suburb pairs for
each set of journeys and multiplying them by the number of journeys taken. This is split by
the ticket type – standard, student (all types), senior and concession (all other
concessions), the time period (either weekday or weekend) and the directionality (whether
measured from where first boarded – origin or last alighted – destination). This data is
sourced from the PTA in the suburb origin-destination format.
• SmartRider - estimated passenger kilometres: the estimated passenger kilometres are
calculated by multiplying the centroid-to-centroid road distance between suburb pairs by
the number of journeys taken between them. This is split by the ticket type – standard,
Page 13Managing Transport System Investment Risk
student (all types), senior and concession (all other concessions), the time period (either
weekday or weekend) and the directionality (whether measured from where first boarded
– origin or last alighted – destination). This data is sourced from the PTA in the suburb
origin-destination format.
• SmartRider - average journey length: The average journey length is calculated by
calculating the total estimated passenger kilometres and dividing by the number of
journeys. This is split by the ticket type – standard, student (all types), senior and
concession (all other concessions), the time period (either weekday or weekend) and the
directionality (whether measured from where first boarded – origin or last alighted –
destination). This data is sourced from the PTA in the suburb origin-destination format.
• GTFS - number of services: the number of services details the average number of
scheduled services which traverse the suburb by the specified time period – weekday or
weekend for the specified mode – bus or train. This is sourced from Transperth’s public
GTFS data.
• GTFS - service kilometres: the total network kilometres travelled by all services in the
specified time period (2015 – 2019) per suburb – weekday or weekend for the specified
mode – bus or train. This is sourced from Transperth’s public GTFS data.
Accessing the hub visualisation tool including activity trend and passenger churn analysis in the
platform, is explained in sections 6 and 7 of the user guide (Appendix).
The version of RailSmart containing these datasets is different to the original RailSmart developed
for use in planning of Yanchep Rail Extension stations in association with the DoT and the City of
Wanneroo. A user guide has been produced to help inform use of the new resources within the
new version of RailSmart (Appendix A).
5. Policy impacts
5.1. Factors influencing public transport patronage trends
This research was undertaken in order to inform the enhancement of the public transport patronage
forecasting model for the improved prediction of fare revenues, operating subsidy requirements,
levels of service provision and service innovations as well as to facilitate the development of a
range of customer centric initiatives to optimise (public transport related) travel behaviour.
“Phase 1 provided detailed and novel modelling of patronage updating existing forecasting
elasticities estimates for use in operational patronage models. The outputs of this research are
feeding into fare review proposals being led by the PTA and Treasury.
Phase 2 delved more deeply into the impacts spatially and variations across different user profiles
and transport hubs. This approach was justified and provided evidence of significant spatial and
temporal variability. Phase 2 outputs will be available on the RailSmart platform to spatially inform
transport planning decisions.
The research has not resulted in development of customer centric initiatives to optimise public
transport use but increased understanding of factors required to influence patronage may be used
to feed into customer sentiment and perception market research work being undertaken by the
Department” (Jane Millar and Claire Thompson, Department of Transport, email 17 December
2020).
5.2. Digital journey planning impacts on patronage
Page 14Managing Transport System Investment Risk
The research was intended to inform planning and decision-making processes throughout the
Transport Portfolio, particularly digital journey planning services, MaaS, travel behaviour change,
public transport optimisation with associated business case development and project prioritisation.
“The research identified the reach of journey planners into everyday travel decisions for the Perth
population, hence the importance of this area of investigation for influencing travel choices.
Findings have been shared within the Portfolio to inform ongoing development of the Transperth
Journey Planner and provides a base-level understanding of journey planner functionality for the
future needs of Mobility as a Service - related policy and initiatives” (Jane Millar and Claire
Thompson, Department of Transport, email 17 December 2020).
“Well done on the presentation Tristan. I had a few people come up and say how interesting it was”
(Jane Millar, Department of Transport, email 3 December 2020).
5.3. Adapting strategic road asset management practice to
account for uncertainty relating to CAVs
The findings of this research were intended to offer a strategic perspective on how to rethink the
way transport infrastructure assets facilitate the delivery of services into the future; and how to plan
for and manage transport infrastructure assets in the future.
“In terms of the 3 reports, from an asset management practitioner’s perspective, I consider the
reports to be useful. The Literature Review with its findings gives a comprehensive picture of the
status of CAV uptake in Australia and overseas and identifies potential impact in the six asset
management areas selected. The Impact assessment via the Delphi process followed by focus
group discussion was a sound approach to identify the differences, if any, between the two uptake
scenarios, and it was also a reflection of people’s perception of the future at a point in time. It would
had been better if more people were involved in this stage, but we need to also note this happened
at the peak of the pandemic in Australia. The final report provides a good summary of the findings,
highlighting opportunities in terms of CAV uptake improving asset management outcomes.
Considering these reports are for asset managers and not for CAV experts, I do consider they
fulfilled their purpose. The main aim of the reports was to highlight areas of potential impact, not
to delve into the details of the impact” (Flori Mihai, Main Roads WA, email 22 December 2020).
5.4. Prioritisation of infrastructure investment proposals in the
face of uncertainty
The research is intended to support the Transport Portfolio in considering future uncertainties
within their project assessment and prioritisation framework to ensure that their advice to the
decision makers considers potential future changes to the transport systems. This research is
intended to complement other initiatives within the Transport Portfolio including the update of the
Investment Decision Framework.
“This report has demonstrated to the investment planning teams across the Transport Portfolio
that there are ways to improve the prioritisation of investments in the face of unknown outcomes
caused by future uncertainty associated with mobility and transport.
We need to prepare for and model scenarios into base cases and project cases. Even doing this
as a sensitivity test will deliver a greater level of confidence that projects will deliver maximum
value given an uncertain transport future.
A new Perth Transport demand model is being planned and the work from this research project
will identify scenario requirements to build in this new model” (Des Lock, Department of Transport,
email 22 January 2021).
Page 15Managing Transport System Investment Risk
6. Recommendations for further research
Understanding the changes in patronage on public transport does not tell the whole story of
transport utilisation, as trips may not have shifted from PT to private vehicle, but may have shifted
to modes such as walking and cycling (which can integrate well with PT), mixed-mode trips, new
modes of transport (such as rideshare) or may not have occurred at all, due to teleworking and job
losses. Therefore, it is vital to take private transport modes into account.
Journey planning enhancements could be informed by further research into the provision of data
in new and novel formats. While this could take many forms, one popular format that has been
used by other transport operators – notably airlines including Virgin Australia and Qantas – is
integration with ‘smart speaker’ assistant systems such as Amazon Alexa to provide information
regarding transport services, or alternatively Google Assistant or Siri. As such, integrating data
with third-party apps or providing this as a first-party service will enable an easier interaction with
public transport or active transport systems by transport users.
Further investigation into the provision of pre-booking of public transport including integration with
Apple Pay and Google Pay is also an area for future research in relation to improvement in journey
planning. Pre-booking a service, while separate to this, can be integrated with such digital wallets
to reduce the friction of public transport usage and also to provide one component of a mobility-
as-a-service system.
In addition to CAV, MaaS and micromobility are rapidly expanding markets, supported in many
countries by government policies (e.g in Paris where during COVID 19 traffic lanes were
repurposed for micromobility, mostly bicycles (Lagadic, 2020). COVID 19 has tested, among other
things, the resilience of the transport system, which was required to accommodate a sudden and
disruptive change in transport behaviour. The resilience of the transport system is ensured by
having multiple, well-connected transport options. CAV uptake, MaaS and micromobility and their
interaction will lead to the need to reconsider the utilisation of the transport space. There is a
research need to provide evidence to inform asset managers, who will have to make sense of this
complex environment, where CAV uptake is only one element, and develop policies and strategies
to reflect the reutilisation of the transport space and intermodal connectivity.
To best deal with the uncertainties of future mobility in transport infrastructure investment appraisal
processes, regularly conducting detailed analyses of status quo and emerging trends based on
recent historical data is crucial. Additionally, the use of triggers is recommended, which would be
useful to flag potential loss of utilisations without the detailed analyses of emerging trends. Further
work on analysing transport demand trends and forecasting that can feed into developing more
comprehensive scenarios would improve the capability and comprehensiveness of the proposed
methodology.
Considering the current circumstances of COVID-19, which created such a shock in health,
economy and transport, an investigation of the effect of unexpected crises could be undertaken in
future stages of the research, provided that data becomes available.
Page 16You can also read