Development of a Method to Locate Deserts and Food Swamps Following the Experience of a Region in Quebec, Canada - MDPI
←
→
Page content transcription
If your browser does not render page correctly, please read the page content below
International Journal of
           Environmental Research
           and Public Health

Article
Development of a Method to Locate Deserts and Food
Swamps Following the Experience of a Region in
Quebec, Canada
Éric Robitaille 1,2, * and Marie-Claude Paquette 1,3
 1    Institut National de Santé Publique du Québec, Montréal, QC H2P 1E2, Canada;
      marie-claude.paquette@inspq.qc.ca
 2    Department of Social and Preventive Medicine, Faculty of Medicine, University of Montréal, Montréal,
      QC H3C 3J7, Canada
 3    Department of Nutrition, University of Montréal, Montréal, QC H3C 3J7, Canada
 *    Correspondence: eric.robitaille@inspq.qc.ca; Tel.: +1-514-864-1600

 Received: 1 April 2020; Accepted: 7 May 2020; Published: 12 May 2020

 Abstract: Unhealthy eating and food insecurity are recognized risk factors for chronic diseases.
 Collective and environmental factors, such as geographic access to food condition food choices.
 The objective of this study was to map food deserts and food swamps in Gaspesie, a region of Quebec
 (Canada), using geographical information systems (GIS) and field validation. Eleven sectors (5 rural
 and 6 urban) where 5% of the Gaspesie population lives were considered food deserts. Eight sectors
 (all rural) constituting 4.5% of the population were considered food swamps. Nearly 88% (3/8) of
 food swamps were located in disadvantaged and very disadvantaged areas. The Gaspesie region
 is already actively involved in changing environments to make them conducive to healthy eating
 for all. The mapping of food deserts can support intersectoral collaboration on food security. Food
 swamp mapping will make it possible to more accurately characterize the existing food environment
 in the region. Both indicators will be useful in raising awareness and mobilizing partners for a
 comprehensive strategy to improve the food environment that is not only based on the food desert
 indicator alone but also takes into account the presence of food swamps.

 Keywords: food environment; food desert; food swamp; methodology; GIS

1. Introduction
     Healthy eating is an important determinant of health [1]. Chronic diseases, overweight and
unhealthy eating habits, especially when combined with food insecurity, compromise the population’s
health [2–4]. The high prevalence of these conditions has been shown to generate significant individual,
social, and health service costs [5,6]. It is estimated that overweight and obesity alone generate 3 billion
CAN$ in direct and indirect health care costs for the province of Quebec [7,8]. Overweight and chronic
diseases can be prevented by reducing energy intake and improving the quality of the food offer,
particularly among vulnerable populations [9].
     The adoption of healthy eating habits depends on individual and collective determinants such
as the characteristics of the physical, economic, political, and sociocultural environments [10–12].
Improving the population’s diet, therefore, requires a portfolio of multi-targeted and multi-level
strategies [13] including those aimed at improving the local food environment.

1.1. Local Food Environment and Health
     For several years now, Quebec, a province of Canada, has been investing to create healthy eating
environments for the population as a whole [14]. Previously, healthy eating was considered to be mainly

Int. J. Environ. Res. Public Health 2020, 17, 3359; doi:10.3390/ijerph17103359     www.mdpi.com/journal/ijerph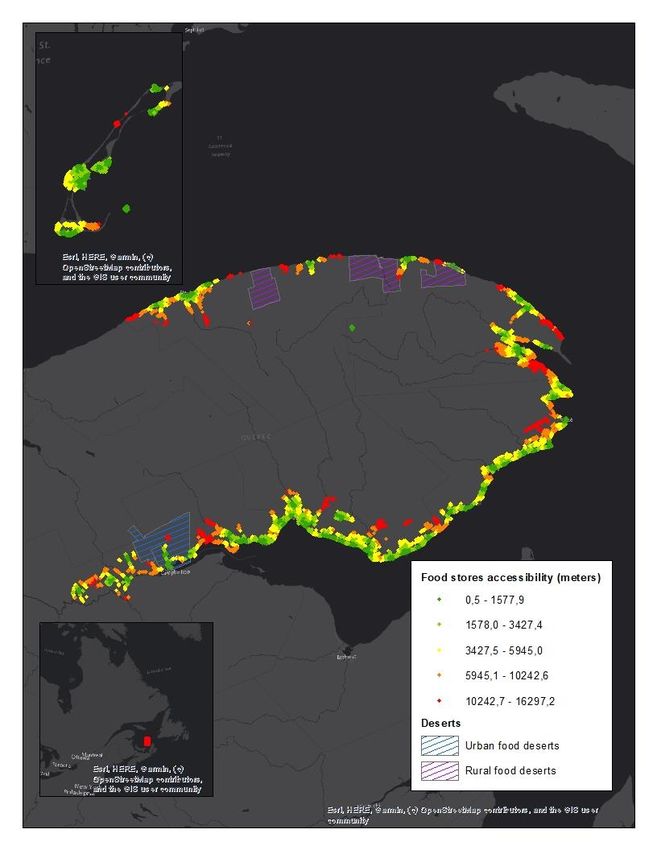
Int. J. Environ. Res. Public Health 2020, 17, 3359                                                    2 of 14

dependent on individual factors alone. However, collective and environmental factors, including
public policies, are now recognized as conditioning food choices by making them easier to make [10].
      The population’s diet is influenced by the food environment to which it is exposed [8]. In particular,
diet is associated with the community or local food environment, which refers to the characteristics
of the places where food can be obtained, i.e., the type of outlet, its location, number of shops in a
sector, and geographical accessibility [15]. The local food environment includes businesses that offer
food products for retail sale (convenience stores, grocery stores and supermarkets), restaurants (with
table service or quick service) and alternative forms of food distribution (farmers’ markets, short food
supply chain, online shopping, etc.) [15,16].
      Accessibility is a key concept when it comes to the local food environment. It encompasses
commercial availability, geographic access, convenience, economic access, and social and cultural
acceptability. This paper focuses exclusively on geographical accessibility and its influence on the
location of food deserts and food swamps [16–18].
      Several studies have shown that the availability and accessibility of healthy food can vary
according to the income and educational level of individuals living in an area [19,20]. These disparities
in access to food may in turn be related to eating habits and behaviours or obesity [17,20,21]. Access to
retailers offering healthy food in socioeconomically disadvantaged neighbourhoods is more difficult
than elsewhere. This prompted the studies on food deserts. The term food desert refers to an area that
is highly disadvantaged socioeconomically and provides poor or low access to food stores offering
food of high nutritional value in urban, non-metropolitan and rural areas [22,23]. It was originally
used in studies from the United Kingdom [19].
      Other studies in the United States and Canada have also noted that socioeconomically
disadvantaged neighbourhoods are characterized by a concentration of fast food restaurants and
convenience stores. These neighbourhoods can be considered as food swamps [24–28]. Food swamps
are food environments where access to food of low nutritional value is so important that it “drowns”
access to healthy food of high nutritional value [29]. There is no single definition or indicator of food
deserts or food swamps. This explains, for example, why some researchers consider food swamps to
be located only in disadvantaged areas [27], while others do not make this distinction [30].
      Research has shown an association between body weight and food swamps [20,26,31,32].
The results of a recent study conducted in the United States in 3141 counties shows that even
after statistically controlling for the effects of food deserts, food swamps still had a significant positive
effect on the rate of obesity in adults [33]. In this study, the regression analyses showed that the
association of food deserts to obesity became statistically insignificant when the food swamp indicator
was included [33]. These researchers concluded by recommending that policy-makers address both
food deserts and food swamps to improve the population’s eating habits and body weight [33].
Furthermore, Canadian researchers have hypothesized that in Canada, where food deserts do not seem
as widespread as in the USA, food swamps may be a more salient indicator of food environments [26].

1.2. Study Objectives
     This paper has two objectives. The first objective is to illustrate, using a method based on
geographical information systems (GIS) and field validation, the development of indicators to identify
sectors qualified as food deserts and food swamps for the region. Based on the results of this
approach, the second is to present how the regional public health authority (RPHA) disseminated food
deserts and food swamps mapping to partners and used this information to stimulate regional food
environment actions.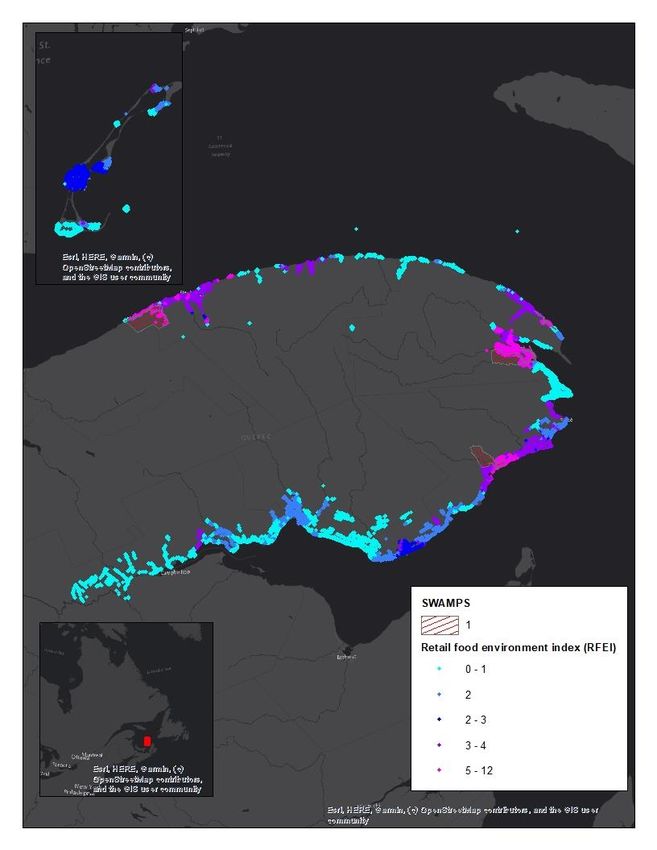
Int. J. Environ. Res. Public Health 2020, 17, 3359                                                  3 of 14

2. Materials and Methods

2.1. Data Sources
      Four existing governmental data sets were used to operationalize the indicators on food
deserts and food swamps: (1) the location of businesses where food is sold, (2) a disadvantage
index, (3) the spatial distribution of residential units, and (4) the geometry of the Canadian census.
The Gaspesie-Iles-de-la-Madeleine (shortened to Gaspesie in this article) region, one of the 18 health
authority regions of Quebec, was chosen for this study. This eastern region of Quebec is composed of
coastal shorelines and an archipelago of islands in the St-Lawrence Gulf. The total population of the
region is around 90,000, which is distributed in city centres surrounded by large rural areas.
      The ministère de l’Agriculture, des Pêcheries et de l’Alimentation du Québec (MAPAQ)’s
(Agriculture, Fisheries and Food of Québec) 2018 registry database of food sales permits provided
information on the location of food businesses [34]. This registry collects information on various retail
permits which include the following categories: supermarkets, grocery store and convenience store,
and, fast-food restaurants [34]. Unlike data from commercial directories, registration in the food sales
permit registry is mandatory.
      The disadvantage index used was developed at the Institut national de santé publique du Québec
(INSPQ) (National Public Health Institute) [35]. It identifies sectors that are socio-economically
disadvantaged and is based on 2011 data from Statistics Canada’s National Household Survey [36].
For this analysis, the sectors considered disadvantaged are those in the 5th quintile (Q5) on the material
dimension of the deprivation index [35]. This includes about 20% of the population with the least
favourable material conditions.
      Information on the spatial distribution of residential units came from the 2016 building location
file of the ministère des Affaires municipales et de l’Occupation du territoire (Municipal Affairs and
Housing) [37].
      The geometry of the 2011 Canadian Census was used to distinguish between rural and urban areas.
Urban areas were those located in population centres that are areas with a population concentration of
at least 1000 people and a population density of at least 400 people per square kilometre [38].

2.2. Categorization of Stores Where Food Is Sold

2.2.1. Food Stores
      Generally, supermarkets, grocery stores, and fruit and vegetable stores are considered to be food
stores that offer foods of high nutritional value [39]. In the retail permit registry, supermarkets are
defined as sales establishments, with a much larger surface area than conventional grocery stores.
They have an area of more than 2500 square m. As for grocery stores and fruit and vegetable shops,
the registry defines them as “establishments ranging in size from 400 to 2500 square m, where food of
all kinds is sold ( . . . )” [34].

2.2.2. Fast Food
     As for fast food restaurants, the retail permit registry defines them as “establishments where
light meals, whether or not consumed on-site, are prepared and served”, “whose main activity
is the preparation and sale of food to be taken away or delivered” or “with counter service and
occasionally at the table, whose main activity is characterized by the preparation of specialized menus:
hamburgers, chickens, hotdogs, etc. ( . . . )”. Fast food restaurants are considered to offer foods of low
nutritional value.

2.2.3. Convenience Stores
    Convenience stores with and without gasoline sales were grouped in our typology. Most
“convenience store” type businesses were grouped in the MAPAQ database under the category of
Int. J. Environ. Res. Public Health 2020, 17, 3359 4 of 14
grocery, convenience store, or fruit and vegetable store permit. An automated search for the various
“convenience” stores was carried out. The automatic process consisted of searching through certain
keywords (i.e., convenience stores, accommodation) or company names (i.e., Proprio, Boni-Soir,
Couche-Tard) in the various fields of the database. Convenience stores are considered offering foods of
high caloric density and low nutritional value.
2.3. Geolocation of Shops and Field Validation
A batch geolocation service provided by the ministère de la Sécurité publique du Québec (Ministry
of Public Security) (2018) was used to geocode the various food stores in the regions [40]. Regional
public health professionals validated the information contained in the registry by checking if existing
stores were still in operation and by adding food stores that were not necessarily included in the registry
but which they believed contributed to the local food environment. For instance, the region’s public
health professionals decided to add fishmongers and butcher shops as food stores. Moreover, while
most studies classify convenience stores as offering unhealthy foods, their offering can differ in remote
rural areas. In some instances, public health professionals considered them as small grocery stores.
The geolocation process identified 64 food stores (supermarkets, grocery stores, fruit and vegetable
stores), 76 convenience stores, and 108 fast food restaurants. After the field validation process, 41 food
stores (fishmongers, butcher shops and convenience stores considered as grocery stores) were added,
10 convenience stores that were considered as small grocery stores were deleted and no fast-food
restaurants were added or deleted (see Table 1).
Table 1. Number of food stores before and after the field validation process.
Before Field Validation After Field Validation and Use in Analysis
# Geolocated # Geolocated of # Geolocated # Geolocated # Geolocated of # Geolocated
Food Stores Convenience Store of Fast Foods Food Stores Convenience Store of Fast Foods
64 76 108 105 66 108
2.4. Operationalization of the Food Desert Indicator
The calculation of spatial accessibility to food stores is based on the distance to food stores in
metres, calculated from the road network (reticular distance). Calculations were done using ArcGIS
10.5 software and the “network analyst” function [41]. The reticular distance is calculated between the
origin which is represented by the residential property assessment units and the nearest business. A
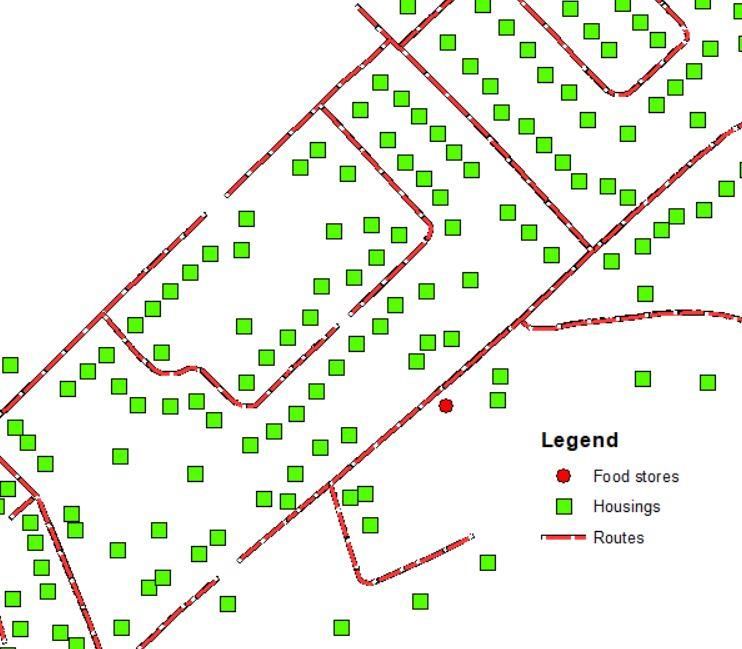
common measure in the accessibility of proximity services studies [42] (see Figure 1):
A = min dij
where
A = distance between residential units i and food store j.
One of the aspects to be considered when developing a food desert indicator is the determination
of a low access threshold. There are many definitions of a low access threshold in the scientific literature,
with distances ranging from 450 m to 1600 m in urban areas [17,43,44].
The United States Department of Agriculture (USDA) in a mapping tool for locating food deserts
in the United States uses the 1 mile (1600 m) threshold in urban areas and 10 miles (16,000 m) in rural
areas (USDA, 2018) [45]. In other words, areas with supermarkets located more than 1 mile or 10 miles
away are considered to have low access to these types of businesses. The 1000-metre threshold in
urban areas is used in this research because it is generally agreed that an adult can walk this distance
in less than 15 min. A food store located at this distance is therefore accessible to those who do not
have access to a motor vehicle, a well-developed public transit system, and to people able to walk
this distance.Int. J. Environ. Res. Public Health 2020, 17, 3359 5 of 14
In rural areas in the USA, Blanchard and Matthews (2007) and the USDA used a distance of
16,000 m [22]. The low access threshold used in the scientific literature is generally higher in rural
areas since it is agreed that motor vehicle ownership in these areas is higher. Nevertheless, using
this threshold does not reflect the reality of some population groups such as persons without a car
or seniors that cannot drive. Furthermore, people without access to a motor vehicle in rural areas
may have greater difficulty accessing food than in urban areas, since the public transit system is often
non-existent
Int. orPublic
J. Environ. Res. less developed inxthese
Health 2020, 17, areas.
FOR PEER REVIEW 5 of 14
Figure
Figure 1.
1. Food
Fooddesert
desert store
store accessibility
accessibility calculation.
calculation.
In short,
One of thefood deserts
aspects to beare areas in the
considered when5th developing
quintile of the material
a food desertdeprivation
indicator isindex where access
the determination
of a low access threshold. There are many definitions of a low access threshold in thewhere
to food stores (supermarkets, grocery stores, fruit and vegetable stores) is low, that is, the
scientific
populationwith
literature, is ondistances
average more than
ranging 1000450
from m from
m to a1600foodmstore in urban
in urban areasareas and more than 16,000 m in
[17,43,44].
ruralThe
areas.
United States Department of Agriculture (USDA) in a mapping tool for locating food deserts
in the United States uses the 1 mile (1600 m) threshold in urban areas and 10 miles (16,000 m) in rural
2.5. Operationalization of Areas Qualified as Food Swamps
areas (USDA, 2018) [45]. In other words, areas with supermarkets located more than 1 mile or 10
milesToaway
mapare theconsidered
areas thatto havebe
could low access to
qualified asthese
food types
swamps,of businesses.
the Retail TheFood1000-metre
Environment threshold
Index
in urban
(RFEI) wasareas is usedfor
calculated ineach
this residential
research because
property it assessment
is generallyunitagreed that an the
by dividing adult can walk
number this
of stores
distance in less than 15 minutes. A food store located at this distance is therefore
that were less conducive to healthy eating (fast food outlets and convenience stores), by the number of accessible to those
who
storesdocategorized
not have access to a motor
as offering vehicle,
healthy fooda(supermarkets,
well-developedgrocerypublic transit
stores, system,
fruit andand to people
vegetable able
shops)
to
in walk
a 1000this
m distance.
reticular buffer zone around residential units in urban areas and 16,000 m around those
In rural
located areas
in rural in the
areas. USA, Blanchard
Subsequently, data at andtheMatthews (2007) and
scale of residential the USDA
property used a distance
assessment units wereof
16,000 m [22].
aggregated Thescale
at the low of
access threshold areas.
dissemination used in the scientific literature is generally higher in rural
areas since it is agreed that motor vehicle ownership in these areas is higher. Nevertheless, using this
threshold does not reflectRFEI the reality ( f ast
of some f ood + convenience
population groups stores
such) as persons without a car or
=
f ood stores ( supermarket and
seniors that cannot drive. Furthermore, people without access to a motor vehiclegrocery stores ) in rural areas may
have greater difficulty accessing food than in urban areas, since the public transit system is often non-
It has been shown that RFEI is associated with a high density of stores [46,47], an area with an
existent or less developed in these areas.
RFEI higher than 5.0 is associated with higher risks of diabetes and obesity prevalence. For this study,
In short, food deserts are areas in the 5th quintile of the material deprivation index where access
food swamps were defined as areas with an average index of at least 5.0; that is, where there are on
to food stores (supermarkets, grocery stores, fruit and vegetable stores) is low, that is, where the
average 5 times more stores that are less supportive of healthy eating than there are stores that are
population is on average more than 1000 m from a food store in urban areas and more than 16,000 m
supportive of healthy eating (see Figure 2).
in rural areas.
2.5. Operationalization of Areas Qualified as Food Swamps
To map the areas that could be qualified as food swamps, the Retail Food Environment Index
(RFEI) was calculated for each residential property assessment unit by dividing the number of stores
that were less conducive to healthy eating (fast food outlets and convenience stores), by the number
of stores categorized as offering healthy food (supermarkets, grocery stores, fruit and vegetable
shops) in a 1000 m reticular buffer zone around residential units in urban areas and 16,000 m aroundInt. J. Environ. Res. Public Health 2020, 17, x FOR PEER REVIEW 6 of 14
It has been shown that RFEI is associated with a high density of stores [46,47], an area with an
RFEI higher than 5.0 is associated with higher risks of diabetes and obesity prevalence. For this study,
food swamps were defined as areas with an average index of at least 5.0; that is, where there are on
Int. J. Environ. Res. Public Health 2020, 17, 3359 6 of 14
average 5 times more stores that are less supportive of healthy eating than there are stores that are
supportive of healthy eating (see Figure 2).
Figure 2. RFEI calculation method.
3. Results
Figure 2. RFEI calculation method.
3.1. Food Deserts
3. Results
The results show that in Gaspesie, 11 sectors (dissemination areas), 5 in rural areas, and 6 in urban
areas, areDeserts
3.1. Food considered to be food deserts. This means that in these areas of high material deprivation,
for the residential property assessment unit, it is necessary to travel more than 1000 m in urban
The results show that in Gaspesie, 11 sectors (dissemination areas), 5 in rural areas, and 6 in
areas and more than 16,000 m in rural areas to reach the nearest food trade. According to 2016
urban areas, are considered to be food deserts. This means that in these areas of high material
Canadian Census data [48], 4499 people, which represent 5% of the region’s population, live in a food
deprivation, for the residential property assessment unit, it is necessary to travel more than 1000 m
desert. Figure 3 illustrates the spatial distribution of areas referred to as food deserts and the level of
in urban areas and more than 16,000 m in rural areas to reach the nearest food trade. According to
geographical access to food stores (Figure 3).
2016 Canadian Census data [48], 4499 people, which represent 5% of the region’s population, live in
a3.2.
food desert.
RFEI Figure
and Food 3 illustrates the spatial distribution of areas referred to as food deserts and the
Swamps
level of geographical access to food stores (Figure 3).
The mean RFEI index for the region is 1.76. On average, there are approximately seven fast-food
restaurants and convenience stores for every four supermarkets and grocery stores. There does not
seem to be a trend in RFEI according to area deprivation status. However, this is not the case for food
swamps. More food swamps were found in areas with higher levels of deprivation compared to areas
with lower levels of deprivation.
Concerning food swamps, in Gaspesie, eight sectors (dissemination areas), all in rural areas and
none in urban areas, are considered food swamps (Table 2). In these sectors, the RFEI is above 5.0. This
means that there are five convenience or fast food stores for each supermarket, grocery, or fruit and
vegetable store in these areas. In this region, all food swamps are located in rural areas and nearly 88%
(3/8) are located in disadvantaged or very disadvantaged areas (quintiles 4 and 5). It is also in these
sectors that the RFEI is the highest. In urban areas, no food swamps were identified. According to the
2016 Canadian Census data [48], 4128 people live in a food swamp, representing 4.5% of the region’s
population. Figure 4 shows the spatial distribution of the areas referred to as food swamps and the
RFEI (Figure 4). No area is both desert and swamp.Int. J. Environ.
Int. J. Environ. Res.
Res. Public
PublicHealth
Health 2020, 17, x3359
2020, 17, FOR PEER REVIEW 77 of
of 14
14
Figure 3. Food desert localization.
Figure 3. Food desert localization.
2. Average
Tableand
3.2. RFEI level of the RFEI and number of sectors qualified as food swamps by disadvantage
Food Swamps
quintiles of RFEI # of sectors in rural areas # of sectors in urban areas.
The mean RFEI index for the region is 1.76. On average, there are approximately seven fast-food
Quintiles of Disadvantage Mean Level of # of Sectors in
restaurants and convenience stores for every four supermarkets and #grocery
of Sectors in
stores. There
Totaldoes not
Average Level RFEI Rural Areas Urban Areas
seem to be a trend in RFEI according to area deprivation status. However, this is not the case for food
No data 1.04 0 0 0
swamps. More food swamps were found in areas with higher levels of deprivation compared to areas
1 (less deprived) 1.14 0 0 0
with lower levels of deprivation.
2 2.52 0 0 0
Concerning food swamps, in Gaspesie, eight sectors (dissemination areas), all in rural areas and
3 2.11
none in urban areas, are considered food swamps (Table1 2). In these sectors, 0
the RFEI is1above 5.0.
4 2.36 4 0
This means that there are five convenience or fast food stores for each supermarket, grocery, 4 or fruit
5 (more deprived) 2.22 3 0 3
and vegetable store in these areas. In this region, all food swamps are located in rural areas and nearly
Total in disadvantaged
88% (3/8) are located 1.76 8
or very disadvantaged 0
areas (quintiles 8 is also in
4 and 5). It
these sectors that the RFEI is the highest. In urban areas, no food swamps were identified. According
to the 2016 Canadian Census data [48], 4128 people live in a food swamp, representing 4.5% of the
region’s population. Figure 4 shows the spatial distribution of the areas referred to as food swamps
and the RFEI (Figure 4). No area is both desert and swamp.2 2.52 0 0 0
3 2.11 1 0 1
4 2.36 4 0 4
5 (more deprived) 2.22 3 0 3
Int. J. Environ. Res. Public Health 2020, 17, 3359 8 of 14
Total 1.76 8 0 8
Figure 4. Swamp area localization.
Figure 4. Swamp area localization.
3.3. Examples of Regional Actions and Policy Implications Following Local Food Environment Mapping
3.3. Examples of Regional
Residential Actions and Policy
areas corresponding to theImplications Following
criteria of food Local
deserts andFood
foodEnvironment
swamps wereMapping
mapped in
urban and rural areas of the region. These maps reflect the geographical accessibility to food retailers
Residential areas corresponding to the criteria of food deserts and food swamps were mapped
in a region. They are complementary to regional expertise and observations and can be used as a basis
in urban and rural areas of the region. These maps reflect the geographical accessibility to food
to generate reflection and action on the local food environment.
The food desert maps can support several actors in their reflection on food deserts and on
initiatives that need to be considered to improve food security and access to healthy food. Intersectoral
regional instances on poverty can use the food desert maps in their work to decrease food insecurity
as decision support tools. Some RPHA professionals could also use the food desert maps to build
policy briefs for regional governing bodies and raise awareness and promote initiatives that increase
access to healthy foods such as the opening of a farmers’ market or in a meeting on agricultural zoning
development plans.
In the Gaspesie region, the food desert maps were used as key information for the development
of a food system approach that translates to “Feeding our people; A collective reflection on food
autonomy” [49].Int. J. Environ. Res. Public Health 2020, 17, 3359 9 of 14
4. Discussion
The first objective of this study was to develop indicators of food deserts and food swamps to
be used by the Gaspesie region. It also aims to present how regional public health authorities can
use these indicators and food environment mapping to raise awareness, mobilize and support their
partners to act on the characteristics of the region’s food environment to increase food access and
reduce food insecurity.
Analysis of the Gaspesie food landscape revealed that 11 sectors, both urban and rural, are
characterized by poor access to stores offering healthy food. This represents 5% of the region’s
population. Also, eight sectors (4.5% of the region’s population) are qualified as food swamps meaning
that in these sectors foods of low nutritional value are prominent. An important proportion of residents
(88% (3/8)) that are exposed to food swamps live in disadvantaged areas. This means that about 10% of
the region’s residents are exposed to a food environment that is not conducive to healthy eating.
Research on food swamps is in its infancy; however, some authors suggest that these environments
have particularly pernicious effects by encouraging people to make poorer food choices since they
are made quickly to experience immediate gratification [50]. Bridle-Fitzpatrick (2015) [51] notes that
participants in her study who were continuously exposed to foods and beverages of low nutritional
value reported that they now perceive these products as normal and that their desire to consume
them was therefore increased. In their study, exposure to food swamps appeared to influence not only
food choices, but also food preferences and norms. This author, therefore, considers that actions on
food deserts are necessary, but insufficient to “clean up” food swamps, which requires more robust
interventions than increasing access to healthy food for disadvantaged populations [51].
It has been suggested that in urban areas in Canada, food swamps may be a more salient
metaphor to characterize the food environment than food deserts [26]. This study shows that in a rural
setting, food deserts and food swamps co-exist. Still, more research needs to be done to elucidate the
associations between the indicators of the food environment, eating behaviours, food insecurity, and
indicators of health.
Public health agencies and researchers recognize the importance of developing and strengthening
the local food environment to make it favourable to healthy eating and supportive of food
security [52–55]. Promising interventions to improve physical access to food can be divided into
four categories: introducing new conventional sources of supply (e.g., supermarkets) [56–58] or
alternative sources of supply (e.g., solidarity grocery stores, public markets, and mobile markets) [59–61],
improving in-store food offering (e.g., fruits and vegetables in convenience stores) [62,63], land use
planning (e.g., zoning) [64], and, increasing mobility (transportation infrastructure) [63].
In 2014, the CDC published a guide outlining strategies to be carried out to improve physical access
to more nutritious food [65]. Before putting into place promising interventions such as those outlined
above, they propose to initially evaluate the characteristics of the food environment. The methods
illustrated in our research could facilitate this evaluation of the local food environment. For example,
in the United States, interventions to increase healthy food access often take the form of tax exemption,
financial incentives or zoning by-law amendments to encourage entrepreneurs to open a new grocery
store or supermarket in communities designated as food deserts [66]. Notably, in Philadelphia in recent
years, the Pennsylvania Fresh Food Financing Initiative (public-private partnership) has funded the
establishment of many food stores and cooperatives [67]. Urban or community-supported agriculture
could also improve the situation of people living within areas known as deserts and food swamps.
This is the conclusion of the analyses of urban agriculture initiatives in New York and Detroit. Urban
agriculture becoming the starting point of a food system by providing, for example, produce to local
markets [68,69].
The Gaspesie region has also put into place interventions to improve access and reduce food
insecurity. Notably, they invested in increasing mobility to facilitate access to existing shops by
providing buses that go to local stores. This type of intervention could also be beneficial in influencing
food swamps since a recent study reported a greater association between food swamps and obesityInt. J. Environ. Res. Public Health 2020, 17, 3359 10 of 14
in areas where the population had lower mobility [33]. Improving population mobility reduces the
impact of food deserts and food swamps on the population.
The food swamp map of Gaspesie could also be used to implement measures that would limit the
introduction of new fast food or convenience stores in areas identified as being at risk because of the
higher density of these types of businesses compared to supermarkets, grocery stores and fruit and
vegetable stores [29].
The food desert and food swamp data reported in this study should be interpreted with caution.
Several limitations are associated with the methods used. First, there is no universal measure of
deserts and food swamps, nor is there consensus on the thresholds to be used that are associated with
consequences on food quality or population health. Second, the categorization of food stores based
on MAPAQ’s registry is not optimal, as some stores categorization could not accurately reflect the
products offered and new stores could have opened that would not be included in the registry. This
limitation is often raised in the literature [70,71]. We have addressed this limitation by using field
validation with public health professionals to improve the validity of the MAPAQ registry.
Furthermore, the RPHA decided to add fishmongers to the healthy stores category as well as
fruit and vegetable shops. These stores were not initially included in the indicator as it was deemed
that they could not provide the wide range of foods that are necessary for healthy eating. In total the
region added 41 food stores and deleted 10 convenience stores. These changes to the database in effect
“decreased” the number of food deserts and of food swamps than would have been identified if using
only the MAPAQ registry.
An additional limitation is the variable offering found in some food stores. For example, while
supermarkets qualify as stores offering food of high nutritional value they also offer a wide range of
foods of low nutritional value [72].
Finally, physical accessibility is only one way of describing the food environment. Some argue
that the concepts of deserts or food swamps place too much emphasis on spatial distribution to the
detriment of other dimensions of accessibility such as income, household characteristics, transportation
opportunities and the notion of (available) time, which are also factors that need to be addressed
because they are closely related to eating behaviours [29,73].
5. Conclusions
This study has shown the presence of food deserts and food swamps in Gaspesie, a region located
in Canada’s province of Quebec. The mapping of food environments represents an interesting tool for
mobilization and reflection to implement interventions that can promote the creation and development
of environments more conducive to healthy lifestyles [74,75].
In recent years, the Gaspesie region used the mapping of food deserts to support the discussions
with their partners. The addition of a food swamp mapping will allow them to more accurately
characterize the existing food environment in the region. It will be useful in raising awareness and
mobilizing partners for a comprehensive strategy to improve the food environment that is not only
based on the desert indicator alone, but also takes into account the presence of food swamps.
Author Contributions: Conceptualization, M.-C.P. and É.R.; methodology, É.R.; software, É.R.; validation, M.-C.P.;
formal analysis, É.R.; writing—original draft preparation, M.-C.P. and É.R.; writing—review and editing, M.-C.P.
and É.R. All authors have read and agreed to the published version of the manuscript.
Funding: This research was funded by the Quebec Population Health Research Network (QPHRN) and by the
ministère de la Santé et des Services sociaux du Québec.
Acknowledgments: The authors thank the Quebec Population Health Research Network (QPHRN) for its
contribution to the financing of this publication.
Conflicts of Interest: The authors declare no conflict of interest.Int. J. Environ. Res. Public Health 2020, 17, 3359 11 of 14
References
1. Institute for Health and Evaluation Global Burden of Disease (GBD). Available online: http://www.healthdata.
org/gbd (accessed on 8 May 2018).
2. Garriguet, D. Canadians’ eating. Health Rep. 2007, 18, 17. [PubMed]
3. Garriguet, D. Diet quality in Canada. Health Rep. 2009, 20, 41. [PubMed]
4. WHO. Diet, Nutrition and the Prevention of Chronic Diseases. Available online: https://www.who.int/
dietphysicalactivity/publications/trs916/en/ (accessed on 29 April 2020).
5. Martel, S.; Lo, E.; Jen, Y.; Hamel, D.; Lamontagne, P.; Blouin, C. Poids Corporel et Santé Chez Les Adultes
Québécois; Fardeau du poids corporel; Institut national de santé publique du Québec: Montreal, QC, Canada,
2014; ISBN 978-2-550-69662-9.
6. Lieffers, J.R.L.; Ekwaru, J.P.; Ohinmaa, A.; Veugelers, P.J. The economic burden of not meeting food
recommendations in Canada: The cost of doing nothing. PLoS ONE 2018, 13, e0196333. [CrossRef] [PubMed]
7. Blouin, C.; Vandal, N.; Barry, A.D.; Jen, Y.; Hamel, D.; Lo, E.; Martel, S. Les Conséquences Économiques
Associées à L’obésité et à L’embonpoint au Québec: Les Coûts Liés à L’hospitalisation et aux Consultations Médicales;
Fardeau du poids corporel; Institut national de santé publique du Québec: Montreal, QC, Canada, 2015;
ISBN 978-2-550-72043-0.
8. Blouin, C.; Vandal, N.; Hamel, D.; Jen, Y.; Lo, E.; Martel, S. Les Conséquences Économiques Associées à L’obésité et
L’embonpoint au Québec: Les Coûts Liés à la Consommation de Médicaments et à L’invalidité; Fardeau du poids
corporel; Institut national de santé publique du Québec: Montreal, QC, Canada, 2015; ISBN 978-2-550-73814-5.
9. Committee on Accelerating Progress in Obesity Prevention; Food and Nutrition Board; Institute of Medicine.
Accelerating Progress in Obesity Prevention: Solving the Weight of the Nation; Glickman, D., Parker, L., Sim, L.J.,
Del Valle Cook, H., Miller, E.A., Eds.; National Academies Press (US): Washington, DC, USA, 2012.
10. Raine, K.D. Determinants of healthy eating in Canada: An overview and synthesis. Can. J. Public Health Rev.
Can. Sante Publique 2005, 96 (Suppl. 3), S8-14–S8-15.
11. Story, M.; Kaphingst, K.M.; Robinson-O’Brien, R.; Glanz, K. Creating healthy food and eating environments:
Policy and environmental approaches. Annu. Rev. Public Health 2008, 29, 253–272. [CrossRef]
12. Giskes, K.; van Lenthe, F.; Avendano-Pabon, M.; Brug, J. A systematic review of environmental factors and
obesogenic dietary intakes among adults: Are we getting closer to understanding obesogenic environments?
Obes. Rev. Off. J. Int. Assoc. Study Obes. 2011, 12, e95–e106. [CrossRef]
13. WCRF. Our Policy Framework to Promote Healthy Diets & Reduce Obesity. Available online: https://www.
wcrf.org/int/policy/nourishing/our-policy-framework-promote-healthy-diets-reduce-obesity (accessed on
29 April 2020).
14. Lachance, B.; Pageau, M.; Roy, S. Investir Pour L’avenir Plan D’action Gouvernemental de Promotion des Saines
Habitudes de vie et de Prévention des Problèmes Reliés au Poids 2006-2012; Santé et services sociaux Québec:
Quebec, QC, Canada, 2006; ISBN 2-550-47403-1.
15. Glanz, K.; Sallis, J.F.; Saelens, B.E.; Frank, L.D. Healthy nutrition environments: Concepts and measures.
Sect. Sci. Health Promot. 2005, 19, 330–333. [CrossRef]
16. Cummins, S.; Macintyre, S. Food environments and obesity—Neighbourhood or nation? Int. J. Epidemiol.
2006, 35, 100–104. [CrossRef]
17. Wrigley, N. “Food deserts” in British cities: Policy context and research priorities. Urban Stud. 2002,
39, 2029–2040. [CrossRef]
18. Penchansky, R.; Thomas, J.W. The concept of access: Definition and relationship to consumer satisfaction.
Med. Care 1981, 127–140. [CrossRef]
19. Beaulac, J.; Kristjansson, E.; Cummins, S. A systematic review of food deserts, 1966–2007. Prev. Chronic Dis.
2009, 6, 1–10.
20. Black, C.; Moon, G.; Baird, J. Dietary inequalities: What is the evidence for the effect of the neighbourhood
food environment? Health Place 2014, 27, 229–242. [CrossRef] [PubMed]
21. Zenk, S.N.; Schulz, A.J.; Israel, B.A.; James, S.A.; Bao, S.; Wilson, M.L. Neighborhood racial composition,
neighborhood poverty, and the spatial accessibility of supermarkets in metropolitan Detroit. Am. J.
Public Health 2005, 95, 660–667. [CrossRef] [PubMed]Int. J. Environ. Res. Public Health 2020, 17, 3359 12 of 14
22. Blanchard, T.C.; Matthews, T.L. Retail Concentration, Food Deserts, and Food-Disadvantaged Communities
in Rural America. In Remaking the North American Food System; Hinrichs, C., Lyson, T., Eds.; University of
Nebraska Press: Lincoln, NE, USA, 2007.
23. Morton, L.W.; Blanchard, T.C. Starved for access: Life in rural America’s food deserts. Rural Realities 2007, 1,
1–10.
24. Hemphill, E.; Raine, K.; Spence, J.C.; Smoyer-Tomic, K.E. Exploring obesogenic food environments in
Edmonton, Canada: The association between socioeconomic factors and fast-food outlet access. Am. J. Health
Promot. AJHP 2008, 22, 426–432. [CrossRef]
25. Smoyer-Tomic, K.E.; Spence, J.C.; Raine, K.D.; Amrhein, C.; Cameron, N.; Yasenovskiy, V.; Cutumisu, N.;
Hemphill, E.; Healy, J. The association between neighborhood socioeconomic status and exposure to
supermarkets and fast food outlets. Health Place 2008, 14, 740–754. [CrossRef]
26. Minaker, L.M. Retail food environments in Canada: Maximizing the impact of research, policy and practice.
Can. J. Public Health Rev. Can. Sante Publique 2016, 107, eS1–eS3. [CrossRef]
27. Hager, E.R.; Cockerham, A.; O’Reilly, N.; Harrington, D.; Harding, J.; Hurley, K.M.; Black, M.M. Food
swamps and food deserts in Baltimore City, MD, USA: Associations with dietary behaviours among urban
adolescent girls. Public Health Nutr. 2017, 20, 2598–2607. [CrossRef]
28. Rose, D.; Bodor, J.N.; Hutchinson, P.L.; Swalm, C.M. The importance of a multi-dimensional approach for
studying the links between food access and consumption. J. Nutr. 2010, 140, 1170–1174. [CrossRef]
29. Sushil, Z.; Vandevijvere, S.; Exeter, D.J.; Swinburn, B. Food swamps by area socioeconomic deprivation in
New Zealand: A national study. Int. J. Public Health 2017, 62, 869–877. [CrossRef]
30. Health Canada. Measuring the Food Environment in Canada. Available online: https:
//www.canada.ca/en/health-canada/services/food-nutrition/healthy-eating/nutrition-policy-reports/
measuring-food-environment-canada.html (accessed on 3 March 2020).
31. Santé Canada. Mesure de L’environnement Alimentaire au Canada; Gouvernement du Canada: Ottawa, ON,
Canada, 2013; p. 98.
32. Andrews, M.R.; Ayers, C.; Ceasar, J.; Claudel, S.; Das, S.; Neeland, I.; Tamura, K.; Powell-Wiley, T. Abstract
P322: The Relationship Between Neighborhood Food Environment and Adiposity Measures: Data From the
Dallas Heart Study. Circulation 2018, 137, AP322.
33. Cooksey-Stowers, K.; Schwartz, M.B.; Brownell, K.D. Food Swamps Predict Obesity Rates Better Than Food
Deserts in the United States. Int. J. Environ. Res. Public. Health 2017, 14, 1366. [CrossRef] [PubMed]
34. MAPAQ. Permis de Vente D’aliments; MAPAQ: Quebec, QC, Canada, 2018.
35. Gamache, P.; Hamel, D. Guide Méthodologique: L’indice de Défavorisation Matérielle et Sociale en Bref ; INSPQ:
Québec, QC, Canada, 2015.
36. Statistique Canada. Statistique Canada: Enquête nationale Auprès des Ménages (ENM) de 2011. Available
online: http://www12.statcan.gc.ca/nhs-enm/index-fra.cfm (accessed on 15 September 2015).
37. MAMH. Rôle D’évaluation Foncière. Available online: https://www.mamh.gouv.qc.ca/evaluation-fonciere/
evaluation-fonciere-municipale-au-quebec/role-devaluation-fonciere/ (accessed on 11 April 2020).
38. Statistique Canada. Dictionnaire du Recensement de 2011; Statistique Canada: Ottawa, ON, Canada, 2011.
39. Mahendra, A.; Polsky, J.Y.; Robitaille, É.; Lefebvre, M.; McBrien, T.; Minaker, L.M. Status report—Geographic
retail food environment measures for use in public health. Health Promot. Chronic Dis. Prev. Can. Res.
Policy Pract. 2017, 37, 357–362. [CrossRef] [PubMed]
40. Adresses Québec. Available online: http://adressesquebec.gouv.qc.ca/index.asp (accessed on 11 April 2020).
41. ESRI. Arcgis 10.5.1; ESRI: Redland, CA, USA, 2017.
42. Apparicio, P.; Gelb, J.; Dubé, A.-S.; Kingham, S.; Gauvin, L.; Robitaille, É. The approaches to measuring the
potential spatial access to urban health services revisited: Distance types and aggregation-error issues. Int. J.
Health Geogr. 2017, 16, 32. [CrossRef] [PubMed]
43. Algert, S.J.; Agrawal, A.; Lewis, D.S. Disparities in access to fresh produce in low-income neighborhoods in
Los Angeles. Am. J. Prev. Med. 2006, 30, 365–370. [CrossRef] [PubMed]
44. Apparicio, P.; Cloutier, M.-S.; Shearmur, R. The case of Montréal’s missing food deserts: Evaluation of
accessibility to food supermarkets. Int. J. Health Geogr. 2007, 6, 4. [CrossRef]
45. USDA. USDA ERS—Food Access Research Atlas. Available online: https://www.ers.usda.gov/data-products/
food-access-research-atlas/ (accessed on 26 March 2018).Int. J. Environ. Res. Public Health 2020, 17, 3359 13 of 14
46. Spence, J.C.; Cutumisu, N.; Edwards, J.; Raine, K.D.; Smoyer-Tomic, K. Relation between local food
environments and obesity among adults. BMC Public Health 2009, 9, 192. [CrossRef]
47. CCPHA. Designed for Disease: The Link between Local Food Environments and Obesity and Diabetes; CCPHA:
Davis, CA, USA, 2008; p. 16.
48. Statistics Canada. 2016 Census of Population. Available online: https://www12.statcan.gc.ca/census-
recensement/2016/dp-pd/index-eng.cfm (accessed on 29 April 2020).
49. Cent Degrés Nourrir Notre Monde: Les Gaspésiens se Réapproprient Leur Système Alimentaire. Available
online: https://centdegres.ca/magazine/alimentation/nourrir-notre-monde-les-gaspesiens-se-reapproprient-
leur-systeme-alimentaire/ (accessed on 31 March 2020).
50. Yang, H.; Carmon, Z.; Kahn, B.; Malani, A.; Schwartz, J.; Volpp, K.; Wansink, B. The Hot–Cold Decision
Triangle: A framework for healthier choices. Mark. Lett. 2012, 23, 457–472. [CrossRef]
51. Bridle-Fitzpatrick, S. Food deserts or food swamps?: A mixed-methods study of local food environments in
a Mexican city. Soc. Sci. Med. 1982 2015, 142, 202–213. [CrossRef]
52. Keener, D.; Goodman, K.; Lowry, A.; Zaro, S.; Kettel Khan, L. Recommended Community Strategies and
Measurements to Prevent Obesity in the United States; Department of Health and Human Services, Centers for
Disease Control and Prevention: Atlanta, GA, USA, 2009.
53. Pérez, E.; Roncarolo, F.; Potvin, L. Associations between the local food environment and the severity of food
insecurity among new families using community food security interventions in Montreal. Can. J. Public
Health Rev. Can. Sante Publique 2017, 108, e49–e55. [CrossRef]
54. Organisation Mondiale De La Santé. WHO European Action Plan for Food and Nutrition Policy 2077–2012;
WHO: Copenhagen, Denmark, 2008.
55. CDC. CDC—Zoning to Encourage Healthy Eating—Winnable Battles—Public Health Law. Available online:
http://www.cdc.gov/phlp/winnable/zoning_obesity.html (accessed on 7 February 2014).
56. Sadler, R.C. Strengthening the core, improving access: Bringing healthy food downtown via a farmers’
market move. Appl. Geogr. 2016, 67, 119–128. [CrossRef]
57. Rogus, S.; Athens, J.; Cantor, J.; Elbel, B. Measuring Micro-Level Effects of a New Supermarket: Do Residents
Within 0.5 Mile Have Improved Dietary Behaviors? J. Acad. Nutr. Diet. 2018, 118, 1037–1046. [CrossRef]
[PubMed]
58. Richardson, A.S.; Ghosh-Dastidar, M.; Beckman, R.; Flórez, K.R.; DeSantis, A.; Collins, R.L.; Dubowitz, T.
Can the introduction of a full-service supermarket in a food desert improve residents’ economic status and
health? Ann. Epidemiol. 2017, 27, 771–776. [CrossRef] [PubMed]
59. AbuSabha, R.; Namjoshi, D.; Klein, A. Increasing Access and Affordability of Produce Improves Perceived
Consumption of Vegetables in Low-Income Seniors. J. Am. Diet. Assoc. 2011, 111, 1549–1555. [CrossRef]
[PubMed]
60. Evans, A.; Banks, K.; Jennings, R.; Nehme, E.; Nemec, C.; Sharma, S.; Hussaini, A.; Yaroch, A. Increasing
access to healthful foods: A qualitative study with residents of low-income communities. Int. J. Behav. Nutr.
Phys. Act. 2015, 12 (Suppl. 1), S5. [CrossRef]
61. Gorham, G. Effectiveness of Fresh to You, a Discount Fresh Fruit and Vegetable Market in Low-Income
Neighborhoods, on Children’s Fruit and Vegetable Consumption, Rhode Island, 2010–2011. Prev. Chronic Dis.
2015, 12, E176. [CrossRef] [PubMed]
62. Hartmann-Boyce, J.; Bianchi, F.; Piernas, C.; Riches, S.P.; Frie, K.; Nourse, R.; Jebb, S.A. Grocery store
interventions to change food purchasing behaviors: A systematic review of randomized controlled trials.
Am. J. Clin. Nutr. 2018, 107, 1004–1016. [CrossRef]
63. Mah, C.L.; Cook, B.; Rideout, K.; Minaker, L.M. Policy options for healthier retail food environments in
city-regions. Can. J. Public Health 2016, 107, 5343. [CrossRef]
64. Table intersectorielle régionale en Saines habitudes de vie COSMOSS du Bas-Saint-Laurent (TIR-SHV).
In Favoriser la Saine Alimentation Grâce aux Outils D’aménagement du Territoire; COSMOSS: Rimouski, QC,
Canada, 2018; p. 11.
65. Centers for Disease Control and Prevention. Healthier Food Retail: An Action Guide for Public Health Practitioners;
Department of Health and Human Services: Atlanta, GA, USA, 2014.
66. Robitaille, É.; Chaput, S.; Paquette, M.-C. Interventions Visant à Modifier L’accessibilité Géographique à des
Commerces D’alimentation et Impacts sur L’alimentation et le Poids Corporel: Synthèse des Connaissances; Institut
national de santé publique du Québec: Montreal, QC, Canada, 2019; ISBN 978-2-550-85103-5.Int. J. Environ. Res. Public Health 2020, 17, 3359 14 of 14
67. TRF. Pennsylvania Fresh Food Financing Initiative. Available online: http://www.trfund.com/pennsylvania-
fresh-food-financing-initiative/ (accessed on 28 April 2015).
68. Paddeu, F. L’agriculture urbaine à Detroit: Un enjeu de production alimentaire en temps de crise? Pour 2014,
224, 89. [CrossRef]
69. Paddeu, F. L’agriculture urbaine dans les quartiers défavorisés de la métropole New-Yorkaise: La justice
alimentaire à l’épreuve de la justice sociale. VertigO Rev. Électron. Sci. Environ. 2012, 12. [CrossRef]
70. Fleischhacker, S.E.; Evenson, K.R.; Sharkey, J.; Pitts, S.B.J.; Rodriguez, D.A. Validity of secondary retail food
outlet data: A systematic review. Am. J. Prev. Med. 2013, 45, 462–473. [CrossRef] [PubMed]
71. Lebel, A.; Noreau, D.; Tremblay, L.; Oberlé, C.; Girard-Gadreau, M.; Duguay, M.; Block, J.P. Identifying rural
food deserts: Methodological considerations for food environment interventions. Can. J. Public Health Rev.
Can. Sante Publique 2016, 107, eS21–eS26. [CrossRef] [PubMed]
72. Jalbert-Arsenault, É.; Robitaille, É.; Paquette, M.-C. Development, reliability and use of a food environment
assessment tool in supermarkets of four neighbourhoods in Montréal, Canada. Health Promot. Chronic Dis.
Prev. Can. Res. Policy Pract. 2017, 37, 293–302. [CrossRef] [PubMed]
73. Widener, M.J. Spatial access to food: Retiring the food desert metaphor. Physiol. Behav. 2018, 193, 257–260.
[CrossRef] [PubMed]
74. Fortier, D. La Haute-Gaspésie part en Guerre Contre les Déserts Alimentaires. Available
online: http://www.lavantagegaspesien.com/actualites/societe/2017/2/1/la-haute-gaspesie-part-en-guerre-
contre-les-deserts-alimentaires.html (accessed on 31 May 2018).
75. MRC de la Haute-Gaspésie. Plan de Développement de la Zone Agricole; MRC de la Haute-Gaspésie:
Sainte-Anne-des-Monts, QC, Canada, 2018.
© 2020 by the authors. Licensee MDPI, Basel, Switzerland. This article is an open access
article distributed under the terms and conditions of the Creative Commons Attribution
(CC BY) license (http://creativecommons.org/licenses/by/4.0/).You can also read