A Profile of Hackney, its People and Place - LB Hackney Policy and Insight Team January 2019 - Hackney Council
←
→
Page content transcription
If your browser does not render page correctly, please read the page content below
A Profile of Hackney, its People and
Place
LB Hackney Policy and Insight Team
January 2019

Document Number: 21782544
Document Name: Hackney Borough Profile 2019Document Number: 18909115
A profile of Hackney, its people and place

Title                                              Page

Introduction                                        3

Summary of key facts and figures                    3

Hackney’s People                                    6

        Current population count                    6

        Equality and demographic characteristics    6

        Future population trends                   15

        Health and Wellbeing                       17

        Poverty and Deprivation                    18

        Digital Inclusion                          21

        Educational attainment                     22

        Hackney’s Economy                          23

Hackney, the Place                                 25

        Satisfaction with the local area           26

        Housing                                    26

        Environment and transport                  28

        Crime and community safety                 33

        Growth and change                          34

                                                          2
Introduction

This document provides a profile of the London Borough of Hackney and the people
living and working here.

Hackney Council and its partners have developed the Sustainable Community
Strategy, which sets out the overall vision for the borough and how we will respond to
change.

The Council also produces a Facts and Figures leaflet, which provides key data for
the borough. This is updated every quarter.

Our Shared Evidence Base pages contain more in-depth analysis on some of the
subjects covered in this document, such as population, housing, economy, child
poverty, health and profiles of Hackney’s 21 wards.

To compare Hackney with other London boroughs or with London as a whole please
see the Greater London Authority’s borough profile pages.

Summary of key facts and figures

Hackney’s people

Population characteristics

Hackney’s population is estimated at 275,929 people.

Hackney is a relatively young borough with a quarter of its population under 20. The
proportion of residents between 20-29 years has grown in the last ten years and
now stands at just under 25%. People aged over 55 make up only 15% of the
population.

Hackney is a culturally diverse area, with significant ‘Other White’, Black and
Turkish/Kurdish communities. A large Charedi Jewish community is concentrated
in the North East of the borough and is growing.

People from Australia, the US and Western European countries like Spain,
France and Italy make up the largest groups who have recently come to live in
Hackney from abroad.

Just over a third of Hackney’s residents are Christian. This is a lower percentage
than the London and England averages. Hackney has significantly more people of
the Jewish and Muslim faiths and a higher proportion of people with no religion
and those who did not state a religion than London and England.

In 2011, 14.5% of Hackney residents said they were disabled or had a long-term
limiting illness.

Nine out of ten Hackney residents say that Hackney is a place where people from
different backgrounds get on well together. Hackney’s diversity and
multiculturalism are the main factors contributing to residents feeling proud of the
borough. Over a third of Hackney residents were born outside the UK.

Hackney’s population is likely to grow to 310,000 people by 2028 and to 355,000
people by 2050.

                                                                                       3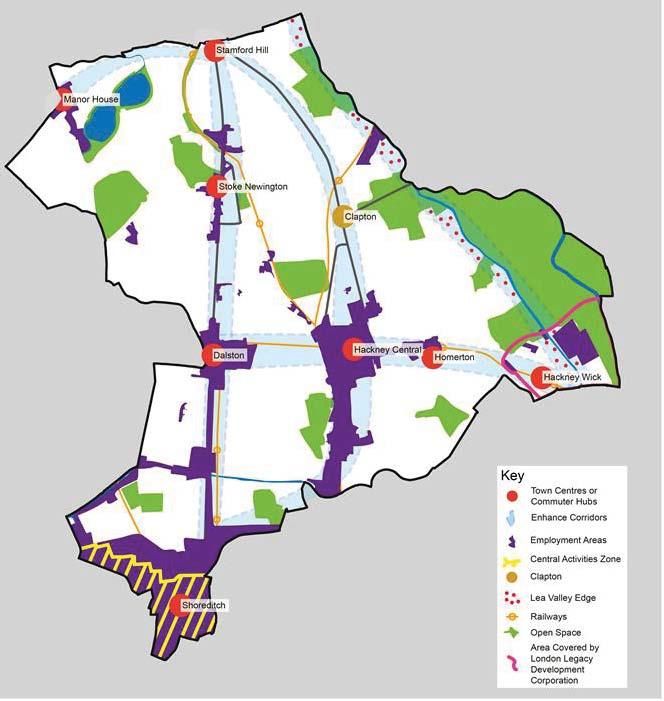
Health and wellbeing

Life expectancy is increasing for men and women, and is now 78.8 years for men
and 82.9 years for women. Life expectancy in Hackney is below the London
average, especially for men.

Deprivation

Hackney was the eleventh most deprived local authority overall in England in the
2015 Index of Multiple Deprivation, whilst in 2010 it was ranked second. In 2015,
17% of its Lower Super Output Areas were in the top ten percent most deprived,
compared with 42% in 2010.

Hackney has become significantly less deprived compared with other local
authorities in relation to income, employment, housing and services,
living/environment and deprivation affecting children compared with 2010, but
relatively more deprived in relation to crime.

Education

At GCSE the average Attainment 8 point score per pupil in Hackney was 48.8
points, higher than the London average of 48.6 and the England average of 44.6
points.

Economy

The number of firms in Hackney has increased by 66% since 2014. The number of
people claiming out of work benefits fell by 10,650 people to around 19,000
people between 2000 and 2018, despite the rapid growth in the working-age
population.

Housing

The proportion of households who rent from a private landlord in Hackney has
more than doubled in the past 10 years. Nearly a third of all households are now
private renters.

Nearly 45% of all households in Hackney rent from a social landlord. They tend to
have higher unemployment and lower average incomes than people living in other
tenures.

Over 13,000 additional new homes are expected to be built in the borough in the
next 10 years. Development will be most heavily concentrated around Manor House
and Dalston in the West, Hoxton and Shoreditch in the South and Hackney
Central and Hackney Wick in the East.

Environment and transport

Hackney is the third most densely populated borough in London, but it is also one
of the greenest with falling levels of car ownership and Carbon Dioxide emissions.
Nitrogen Dioxide levels can be high, especially around main roads.

                                                                                   4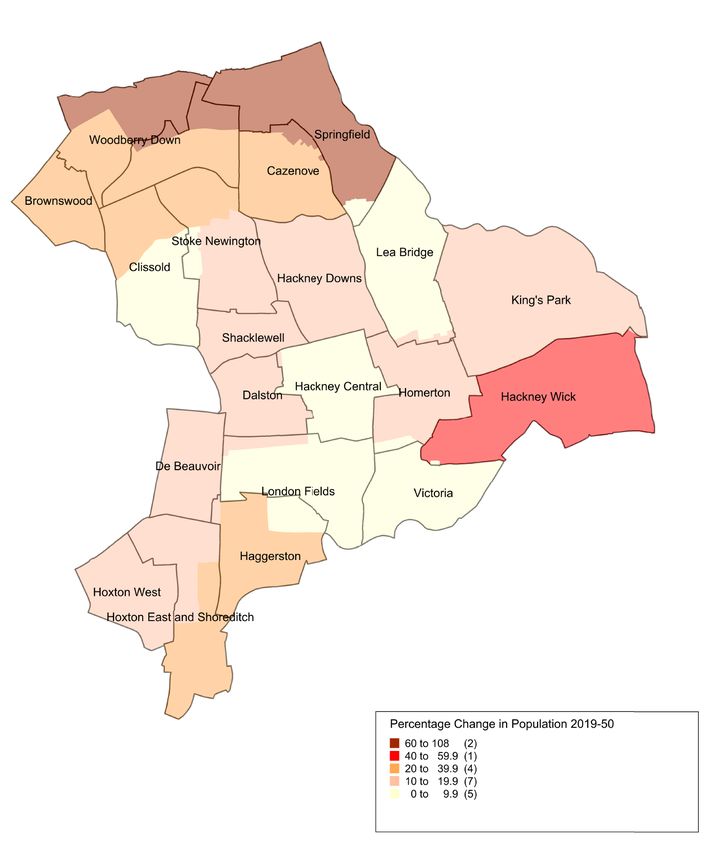
Crime and community safety

Crime fell by over a third between 2003 and 2015 (over 13,000 fewer victims of
crime), however crime levels increased by 6% in 2015/16, and 12.5% in 2016/17.
Crime in Hackney is now higher than in other inner-London boroughs with similar
social and economic characteristics.

Growth and change

The North West of the borough around Manor House, the area along the upgraded
North London Line from Dalston to Hackney Wick and along the recently improved
East London Line from Dalston to Shoreditch are expected to experience the
greatest growth in housing, commerce and infrastructure in the coming years. If
Crossrail 2 is delivered this will further increase the likelihood of growth in the
medium to long term.

                                                                                  5
Hackney’s people

Introduction

Hackney is a truly global and diverse borough. Historically Hackney has been a
borough that welcomes people from around the world and inward migration dates
back to the 18th and 19th centuries.

In the 1950’s and 1960’s, labour shortages in the reviving post-war economy drew in
migrants from the Caribbean, Cyprus, Turkey and South Asia.

In the last 15 years they have been joined by migrants from Western European
countries like Spain and France, Eastern European countries like Poland, which have
joined the European Union relatively recently, people from North, and South America,
Australasia and African countries like Nigeria and Somalia. The ‘Other White’
population increased by 60% between 2001 and 2011, and is now the second largest
ethnic group.

Hackney is the 6th most ethnically diverse borough in London, down from 3rd in 2005,
but it has a higher ethnic diversity score1 than in 2005, which suggests that London
as a whole is becoming more ethnically diverse.

Over one in four residents (28.2%) in Hackney have no religion according to the 2011
Census, up from 19% in 2001. The proportion of residents declaring themselves to
be Christians fell by 8% between 2001 and 2011.

Current population count

The 2011 Census estimated Hackney’s population at 246,300, an increase of 43,500
(21%) since the 2001 Census. The ONS mid-year population estimate for 2018 put
Hackney’s population at 275,929. The Greater London Authority estimates the
population of Hackney will grow to over 355,000 people in 20502 (see Figure 1
below).

Equality and other demographic characteristics

This section looks at the different types of people living in Hackney by equality and
other demographic characteristics. This section looks at Hackney’s population in
terms of the nine characteristics protected by the 2010 Equality Act: age, sex,
ethnicity, religion, sexual orientation, gender reassignment, disability, unpaid caring
responsibilities, pregnancy and maternity. It also examines wider factors influencing
equality and cohesion like language and the extent to which people ‘get on well
together’, as well as factors influencing future population growth and change like
migration and household composition.

1
 GLA Diversity Index, 2012
2
 GLA Housing-Based Population Projections (Borough Preferred Option), 2015
based
                                                                                          6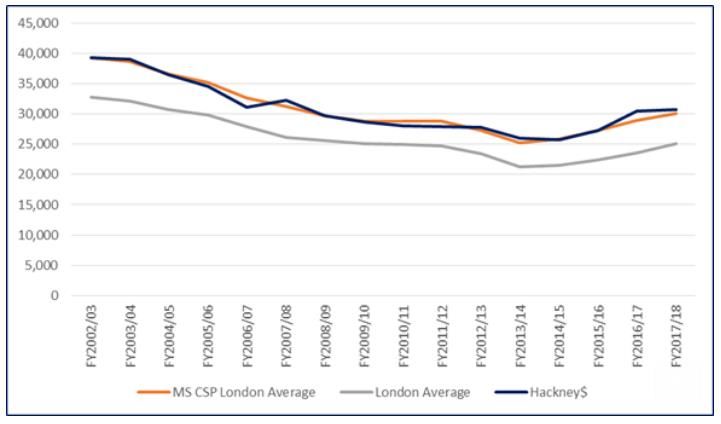
Age

Hackney is a relatively young borough with just under 25% of its population under 20
years. The proportion of residents between 20-29 years has grown in the last ten
years and now stands at just under 25%. People aged over 55 make up nearly 15%
of the population3.

Figure 1: Current and projected age structure of Hackney’s population 2019 and
2050

Source, GLA Projections 2016, Central Trend-based

Figure 1 projects a rise in the number of children and young people aged under 30,
around the same number of people in their early 30’s, with larger increases in the
numbers of people aged 35 plus.

The largest numbers of people are, and will still be those in the 25-39 age group.
Further discussion about population growth and change can be found in the section
entitled ‘Future Population Trends below.

Gender

There are slightly more females than males currently living in the borough. Some
138,736 residents are female, 50.3% of the population, and 137,193 residents are
male, 49.7%4.

Ethnicity

Just over a third (36%) of respondents to the 2011 Census in Hackney described
themselves as White British. The remainder is made up of black and minority ethnic
groups, with the largest group Other White, 16.3%, followed by Black African, 11.4%.
The number of Black Caribbean people fell slightly between 2001 and 2011. They
made up 7.8% of Hackney’s population in 2011 compared with 10.3% in 2001.

3
    ONS Mid-Year Population Estimates 2017
4
    ONS, Mid-Year Population Estimates 2017
                                                                                     7
Hackney is home to a number of smaller national and cultural communities. Hackney
has the largest group of Charedi Jewish people in Europe who predominately live in
the North East of the borough and represent an estimated 7.4% of the borough’s
overall population5. Hackney also has a well established Turkish and Kurdish
community; At least 5.6% of the Hackney population describe themselves as Turkish,
Turkish Cypriot or Kurdish (according to the 2011 Census). These populations are
often captured in the White British/Other White, Other Ethnic Group or, for Turkish
people, Arab. Other significant communities in Hackney include Chinese,
Vietnamese and Eastern Europeans especially Polish, Western Europeans
particularly Spanish and French people, Australasians and residents from North, and
Latin America.

Table 1:          Ethnic breakdown of Hackney’s population

            Ethnic group              Hackney %     London %        England %
    White:
    English/Welsh/Scottish/Norther
    n Irish/British                          36.2            44.9        79.8
    White: Irish                              2.1             2.2         1.0
    White: Gypsy or Irish Traveller
                                              0.2             0.1         0.1
    White: Other White                       16.2            12.6         4.6
    Mixed/multiple ethnic group:
    White and Black Caribbean                 2.0             1.5         0.8
    Mixed/multiple ethnic group:
    White and Black African                   1.2             0.8         0.3
    Mixed/multiple ethnic group:
    White and Asian                           1.2             1.2         0.6
    Mixed/multiple ethnic group:
    Other Mixed                               2.0             1.5         0.5
    Asian/Asian British: Indian               3.1             6.6         2.6
    Asian/Asian British: Pakistani
                                              0.8             2.7         2.1
    Asian/Asian British:
    Bangladeshi                               2.5             2.7         0.8
    Asian/Asian British: Chinese              1.4             1.5         0.7
    Asian/Asian British: Other
    Asian                                     2.7             4.9         1.5
    Black/African/Caribbean/Black
    British: African                         11.4             7.0         1.8
    Black/African/Caribbean/Black
    British: Caribbean                        7.8             4.2         1.1
    Black/African/Caribbean/Black
    British: Other Black                      3.9             2.1         0.5
    Other ethnic group: Arab                  0.7             1.3         0.4
    Other ethnic group: Any other
    ethnic group                              4.6             2.1         0.6

Source: ONS Census, 2011

5
    Mayhew population estimate, 2011
                                                                                 8
Migration
As figures 2 and 3 illustrate, most people who come to live in Hackney come from
other parts of London or the UK. Movers to Hackney from within the UK tend to come
from neighbouring boroughs like Tower Hamlets, Islington, Haringey or the South
East of England. The largest numbers of people recently coming to live in Hackney
from outside the UK come from Australia, the US and Western European countries
like Spain, France and Italy.
Figure 2; Origin of movers to Hackney from the rest of the UK
Source, ONS Census 2011
9Figure 3: Origin of movers to Hackney from outside the UK
Source, ONS Census 2011
Those leaving the borough tend to go to neighbouring boroughs like Haringey,
Islington, Tower Hamlets and Waltham Forest. Those moving within the borough
tend to gravitate to central areas like Lower Clapton and Shacklewell.
Over a third, 35.4% of people living in Hackney in 2017-18 were born outside the
UK6. Nearly half, 46.8% of live births in Hackney were to mothers born outside the
UK7.
Language
Respondents to the 2011 Census were asked to state their main language. Over
three quarters of respondents cited English as their main language, but at least 88
other languages were given. The most common main languages are listed in table 2
below.
6
ONS, People Born Outside the UK, 2017/18
7
ONS, Parents’ Country of Birth, 2017
10Table 2: Most common main languages spoken in Hackney
Main Language Percent
English 75.9
Turkish 4.5
Polish 1.7
Spanish 1.5
French 1.4
Yiddish 1.3
Bengali, Sylheti or Chatgaya 1.3
Portuguese 1.2
Italian 0.9
Gujarati 0.8
Source: ONS Census, 2011
Religion and belief
Just over a third of Hackney’s residents describe themselves as Christian, although
this is a lower percentage than the London and UK average.
Hackney has significantly more people of the Jewish and Muslim faiths and a higher
proportion of people with no religion and those who did not state a religion than
London and the UK.
Table 4: Religion and belief
Religion Hackney % London % England %
Christian 38.6 48.4 59.4
Buddhist 1.2 1.0 0.5
Hindu 0.6 5.0 1.5
Jewish 6.3 1.8 0.5
Muslim 14.1 12.4 5.0
Sikh 0.8 1.5 0.8
Other religion
0.5 0.6 0.4
No religion 28.2 20.7 24.7
Religion not
stated 9.6 8.5 7.2
Source: ONS Census, 2011
11Sexual orientation
We do not have official Hackney level data for sexual orientation, but the Integrated
Household Survey carried out by the Office for National Statistics in 2016 provided
the following results for London and England.
Sexual orientation England London
Heterosexual / Straight 93.0% 90.1%
Gay / Lesbian 1.2% 2.1%
Bisexual 0.7% 0.6%
Other 0.5% 0.5%
Don't know / Refused to say 4.5% 6.7%
The August 2018 GP patient survey indicated that, in Hackney there were
comparatively high numbers of people who identify as gay or lesbian (5%), bisexual
(2%), other (2%), a further 10% preferred not to say. The remaining 81% identify as
heterosexual or straight. These figures may under-represent the size of the non-
heterosexual population, given the problems involved in disclosure of sexual
orientation.
Gender identity
Data on the transgender population is not available at a borough level. The Gender
Identity Research and Education Society GIRES, currently estimate there are
650,000 (1% of the population) whose gender identity is incongruent with their
assigned gender – this would equate to around 2,700 people in Hackney. According
to NHS England, numbers seeking medical support are lower, although they have
increased significantly in recent years.
Non-binary
Non-binary, ‘genderqueer’, ‘transsexual’ and ‘androgynous’ are terms used to
describe those who choose not to identify with a particular gender.
The Practical Androgyny website estimates that around 0.4% of the UK population, 1
in 250 people in the UK is non-binary. This equates to around 1,200 people in
Hackney.
Disability
In the 2011 Census, 14.6% of Hackney respondents said they had a long-term illness
that limited their daily activities in some way, compared with 13.6% for London and
17.9% for England and Wales. Hackney’s lower than average rates of disability and
long-term illness are likely to be due to its relatively younger population, as disability
rates tend to increase with age.
In May 2018, 10,811 people, 3.9% of Hackney’s population, were claiming Disability
Living Allowance or Attendance Allowance8, and in October 2018, 6,475 people were
claiming Personal Independence Payments9.
8
Department for Work and Pensions, December 2018
12There are an estimated 12,102 disabled children (aged 0-19) in Hackney and the City
of London10.
Estimates suggest that 2.4% of adults in City and Hackney have a learning
disability (ranging from 2.6% in those aged under 45, to 1.8% in those aged 85+)
- this equates to 4,937 people in Hackney11.
Carers
Some 7% of Hackney’s residents provide at least one hour’s unpaid care and support
each week to a friend, neighbour or relative because of illness or old age12. This is a
smaller proportion than for London or in England and Wales. Again, this is likely to be
because Hackney has a much lower older age population than on average.
Pregnancy and maternity.
There were 4,336 live births to women in Hackney in 2017. The fertility rate for
Hackney is slightly lower than the London and national average at 1.6 live births per
women compared to 1.7 in London and 1.76 in England13. However, in some parts of
Hackney fertility rates are amongst the highest in London, particularly in the north-
east of the borough14.
For more information about what the Council and its partners are doing to promote
equality in the borough, please see the Equality and Diversity pages of the Hackney
Council website.
Household composition
Figure 4 shows the composition of Hackney’s households, compared with London
and England and Wales
9
There may be some overlap due to incompatible data
10
LB Hackney, Disabled Children’s Needs Assessment for London Borough of
Hackney and the City of London, 2017
11
LB Hackney, Adult Learning Disability Needs Assessment, 2016
12
ONS Census, 2011
13
ONS, Live Births by Area of Usual Residence, 2017
14
ONS, Births and Deaths by Ward, 2015
13Figure 4
Household compostion
30.0
25.0
20.0
15.0
10.0
5.0
ENGLAND AND WALES
0.0 LONDON
HACKNEY
Source, ONS 2011 Census, % of households
Hackney has fewer pensioner households, couples who are married or in a same sex
civil partnership and cohabiting couples with children than London and England and
Wales.
The borough has significantly higher proportions of one person, lone parent and
multi-person households, which are likely to consist of groups of young people
renting rooms from private landlords in shared properties.
Community cohesion
Nine out of ten Hackney residents say that Hackney is a place where people from
different backgrounds get on well together15. Hackney’s diversity and multiculturalism
are the main factors contributing to residents feeling proud of Hackney16. In part this
is a result of Hackney’s long history of immigration and welcoming people into the
borough. This has resulted in local neighbourhoods that are very diverse, where
people have an opportunity to mix and meet people from different religious and
ethnic backgrounds. Many people also have personal or family experience of
migration and are welcoming to new arrivals.
Future population trends
The Office for National Statistics (ONS) and Greater London Authority (GLA) both
produce population projections. The ONS projections take account of expected
15
Ipsos Mori, Hackney Resident’s Survey, 2015
16
Hackney the Place E-panel survey, 2011
14changes in fertility, mortality and migration, but the GLA projections also include
anticipated housing growth and tend to be more reliable at a local level.
Since 2001, Hackney’s population has grown by over 63,000 persons to around
275,000, according to the Office for National Statistics. Much of this growth has been
in the working age population17.
These growth trends are projected to continue with the population expected to reach
just over 310,000 by 2028, and just over 355,000 persons by 2050, a forecast
increase of around 80,000 persons in just over 30 years18. These projections do not
take account of the impact that Brexit may have on patterns of migration. We have
produced a paper on the potential impact that Brexit may have for future population
growth here.
Figure 5: Hackney’s projected population 2019-50
Source: GLA Projections 2016, Central Trend-based (2019-2050)
The majority of the forecast growth is expected to take place in the working age (16-
64) age band, especially in the 40-64 age group. Steady growth is also expected in
the 65+ age group, particularly from the mid-2020s onwards. More modest growth is
expected in the numbers of children and young people, with the majority of this due
to take place before 2025.
Figure 6 below shows population growth at ward level, based on data on planned
housing developments supplied by Hackney Council to the Greater London Authority.
Most areas of growth are those with major housing development, including parts of
Woodberry Down, which is undergoing regeneration as part of the Woodberry Down
estate renewal, and Haggerston, Hoxton West and Hoxton East and Shoreditch
which are close to the City where there is lots of housing and commercial
development.
17
ONS, 2015 Mid-Year Population Estimates, released June 2016
18
GLA, Borough SHLAA-based population projections, 2015
15Town Centre locations such as Dalston and Hackney Wick, which will experience
greater housing development as part of the Olympic Legacy will also experience
growth. Higher rates of population growth in wards like Springfield are more
attributable to the high birth rate in these areas.
Figure 6: Projected percentage growth in population by Ward 2018-2050
Source: GLA Population Projections, 2016, Housing Based
16Health and wellbeing
Health and wellbeing
In Hackney 2015-1719 life expectancy was 78.8 years for men and 82.9 years for
women. The graphs below show that, unusually, life expectancy declined slightly for
men in Hackney, but increased slightly for women. Life expectancy in Hackney is
below the London average with women a year and six months, and men one year
and nine months below the London average.
Figure 7: Trends in life-expectancy for men (2001-2017)
81.00
80.00
79.00
78.00
77.00
76.00
75.00
74.00
73.00
72.00
71.00
England London Hackney
19
ONS, Life Expectancy at Birth 2015-17
17Figure 8: Trends in life-expectancy for women (2001-17
Source: ONS, November 2017
Around 30% of the total deaths in Hackney are considered to be premature (i.e.
deaths occurring in people under the age of 65). The leading cause of premature
death in Hackney is cancer with lung cancer as one of the predominant forms.
Cardiovascular disease forms the second highest number of premature deaths in the
borough, with heart disease and stroke forming the largest groups in this category20.
Smoking is a major cause of lung cancer, heart disease and stroke. Smoking
reduction was identified as a priority in Hackney’s Health and Wellbeing Strategy. In
2015-18. In 2017, 21.4% of adults in Hackney reported themselves as current
smokers. This compares to average rates in London of 14.6% current smokers and
14.9% in England21.
Mental health
It is estimated that 53,000 working aged people in Hackney were affected by a
common mental health condition. Around half were affected by anxiety and
depression. An estimated 6,200 of working-aged adults are affected by a severe
mental illness (a term covering bipolar disorders, schizophrenia and other psychosis).
Around half of people experiencing serious mental illness have their conditions
recorded by their GP22.
Children and young peoples’ health
Just over a quarter, 24.1%, of reception class children in City and Hackney state
schools were overweight or obese in the 2017/18 school year, compared the London
20
Public Health England, Local Tabaco Control Profiles, 2017
21
ONS, Integrated household survey, 2016
22
LB Hackney, City and Hackney Health and Wellbeing Profile, Mental Health
update, 2016
18average of 21.9%. Some 40.5% of year 6 pupils in City and Hackney state schools
were overweight and obese, compared to 37.7% in London23.
To find out more about health and wellbeing trends in City and Hackney, please see
the City and Hackney Health and Wellbeing Profile.
Poverty and Deprivation
Hackney is an area of growing economic opportunity as a result of the increased
focus on East London as an area of growth and development for London and the UK.
This growth sits alongside significant deprivation. Some local people continue to face
persistent inequalities and are disproportionately affected by child poverty,
worklessness and welfare dependency.
The Index of Multiple deprivation ranks each local authority area, ward and lower
super output area in terms of seven ‘domains’; health, education, income,
employment, housing and access to services, living environment and crime, in order
of deprivation. The domains are brought together in an overall Index of Multiple
Deprivation (IMD). There are also indices measuring deprivation among children and
older people.
Hackney was the eleventh most deprived local authority overall in England in the
2015 Index of Multiple Deprivation, in 2010 it was ranked second. In 2015, 17% of its
Lower Super Output Areas were in the top ten percent most deprived, compared with
42% in 2010. This indicates that Hackney is becoming less deprived relative to other
local authority areas in England.
23
Public Health England, National Child Measurement Programme England 2017/18
School Year
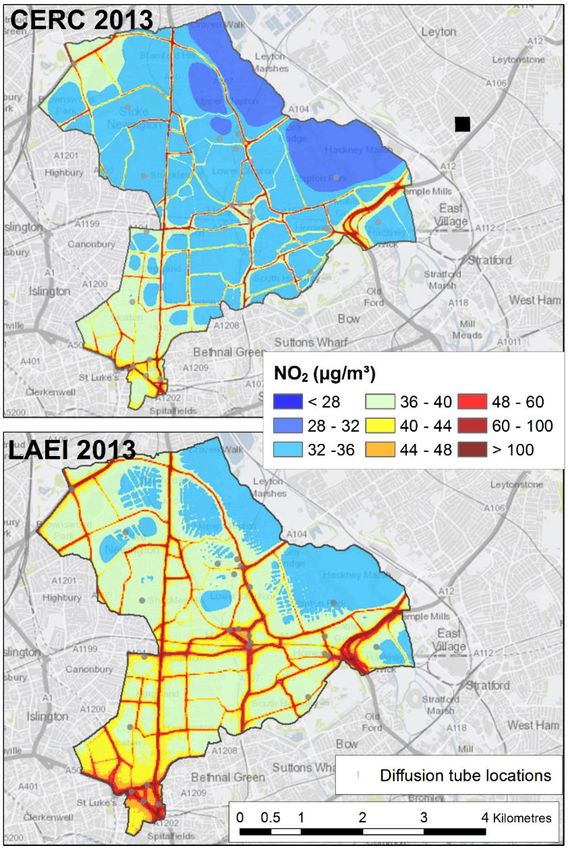
19Figure 9: Deprivation in Hackney
Source: DCLG, Indices of Deprivation, 2015
Hackney is significantly less deprived compared with other local authorities in relation
to income, employment, housing and services, living/environment and deprivation
affecting children than in 2010, but relatively more deprived in relation to crime.
In 2016-17, 36% of Hackney residents were living in financial poverty – with incomes
of less than 60% of the national median after housing costs. This is the third highest
in London behind Newham and Tower Hamlets and is considerably higher than the
London average, which is 27%24.
Older people
The Index of Deprivation Affecting Older People (IDAOPI) had a value of 42 in 2015,
which means that 42% of those aged 60 and over are either in receipt of Pension
Credit, out of work benefits or had an income of less than 60% of the national median
24
Trust for London, London’s Poverty Profile, 2016-17
20excluding housing benefits, but before housing costs. In 2015 Hackney ranked
second for all local authorities in England for this indicator.
Child poverty
Despite demographic changes Hackney continues to have high rates of relative Child
Poverty. Child Poverty is measured by Her Majesty’s Revenue and Customs (HMRC)
as the percentage of children living in families in receipt of out of work benefits or tax
credits where reported incomes are below 60% of the national median income before
housing costs are deducted.
The rate in Hackney was 27.7% in 2017 meaning Hackney had the fourth highest
rate of child poverty in London, broadly in line with Camden and Islington and below
Westminster (28.9%), Tower Hamlets (28.1%) and Newham (24.9%). This is higher
than the London and England averages (both 17%).
The official definition of child poverty is based on a measure before housing costs
have been deducted. Commentators point out that the official definition lowers child
poverty rates in areas like London. This is due to the high cost of accommodation
and the resultant high level of housing benefit received, which artificially boosts
income.
The End Child Poverty Campaign uses a measure for estimating child poverty based
on disposable income after housing costs have been deducted. The Hackney rate for
children living in poverty using this measure stood at 41.3% in 2017. This is the third
highest rate in the country and third in London after Tower Hamlets (53.4%), Islington
and Newham (both at 43.2%)25.
Digital inclusion
Being able to access and interact online is vital to social and economic wellbeing in
today’s society. In January 2011, 25% of Hackney’s population said they had never
accessed the internet. By September 2015 this had fallen to 7%. Internet use is now
measured as the percentage of people who have not used the internet at all or for the
last three months. The figure for non-use Hackney and Newham remains at 7%. This
rapid improvement is likely to be due to more widespread use of smartphones and
tablets amongst the population.
According to regional data, older people, Indian, Bangladeshi and residents from
other ethnic groups, residents with no qualifications and trade apprenticeships tend
to be less likely to have used the internet26.
The 2015 Hackney Residents’ survey indicated that 70% of respondents either used,
or would like to use Council services online. However, older residents, those not
working full-time, those on lower incomes, residents living in rented accommodation
and disabled residents were less likely to want to access services online27.
For more information about child poverty and economic wellbeing in Hackney please
see our Child Poverty and Family Wellbeing Needs Assessment and the Local
Economic Assessment.
25
End Child Poverty Campaign, Child Poverty Map of the UK, January 2018
26
ONS, Internet Use by Borough and Population Sub-groups, January 2011 -
September 2018
27
IPSOS MORI, Hackney a Place for Everyone Residents Survey Report, 2015
21Educational attainment
Early Years – pre-school
Hackney has seen good improvements in ‘school readiness’, with the percentage of
young children achieving a Good Level of Development increasing from 48% in 2010
to 71.2% in 2016-17, down slightly from last year (71.2%), and just below the
England average of 71.5%, and below the London average of 73.8%28
Key Stage 2 – Age 11
Some 71% of Hackney pupils achieved the expected standard in Reading, Writing
and Maths at the end of primary school in 2018, down slightly form 72% in 2017,
compared with 70% in London and 65% in England29.
Hackney is the sixth highest ranking local authority at both the ‘expected level’ and
‘higher level’ thresholds in the combined reading, writing and maths indicator at key
stage 2.
Key stage 4 – GCSE and equivalent
The performance of Hackney pupils at GCSE has improved over the years. The
proportion of Hackney students achieving 5 A*-C grades including English & Maths
increased from 43% in 2008 to 64.3% in 2016, compared with 60.6% in London and
53.5% in England30.
Figure 10: Percentage of Hackney pupils attaining five or more GCSE’s A*-C
including English and Maths
Source: Department for Education 2007/8 – 2015/16
28
DFEE, Early Years Foundation Stage Profile, 2017/18
29
DFEE, Key Stage 2 Attainment Data 2017/18
30
DFEE, GCSE Attainment Data 2015/16 (revised)
22In 2015/16, the Government introduced three additional measures of attainment at
GCSE:
Progress across a suite of 8 subjects in the two years between Key Stage 3,
the end of Year 9 and the end of Year 11 (Progress 8);
Attainment across 8 academic subjects (Attainment 8), and
The English Baccalaureate, in which students must attain Grade 4 or above in
English, Maths, a humanity (History or Geography), at least two science
subjects and a modern language;
In 2017 the Government replaced A*-F grading for GCSE with a new 9-1 grading.
In 2018 the average Progress 8 score for Hackney pupils was 0.31, down 0.08 points
on 2017, but well above the London average of 0.23.
The average Attainment 8 per pupil is 48.8 points in 2018 down slightly (0.3 points)
on 2017, but higher than the London average of 48.6 and the England average of
44.6.
The average point score per pupil in the English Baccalaureate in 2018 was
4.37 slightly below the London average of 4.41 but above the average for
England state funded schools of 4.0431
A-Level and equivalent
In 2018 Hackney state funded Schools and Colleges scored an average 30.26 points
at A’ Level or equivalent Level 3 qualifications, slightly down from 2017 (30.6). This
was slightly below the London average of 31.68 points and the England average of
32.88 points32.
For more information about school performance, skills and qualifications please see
our Child Poverty and Family Wellbeing Needs Assessment, Local Economic
Assessment and the Hackney Learning Trust website.
Hackney’s Economy
Business and Enterprise
Hackney has experienced rapid economic growth over the last decade. In 2018,
Hackney hosted 19,905 businesses, up from 18,995 in 2016 a 55% increase from
2014. Hackney now has 3.9% of all London businesses.
The greatest numbers of businesses in Hackney are found in the Professional,
Scientific and Technical sector, 5,275 businesses, and in Information and
Communication, 3.765 businesses33.
31
DFE, GCSE Attainment Data 2017/18 (provisional)
32
DFE, A’ Level and other Level 3 Results 2017/18 (provisional)
33
ONS, Inter-departmental Business Register, 2018
23Employment
In the year to June 2018, 71.8% of Hackney’s working-age adults were employed
compared with 74.2% of working-age Londoners. Just under a quarter, 24.4% of
Hackney’s working age residents were economically inactive, not in work or seeking
work, often because they are studying, caring for dependents or retired early,
compared to 21.7% of working aged Londoners. In the same period, Hackney’s
unemployment rate was 5.7%, compared to 5.1% in London34.
Figure 11: Employment, economic inactivity and unemployment among 16-64
year olds in Hackney and London (%)
Source: ONS, Annual Population Survey
Figure 11 illustrates that Hackney’s employment position has improved relative to
that of London over the last 10 years. The increase in employment rates can largely
be attributed to a working age population which is better educated, more skilled and
working in higher level jobs. There has also been an increase in the proportion of
women participating in the workforce.
Qualifications and skills
The proportion of Hackney residents with high level qualifications (NVQ level 4+) has
increased from around 30% of working age residents ten years ago, to nearly three
fifths. 59.4%, of working age residents today. Hackney has a more highly qualified
workforce to London where 51.8% of working aged adults have degree-level
qualifications or above35.
Hackney residents have increasingly worked in high level occupations (managerial,
‘professional’ and ‘technical’ roles). In the year to June 2018, over 61.7% were
employed in such roles (although the proportion is down from 64.7% in the year to
June 2017), but still a higher proportion than in London at 56.1%. Meanwhile, the
proportion of Hackney residents employed in less skilled occupations has fallen36.
34
ONS, Annual Population Survey, Jul 2017 – Jun 2018
35
ONS, Annual Population Survey, January – December 2017
36
ONS, Annual Population Survey, June 2018
24Employment sectors
Hackney’s largest employment sectors are Professional, Scientific and Technical
industries, employing 17.5% of Hackney-based workers, Health 13.5% and
Information and Communications, 11.7%.
Public services as a whole account for 25.9% of jobs in Hackney while more than a
third, 36.7% of Hackney-based workers are in knowledge based sectors,
Professional, Scientific and Technical, Information and Communication and
Administrative and Support Services. Despite its proximity to the City, only 2.5% of
Hackney-based workers are employed in Finance and Insurance37.
Wages
Pay in London is higher than in Hackney, both for residents and those travelling to
and working full time in the borough. In 2018 median gross hourly pay for Hackney
workers and residents working full-time was £17.04 and £16.76 respectively. Median
gross hourly pay for London’s full-time workers was higher, at £17.55 and £18.59 for
London residents38.
Benefits
in November 2016 the number of Hackney residents claiming out of work benefits
stood at 19,760, 10.1% of the working-age population. Between November 2000 and
2016 this figure fell by 10,600, despite the rapid increase in the working-age
population.
Figure 12: Percentage of the working age population claiming out of work benefits
2000-2016
Source: DWP Benefit Claimants
37
ONS, Business Register and Employment Survey , 2017
38
ONS, Annual Survey of Hours and Earnings, 2018
25However, this period saw essentially no change in the number of people receiving
Incapacity Benefits or Employment Support Allowance. This group has hovered
between 12,200 and 14,100 for the last 16 years39.
Since then the Government has started to roll out Universal Credit, which brings
together six benefits including out of work benefits like Jobseekers Allowance and
Employment and Support Allowance.
In May 2018, 19,702 people were claiming out of work benefits, 10% of the working
age population.
More information on employment and skills can be found in our Local Economic
Assessment.
Hackney, the place
Satisfaction with the local area
In 2015, 88% of respondents to a residents’ survey conducted by IPSOS MORI said
they were satisfied with their local area as a place to live. This was up from 71% in
2008.
Housing
Tenure
In Hackney around 44% of households rent from a social landlord like the Council or
a registered provider such as a housing association, 26% of households are owner
occupiers or in shared ownership schemes and 29% rent from a private landlord.
The size of private rented sector more than doubled between 2001 and 2011 rising
from 14,760 to 29,449 households40.
39
ONS, Key Out of Work Benefits data, November 2016 and May 2018
40
ONS, Census, 2011
26Figure: 13: Number of households by tenure 2001-2011 comparison
Source: ONS Census 2001 and 2011
Housing growth
The number of homes in Hackney has grown by around 1,000 a year since 1981.
The trend is set to continue up to 2033 with estate regeneration and town centre
improvement schemes.
Some 7,165 additional new homes were completed in Hackney between 2013 and
2017. On large sites of over 10 units, where the Council can seek affordable housing
contributions, 42% of homes delivered were affordable – social rented and shared
ownership housing built by private developers, Registered Providers (RPs) or the
Council.41 The rest were for private sale. Some 13% of the affordable units
completed, 154 units, were for social rent, 28% (homes owned by the Council or
Registered Housing Providers where rents are controlled through a national rent
regime), 340 units were for affordable rent, (let at levels no more than 80% of local
market rents) and the remaining 716 affordable units were for intermediate rent
(including shared ownership and other forms of lower cost rent).
The Greater London Authority through the draft new London Plan has set a minimum
target that an average 1,330 additional homes will be completed in Hackney each
year until 202942. These homes will be developed on a range of sites located
throughout the borough including on some of our estates the largest of which
is Woodberry Down in the North West, in town centres: Dalston, Hackney
Central, Hackney Wick and Shoreditch on opportunity sites across the
borough and through housing led intensification across the borough’s main
corridors.
41
LBH, Local Development Framework Annual Monitoring Report, 2017-18
42
GLA, Draft New London Plan, 2017
27Affordability and supply
Figure 14: Average house prices in Hackney and London 2007-2018
Source: Land Registry, Year to September 2006 – year to September 2018
Figure 14 shows that house prices in Hackney have been increasing at a faster rate
than that of London for the past decade. House prices have been more volatile in
recent years falling in 2016, rising again in 2017 and falling again in 2018. This is
probably due to uncertainty around Brexit. London house prices have followed a
similar pattern to Hackney over the past few years, although the changes have been
less pronounced.
In the 12 months to September 2018 the median monthly private rent for a two
bedroom home in Hackney was £1,798 compared to £1,510 in London43.
To find out more about housing in Hackney, please see our Housing Strategy.
Environment and transport
Green spaces
Hackney is the third most densely populated borough in the UK44, but it is also one of
the greenest in inner London with 58 parks and green spaces covering over 300
hectares, 25 of which have been awarded the green flag quality mark.
Household energy efficiency
The Standard Assessment Protocol (SAP) is a government rating system to measure
the energy efficiency of housing, where 100 is excellent. Properties are banded A-G,
according to SAP rating.
43
GLA, London Rents Map, year to December 2018
44
GLA, Land area and population density, 2018
28In 2017 a Private Sector Stock Condition Survey carried out for Hackney Council
found that owner occupied and private rented properties in Hackney had an average
SAP rating of 62, within Band D of the Energy Performance Certificate ratings. In
2015/16 Hackney Housing owned properties had an average rating of 69-80, within
Band C. In 2016/17 the average SAP rating of all homes in England was 6245.
Recycling
Over a quarter, 27.4% of household waste is now recycled in the borough, in 2001
only 1% of waste was recycled. Households in London recycled 33.1% of their waste
on average, compared to 43.2% in England46. Household recycling rates in Hackney
are believed to be lower than average because of the relatively large proportion of
flats in the area. Hackney Council aims to help residents recycle more of their
rubbish, for example by collecting all recyclables together, so that residents no longer
have to sort their rubbish as much.
Carbon Dioxide emissions
Hackney’s per capita carbon dioxide emissions are amongst the lowest in the country
and declined from 4.2 tonnes per capita in 2005 to 2.4 tonnes in 2016. Total
emissions were also down 8.5% on the previous year. These low emissions may be
due to absence of heavy industry in the area, although homes are responsible for
almost half of all emissions47.
Air quality
Poor Air Quality is associated with a variety of health effects such as reduced lung
function, asthma, lung cancer and heart disease.
The whole of the borough has been declared an Air Quality Management Area for
Nitrogen Dioxide and Particular Matter under Part IV of the Environment Act 1995.
45
MHCLG, English Housing Survey, 2016/17
46
DEFRA, Local Authority Collected Waste Management Statistics, 2017/18
47
DECC: Local Authority CO2 emissions, 2005-2016
29Figure 15
Figure 15 shows the sources of air pollution from within Hackney. The main source is
road transport (59%), followed by domestic and commercial gas (24%) and non-road
mobile machinery (13%). Locally the proportion of Nitrogen Dioxide from each of
these sources will vary, depending on their location, e.g. whether or not they are
close to a main road.
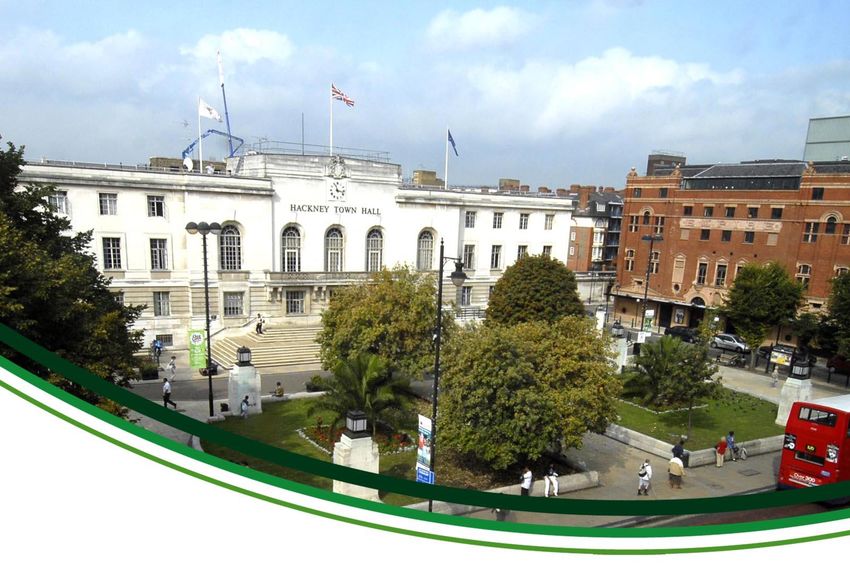
As shown in Figure 16 below, the Greater London Authority estimates that around
30% of the borough exceeds the annual mean National Air Quality Objective for
Nitrogen Dioxide in 2013. Hackney’s own modelling (CERC map, see Figure 16
above) using local monitoring data suggests that this is an overestimation and that
only about 10% of the borough is likely to exceed the NAQO.
While many areas away from the busiest roads are likely to be meeting air quality
standards, there are particularly high levels of Nitrogen Dioxide along main roads and
towards the South of the borough. Pollution levels are declining in some areas.
Despite these downward trends there is still uncertainty about how soon Hackney
can start to comply with Air Quality standards, particularly as vehicle emissions are
not falling as fast as hoped and a large proportion of the sources of air pollution are
beyond the Councils direct control. It is also uncertain what impact London wide
initiatives such as the T-Charge, roll out of hybrid and electric busses, the Ultra-Low
Emission Zone (ULEZ) and ULEZ extension will have on air pollution levels. The
Mayor of London predicts that the introduction of these measures will result in many
areas of London meeting Air Quality Standards by 2025.
30Figure 16: Predicted annual mean Nitrogen Dioxide concentrations for Hackney
in 2013
Note: CERC 2013 is the Council’s own modelling; LAEI 2013 represents the GLA’s modelling.
In 2018 the average Nitrogen Dioxide concentration at our continuous monitoring
station at Old Street was 48 µg/m3 (unratified and so may change), which is above
the Air Quality Standard of 40 µg/m3. However, levels of Nitrogen Dioxide are
declining, in 2010 average concentrations were 79 µg/m3 at this location. Levels of
fine and ultra-fine particles (PM10 and PM2.5) are below UK and EU standard levels48
and meet WHO guideline values across much of the borough. Further information on
monitoring undertaken by the Council and trends is available from our annual status
report to the GLA.
In December 2015 the Council published an action plan to improve air quality. A
number of measures have already been implemented. For example the Council has
48
LBH, Air Quality Annual Status Report, 2017
31set up a Zero Emissions Network which now has over 1,100 members to enable
businesses to reduce emissions and a Low Emission Network including a raft of
measures to promote low emission transport and create healthier streets in
Shoreditch. Hackney also led the way by lobbying for an extension to the Ultra-Low
Emission Zone proposed by the Mayor of London. Extending the Ultra-Low Emission
Zone to the North and South Circular roads will result in wider improvements in air
quality across Hackney and London.
The Council has also electrified a proportion of its diesel fleet (winning the 2017 ‘fleet
category’ at the National Air Quality Awards), developed its bike fleet and has used
planning and public realm schemes to promote walking and cycling.
The Hackney Air Quality Schools project commenced in 2016 and has measured
nitrogen dioxide levels at over fifty schools, undertaken assessments of over 80
schools and nurseries and is progressing schemes to install green walls were they
will reduce pupil exposure to air pollution. In particular the Schools Air Quality Project
has demonstrated that only about a quarter of the schools identified by the Mayor of
London as being in areas that failed NAQO, are likely to fail objectives.
The School Streets project, has seen road closures at key drop off times, to limit
traffic congestion and promote better air quality this, and other measures including
work to encourage young people to walk and cycle to school means that just 8.7% of
children travelled to school by car in 2016/17, compared with 18.5% in 2007/08.
Working with neighbouring boroughs the Council is also significantly increasing the
availability of electric charging facilities and encouraging ultra-low emissions freight
vehicles. Further details of actions currently underway are included within the Annual
Status Report.
One of the key means of addressing poor air quality is through the planning system.
This includes requiring air quality and traffic assessments for major developments
and developments in areas with the poorest air quality, requiring conditions to protect
end users from existing air pollution and controlling emissions from construction
activities and future uses. For example 90% of all new developments in the borough
are car free. The Council is significantly strengthening existing policies for air quality
in the developing ‘Local Plan 2033’.
The Council has recently started the process of updating the current Air Quality
Action Plan (2015-2019), which we hope to publish towards the end of 2019.
For more information see our Air quality web pages.
Transport
Figure 17 shows the methods of transport used by Hackney residents to get to work.
This provides an indication of the transport modes favoured by Hackney’s residents.
Over 85% of Hackney residents travel to work on foot, by bicycle or using public
transport. Hackney has the highest cycling rate in London – 8% of all journeys are
taken by bike49.
49
Transport for London, Travel in London 10 – Borough Level Local Implementation
Plan Performance Indicators, 2016/17
32Figure 17: Method of Travel to Work (Hackney Residents)
Source ONS 2011 Census, % of working-age population
Rail services have improved significantly recently with the opening of the East
London Line Extension linking Dalston Junction to Highbury and Islington and South
London and improvements to the North London Line to Stratford and Richmond.
In the coming years there will be improvements along the West Anglia Rail Corridor,
linking Hackney to Liverpool Street and Chingford, Cheshunt and Broxbourne,
creating more capacity
Car ownership has fallen more than 10% from 2001 levels. Only 34% of Hackney’s
households now own motor vehicles, compared with 57% across Greater London.
Some areas, particularly in the South of the borough are 70% car free.
Hackney's Transport Strategy 2015-25 sets out the council’s vision for improving
transport locally. It aims to improve conditions for walking and cycling, strengthen
sustainable transport to support local regeneration, advance the case for key public
transport infrastructure improvement, enable residents to access work opportunities,
enhance accessibility for disabled people, improve air quality and reduce emissions.
Crime and community safety
Between 2002/03 and 2014/15 crime in Hackney dropped by 33.7%50 (13558 fewer
victims of crime). The reduction in crime (volume) was not dissimilar compared to the
London Most Similar Group (MSG)51 average, although the percentage reduction
was slightly lower. That said no significant differences were observed. The London
(Metropolitan Police Service) crime average (calculated from all London Boroughs
and Aviation Security), is lower than both Hackney and the MSG average. Hackney’s
50
Note that in the last assessment this figure was 34.7%. The 33.7% is based on reconciled crime figures for
FY2014/15 published by the Met Police online (currently available from FY2011/12 to FY2017/18
at https://www.met.police.uk/stats-and-data/)
51
Brent, Greenwich, Hammersmith & Fulham, Haringey, Islington, Lambeth, Southwark, Tower Hamlets.
33MSG is made up of some of the most densely populated and challenging inner city
boroughs in London, hence the higher crime levels when compared to the Met
overall.
In the last 3 financial years crime has increased across the board; in Hackney, the
MSG and London. Between 2014/15 and 2017/18 crime in Hackney rose by 19.8%
(5084 more victims of crime), although this is still 21.6% lower than in 2002/03. The
increase in Hackney was sharper during 2016/17 than the MSG and London
averages, but crime levels stabilised during 2017/18; rising by only 0.9% from
2016/17, and this represented the lowest rise in recorded crimes compared to other
MSG boroughs (other than in Lambeth where crime reduced). Overall crime trends
are following a similar pattern across London, and Hackney is performing at a similar
level to the MSG.
Figure 18: Recorded Crimes Hackney, Most Similar Group and London 2002/3 –
2017/8
Source: Metropolitan Police Service
Growth and change
In January 2019, the Council submitted a new borough-wide Local Plan to the
Planning Inspectorate. This is the key strategic planning document, establishing a
vision and planning policies to direct and guide development in the borough up to
2033, with a robust planning framework to support growth and regeneration.
Figure 19 provides an overview of the main areas of growth and change in Hackney.
The purple areas highlighted on the map along with the enhanced corridors show key
growth areas, which will see significant development in housing, business and
infrastructure in the coming years.
Most growth will take place in growth corridors and in town centres which are linked
by theses corridors. Significant growth is also expected in the North West of the
34borough, centred round the regeneration of the Woodberry Down estate, in
Shoreditch in the south of the borough and in our town centres shaded in red.
The boroughs new Local Plan sets out a series of place policies that provide the
strategic guidance to develop area based plans and allocate sites for future
development. These key growth areas are Dalston, Hackney Central and Surrounds,
Shoreditch and Hoxton, Stamford Hill, Manor House, Clapton and Lea Bridge
Roundabout, Homerton, Hackney Wick and Enhanced Corridors. Each of these place
policies set out our vision for the area by 2033, the urban design characteristics,
development opportunities and strategic principles by which any future development
should be governed by. In addition to the already published Hackney Central and
Surrounds masterplan SPD the Council is currently in the process of developing Area
Action Plans (AAPs) for Shoreditch and Stamford Hill.
Figure 19: Key growth areas
London Borough of Hackney Proposed Submission Local Plan, 2019
35For more information about our vision for the physical regeneration of Hackney in
2033, please see our Local Plan.
36You can also read