1H FY20 BINGO INDUSTRIES LIMITED - Pushing for a waste free Australia
←
→
Page content transcription
If your browser does not render page correctly, please read the page content below

BINGO INDUSTRIES LIMITED

1H FY20                          Pushing for a waste
                                    free Australia
   Investor Presentation
    Thursday, 20 February 2020
Important notice and disclaimer
This presentation is for information purposes only and is a summary only. It should be read in conjunction with the most recent financial report and the Operating and Financial
Review document. The content of this presentation is provided as at the date of this presentation (unless otherwise stated). Reliance should not be placed on information or
opinions contained in this presentation and, subject only to any legal obligation to do so BINGO Industries Limited (‘BINGO’) does not have any obligation to correct or update
content.

This presentation does not and does not purport to contain all information necessary to an investment decision, is not intended as investment or financial advice and must not
be relied upon as such. Any decision to buy or sell securities or other products should be made only after seeking appropriate financial advice.

This presentation is of a general nature and does not take into consideration the investment objectives, financial situation or particular needs of any particular investor.

Any investment decision should be made solely on the basis of your own enquiries. Before making an investment in BINGO, you should consider whether such an investment is
appropriate to your particular investment objectives, financial situation or needs.

To the maximum extent permitted by law, BINGO disclaims all liability (including, without limitation, any liability arising from fault, negligence or negligent misstatement) for any
loss arising from this presentation or reliance on anything contained in or omitted from it or otherwise arising in connection with this.

All amounts are in Australian Dollars, unless otherwise stated. Certain statements in this presentation relate to the future, including forward looking statements relating to
BINGO’s financial position and strategy. These forward looking statements involve known and unknown risks, uncertainties, assumptions and other important factors that could
cause the actual results, performance or achievements of BINGO to be materially different from the future results, performance or achievements expressed or implied by such
statements.

Throughout this document non-IFRS financial indicators are included to assist with understanding BINGO’s performance. The primary non-IFRS information is Underlying
EBITDA, Underlying EBIT, Underlying NPAT and Operating Free Cash Flow before interest and tax payments.

Management believes Underlying EBITDA, Underlying EBIT, Underlying NPAT and Operating Free Cash Flow before interest and tax payments are appropriate indications of
the on-going operational earnings and cash generation of the business and its segments because these measures do not include one-off significant items (both positive and
negative) that relate to acquisition and integration costs. A reconciliation of non-IFRS to IFRS information is included where these metrics are used. This document has not
been subject to review or audit by BINGO’s external auditors.

All comparisons are to the previous corresponding period of 1H FY19 – the 6 months ended 31 December 2018, unless otherwise indicated. Certain figures provided in this
document have been rounded. In some cases, totals and percentages have been calculated from information that has not been rounded, hence some columns in tables may
not add exactly. Year-on-year variances have been calculated as percentages for numbers and basis points for percentages.

All forward debt and leverage metrics do not include dividends or capital management initiatives such as a share buy-back.

Agenda

         1   1H FY20 highlights

         2   Financial performance

         3   Strategy and market dynamics

         4   Development update

         5   Outlook

                                            Page   2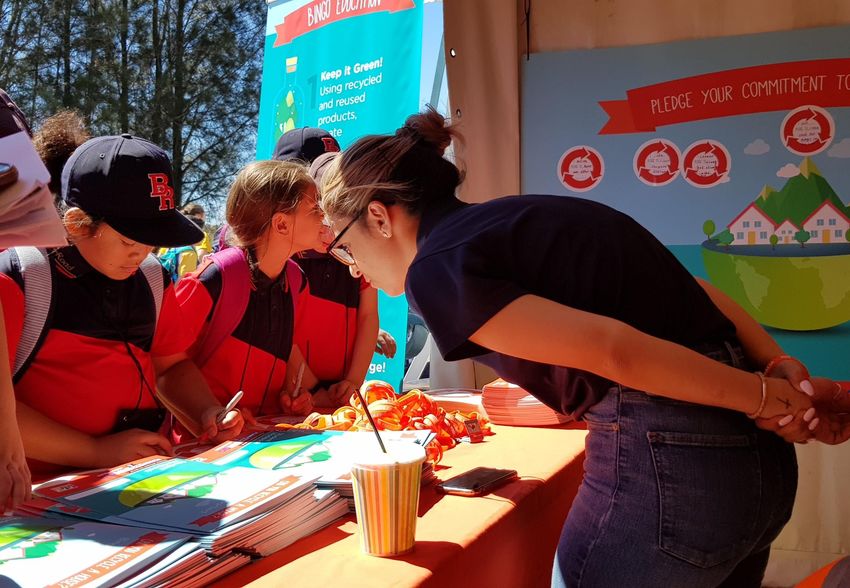
SECTION 1
1H FY20 highlights
                Page   3
1H FY20 Highlights

                        Ongoing focus on enhancing safety outcomes; reinvigorated safety communication plan rolled out across the
                        business, with a continued focus on embedding ownership of safety

                        Solid result in a challenging market; strong revenue growth of 50.7% to $271.2 million and underlying EBITDA
                        growth of 67.9% to $78.8 million; including property sales, underlying EBITDA growth of 74.8% to $82.0 1 million

                        Continuing positive trend in margin; underlying EBITDA margin increased by 690 bps to 33.0%2

                        Strong growth in operating free cash flow up 49.1% to $70.4 million, from $47.2 million in the PCP

                        Strong growth in EPS up from 2.5 cents per share to 5.8 cents per share. Statutory NPAT up 185.9% to $38.2
                        million and underlying NPAT up 31.9% to $28.4 million

                        Development program on track; West Melbourne 24 hour licence modification approved. Mortdale and Patons
                        Lane advanced recycling equipment fully operational and construction of MPC 2 well progressed

                        DADI integration well progressed; $15 million of cost synergies over two years being realised through
                        operational efficiencies, internalisation and overhead savings. Integration on track to conclude by Dec 2020

                        Reaffirm FY20 Underlying EBITDA guidance of $159 million to $164 million

1.   Underlying EBITDA excludes acquisition, capital raising, integration costs and other one-off non-recurring items and excludes gain on sale of Banksmeadow of $22.4 million. Underlying EBITDA of $82.0 million includes $3.2
     million associated with profits from sale of properties in the ordinary course.
2.   Excluding property sales Underlying EBITDA margin is 32.0%.
                                                                                                                                                                                                                               Page   4
1H FY20 financial summary
Strong focus on cost control and realising synergies from DADI integration has strengthened
EBITDA margin

                                                                                                                                            •      Net revenue up 50.7% to $271.2 million and underlying
 A$m                                                 1H FY19                 1H FY20                 Variance                                      EBITDA up 74.8% to $82.0 million.
                                                                                                                                            •      Underlying EBITDA margin expanded by 690 bps to 33.0%,
 Net revenue                                            180.0                  271.21                  50.7%                                       driven by:

 Underlying EBITDA                                       46.9                   82.02                  74.8%
                                                                                                                                                     +‒   A full six month contribution from:
                                                                                                                                                           ‒     DADI including cost synergies from operational
                                                                                                                                                                 efficiencies relating to the NSW network
 Underlying EBITDA margin                              26.1%                  33.0%3                  690 bps                                                    reconfiguration, internalisation and overhead
                                                                                                                                                                 savings
 Statutory NPAT4                                         13.4                    38.2                 185.9%                                               ‒     Other redeveloped or acquired post-collections
                                                                                                                                                                 assets including West Melbourne and Patons
 Statutory EPS                                       2.5 cents               5.8 cents                132.0%                                                     Lane
                                                                                                                                                     +‒   Implementation of NSW price rise from July 2019
 Operating free cash flow                                47.2                    70.4                  49.1%                                         +‒   Net gain on property sales of $3.2 million
                                                                                                                                            •      Solid cash conversion of 90.0% achieved, which is at lower
 Cash Conversion                                      103.5%                   90.0%               (1,350 bps)                                     end of the group target of >90% largely due to higher sales
                                                                                                                                                   in December and lag on collections from acquired DADI
 ROCE                                                  13.1%                    9.2%                 (390 bps)                                     business.
                                                                                                                                            •      As previously flagged, ROCE down 390 bps against the
 Net Debt                                               140.3                 (321.1)                    n.m.                                      PCP. Impacted by lag in cash flow from recent capital
                                                                                                                                                   investment.

 Interim dividend per share                         1.72 cents              2.20 cents                 27.9%                                •      Statutory EPS of 5.8 cents per share, up from 2.5 cents per
                                                                                                                                                   share.

1.   Net Revenue includes $22.4 million from gain on sale of Banksmeadow.
2.   Underlying EBITDA excludes acquisition, capital raising, integration costs and prepayment amortisation and excludes gain on sale of Banksmeadow of $22.4 million. Underlying EBITDA of $82.0 million includes $3.2 million
     associated with profits from sale of properties in the ordinary course.
3.   Excluding property sales Underlying EBITDA margin is 32.0%.
4.   Statutory NPAT includes transaction and integration costs of $6.6 million associated with the DADI acquisition and one off profit from sale of Banksmeadow of $22.4 million.
                                                                                                                                                                                                                            Page   5
Revenue and earnings split by segment
Approximately 70% of EBITDA is now from BINGO’s post-collections infrastructure assets

                                                      1H FY20 Net Revenue1 $m                                                               1H FY20 Underlying EBITDA $m

                                                         6%
                                                                                                                                               2%
                                                                                                                                                                                 30%

                                                                                               40%
        SEGMENT

                                                                                                                                                                                         Collections
                                                                $271.2m1                                                                              $82.0m2
                                                                                                                                                                                         Post-Collections
                                                                       50.7%                                                                               74.8%
                                                                                                                                                                                         Other
                                            54%

                                                                                                                                   68%

                                             1H FY20 Post-Collections Revenue $m                                                       1H FY20 Toro & Other Revenue $m

                                                                                                                                                                                 33%
        EXTERNAL / INTERNAL

                                                29%

                                                                                                                                                                                           Internal
                                                                $162.7m                                                                               $39.8m3
                                                                                                                                                          129.7%                           External
                                                                     55.7%
                                                                                                                                 67%

                                                                                           71%

   1.                  Segmental proportions based on gross revenue excluding eliminations and excluding $22.4 million gain on sale of Banksmeadow.
   2.                  Underlying EBITDA $82.0 million includes $3.2 million associated with profits from sale of properties in the ordinary course.
   3.                  Other revenue includes $22.4 million from gain on sale of Banksmeadow which has been excluded for the purpose of calculating external and internal proportions.
                                                                                                                                                                                                            Page   6
1H FY20 operations update

     In 1H FY20 we delivered:

     •
     ✓          DADI integration well progressed and expected to complete by December 2020. Cost synergies of $15 million on track
                to be achieved equally over FY20 and FY21.
     •
     ✓          Banksmeadow divested and network reconfiguration delivering efficiencies. Banksmeadow was divested in
                September 2019 for $50 million, recognising a profit on sale of $22.4 million.
          –          Sale of non-core property assets1 in the 1H FY20 resulted in profit of $3.2 million and capital return of ~$16 million 2.
          –          Divestment of non-core asset sales ongoing and expected to deliver total capital return of $30 million.
     •          NSW price rise implemented from July 2019 resulting from the introduction of the QLD levy, and after allowing for
     ✓          loss in volumes, is expected to provide a net benefit to BINGO in FY20.
     •
     ✓          Licence modification for 24 hour operations at West Melbourne recycling facility approved in February, West
                Melbourne recycling facility expected to be operating to the extended hours from May 2020.
     •
     ✓          Growing proportion of B&D collections Work In Hand (WIH) is under supply agreement – WIH as a proportion of
                revenue has increased to ~25% and a healthy pipeline underpins our outlook.
     •
     ✓          Solid pipeline of C&I opportunities focused on increasing tender activity and targeting customers with BINGO’s unique
                value proposition in non-putrescible resource recovery, technology and sustainability credentials. C&I WIH up ~45% since
                FY19 result, with a win rate of approximately 50% and a renewal rate of 90%.
     •
     ✓          Appointment of key personnel – Chris Jeffrey appointed Chief Financial Officer from November 2019; Declan Hogan as
                Chief Information Officer appointed to the Executive Leadership team in February 2020; Nik Comito appointed as Head of
                Sustainability, to further strengthen the group’s ESG focus.

1.   Further detail on net profit from sale of surplus property assets has been provided on slide 25.
2.   Surplus property assets sold to date will return $15.6 million of which $11.8 million before 30 June 2020 and $3.8 million by 31 December 2020.
                                                                                                                                                       Page   7
1H FY20 safety and sustainability achievements

Achievements in 1H FY20                                                            Lost Time Injury Frequency Rate (LTIFR)

 ✓•   LTIFR of 1.7 for 1H FY20, up from 1.4 in 1H FY19; safety lead and lag
      indicators continue to outperform industry averages.
                                                                                   16

 ✓•   Implemented a new approach to safety, including:                             12
       – Launch of new communication channels and engagement protocols
       – Relaunch of our Think Safe, Be Safe, Home Safe messaging                  8
       – Introduction of BINGO Zero Harm Rules                                                                                          Mean
       – Increasing the scope, function size and reach of Zero Harm                4
         Committee                                                                                                           31 Dec 2019 = 1.7

 ✓•   Focused on increasing our diversity by concentrating our inclusion
      efforts on groups that are traditionally disadvantaged or underrepresented
                                                                                   0
                                                                                   Dec-14    Dec-15    Dec-16    Dec-17      Dec-18       Dec-19
      – including Aboriginal and Torres Strait Islander peoples, those with
      disabilities and women. Female Directors now represent ~30% of the
      BINGO Board.

 ✓•   Launched and commenced implementation of first Reconciliation
      Action Plan outlining how we intend to contribute to reconciliation in our
      communities.

 ✓•   Responsible Sourcing program well advanced including:
       – Mapping and risk assessment of supply chain
       – Field assessments of high-risk suppliers completed
       – Updating procurement processes, including new supplier Code of
         Conduct
       – First Modern Slavery Statement to be delivered in 1H FY21

                                                                                                                                                 Page   8
SECTION 2
Financial performance
                  Page   9
Strong year-on-year growth across all key metrics
despite ongoing headwinds in some key markets
Net revenue $m Underlying EBITDA $m
1H FY18-1H FY20 CAGR: 38.0% 271.2 1H FY18-1H FY20 CAGR: 36.8%
22.4
248.8 82.0 1
180.0 46.9
142.4 43.8
1H FY18 1H FY19 1H FY20 1H FY18 1H FY19 1H FY20
EBITDA
30.8% 26.1% 33.0%2
Margin %
Underlying NPATA3 $m Operating free cash flow4 $m
1H FY18-1H FY20 CAGR: 18.7% 1H FY18-1H FY20 CAGR: 40.8%
31.2 70.4
22.2 23.0 47.2
35.5
1H FY18 1H FY19 1H FY20 1H FY18 1H FY19 1H FY20
Profit on Banksmeadow 1H FY20
1. Underlying EBITDA of $82.0 million includes $3.2 million associated with profits from sale of properties in the ordinary course.
2. Underlying EBITDA margin excludes gain on sale of Banksmeadow of $22.4 million in EBITDA and Revenue.
3. Underlying NPATA adds back amortisation of customer contracts and brand.
4. Operating free cash flow calculated as cash flow from operating activities net of income tax paid, acquisition and integration costs. 1H FY20 operating free cash flow excludes acquisition and integration costs paid of
$9.7 million. 1H FY19 operating free cash flow excludes acquisition and integration costs paid of $7.9 million.
Page 10Summary segmental performance
A$m 1H FY19 1H FY20 Variance
Collections revenue 100.4 122.0 21.5%
Post-Collections revenue 104.4 162.7 55.7%
Other revenue 17.3 39.81 129.7%
Eliminations2 (42.2) (53.2) 26.0%
Net Revenue 180.0 271.2 50.7%
Collections Underlying EBITDA 19.3 24.7 28.0%
Post-Collections Underlying EBITDA 25.3 55.6 120.2%
Other Underlying EBITDA 2.4 1.7 (28.7%)
Underlying EBITDA 46.9 82.0 74.8%
Collections EBITDA margin 19.2% 20.3% 110 bps
Post-Collections EBITDA margin 24.2% 34.2% 1,000 bps
Other EBITDA margin 13.6% 9.7%3 (390 bps)
Group Underlying EBITDA margin 26.1% 33.0%3 690 bps
1. Other revenue includes $22.4 million from gain on sale of Banksmeadow.
2. Elimination of intercompany sales, which represent the revenue generated by the Post-Collections segment by processing waste delivered by the Collections segment, and the products sold by TORO to the
Collections segment.
3. Underlying EBITDA margin excludes gain on sale of Banksmeadow of $22.4 million in EBITDA and Revenue.
Page 11Collections margin stabilised
BINGO’s Collections business continues to diversify across geography and business units, with a
21.5% and 28.0% increase in revenue and underlying EBITDA respectively
Summary Commentary
$m 1H FY19 1H FY20 Variance • BINGO’s Collections fleet consists of 286 B&D
vehicles and 66 C&I vehicles, largely consistent
Revenue 100.4 122.0 21.5%
with FY19. Latent capacity in the NSW fleet has
been redeployed to VIC, with the VIC B&D fleet
Underlying EBITDA 19.3 24.7 28.0% increasing by 14 vehicles.
Underlying EBITDA margin 19.2% 20.3% 110 bps • Collections revenue up 21.5% to $122.0 million
and EBITDA up 28.0% to $24.7 million.
• B&D collections remains highly competitive with
Revenue ($m) Underlying EBITDA ($m) low barriers to entry. EBITDA margin is now
1H FY18-1H FY20 CAGR: 24.7% 1H FY18-1H FY20 CAGR: 17.2% approximately 20%.
– Collections margin is expected to moderate
slightly in 2H FY20 as we target greater
volumes to support Patons Lane, Mortdale
and in anticipation for licence modifications.
122.0 24.7 • BINGO continues to target expansion in C&I
100.4 19.3 collections, ~15% year-on-year revenue growth
78.5 18.0
achieved in 1H FY20.
• BINGO’s C&I Collections revenue now
1H FY18 1H FY19 1H FY20 1H FY18 1H FY19 1H FY20 represents ~30% of total Collections revenue.
EBITDA
22.9% 19.2% 20.3%
margin
Page 12Strong momentum in Post-Collections
Post-Collections infrastructure now contributes approximately 70% of Group EBITDA
Summary Commentary
$m 1H FY19 1H FY20 Variance • Post-Collections infrastructure now contributes
~70% of the Group’s EBITDA, reflecting recent
Revenue 104.4 162.7 55.7% investment in acquired assets and redeveloped
sites.
Underlying EBITDA 25.3 55.6 120.2% • Year-on-year revenue growth underpinned by a full
6 month contribution of DADI and West Melbourne.
Underlying EBITDA Margin 24.2% 34.2% 1,000 bps • Patons Lane1 advanced recycling equipment now
fully operational.
• Post-Collections EBITDA margin increased by
Revenue ($m) Underlying EBITDA ($m) 1,000 bps driven by:
1H FY18-1H FY20 CAGR: 41.0% 1H FY18-1H FY20 CAGR: 52.2% – DADI operational efficiencies and cost
synergies
– NSW network reconfiguration program
– NSW price increases; partially offset by volume
impact and customer losses during the period
162.7 55.6 • Post-Collections volumes in NSW impacted by
headwinds in multi-residential construction and
104.4 delays in commencements of announced
81.8 24.0 25.3
infrastructure projects. VIC volumes continue to
increase year-on-year.
1H FY18 1H FY19 1H FY20 1H FY18 1H FY19 1H FY20 • Recycled product sales has increased to 5.6% of
Post-Collections revenue, 4.0% of total Group
EBITDA revenue and is expected to grow over the medium
29.3% 24.2% 34.2%
Margin term.
1. Patons Lane advanced recycling equipment now fully operational as at February 2020 and 12 month forecast EBITDA of $20 million maintained on a run-rate basis.
Page 13Other performance
Other revenue up 129.7%, driven by proceeds from the sale of Banksmeadow
Summary Commentary
$m 1H FY19 1H FY20 Variance • Other includes the manufacture and sale of bins
through TORO, as well as unallocated corporate
Revenue 17.3 39.81 129.7% costs.
Underlying EBITDA 2.4 1.7 (28.7%) • Revenue up 129.7%, excluding the proceeds
from Banksmeadow revenue was broadly flat
year-on-year.
Underlying EBITDA margin 13.6% 9.7%2 (390 bps)
• Other EBITDA margin decreased to 9.7%2 from
13.6% in PCP, impacted by:
Revenue ($m) Underlying EBITDA ($m)
• TORO margin decreased due to focus
1H FY19-1H FY20 CAGR: 72.9% 1H FY19-1H FY20 CAGR: (5.0%) on refurbishment and restoration of bins
39.8 as part of the DADI integration;
Banksmeadow • no earnings from equipment rental;
proceeds
$22.4m
• higher insurance costs; and
0.5% 2.4 • increased corporate costs.
1.9 1.7 • Over the medium term, TORO continues to
17.3 17.4 target market share in SA and VIC markets, and
13.3
will support BINGO’s expansion into QLD.
1H FY18 1H FY19 1H FY20 1H FY18 1H FY19 1H FY20
EBITDA
14.0% 13.6% 9.7%2
margin
1. Other revenue includes $22.4 million from gain on sale of Banksmeadow.
2. Other Underlying EBITDA margin excludes gain on sale of Banksmeadow of $22.4 million in EBITDA and Revenue.
Page 14Strong balance sheet with flexibility maintained
Balance Sheet Net Bank Debt2 $m
As at As at $500 million total debt facility
$m 31-Dec-19 30-Jun-19
Total current assets 138.2 156.0
Total non-current assets 1,230.4 1,176.6
Total Assets 1,368.6 1,332.7 321.1
275.8
Total current liabilities 106.6 157.1
Total non-current liabilities 419.1 349.1 (140.3)
Total Liabilities 525.7 506.2
1H FY19 FY19 1H FY20
Net assets 842.9 826.5
Leverage Ratio3 (Net Bank Debt / Annualised
• Approximately $700 million of property, plant and equipment held on balance Underlying EBITDA)
sheet (does not fully reflect valuation of associated licenses or mark to market Target Leverage Ratio 1.5x-2.0x
property valuation).
• Net assets1 per share of $1.29, up from $1.21 in 1H FY19.
2.0x
• Net bank debt of $321.1 million and leverage ratio of 2.0x in line with guidance
provided to the market. 1.5x
2.6x
• Existing principal debt facility, was amended during the reporting period to 2.0x
increase the total commitment by the amount of the accordion facility for up to
$100 million increasing the total commitment to $500 million. The facility matures n.m
in August 2021.
1H FY19 FY19 1H FY20
1. Net assets per share calculated as net assets / total shares outstanding as at 31 December 2019.
2. Net bank debt calculated as bank borrowings less cash.
3. Leverage ratio calculated as net bank debt (bank borrowings less cash) / Annualised 1H FY20 Underlying EBITDA.
Page 15Summary cash flow and capex
Solid growth in operating free cash flow up 49.1% to $70.4 million
Underlying historical and forecast cash flow Capex cash flow breakdown $m
$m 1H FY20 1H FY19 Includes the final
payment for Patons Lane
and stamp duty
Underlying EBITDA 82.01 46.9 associated with DADI
19.0
Operating cash flow 43.6 22.0
Related to
Tax 17.2 17.3 45.0
Mortdale, Patons 96.2
Lane and
4.3 Eastern Creek
Acquisition & integration costs 9.7 7.9
27.9
Operating free cash flow 70.4 47.2
Growth & Execution of Minto Acquisition related Redevelopment Total 1H FY20
Operating free cash flow conversion2 90.0% 103.5% maintenance call option capex projects Capex
capex
Comments and observations
• Operating free cash flow generation of $70.4 million an improvement of 49.1% against the PCP, positively impacted by the contribution from DADI.
• Further focus on debtor collections in 2H to achieve >90% target; cash conversion of 90.0% for the half year due to:
– Stronger than expected sales in December
– Lag in cash collections from acquired DADI business
• Total cash capital expenditure was $96.2 million for the half; we expect to end FY20 with capital expenditure between $140-$150 million, in line with prior
guidance.
• Underlying steady state capex estimated to be approximately 8%-10% of revenue
1. Underlying EBITDA excludes acquisition, capital raising, integration costs and prepayment amortisation and excludes gain on sale of Banksmeadow of $22.4 million. Underlying EBITDA of $82.0 million includes $3.2
million associated with profit from sale of properties in the ordinary course. Underlying EBITDA used in calculating operating free cash flow conversion is $78.2 million (1H FY19 is $45.6 million).
2. Cash conversion calculated as cash flow from operating activities net of acquisition and integration costs and tax divided by underlying EBITDA, excluding gain / loss on PP&E and interest income.
Page 16Progress towards ROCE and leverage targets
Group Return on Capital Employed (ROCE1) (%) Forecast FY20 Net Debt2 $m
Historical ROCE Group Target ROCE
Implied leverage
~120 (95) ratio of ~2.0x
Implied leverage
ratio of ~2.6x
30
15.0% ~330
276
9.2% 9.2% 276
FY19 1H FY20 Group Target FY19 Net Debt Patons Lane Growth Capex Other Free FY20 Net Debt
Final Payment Cash Flow 3
• We expect to achieve a 15% Group ROCE incrementally over the medium term • FY20 will see free cash flow generation from a full year contribution from
through: DADI, West Melbourne, the sale of non-core assets, and an increased
‒ full year of DADI earnings and cost synergies of $15 million over two contribution from Patons Lane in the 2H.
years. • BINGO expects to end FY20 with a leverage ratio of ~2.0x, down from ~2.6x in
‒ full year contribution from Patons Lane and West Melbourne. FY19.
‒ driving efficiencies from existing assets and increasing returns on
• Strong balance sheet supported by approximately $700 million of property,
assets through our NSW network reconfiguration plan.
plant and equipment providing balance sheet flexibility (does not fully reflect
‒ modifications to Eastern Creek licence approvals (Mod 6). valuation of associated licenses).
‒ Mortdale and Eastern Creek MPC 2 operational.
‒ ongoing review of balance sheet structure.
‒ organic growth from structural shifts in the market supporting the
business model.
1. Return on Capital Employed (ROCE) calculated as Underlying EBIT / Average (Net Debt + Equity).
2. Net bank debt calculated as bank borrowings less cash.
3. Other Free Cash Flow includes cash generated in the ordinary course and proceeds from sale of non-core assets and Banksmeadow; offset by maintenance capex, interest and dividends.
Page 17Key projects awarded in 1H FY20
Strong momentum in VIC B&D diversified construction with tier 1 builders
Key B&D projects awarded Key C&I contracts awarded
• Western Sydney Airport, bulk earthworks (Stage 2) • Bunnings 12 month extension in NSW
• WestConnex 3B, Rozelle interchange in NSW for 4 years • JLL Preferred Supplier Synergy Agreement in NSW for 3
years
• Lendlease, Melbourne Airport T2 Upgrade, VIC for 18 months
• Brookfield Integrated Service, Correctional Facilities in NSW
• Multiplex, Sapphire by the Gardens, VIC for 2 years for 3 years
• Lendlease, MQT Tower, VIC for 2 years • Victorian Government Schools Preferred Supplier Agreement
in VIC
• Probuild, 1000 Latrobe Street VIC for 2 years
• Renewed AHB Group whole of company contract for 2 years
• Watpac, Natura Macquarie Park in NSW for 2 years in VIC
• Hickory, Hawthorn Park in VIC for 2 years • Porta Davis whole of company contract for 1 year in in VIC
• Probuild, Corner Queen and Collins in VIC for 18 months
• Laing O’Rourke national preferred supplier
Page 18Pipeline of opportunities remains healthy
BINGO Bins Pipeline – Building & Demolition BINGO Commercial Pipeline – Commercial & Industrial
(A$m) (A$m)
Annual Total contract
To be revenue value
VIC ~$350m 55% 41% 3%1%
19% 10% 7% 47% 17% tendered
~$110m ~$320m
Annual Total contract
Submitted 49% 28% 23% revenue value
NSW 18% 16% 7% 43% 15% ~$580m ~$1.0m ~$2.8m
Property Services Health, Community & Schools
Social Infrastructure Civil & Infrastructure Commercial Construction
Retailers & Shopping Centres Manufacturers & Distributors
Residential Construction Other 1
Government
Work in Hand Work in Hand
• BINGO has secured supplier agreements for approximately 25% of its • Renewal rate of ~90% over the last 12 months maintained.
B&D collections annual revenue (up from ~10-15% at the time of IPO). • Win rate2 of ~50%, up from 35% as at 30 June 2019. Largely driven by
targeted bid strategy focused on customers with non-putrescible waste
Pipeline
streams.
• Direct pipeline of ~$930 million of waste revenue from announced B&D • Major C&I contracts have a typical tenure of approximately 3 years, average
construction projects, up ~$190 million from August 2019. Largely driven remaining tenure of contracted book is over 2 years.
by new residential projects in the pipeline. Residential construction as a
Pipeline
total proportion of the pipeline across NSW and VIC has increased from
~35% in August 2019 to ~45%. • Total size of pipeline remains broadly consistent with pipeline as at August
2019. Significant opportunities in Retailers and Shopping Centres and
• Infrastructure projects (Civil and Social) continue to make up over 30% of Health, Community & Schools.
the pipeline across NSW and VIC. Civil and Infrastructure pipeline
• Small pipeline of submitted tender represents only those tenders submitted
expected to increase as commencement dates are locked in.
in late 2019 and early 2020.
Note: Pipeline represents the estimated value of work to be awarded over the next 24 months, it does not include projects already secured by BINGO (i.e. work in hand). Includes contracts and projects which have been
publicly announced and does not include small BAU style contracts. Typically the waste contract represents approximately 1.5% of the total project value.
1. Other includes retail, hotels, leisure and industrial construction.
2. Win Rate over the last 12 months to 30 Jan 2020, based on number of bids.
Page 19SECTION 3
Strategy and market dynamics
Page 20Key achievements in line with strategy
Our strategy is focused on retaining our competitive advantage in technology, customer service and
recycling
PROTECT AND OPTIMISE ENHANCED VERTICAL GEOGRAPHIC
THE CORE INTEGRATION EXPANSION
ACHIEVED ACHIEVED ACHIEVED
✓ Market leading position in B&D collections ✓ Advanced recycling processing capacity in ✓ Expansion in NSW and space to optimise
and post-collections in both states NSW and VIC business operations
✓ Double digit revenue growth in C&I and ✓ 100% internalisation of non-putrescible ✓ Entry and expansion in VIC
organic entry in C&I in VIC volumes in NSW ✓ Market scoping for QLD entry
✓ Enhanced network capacity ✓ Recovery rates of >75% in NSW
FY20 Focus Areas FY20 Focus Areas FY20 Focus Areas
• Superior SEQ performance committed to NSW VIC
Zero Harm and zero non-conformances ✓ Integrate DADI business
✓ Enhance network and fleet utilisation
✓ Preserve EBITDA margins optimising • Capacity enhancement - deliver MPC2 at through optimisation of current footprint
network and reduced operating costs DADI Eastern Creek, Mortdale upgrades and
modifications to the Easter Creek license ✓ Increase recovery rates and waste
• Grow market share in C&I across NSW and internalisation
VIC and as a % of revenue • Develop C&I post-collections offering
assess/scope suitable post-collections solutions • Diversification of markets; grow C&I
• Increase recovery rates towards 80-85% for putrescible C&I waste i.e. EfW footprint; develop new & sustainable end
through investment in advanced recycling product markets
• Deliver Eastern Creek Recycling Ecology
equipment
Park Master Plan ✓ Leverage national customer accounts and
• Business systems optimisation deliver ✓ Delivery of Patons Lane recycling and landfill target umbrella agreements
technology platform upgrades • Assess Energy from Waste (EfW) • Deliver modifications to West Melbourne
✓ Optimise digital customer channel through opportunities operating hours to 24 hour operations
website roll out, improved user experience VIC QLD
and call centre operations • Assess EfW opportunities
• Target entry into QLD in FY21
• Enhance recycling capacity and internalisation
Page 21Structural and market drivers underpinning future
organic growth
BINGO has invested ahead of the cycle and is expected to benefit from a rebound in the construction
cycle together with structural shifts from changes in the regulatory environment
STRUCTURAL MARKET
WASTE MARKET RESIDENTIAL NON-RESIDENTIAL INFRASTRUCTURE
• Federal and State • Rebound in residential cycle • Non-residential pipeline • Engineering pipeline of
Government focus on waste expected from late 2020 to underpinned by committed announced infrastructure
policy and climate change March 2024 with a 50% funding of over $20 billion from projects continues to increase;
related impacts. increase from trough to peak1. NSW and VIC Governments over $125 billion of committed
• Waste Levies increasing across health and education. government funding in NSW and
across Australian states. VIC Activity expected to remain VIC ($70 bn in NSW and $50bn)
waste levy expected to elevated. over the next 4 years2.
increase. Total Australian Construction Work Done1
• Circular economy creating a 250 227.4
222.3
202.8 202.9 210.8
market for recycled products. 196.8 199.9
200
• Disruption and innovation
providing opportunities for new
$billion
150
technology and enhanced
recovery. 100
• B&D and C&I the two largest
50
waste segments; accounting
for 80% of waste volume in 0
NSW and VIC. FY18 FY19 FY20 FY21 FY22 FY23 FY24
Engineering Construction 3 Non-Residential Construction Residential Construction
1. Source: BIS Oxford Economics, ABS. Refer to slide 52 for further information on the forecast recovery in the residential cycle.
2. Infrastructure Partnerships Australia analysis, based on 2019-20 budgets.
3. Engineering construction represents non-oil and gas engineering construction.
Page 22Regulatory landscape
Government policy and regulatory environment continue to pivot towards BINGO’s recycling-led
business model, and will see the sector under greater scrutiny
Regulatory dynamic Implication for BINGO
Council of Australian Governments (COAG) to ban the State and Federal Governments are conducting industry
2020 COAG ban on export of waste plastic, paper, glass and tyres in 2020, inquiries and preparing waste strategies and incentives
waste exports which will necessitate the development of a more robust which will further encourage investment in domestic
domestic recycling capability. recycling. BINGO continues to contribute to these
inquiries/strategies.
State waste disposal levies likely to continue to QLD and SA levy increases implemented in 2019. VIC levy
State waste increase to incentivise recycling and disincentivise expected to increase in 2020 providing upside for BINGO’s
disposal levies sending waste to landfill. Victorian operations.
Federal Federal Government preparing to unveil ambitious new BINGO produces over 500k tonnes of recycled products
Government targets for recycled products requiring all states and contributing ~4.0% of the Group’s revenue. This will likely
recycled content territories to spend a portion of their procurement increase over the medium term as recycled products are
targets budgets on recycled materials for public projects. mandated for us in new developments.
Heightened Higher minimum standards for compliance increase barriers
Heightened focus from EPA on raising and enforcing
to entry. Minto and Mortdale matters resolved, fines of $90k
compliance focus higher compliance standards for the waste industry (i.e.
and $30k respectively paid in H1FY20 relating to license
from EPA fire, environmental etc.).
breaches in 2017.
Increased Recent consolidation in the waste industry has led to ACCC investigation into the NSW B&D waste sector price
regulator scrutiny increased scrutiny from market regulators. increase continues.
Page 23SECTION 4
Development update
Page 24The value of BINGO’s property portfolio
BINGO actively manages it property and infrastructure portfolio to ensure value is maximised
Banksmeadow case study: Increasing value of property assets
Overview through operational enhancements
• BINGO’s current property and infrastructure portfolio has a book value of • BINGO has invested in property assets in key locations across NSW and
approximately $446 million1 and includes 20 of properties with ~145 VIC which have significant value as licensed waste management
hectares of land across NSW and VIC. facilities.
• BINGO holds options to purchase an additional c.$170 million of land • BINGO acquired Banksmeadow in November 2015 for c.$27 million.
covering ~30 hectares of property in Alexandria, Clayton South and Eastern
Creek. • As part of the ACCC clearance of the DADI acquisition, Banksmeadow
• BINGO maximises value from surplus property assets through value-added was divested in September 2019 via a competitive process for $50
land management, rezoning or redevelopment. million.
• BINGO continuously reviews its property portfolio to optimise end-use value • Demonstrates BINGO’s ability to add value to property through
either through operational enhancements, or property redevelopment i.e. development and operational enhancements.
network reconfiguration in NSW.
• Recycling over $30 million in capital through property sales (excluding
Banksmeadow).
Net profit from sale of surplus property assets $m Potential future surplus land sales
4.62
Surplus land sales Minto, NSW | St Marys, NSW | Auburn properties, NSW
Indicative timeline 2020 2021 2022 2023+
2.4
Minto, NSW
1.0
0.4
St Mary’s, NSW
(0.7) Auburn properties,
38 McPherson St, 11 Pembury Rd, 9B Pembury Rd, 17-19 Dunheved 159 Walker St,
Banksmeadow Minto Minto Circuit, Helensburgh
NSW
St Marys
1. Includes value of property (land and buildings) including landfill land, excludes value attributable to landfill void space.
2. Profit on property of $4.6 million is part of the total $22.4 million net gain on sale of Banksmeadow.
Page 25Development update
Mortdale transfer facility delivered and Patons Lane advanced recycling equipment installed and
operational from February 2020
• Patons Lane opened in July 2019, with interim recycling capacity.
• Installation of advanced recycling equipment now complete and site fully
operational as at February 2020.
Patons Lane
• As part of the network reconfiguration Patons Lane is being used as an
integrated asset with Eastern Creek to optimise operating costs and
throughput over a rolling 12 month period.
• Construction of Materials Processing Centre (MPC) 2 commenced in June
2019 and is expected to be complete late 1H FY21.
• Modification 6 which includes expansion of tonnes into the landfill and
Eastern Creek extension of site operating hours, continues to be progressed for approval.
• Site planning for delivery of Eastern Creek Recycling Ecology Park well
underway.
• Mortdale transfer facility completed in February 2020.
• All site and building works complete including installation of solar panels.
Mortdale
• Adding 220,000 tonnes of network capacity to BINGO network in NSW, and
greater capacity to serve the Southern Sydney market.
Page 26Pushing for a
waste free
Australia
SECTION 5
Outlook
Page 27Continuing to enhance returns on our existing
investment
Solid result in a challenging market; Focus on execution discipline to benefit from significant upside
from market turnaround
Focus areas for 2H FY20
PERFORMANCE UTILISATION MARKET
• Ongoing focus on safety initiatives to • Patons Lane now fully operational, • Double digit C&I revenue growth is still
deliver our commitment of zero harm. further work to maximise returns on the below our expectations. Pricing pressure
asset through increasing volume and in putrescible waste and COAG
• Disciplined approach to cash collection optimising operational strategy1. impacting pricing for paper and
to increase full year cash conversion cardboard and comingled materials. 2H
• Solid operating platform and market
towards 100%. focus on growing market share and
position established in VIC; strategy
expanding margin.
• Technology upgrades to ERP and focused on attracting higher margin
material and optimising recycling
customer portals. • Increasing throughput within the network
operations to enhance EBITDA margins.
to support recent redevelopments going
Longer term strategy to replicate NSW
into FY21.
business model of vertical integration.
Implement West Melbourne 24 hour
operations from May 2020.
• Delivery of licence modifications at
Eastern Creek to increase annual landfill
capacity and extend operating hours.
1. Strategy focused on utilising Patons Lane and Eastern Creek as one integrated asset surging volume between the two sites to reduce operating costs.
Page 28Outlook
• BINGO expects to achieve solid year-on-year growth in FY20 underpinned by a full year contribution from West Melbourne
recycling facility, DADI, Patons Lane recycling facility (now fully operational as at February 2020) and ongoing operational
enhancements.
• Acquisitions and developments continue to perform in line with expectations.
• The following factors means there will be a slight skew towards the 2H:
– Patons Lane advanced recycling facility fully operational;
– Implementation of extension to West Melbourne operating hours in late 4Q FY20;
– Mortdale operational in 3Q FY20; and
– Higher volumes, partially offset by slight moderation in Group EBITDA margin versus 1H.
• Solid outlook for construction activity maintained. Headwinds in multi-dwelling residential construction are expected to
continue in FY20; Infrastructure and the broader construction pipeline remains robust together with opportunities for further
growth in C&I.
• Prior investment positions the business favourably for further growth, with the completion of MPC 2 at Eastern Creek, further
consolidation in VIC and potential entry into QLD in FY21.
FY20 Guidance reaffirmed:
BINGO expects to report Underlying EBITDA1 in the range of $159 million - $164 million2 for the financial year ending
30 June 2020.
1. Underlying EBITDA excludes acquisition, capital raising, integration costs and other one-off non-recurring items.
2. Initial guidance range incorporates AASB16 changes of ~$4.8 million in EBITDA, table provided on slide 33.
Page 29Looking ahead – FY21 and beyond
BINGO has invested significantly in its post-collections network of infrastructure assets and expects
above trend growth to continue into FY21 and beyond
FY21 and beyond growth drivers
Underlying EBITDA (A$m)
• MPC 2 operational end 1H FY21.
Expected to deliver ~$15 million
$159-$164 per annum.
• Full year contribution from
Mortdale and Patons Lane
advanced recycling equipment.
• Proposed Modifications to
$107.41 Eastern Creek licence approvals.
• Full year benefit of 24 hour
operations at West Melbourne.
• Upside from potential VIC levy
increase.
• Continued organic growth in the
C&I business.
• Entry into QLD.
• Recovery in residential market.
FY19 FY20 FY21 +
1. FY19 Underlying EBITDA adjusted to include interest income of $1.3 million.
Page 30APPENDICES
Page 31i. FY20 financials & calibration
Page 32FY20 calibration of key line items and
AASB16 impact
Indicative figures for key line items provided below:
Item Comment FY20
Capex • Capex is expected to be within the following range1 $140-$150 million
• Interest is based current year average. Debt maturity profile
Interest approx. 2 years $15-$16 million
• Incorporates AASB16.
• Taxation is based on normal tax profile and recent business
Tax Effective Tax Rate ~30%
performance
• Depreciation will increase incorporating DADI and Patons
Depreciation ~$40 million
Lane in FY20; and AASB16
Amortisation of:
• Amortisation includes customer contracts, acquired brands • Customer contracts ~$6-7 million
Amortisation
and remaining void space of landfill assets • Void space ~$12-14 million
• Brand ~$2 million
• Relates to rebranding, compliance, systems integration and
DADI Integration Costs $10-$11 million
redundancies
Eliminations • Bingo and DADI eliminations in revenue $110-$120 million
AASB 16 impact:
Previous
$m AASB 16 Impact Description
AASB 117
EBITDA (4.8) - 4.8 Reduction in rent expense
Interest expense 0 3.3 3.3 Increase in Interest expense
Depreciation 0 3.0 3.0 Increase in Depreciation expense
NPBT (4.8) (6.3) (1.5) Decrease in Net Profit Before Tax
1. Long term underlying growth and maintenance capex is expected to be equal to depreciation which represents 8-10% of revenue.
Page 33Reconciliation from statutory to underlying results
1H FY20 reconciliation from statutory to underlying
$m Notes Revenue EBITDA EBIT NPAT NPATA
1H FY20 statutory results 271.2 96.2 65.9 38.2 38.2
Gain on sale of Banksmeadow 1 (22.4) (22.4) (22.4) (22.4) (22.4)
Write-down on insurance receivables 2 1.6 1.6 1.6 1.6
Integration costs 4 6.6 6.6 6.6 6.6
Performance contract amortisation 4 0.1 0.1 0.1
Amortisation of certain intangibles 5 4.1
Pro forma tax adjustment 6 4.2 3.0
1H FY20 Underlying results 248.9 82.0 51.9 28.4 31.2
Commentary
1. Gain on sale of Banksmeadow facility of $22.4m.
2. Includes write-down on insurance receivables of $1.6m associated with the Kembla Grange rectification works.
3. Integration costs represent the costs incurred by BINGO to integrate businesses acquired, or to be acquired, into the Group. Integration costs
include bringing the operations in line with BINGO safety standards, compliance costs, marketing and rebranding, travel and employee costs.
4. As part of an acquisition made during FY15 the Group pre-paid a portion of consideration to the vendor which was linked to the vendors continued
employment. As certain employment conditions are satisfied the prepayment is amortised and recognised as remuneration expense. The amount
will be fully amortised by the financial year ending 30 June 2020.
5. Includes the amortisation expense of certain intangibles being: (a) Customer contracts; and (b) Brands.
6. Represents the income tax impact of the underlying adjustments (excluding acquisition costs), calculated at 30%.
Page 34Summary profit and loss
Summary income statement
$’000 1H FY20 1H FY19
Revenue 243,269 176,353
Other income 27,979 3,605
Total revenue and other income 271,248 179,958
Tipping & transportation costs (88,765) (78,811)
Employee benefits expenses (59,624) (40,949)
Depreciation and amortisation expenses (30,148) (14,081)
Trucks and machinery costs (7,995) (5,438)
Finance costs (7,782) (2,843)
Acquisition costs - (3,690)
Rent and outgoings (465) (1,030)
Capital raising costs - (410)
Other expenses (18,379) (11,690)
Total expenses (213,158) (158,942)
Profit before income tax 58,090 21,016
Income tax expense (19,891) (7,657)
Profit for the period attributable to owners of the Company 38,199 13,359
Earnings per share
Basic earnings per share 5.8 cents 2.5 cents
Diluted earnings per share 5.8 cents 2.5 cents
Page 35Financial position
Balance sheet ($’000) 1H FY20 FY19
Assets
Current assets
Cash and cash equivalents 13,905 39,189
Trade and other receivables 100,400 71,317
Contract assets 539 530
Inventories 7,407 7,552
Assets held for sale 3,800 24,928
Other assets 12,174 12,468
Total current assets 138,225 155,984
Non-current assets
Property, plant and equipment 682,298 679,167
Right-of-use assets 40,435 -
Intangible assets 507,623 497,476
Total non-current assets 1,230,356 1,176,643
Total assets 1,368,581 1,332,627
Liabilities
Current liabilities
Trade and other payables 97,576 145,681
Income tax payable 3,887 6,391
Provisions 5,087 5,011
Total current liabilities 106,550 157,083
Non-current
liabilities
Borrowings 333,323 313,255
Deferred tax liabilities 30,913 25,852
Provisions 13,536 9,987
Other payables 41,323 -
Total non-current liabilities 419,095 349,094
Total Liabilities 525,645 506,177
Net assets 842,936 826,450
Equity
Issued capital 1,282,575 1,288,923
Other contributed equity 1,244 1,244
Reserves (542,889) (541,825)
Retained earnings 102,006 78,108
Total Equity 842,936 826,450
Page 36Cash flow
Cash flow statement
$’000 1H FY20 1H FY19
Receipts from customers 252,970 186,926
Payments to suppliers and employees (192,229) (147,623)
Income tax paid (17,170) (17,256)
Net Cash Flows from Operating Activities 43,571 22,047
Purchase of property, plant and equipment (77,857) (150,766)
Purchase of business (15,641) (2,504)
Purchase of intangible assets (12,553) (2,589)
Net proceeds from sale of non-current assets 1,475 585
Net proceeds from sale of assets held for sale 47,402 -
Interest received 72 -
Net Cash Flows used in Investing Activities (57,102) (155,274)
Proceeds from issue of shares - 424,926
Capital raising costs (45) (7,249)
Proceeds from borrowing 90,000 18,000
Repayment of borrowing (70,000) (176,000)
Principal payment for lease liabilities (2,533) -
Dividend paid (13,151) (7,753)
Share buy-back (8,500) -
Interest paid (7,524) 168
Net Cash Flows (Used in)/ Provided by Financing Activities (11,753) 252,092
Net increase/ (decrease) in cash held (25,284) 118,865
Cash at beginning of the period 39,189 21,443
Cash at the end of the period 13,905 140,308
Page 37ii. Development slides
Page 38Network capacity by state and function
BINGO’s network consists of centrally located transfer facilities and integrated recycling precincts for
advanced processing, separation and disposal
FY20 network capacity across NSW and VIC (million tonnes per annum) • Mortdale transfer facility was completed
in February and provides an additional
220k tonnes of annual capacity to the
Total Network Capacity: 4.6 mtpa
NSW network.
NSW: 4.0 mtpa VIC: 0.6 mtpa
• Patons Lane advanced recycling facility
operational from February 2020.
Transfer facilities • The Eastern Creek facility provides 2.0
0.35 • West million tonnes of capacity (FY19 utilised
attract and
Melbourne 1.3 mtpa).
aggregate volume
for processing and • MPC 2 at Eastern Creek will enable
recovery at BIN BINGO to fully utilise the 2.0 million
recycling facilities tonnes of capacity and increase
diversion from landfill.
0.3
2.0 • If approved, modification 6 at Eastern
• Mortdale 220k
Creek will enhance annual landfill
• Auburn capacity by >40%.
• Patons Lane • Patons Lane
0.9 • Approved operating hours extension to
0.9 • Eastern Creek • Eastern Creek
24 hours at West Melbourne Recycling
Facility will enable BINGO to increase
operational capacity and defer the need
Transfer Recycling Landfill for further capital to enhance recycling
capacity in the short term.
NSW VIC Additional capacity brought
on during the period
Page 39Patons Lane overview
Patons Lane, located in Western Sydney, opened in July 2019. Patons Lane will internalise BINGO
volumes and provide a future growth solution for increasing volume
Operational Overview
• Patons Lane opened in July 2019 after 15
months of construction. Advanced recycling
equipment operational from February 2020.
• EPL formally granted on 28 June 2019.
• Patons Lane was acquired in December 2017
as a greenfield asset.
• Total site throughput capacity of 450,000
tonnes per annum, of which the Recycling
Centre is approved to process up to 350,000
tonnes per annum.
• Approved landfill capacity of 4.3 million tonnes
and maximum operational life of 25 years.
• $40 million invested in the development of the
site.
Page 40Patons Lane advanced recycling facility
Full recycling plant was delayed to optimise design to complement Eastern Creek. Installation of
advanced recycling equipment was commissioned and operational from February 2020
Page 41Mortdale transfer facility
Construction of Mortdale transfer facility completed in February 2020 and provides 220,000 tonnes of
operational capacity to the BINGO NSW network
Page 42Eastern Creek MPC 2 development update
The development of Eastern Creek MPC 2 will provide additional recycling capacity and utilise the
headroom under the existing license capacity
Eastern Creek – MPC 2
Expected to be operational Late 1H FY21
• Bulk earthworks – 100% complete
• Inground Services – 30% complete
Activities commenced / completed
• Footings and ground slabs – 80% complete
• Plant ordered
• Structural steel framing • Solar panels
Key activities outstanding
• Roofing and cladding • Building Services (Mechanical / Hydraulic / Electrical / Fire)
• Plant installation
Page 43iii. Other
Page 44FY19 sustainability achievements
77% 188,297
tCO2-e ABATED
$13.4m 80%
REVENUE FROM FY19 ENGAGEMENT
Independently verified EMISSIONS RECYCLED SCORE
average recovery rate
from resource recovery PRODUCT SALES1
FEMALE
Best annual recovery rate of REPRESENTATION
29%
360kW 85% BINGO Board
SUPPLIER CODE OF
CONDUCT UNDER
DEVELOPMENT
OF SOLAR POWER
Installed at Auburn and
AT EASTERN CREEK
RECYCLING FACILITY
19% Supply chain mapping
and review underway
Mortdale recycling facilities Across senior management
BINGO’s waste education In FY19 BINGO
Climate risk related
reporting aligned with
program reached launched its 4 PINK
the
1,688 INAUGURAL
RECONCILIATION
In support of the McGrath
Foundation and the Cancer
TCFD FRAMEWORK
STUDENTS IN FY19 ACTION PLAN (RAP) Council
1. Represents FY19 revenue from recycled products. FY20 revenue from recycled products with a full year contribution of DADI, is expected to increase significantly. BINGO is targeting to expand its recycled
products to be 5% of Group Revenue over the medium term.
Page 45Responsible sourcing strategy
Our objectives Supply Chain Governance Roadmap
• Design a framework that supports BINGO’s
expectation and standards along with our PHASE 1
1
keys stakeholders expectations • Development of Responsible Sourcing
(customers, shareholders, our people). Strategy
• Supplier Code of Conduct developed and
• Engage with key business stakeholders to
released
better understand their expectations of • Modern Slavery mapping across supplier base
Bingo (internal staff, key suppliers, NGO’s).
• Support consolidation and streamlining of
customer data to better manage ESG risks.
• Improve our internal stakeholders
2
PHASE 2
awareness and skills so that they can • Supplier self-assessments for ESG
effectively manage the risks with their risks
suppliers. • Staff training and plan integration
• Modern Slavery statement released
• Build a system that addresses our
commitments to our stakeholders and most
importantly improves the way that our
suppliers operate.
• Risk management as Responsible
3
PHASE 3
Sourcing and Modern Slavery are listed on
• Business partners and due diligence
the Enterprise Risk Register as moderate
procedures
risks. • Key supplier audits
• Design a program that will ensure that we • Corrective action plans for suppliers
adhere to the Modern Slavery Compliance
requirements.
Page 46Diversity and inclusion
We are committed to implementing and supporting initiatives and processes to help facilitate equal
gender participation and opportunity in our business
Female % of workforce
Inclusion initiatives
30% • BINGO’s diversity and inclusion initiatives include:
29% – Increased flexibility in working arrangements for employees which
Board
14% includes increasing our part-time and casual workforce
17% – Launch of our first Indigenous Reconciliation Action Plan (RAP) to
support our indigenous employees and create opportunities for
30%
indigenous candidates and businesses
Executive 13%
Leadership Team – Inclusion and unconscious bias awareness training to all
11%
managers during FY20
14%
– Enhancement of talent acquisition processes to reduce
25% unconscious bias
Senior Management 21%
Team 19% Diversity snapshot
19%
12%
15% 40% 3.6% of
Gogetters
Company-wide
11%
GOgetters were born in a
country other than Australia
identify as 3.6%
11% Aboriginal
GOgetters have a and/or
Target Current FY19 FY18
reported 7% Torres
Strait
disability or
condition Islander
Page 47Launch of BINGO’s RAP
Page 48Headwinds and tailwinds for BINGO
Headwinds Tailwinds
• Residential market remains challenged less than 20% of BINGO’s • Continued economic and population growth – providing favourable
revenue is currently related to the residential market which has drivers for waste generation over the long term.
moderated in line with expectations in FY20. • Growing waste generation – BINGO is exposed to both cyclical and
defensive end-markets.
• Exposure to cyclical end-markets – Counter-cyclicality within
construction sub-markets will help offset this together with ongoing • Strong infrastructure investment– Federal and State Government
focus on growth in C&I. infrastructure funding $125 billion of committed government funding in
NSW and VIC ($70 bn in NSW and $50bn) over the next 4 years.
• Increased pricing pressure from competition in B&D collections. • Sustained overall construction activity – forecast to remain elevated
over the next five years.
• Higher regulatory compliance – higher cost of compliance for waste • Scope to build market share in Commercial & Industrial business –
infrastructure assets i.e. fire safety and EPA compliance BINGO currently has ~5%2 market in NSW andEvolution of B&D collections revenue across
construction end markets
In excess of 50% of combined BINGO and DADI B&D collections revenue is from diversified
construction and civil and infrastructure contractors, up from ~30% at IPO
BINGO B&D Collections Revenue by diversified end market
35%
• Greater proportion of
32% revenue from
30% diversified
construction due to
focus on expanding
% of B&D Collections Revenue
25% contracted revenue
with Tier 1 diversified
construction
20%
19% companies
15% 14% • The combined
exposure to pure
13% play residential
10% construction
9% customers is now
7% 13% (vs 21% at
5% 7%
FY18 and 24% at
IPO)
0%
FY17 % FY18 % Nov 18 % 1H FY19 % Combined BIN + DADI 1H FY20 %
Revenue Revenue Revenue Revenue FY19 % Revenue Revenue
Civil and infrastructure Diversified construction company
Residential Commercial construction
Commercial business Smaller projects & private businesses
Individuals
.
Note: BINGO’s estimated total residential exposure as a percentage of Group revenue is higher than shown in the chart above, as it accounts for residential exposure in smaller projects & private businesses, individuals
and diversified construction, as well as post-collections.
Page 50You can also read