BUILDING NORTH AMERICA'S LOW-COST MULTI-ASSET COPPER PRODUCER - January 2021 - Taseko Mines Limited
←
→
Page content transcription
If your browser does not render page correctly, please read the page content below
BUILDING NORTH AMERICA’S LOW-COST
MULTI-ASSET COPPER PRODUCER         January 2021
Disclaimer
 This presentation contains forward-looking statements and forward-looking information (collectively referred to as “forward-looking statements”) within the meaning of applicable Canadian securities legislation and the
 United States Private Securities Legislation Reform Act of 1995, Section 27A of the Securities Act and 21E of the U.S. Securities Exchange Act of 1934, as amended, which may not be based on historical fact,
 including without limitation, statements regarding our expectations in respect to future financial position, business strategy, future production, reserve potential, exploration drilling, exploitation activities, events or
 developments that we expect to take place in the future, projected costs and plans and objectives. All information contained in this presentation, other than statements of current and historical fact, is forward-looking
 information. Often, but not always, forward-looking information can be identified by the use of words such as “believes,” “may,” “plan,” “will,” “estimate,” “scheduled,” “continue,” “anticipates,” “intends,” “expects,” “aim”
 and similar expressions. All of the forward-looking information in this presentation is qualified by this cautionary note.

 All statements in this presentation, other than statements of historical facts, that address estimated mineral resource and reserve quantities, grades and contained metal, and possible future mining, exploration and
 development activities, are forward-looking statements. Although Taseko Mines Limited (“Taseko”) believes the expectations expressed in such forward-looking statements are based on reasonable assumptions, such
 statements should not be in any way construed as guarantees of future performance and actual results or developments may differ materially from those in the forward-looking statements. Factors that could cause
 actual results to differ materially from those in forward-looking statements include market prices for metals, the conclusions of detailed feasibility and technical analyses, lower than expected grades and quantities of
 resources, mining rates and recovery rates and the lack of availability of necessary capital, which may not be available to Taseko on terms acceptable to it or at all. Taseko is subject to the specific risks inherent in the
 mining business as well as general economic and business conditions. For more information on Taseko, investors should review Taseko’s annual Form 40-F filing with the United States Securities and Exchange
 Commission at www.sec.gov and its Canadian securities filings that are available at www.sedar.com.

 This presentation contains unaudited “non-IFRS” financial measures, including Adjusted EBITDA and net debt. The non-IFRS financial measures contained in this presentation are not measures of financial
 performance calculated in accordance with generally accepted accounting principles in the United States (“GAAP”) or international financial reporting standards (“IFRS”) and should not be considered as replacements
 or alternatives to net income or loss, cash flow from operations or other measures of operating performance or liquidity. Non-IFRS measures should be viewed in addition to, and not as substitute for, analysis of
 Taseko’s results reported in accordance with IFRS or otherwise. Notwithstanding these limitations, and in conjunction with other accounting and financial information available, Taseko’s management considers the
 non-IFRS financial measurers contained in this presentation to be reasonable indicators for comparisons between Taseko and Taseko’s principal competitors in the market. These non-IFRS measures are used by
 market participants for comparative analysis, albeit with certain limitations, of the results of businesses in the sector and as indicators of Taseko’s capacity to generate cash flow. Nevertheless, non-IFRS financial
 measures do not have any standardized meaning and therefore may not be comparable to similar measures presented by other companies.
 Adjusted EBITDA and net debt is a non-GAAP performance measure and is presented as a supplemental measure of the Company’s performance and ability to service debt. Adjusted EBITDA does not have any
 standardized meaning under IFRS and therefore may not be comparable to similar measures presented by other companies. Adjusted EBITDA is determined and presented on a consistent basis from period to period
 and a preliminary estimated range of Adjusted EBITDA for the year ended December 31, 2020 is included in this presentation. We have not yet finalized our operating or financial results for this period, and our actual
 financial results for the year ended December 31, 2020 remain subject to the completion of our quarter-end and year–end closing process, which includes review by management and our audit committee. While
 carrying out such procedures, we may identify items that would require us to make adjustments to this preliminary estimated range of Adjusted EBITDA set forth herein. As a result, our actual Adjusted EBITDA could
 be outside of the ranges set forth herein and such differences could be material. Additionally, our estimate of Adjusted EBITDA is a forward-looking statement based solely on information available to us as of the date
 of this presentation and may differ materially from our actual operating and financial results as a result of developments that occur after the date of this press presentation. Therefore, you should not place undue
 reliance on the preliminary estimate of our Adjusted EBITDA. The preliminary estimates of our Adjusted EBITDA have been prepared by, and are the responsibility of, our management. Our independent registered
 public accountants have not audited, reviewed or performed any procedures with respect to such preliminary estimates of our operating results. Accordingly, KPMG LLP expresses no opinion or any other form of
 assurance with respect thereto. The information presented herein should not be considered a substitute for the financial information to be filed with the SEC in our Annual Report on Form 40-F for the year ended
 December 31, 2020 once it becomes available. A reconciliation of Adjusted EBITDA to net income and debt to net debt for the nine months ended September 30, 2020 and previous years can be found on slide 29 of
 this presentation.

                                                                                                                                                                                                                                    2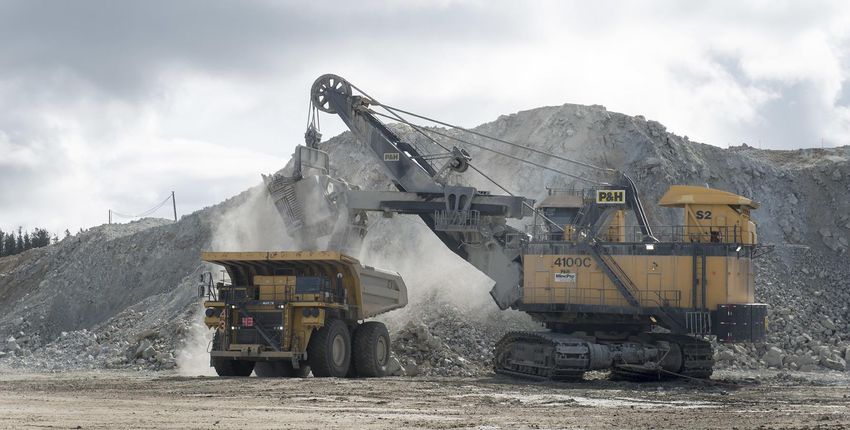
Presenting Management Team

                                Stuart McDonald                                    Bryce Hamming                                     Brian Bergot
                               President                                          CFO                                                Vice President, IR
                               CPA                                                CFA, CPA

                                                        Mr. Hamming is a financial executive with over
    Mr. McDonald is a mining executive with 25          20 years experience in corporate finance,         Mr. Bergot was appointed Vice President,
    years of experience in mining, financial,           corporate development, treasury, tax and          Investor Relations in March 2014 and has nearly
    corporate development and management roles.         financial reporting oversight. He joined Taseko   30 years of experience in the natural resources
    He joined Taseko as CFO in 2013 and was             in 2018 and was appointed Chief Financial         sector. Brian joined Taseko in 2006 and has held
    appointed President in June 2019. Prior to this,    Officer in June 2019. He was most recently a      roles in both IR and Marketing & Logistics. Prior
    he held a number of senior roles including CFO of   financial adviser to Seaspan Corporation on       to his career in mining, he was at Methanex
    Quadra FNX Mining, CFO of Yukon Zinc.               various business development and corporate        Corporation, with a number of corporate and
                                                        finance initiatives, including high yield bond    operational roles including IR and marketing &
                                                        alternatives. Prior capital markets experience    logistics.
                                                        within the bond origination department of RBS.

                                                                                                                                                              3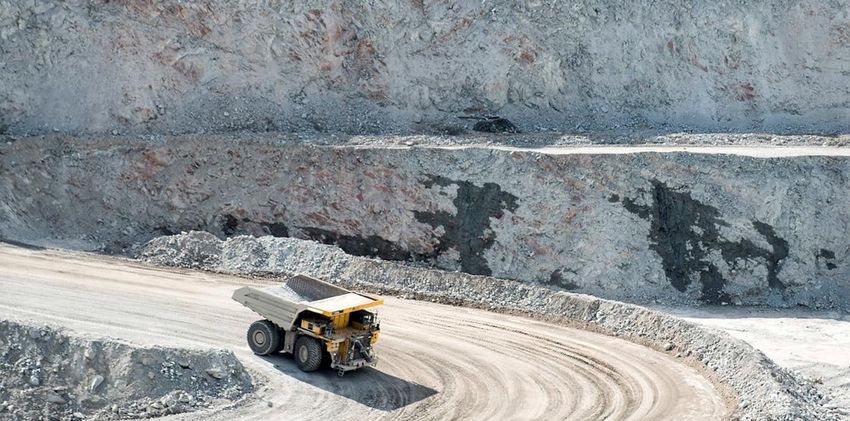
Taseko Overview
    Taseko is a BC incorporated company, headquartered in Vancouver, Canada
                                                                                                                                                                                                                                                  C      A     N      A      D   A
               Incorporated in 1966, publicly traded on the TSX, NYSE American and LSE                                                                                                                                         B R I T I S H
                                                                                                                                                                                                                              C O L U M B I A

                                                                                                                       Net Debt3                                     US$223M                                                                                      GIBRALTAR

                                                                                                                       Market Capitalization2                        US$412M
                                                                                                                                                                                                                                                               YELLOWHEAD
                                                                                                                       Enterprise Value2,3                           US$635M
                                                                                                                       Cash3                                           US$67M                                                                                         ALEY

                                                                                                                       Total Debt3                                   US$290M
                                                                                                                                                                                                                                                             NEW PROSPERITY
                                                                                                                       LTM Adj.     EBITDA3                            US$80M
                                                                                                                       EV / LTM Adj. EBITDA3                                 7.9x                                                                                  HARMONY

                                                                                                                       Total-Debt to Adj. EBITDA3                            3.6x
                                                                                                                       Net-Debt to Adj.      EBITDA3                         2.8x

                                                                                                            Yellowhead
                Gibraltar Mines                             Florence Copper
                     Ltd.                                         Inc.                                                                                                                                                                                  U     S       A
                                                                                                                 Aley

                                                                                                                New
                                                                                                             Prosperity
                    75%1                                        100%                                                                                                                                                                                  A R I Z O N A

                     Gibraltar                                    Florence                                                                                                                                                                                   FLORENCE COPPER
                                                                                                              Harmony
                       Mine                                        Project
                                                                                                                                                                                                                         Producing
                                                                                                                                                                                                                         Near Term
                                                                                                                                                                                                                         Development

Source: Company filings, Bank of Canada for CADUSD FX rates, Factset for market data
(1) JV partner Cariboo Copper, which is owned jointly by Sojitz, Furukawa and DOWA Metals & Mining. (2) Market capitalization as at Jan. 8, 2021 sourced from Factset. (3) Cash shown as at Dec 31 2020, debt and LTM EBITDA shown as at Sept. 30, 2020. CADUSD FX rate of           4
1.27 (Dec 31, 2020) for cash, 1.33 (Sept 30, 2020) for debt, and 1.35 (LTM daily avg. as of Sept 30, 2020) for LTM EBITDA.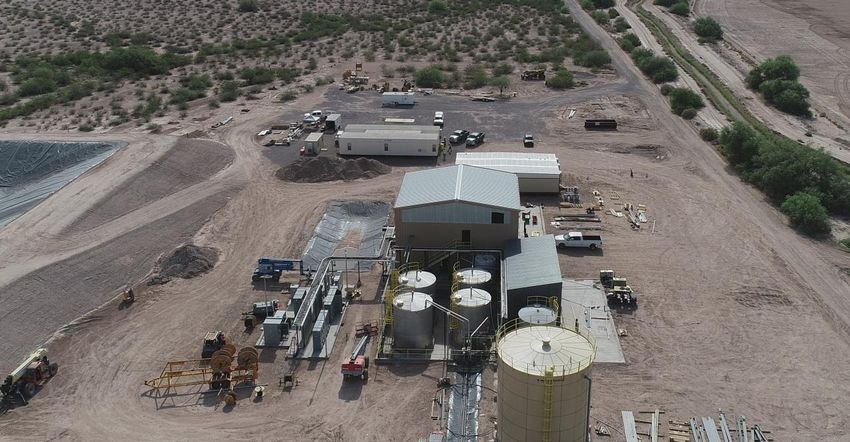
Copper Price Outlook
Cu Prices (US$/lb) – Historical and Forward Curve1
Copper prices declined in H1 2020 due to COVID-19 but have $3.75
since rebounded to multi-year highs; all time highs denominated $3.67 $3.67 $3.68
$3.50 $3.67 $3.66
in C$
$3.25
Favourable long-term supply-demand dynamics
$3.00
❖ Maturing global supply base and lack of project pipeline, Spot Copper:
$2.75
with projects having long lead times $3.69/lb
$2.50
❖ Supply disruptions driven by impact of COVID-19 and
$2.25
political turmoil
Forward Curve
$2.00
❖ Broad based use throughout the economy and 2017 2018 2019 2020
2020
2020 2021E 2022E 2023E 2024E 2025E
supportive demand dynamics from electric vehicles Demand Expected to Grow Production and Primary Demand
(million metric tonnes)2 (million metric tonnes)2
❖ Significant increase in demand from emerging markets;
Demand
with lack of incremental supply to bridge the gap 34 31.0Mt
❖ Higher incentive prices required in order to construct 5.2%
Demand
21.0Mt
24
marginal development projects RoW
CAGR
❖ Copper alloys are a commonly evaluated option for
China 0.8% Production
antimicrobial surfaces due to its ability to kill 99.9% of 20.9Mt
Production
15.2Mt
disease-causing bacteria within two hours OECD 0.6%
2019 2040 2019 2040
Forward curve in contango, with elevated levels through 2025
Growth Outside of OECD / Carbon Reduction Increasing demand for copper with
Initiatives Expected to Support Consumption constraints on supply due to depletion
(1) Historical copper prices sourced from Factset and copper forward curve sourced from Bloomberg as of January 8, 2021. (2) Sourced from Wood Mackenzie. Production includes both base production capacity and probable projects.
5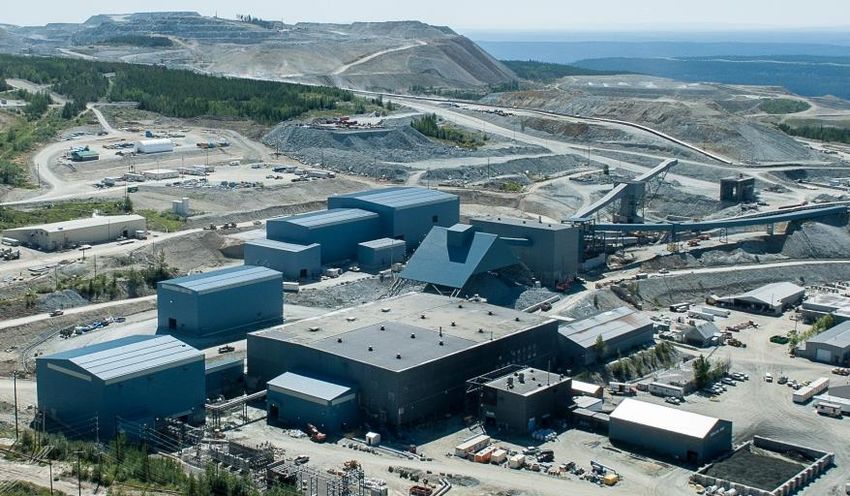
Taseko Investment Highlights
  Building a multi-asset copper producer in the world’s top mining jurisdictions
         Gibraltar is a Large-Scale Copper Mine with Proven Through-the-Cycle Sustainability
         •   2nd largest open pit copper mine in Canada with a remaining mine life of 18 years
         •   Continuously operated since 2004 and through multiple cycles                                                                                                                                      Gibraltar (100% basis)
         •   Significant cash flow generation at spot copper prices of $3.69/lb                                                                                                     LoM Annual Copper Production (Mlbs)6                                           136
         Florence is a Near-Term, High Return Copper Project                                                                                                                        Recoverable Reserves (Blbs)                                                    2.5
         •   Anticipate receiving final permit during first half of 2021 and commence construction thereafter
         •   Green source of US domestic mined copper due to its low impact in-situ copper recovery mining methods and SXEW                                                         LTM C1 Cash Costs (US$/lb)2                                                   $1.77
             plant at site
         •   Prudent funding plan for US$230M project costs, potentially including the sale of a minority interest, royalty, project                                                Mine Life (years)                                                              18
             finance or corporate debt, excess cash and cash flow from Gibraltar and if required, a corporate equity issuance
         Commitment to Strong Environmental, Social and Governance Performance                                                                                                                                 Florence (100% basis)
         •   Industry leader with many awards for Health & Safety and Environmental performance
         •   Effective Corporate Governance Policy and Indigenous Peoples Policy
                                                                                                                                                                                    LoM Annual Copper Production (Mlbs)6                                           85
         Strong Copper Fundamentals                                                                                                                                                 Recoverable Copper Reserves (Blbs)                                             1.7
         •   Copper prices at a multi-year high and continuing to exhibit strong supply & demand fundamentals
                                                                                                                                                                                    LoM C1 Cash Costs (US$/lb)                                                    $0.90
         •   Supply constrained by depleting reserves, declining grades, long lead time to development and COVID-19 supply
             impacts                                                                                                                                                                Mine Life (years)                                                              21
         •   Increased growth from the electric vehicle market and green infrastructure
         Proven Team of Mine Builders and Operators                                                                                                                                 Attributable Gibraltar (75% basis) + Florence (100% basis)
         •   Operating and Engineering Team with decades of relevant experience
                                                                                                                                                                                    LoM Annual Copper Production (Mlbs)6                                           187
         Attractive Jurisdictions
         •   British Columbia (AAA1) and Arizona (AA1) are attractive mining jurisdictions, scoring 77/100 and 82/100 respectively                                                  Recoverable Copper Reserves (Blbs)                                             3.6
             on the Fraser institute’s Investment Attractiveness Index3; both falling within the first quartile
         •   Assets located in close proximity to existing infrastructure and labor force                                                                                           C1 Cash Costs (US$/lb)                                                        $1.375

         Conservative Financial Profile
         •   US$67M cash on hand as at December 31, 20204
         •   Active price protection and risk management strategy to protect against a downturn in the copper price

(1) Credit rating per S&P Global. (2) LTM cash costs as of Q3 2020. (3) Based on the 2019 Fraser Institute Annual Survey of Mining Companies. (4) Cash shown as at Dec 31 2020 and reflects a CADUSD FX rate of 1.27 (Dec 31, 2020) as per the Bank of Canada’s
published CADUSD FX rate. (5) Reflects 75% of Gibraltar using LoM production and LTM Q3 C1 Cash Costs and 100% of Florence using LoM production and C1 Cash Costs. (6) LoM refers to “Life of Mine”.                                                                       6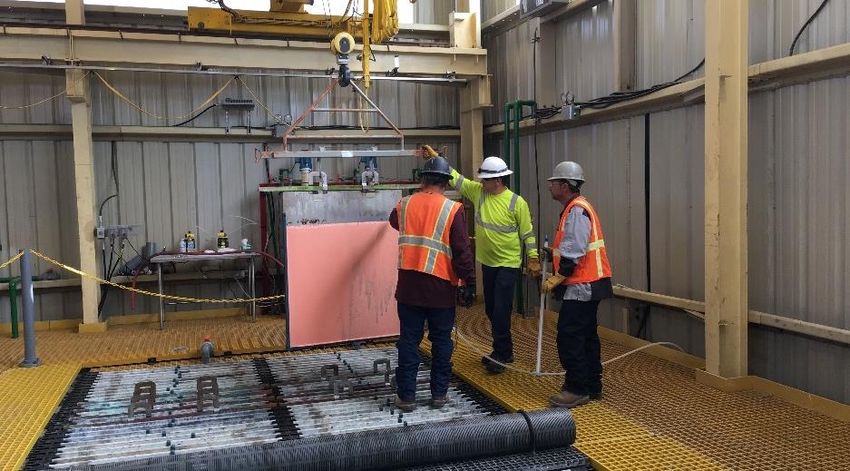
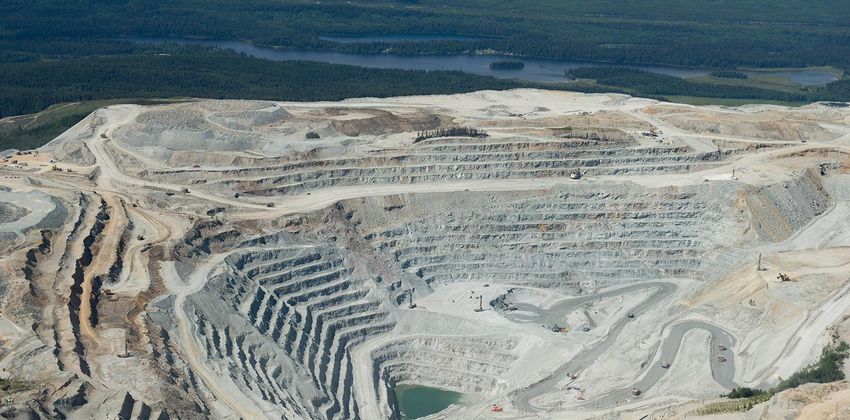
Gibraltar Copper Mine – British Columbia

A foundation of
stable cashflow                            MINE TYPE
                                            Open Pit – Copper/Moly

                                           STAGE
                                           Producing

                                           PRODUCTION (LoM)
                                           136Mlbs (~60kt Cu)

                                           CASH COSTS
                                           US$1.77/lb LTM

                                           Mine Life
                                           18 Years

                                           Replacement Value
                                           +US$1 billion1
                                           1.   Calculated using US$15,000 / ton capacity
                                                multiplied by capacity of 85,000 tons.

                                                                                    7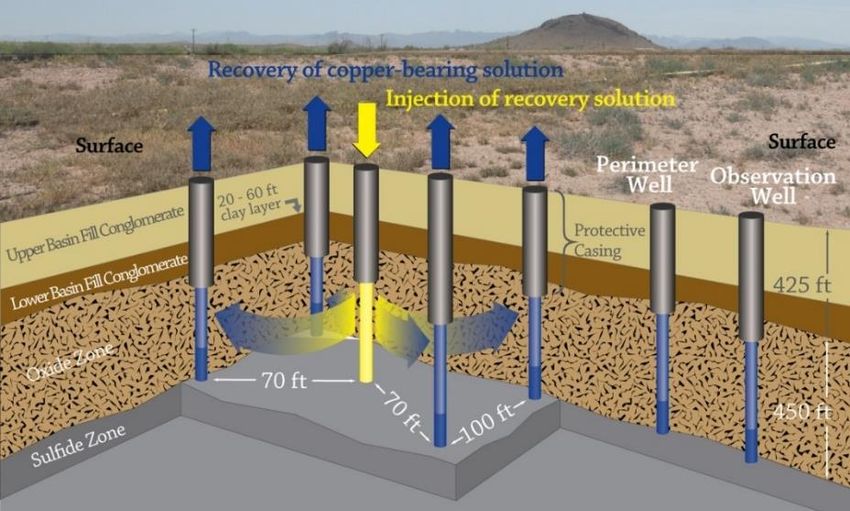
Gibraltar Copper Mine
Large-Scale, Steady-State Mine
 Value Creation
    Acquired Gibraltar in 1999 for $1

    Restarted the mine in 2005

    Between 2006 and 2013, invested US$640 million1 to expand and
    modernize the mine to 85,000 tons per day

    In 2010, sold 25% of the mine for US$176 million2 to a Japanese
    consortium (Sojitz, Dowa & Furukawa)

    Operating steady-state at expanded capacity since 2014
    Current NPV8 after-tax estimated at US$600 million3 (75% basis)
                                                                                                                                                                              Gibraltar Copper Production Statistics
    Gibraltar is a foundation of stable cash flow for the Company throughout                                                                                                            (Mlbs, 100% basis)
    the copper price cycle                                                                                                                                                                                        Post Expansion
                                                                                                                                        150               Modernization & Expansion Period
    Produced US$720 million4 of operating cash flow since re-start in 2005
                                                                                                                                        125

    One of the industry leaders in Health & Safety and Environmental:                                                                   100

    ❖ John Ash Award for 2016, 2017 and 2018 (1M hours worked with lowest injury                                                          75
      frequency rate in BC)
                                                                                                                                          50
    ❖ MABC and the Province of BC Mining & Sustainability Award
                                                                                                                                          25
    ❖ September 2020 - Jake McDonald Annual Award for Metal Mine Reclamation
      from the British Columbia Technical and Research Committee on Reclamation                                                            0
                                                                                                                                                2006    2007   2008    2009    2010    2011    2012   2013    2014    2015    2016   2017    2018    2019    2020

  Source: Technical Report on the Mineral Reserve Update at the Gibraltar Mine, November 2019.
  (1) Based on C$800M at an assumed CADUSD FX rate of 1.25. (2) Based on C$187M at a 1.06 CADUSD FX as at Nov. 30, 2009 (announcement date). (3) Gibraltar NPV (75% basis) using an 8% discount rate and long term copper price of US$3.10/lb, of C$750M per 2019   8
  43-101 converted to USD using the technical report exchange rate of 1.25 CAD:USD. (4) Based on C$900M at an assumed CADUSD FX rate of 1.25.
2020 Operations / COVID-19
Demonstrates Taseko’s operational flexibility and ability to adapt
In March 2020 Taseko began implementing Health & Safety and                             Gibraltar Copper Production and Costs
Operational changes to respond to COVID-19                                                         (Mlbs, 100% basis)

                                                                                                                                         $3.25
  Gibraltar has not experienced any shut downs                                                                         $2.96
                                                                                      $2.55
  New procedures are in place to mitigate risk of COVID-19 impacting                                  $2.43
  our employees and operations                                                                                         $2.00
                                                                                      $1.82

  In response to lower copper prices during the first half of 2020,                                   $1.34
  Gibraltar’s short-term mine plan was modified, allowing it to operate at                       37
  reduced operating costs, without impacting copper production                   32
                                                                                                                  29
  Additionally, many input costs (i.e. diesel) were declining in addition to                                                        25
  treatment and refining charges (“TC/RC”)

  While evaluating short-term mine plan options, longer-term
  opportunities were discovered by changing pit development
  sequencing

           ❖ Maintain copper production levels

           ❖ Reduce operating costs and defer certain capital projects         Q1 20           Q2 20             Q3 20            Q4 20
                                                                               Cu Production   Avg. Cu Price (US$/lb)    C1 Costs (US$/lb)

  Source: Company filings and FactSet used for average Q4 2020 copper price.
                                                                                                                                                 9
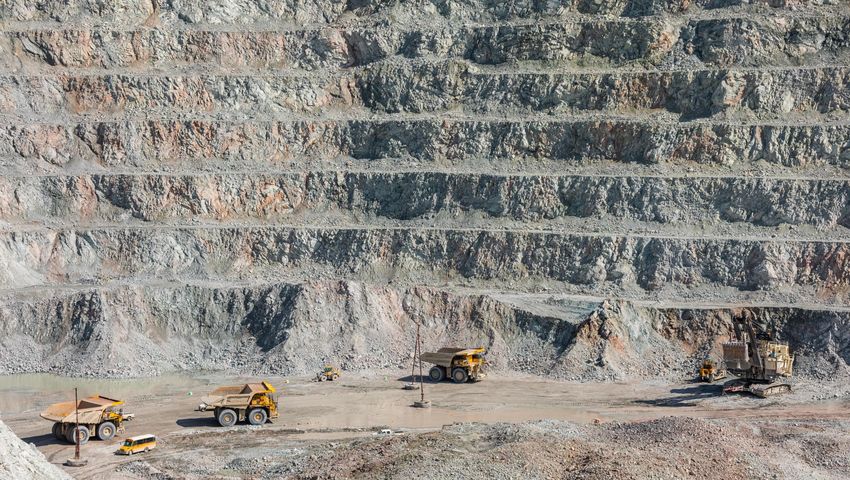
Gibraltar Copper Mine
One of the Americas most efficient open pit copper mines
   On a cost per tonne milled basis, Gibraltar is one of the                                                                                     Lowest Cost Open Pit Copper Mines in the Americas (US$/t milled) 1
   lowest cost operations in the world. This is achieved by:
                                                                                                                                            Chapada                                  $5.8/t
   ❖ A skilled and efficient workforce                                                                                                   Constancia                                         $7.4/t
                                                                                                                                            Gibraltar                                           $8.3/t
   ❖ Low cost, reliable hydro power
                                                                                                                                     Mount Milligan                                              $8.4/t

   ❖ Modern infrastructure (rail, highway, etc.)                                                                                                Butte                                            $8.5/t
                                                                                                                                             Mission                                               $8.8/t
   ❖ ~80% of operating costs C$ denominated, a natural                                                                                     Andacollo                                               $8.8/t
     hedge against US$ metal price volatility                                                                                                Mirador                                                 $9.1/t
                                                                                                                                        Pinto Valley                                                 $9.3/t
                                                                                                                                           Robinson                                                      $9.9/t
                                                                                                                                          Rosemont                                                        $10.1/t
                                                                                                                                              Sierrita                                                      $10.5/t
                                                                                                                                 Copper Mountain                                                            $10.6/t
                                                                                                                                             Bagdad                                                           $10.9/t
                                                                                                                                          Red Chris                                                               $11.5/t
                                                                                                                                         Mina Justa                                                               $11.7/t
                                                                                                                                            Sossego                                                                 $12.1/t
                                                                                                                                                 QB2                                                                  $12.6/t
                                                                                                                                            Salvador                                                                          $14.2/t
                                                                                                                                                  Ray                                                                                         $17.7/t
                                                                                                                                         El Soldado                                                                                                     $22.2/t
                                                                                                                                   Mantos Blancos                                                                                                                 $25.5/t

Source: WoodMac;.based on Q3 2020 copper mines costs benchmarking dataset.
1. Reflects 2022 mining and milling costs on a US$ per tonne milled basis, per WoodMac’s costing methodology. Includes operating open pit copper mines with mill processing located in the Americas with 2022 production of 50-250 Mlbs Cu.
                                                                                                                                                                                                                                                                       10
Florence Copper Project - Arizona
MINE TYPE
Pathway to a In-situ Leach
STAGE
low-cost future Development
PROCESSING
SX/EW
PRODUCTION
85Mlb (~40kt) Cu / year
ESTIMATED CASH COSTS
US$0.90/lb LOM
Mine Life
21 Years
11Florence Copper Project
A near term, low cost copper project
Location Central Arizona near the town of Florence
Project Highlights
Ownership 100%
Over US$135 million was spent on the project by former owners (Conoco, Magma
Copper, BHP Copper) 345 million tons grading 0.36% TCu (at a 0.05% total
Mineral Reserves1 copper cutoff) containing 1.7 billion pounds (730 kt) of
Taseko has invested a further US$80M since 2014, including $25M to build the recoverable copper
PTF
All major power, transportation, road and rail infrastructure are in place Mine Type In-situ copper recovery
Once complete, Florence will be one of the greenest sources of copper in the US Mine Life1 21 years
Being developed in two stages
❖ Phase 1: Development and operation of the PTF – Completed
❖ Phase 2: Construction of the commercial SXEW plant and wellfield –
commencing 2021
Project Economics1
43-101 Technical Report details:
❖ A 21 year mine life
❖ Annual production capacity of 85 million pounds (~40kt)
❖ Estimated US$230M of capital costs2
❖ After-tax NPV(7.5%) of US$680 million
❖ IRR of 37% and a 2.5 year payback
❖ LOM C1 Cash Costs of US$0.90/lb
(1) Based on the Florence 43-101 Technical Report with an effective date of January 16, 2017. (2) Includes reclamation bonding and working capital requirements.
12In-Situ Copper Recovery (“ISCR”)
How does in-situ copper recovery work?
Injection and recovery wells are drilled deep into the bedrock
#1 where the oxide copper ore is situated
Wells are concrete encased and sealed to protect water
#2 quality
Highly diluted acid (99.5% water, 0.5% acid) is pumped under
#3 low pressure through the injection wells to dissolve the copper
within the oxide zone
Copper rich solution is then pumped to surface through
#4 recovery wells for processing into pure copper cathode sheets
Perimeter and observation wells are monitored continuously
#5 to ensure hydraulic control of fluids is maintained at all times
and water quality is protected
13Environmental Advantages of In-Situ Copper Recovery
ISCR - a green production method for the green metal of the future
Illustrative Environmental Advantages of Florence ISCR Project1
Small Environmental Footprint
Conventional Open Pit Mine
Florence ISCR
Numerous Site Redevelopment
41
Opportunities
Lower Energy Requirement Than
Conventional Mining ~14x
Lower
~3x
Limited Land Disturbance Lower ~6x
7 6 Lower
2 3
1
Low Dust Emissions Energy Consumption Fresh Water Use Carbon Emissions
(kWh / lb Cu) (gal / lb Cu) (kg CO2 / lb Cu)
(1) Energy consumption and Carbon emissions calculations and methodology sourced from B.C. Best Practice Methodology for Quantifying Greenhouse Gas Emissions. Florence fresh water usage per the pre-feasibility study compared to
fresh water usage from hydrometallurgical processes at Arizona sites per the USGS Estimated Water Requirements for the Conventional Flotation of Copper Ores. 14Florence Copper Project
A defined path to production
2017 2018 2019 2020 2021 2022
Technical work results in PTF development First cathode produced Completed PTF Aiming to complete First production from
significant improvement in and construction starts in April 2019 production phase permitting in H1 2021 commercial facility
project economics (~US$25M) Aquifer Protection Project financing
Permitting process for
All necessary state and Wellfield & SX/EW plant commercial scale Permit issued in
Construction
federal permits issued to commissioned in Q3, production begins December
build and operate the PTF operations commenced
in Q4
Production Test Facility
The PTF consists of a wellfield and SX/EW plant
❖ 24 wells: 4 injection wells, 9 recovery wells, and 11 groundwater monitoring-
related wells
Operation of the PTF has proven the ability to control the movement of fluid within
the oxidized zone and also provided valuable information for the operation of the full-
scale commercial production facility
Results confirmed technical parameters from previous bench-scale study, including:
initial leach periods, sweep efficiencies, hydraulic control of solutions
Main recovery well produced LME Grade A copper cathode for 18 months
Main recovery well achieved a rate of +1,100,000 lbs/year First Cathode Harvest (24 April 2019)
15Florence Copper Project
Capital efficient, high return growth project
Cu Price Pre-Tax NPV Pre-Tax
Sensitivity
(US$/lb) (US$M) IRR
Value Creation -15% $2.55 $606 33%
-10% $2.70 $709 37%
In 2014, Taseko acquired Florence Copper for US$73M1 and invested -5% $2.85 $812 40%
US$80M in the project to date, including US$25M for construction of the Model $3.00 $916 44%
PTF
+5% $3.15 $1,019 48%
Florence is one of the least capital intensive copper projects in the +10% $3.30 $1,122 51%
world
+15% $3.45 $1,225 54%
❖ Commercial facility estimated to cost US$230M2 7
Capex Intensity (Initial capex / Production capacity)
❖ Capital intensity of $5,965 per tonne capacity3 $30,000
$25,000
Project after-tax NPV(7.5%) estimated at US$680M4 $20,000
$15,000
US$1.90/lb5 margin (at US$3.00/lb Cu) with 85Mlbs of annual
$10,000
production (LoM Avg.)
$5,000
$0
Cash flow upside to copper price – US$0.20/lb increase in copper price
equates to a ~US$17M6 increase in cash flow
High margin / low cost of Florence will diversify Taseko’s production risk
and make it a more resilient credit during periods of low copper prices
Source: Company Filings, WoodMac;.based on Q3 2020 copper mines projects dataset.
(1) CA$80M converted to US$73M based on a 1.10 exchange rate (i.e. the exchange rate on the announcement date, September 8, 2014). (2) Includes reclamation bonding and working capital requirements. (3) US$230M project capital (including reclamation bonding and working capital requirements) divided by 85M
pounds of capacity; converted to tonnes using 2204.623 lbs/t (4) Based on the Florence 43-101 Technical Report with an effective date of January 16, 2017. (5) Based on LoM total cash costs of US$1.10/lb inclusive of royalties. (6) Calculated assuming US$0.20/lb multiplied by capacity of 85Mlbs. (7) Per WoodMac. 16
Includes projects located in USA, Canada, and Mexico, with a potential start year of 2021 onwards.Florence Copper Project
Prudent funding plan
Illustrative Financing Plan (US$M)
As 100% owner, Taseko has a number of options
available to fund the commercial operation of Florence
Options include excess cash and cash flow from
$1,280 2
Gibraltar, sale of a joint venture interest in Florence,
royalty, corporate or project level debt or Taseko equity
❖ US$67M cash on hand as at Dec 31, 2020
$600 2
Gibraltar (75%)
Florence’s low capital requirements relative to it’s NPV
makes potentially selling a minority stake to a joint
$635
venture partner an attractive option to significantly
reduce Taseko’s remaining capital requirements
Market Cap
$412M 2
1 $680
$230 $80M - $130M Florence (100%)
$100M - $150M
Net Debt
$223M
Taseko Enterprise Florence Capital Project Equity Debt Financing Combined Asset
Value Requirements Excess Cash Project Debt NPVs
Excess Cash Flow Corporate Debt
Royalty
Joint Venture
Equity Raise
Source: Company Filings, Factset as at January 8, 2020.
(1) Includes reclamation bonding and working capital requirements. (2) Gibraltar NPV (75% basis) using an 8% discount rate and long term copper price of US$3.10/lb, of C$750M per 2019 43-101 converted to USD using the technical report exchange rate of 1.25 CAD:USD, 17
plus Florence NPV (100% basis) using a 7.5% discount rate and long term copper price of US$3.00/lb.Taseko Mines
Conservative
Financial Policies
18Resilient Through Copper Price Downturns
Positive operating cash flow generation through the cycle
Taseko has been able to maintain positive operating cash flow $200 $4.50
throughout extended periods of weak copper prices through
stringent cost management practices and adjustments to mine
plan $160 $3.60
Taseko also benefits from a natural hedge4 as many input costs
are correlated with the copper price (i.e. Oil, shipping rates,
C$:US$ exchange rate) $120 $2.70
Cash flow highly sensitive to copper price – US$0.25/lb increase
in copper price equates to a ~US$25M5 increase in cash flow $80 $1.80
Current Operations
❖ In Q2 & Q3 2020 (since new plan) average cash cost of US$1.67/lb $40 $0.90
❖ 2020 Adjusted EBITDA of ~US$78-82M6
❖ 2020 copper production of 123Mlbs and 2.3Mlbs of molybdenum
$0 $0.00
❖ 2021 copper production guidance of 125Mlbs6 2010 2011 2012 2013 2014 2015 2016 2017 2018 2019 2020
1 1 LTM Q3*
❖ Mine operating to new plan with expected cost savings being achieved Adj. EBITDA ($M)
Copper Price ² ($/lb)
OCF ($M)
Total Operating Cost ($/lb)
3
*LTM average price, operating cost, adj. EBITDA & OCF
(1) Annual figures converted as per Bank of Canada annual average CADUSD exchange rate – 1.03 (2010), 0.99 (2011), 1.00 (2012), 1.03 (2013), 1.10 (2014), 1.28 (2015), 1.32 (2016), 1.30 (2017), 1.30 (2018), 1.33 (2019) and 1.35 (LTM as of September 30, 2020). (2) Annual
average LME copper price as per company filings; 2020 based on LTM average as per quarterly filings. (3) LTM Q3 2020 operating cost based on weighted average of quarterly operating cost and production. (4) Natural hedge through correlation between the copper price and key 19
input costs such as oil, shipping rates and C$:US$ exchange rate (5) Calculated assuming US$0.25/lb multiplied by attributable production of 100Mlbs. (6) Per flash guidance of 125Mlbs for 2021 copper production and 2020 Adjusted EBITDA of C$105 – C$110M released on Jan 11,
2021.Improved Credit Profile
Substantial improvement in leverage metrics on the back of higher copper prices, Gibraltar mine plan
optimization and enhanced liquidity
Operational Improvement
Taseko maintains reasonable leverage levels and balances LTM Adjusted EBITDA (US$M)1
capital needs through a combination of debt, equity and
internally generated cash flow
2
$79 $82
Significant improvement in Net Debt / LTM EBITDA metrics $76
$61
over previous three quarters on the back of multi-year high $38 $35
$78
copper prices and operational execution at Gibraltar
Credit metrics further improved in November on the back of a 2018 2019 Q1 2020 Q2 2020 Q3 2020 Q4 2020
~US$29M equity raise
Net Debt / LTM Adjusted EBITDA (x)
Cash on hand of US$67M expected to fund short and medium
term capital needs 7.6x
6.3x
3.9x
3.2x 2.9x 2.8x
0.1x
2.7x
2018 2019 Q1 2020 Q2 2020 Q3 2020 Q4 2020
(1) Adjusted EBITDA converted to US$ based on annual average for 2018 and 2019, and LTM average for each quarter – 1.30 (2018), 1.33 (2019), 1.33 (Q1 2020), 1.34 (Q2 2020), 1.35 (Q3 2020) and 1.34 (Q4 2020). (2) Per 2020 flash guidance of C$105 – C$110M converted as
per Bank of Canada annual average CADUSD exchange rate 1.34. 20Financial Strategy
Cash Flow Positive Throughout the Cycle
❖ Ability to control costs and take operational measures during periods of depressed copper prices
❖ Positive operating cash flow in each year since 2010
Strong Financial Liquidity
❖ Cash on hand of US$67M
❖ Equity issuance in November improved liquidity
Prudent Use of Free Cash Flow
❖ Future free cash flow to be allocated towards growth projects, general corporate purposes and debt reduction
Active Price Protection Program
❖ Significant copper price protection program in place since 2009; implemented by purchasing copper price put contracts
❖ Natural hedge through correlation between the copper price and key input costs such as oil, shipping rates and C$:US$ exchange rate
Conservative Capital Funding
❖ Strategy of evaluating a broad range of alternatives to fund capital expenditures
❖ History of funding with equity offerings, minority stake sales, off-take financing and precious metal streams
21Proactively Reducing Impact of Cu Price Volatility
Hedging policy in place to reduce the short term impact of a decline in the price of copper
Defensive Hedging Strategy Historical Copper Hedging and Cu Production (Mlbs)
Taseko’s hedging strategy is designed to secure a minimum
price for a significant portion of their near term production
through the purchase of copper put options
❖ Active hedging strategy in place since 2009 107 106
100
❖ Maintains exposure to increases in the price of copper 94 94 92 94
1
❖ Put options maturing over the first half of 2021:
75
❖ 7.5Mlbs at US$2.80/lb for Q1 65
60 60 60
❖ 30Mlbs at US$3.20/lb for H1 48
Additionally, ~80% of Gibraltar operating costs are C$ 382
denominated, providing a natural hedge3 against US$ metal
price volatility H1
2015 2016 2017 2018 2019 2020 2021E
Cu Put Options Attributable Cu Production
(1) 75% of full year 2021 guidance of 125Mlbs. (2) Reflects options expiring over the first half of 2021. (3) Natural hedge through correlation between the copper price and key input costs such as oil, shipping rates and C$:US$ exchange rate
22A Proven Team of Mine Builders and Value Creators
Senior Management
Russell Hallbauer Stuart McDonald Bryce Hamming
CEO & Director President CFO
P.Eng CPA CFA, CPA
Board
Professional engineer with 35 years’ Mining executive with 25 years of experience in Joined in 2018, with over 20 years experience in
experience, a strong background in open-pit mining, financial, corporate development and corporate finance, corporate development, Ron Thiessen (Chair)
and underground mining. Prior to joining management roles. He joined Taseko as CFO in treasury, tax and financial reporting oversight.
Taseko in 2005, Mr. Hallbauer was a Senior 2013 and was appointed President in June Most recently a financial adviser to Seaspan Russell Hallbauer
Mining Executive at Teck Cominco Ltd. where 2019. Prior to this, he held a number of senior Corp., with prior roles as CFO of Northcliff
he oversaw the Highland Valley Copper mine in roles including CFO of Quadra FNX Mining, Resources, Ernst & Young LLP’s mining Anu Dhir
central BC and was Chairman of the Joint CFO of Yukon Zinc. transaction advisory group and RBS’ DCM
Venture Compañía Minera Antamina in Peru. team.
Robert Dickinson
Peter Mitchell
Experienced Operating Team Kenneth Pickering
John McManus Rob Rotzinger Richard Tremblay
COO Vice President, Vice President,
P.Eng Capital Projects Operations
P.Eng P.Eng
Professional engineer who has worked in the Professional Engineer who has been employed Professional engineer who joined Taseko as
BC mining industry for over 30 years with with Taseko and predecessor companies for the General Manger, Gibraltar in July 2014. An
extensive experience in mine operation, mine past 18 years in various capacities. He has experienced senior level executive with over 30
engineering and environmental management. been a key participant in the Company’s $800 years in the mining industry who has a strong
Prior to joining Taseko in 2005 he held positions million capital investment program over the last operations background in Open Pit Mining as
as General Manager, Coal Mountain Operations five years, with his most recent role overseeing well as mineral Processing. Prior to joining
at Elk Valley Coal, Mine Manager at Teck the Gibraltar Development Plan 3, a $325 Taseko he held several operational roles with
Cominco’s Bullmoose operation. million project. Teck over 20 years.
23Building a Sustainable Business
Copper is itself a sustainable material, like our company
Published first ESG Report, titled Our Contribution to Sustainability, in May 2020
Employees Governance
Health & Safety Policy ❖ Corporate Governance Policy
❖ Commitment to diversified workforce ❖ Director Independence Standards
Highlights ❖ Code of Ethics and Trading Restrictions
❖ John Ash Award for 2014, 2015, 2016, and 2018 (1 million ❖ Disclosure Controls and Procedures
hours with lowest injury-free rate in BC)
❖ Say on Pay Policy
❖ Gibraltar is a unionized workforce with no history of strikes
❖ Related Party Investment Protocol
Environment ❖ Whistleblower hotline
❖ Comprehensive Environmental Policy
❖ Long-term Water Management Plan Community
❖ Responsible Tailings Management
❖ Indigenous Peoples Policy, with commitment to offering
❖ Energy Management Team employment, training and supplier opportunities
❖ Commitment to best management practice as outlined under ❖ Commitment to hire and buy local
MABC
❖ Over $6.5m provided to charitable and community support
❖ Comprehensive Crisis Management Plan groups since 2011
Highlights
❖ MABC and the Province of BC Mining
Highlights Our heart is in the communities in
❖ Four agreements in place with local Indigenous groups
& Sustainability Award 2013 which we operate and our Company
❖ BC Technical & Research Committee of Reclamation Metal ❖ Premier’s Awards for Job Creation nominee, 2012 BC Export
Mine Reclamation Award 2012 Awards values are aligned with the values
❖ BC Hydro Power Smart Excellence Awards 2010 New of these communities.
Technology Award & 2008 Outstanding Energy Efficient Project
Award
24Taseko Mines
Looking to
the Future
25Looking to the Future
Following a long, successful track record
Highlights Short Term Focus Long Term Goals
Long life, low cost, large scale assets Maintain steady-state production from the To be a top ranked mid-cap North
with clear pathway to significant Gibraltar Mine American Copper Producer
production growth
Cost reductions and optimization Improve on already strong safety
Cash flow positive through the cycle opportunities at Gibraltar Mine and environmental performance
with ability to lower operating costs in Generate long-term shareholder value by
times of depressed copper prices Transition to a multi-asset copper leveraging strong portfolio
producer by bringing Florence online of cash flowing assets
Industry leader in safety and
environmental performance. ESG will Florence Copper permits for commercial ❖ Further reductions in the company’s
continue to be a priority scale facility operating cost profile
Proven operator with differentiated skill Secure remaining financing package for ❖ Deleverage the balance sheet
set and good reputation Florence Copper ❖ Potential for future capital returns to
shareholders
Committed to extracting maximum value Construct Florence on-time
from pipeline of high-quality assets and on budget Future organic growth options through
deep bench of projects: Yellowhead, New
Leader in mining innovation with low Prosperity, Aley Niobum
cost, environmentally-friendly copper
recovery
26Appendix
27Jurisdiction Exposure – 2019 Fraser Institute
Taseko’s exposure sits on the 1st quartile of the Fraser Institute’s Investment Attractiveness Index
• The Investment Attractiveness Index is a composite index that combines the Policy Perception Index and the Best Practices Mineral
Potential Index, weighted as 40% and 60% respectively
Investment Attractiveness Index
1st quartile 2nd quartile 3rd quartile 4th quartile
Index
100
75
50
25
0
Nova Scotia
Norway
France
Utah
Peru
Nunavut
Botswana
Portugal
Ireland
Arizona
Turkey
Tasmania
Indonesia
Colorado
Santa Cruz
Jujuy
Brazil
New South Wales
Nevada
Wyoming
PNG
Neuquen
New Mexico
Idaho
Chile
San Juan
NW Territories
Mexico
South Africa
Greenland
Yukon
Colombia
Mendoza
Mali
Venezuela
Tanzania
California
Queensland
Newfoundland
Manitoba
Guyana
Catamarca
New Brunswick
Zimbabwe
Rio Negro
Finland
South Australia
Alberta
Sweden
Ontario
Quebec
DRC
Chubut
Guinea (Conakry)
Salta
Suriname
New Zealand
Bolivia
Montana
Namibia
Ecuador
Nicaragua
Guatemala
Western Australia
Alaska
Saskatchewan
Northern Territory
Bulgaria
Victoria
Burkina Faso
Zambia
La Rioja
British Columbia
Minnesota
Washington
Dom. Republic
Best Practices Mineral Potential index Policy Perception Index
Index British Columbia Index
Arizona
100 100 88 91 92 90
81 79 81 85
76 74 78 79 78 75 77 74 76
69 73 72
50 50
0 0
2015 2016 2017 2018 2019 2015 2016 2017 2018 2019
Source: 2019 Fraser Institute Annual Survey of Mining Companies.
28Appendix
Adjusted EBITDA and Net Debt Reconciliation
NINE MONTHS ENDED LAST TWELVE MONTHS
YEARS ENDED DECEMBER 31
(CDN$ dollars in thousands) SEPTEMBER 30 March 31 June 30 September 30
2017 2018 2019 2019 2020 2020 2020 2020
Net income (loss) C$34,262 (C$35,774) (C$53,382) (C$43,451) (C$29,218) (C$94,401) (C$64,644) (C$39,149)
Add:
Depletion and amortization 47,722 70,781 109,756 78,376 76,554 116,720 112,094 107,934
Amortization of share-based
7,100 (1,282) 3,126 2,414 4,068 1,585 2,462 4,780
compensation expense
Finance expense 46,430 38,564 40,324 30,215 32,435 41,353 41,766 42,544
Finance income (935) (1,254) (1,202) (1,089) (202) (1,044) (793) (315)
Income tax (recovery) expense 29,178 448 (32,337) (24,794) (6,372) (35,639) (23,188) (13,915)
Unrealized foreign exchange
(17,684) 28,704 (15,228) (9,378) 9,250 21,208 14,481 3,400
(gain) loss
Unrealized (gain) loss on
copper put and fuel call 1,970 (1,970) — 518 1,236 (3,624) 180 718
options
Loss on copper call option 6,305 — — — — — — —
Write-down of mine equipment 3,551 — — — — — — —
Write-down of investment 3,850 — — — — — — —
Adjusted EBITDA $161,749 $98,217 $51,057 $32,811 $87,751 $46,158 $82,358 $105,997
Debt 329,218 355,481 373,485 382,422 381,885 403,462 388,624 381,885
Cash 80,231 45,665 53,198 41,877 72,678 50,169 63,619 72,678
Net Debt $248,987 $309,816 $320,287 $340,545 $309,207 $353,293 $325,005 $309,207
29Appendix
Reserves & Resources
Gibraltar Florence
Category Size Grade Recoverable Contained Category Size Grade Recoverable Metal Contained Metal
(at 0.15% Cu cut-off) (M Tons) Metal1 Metal (at 0.05% TCu cut-off) (M Tons) (%TCu) Cu (B lbs) Cu (B lbs)
Cu (%) Mo (%) Cu (B lbs) Cu (B lbs)
Probable Reserves 345 0.36 1.7 2.5
Proven 442 0.25 0.008 1.9 2.2 Measured 296 0.35 - 2.1
Probable 121 0.23 0.008 0.5 0.6
Indicated 134 0.28 - 0.7
Ore Stockpiles 2 0.20 0.006 - -
M + I Resources 429 0.33 - 2.8
Total P&P Reserves 564 0.25 0.008 2.4 2.8
Inferred 63 0.24 - 0.3
Measured 778 0.25 0.007 - 3.9
The resource and reserve estimation (effective date Jan 16 2017) was completed by Dan Johnson PE, Vice-
Indicated 302 0.23 0.007 - 1.4 President/General Manager for Florence Copper, Inc., and a Qualified Person under National Instrument 43-101. The
updated Mineral Reserves are based on engineering performed by SRK Consulting incorporating the measured and
Total M&I Resources 1,081 0.25 0.007 - 5.3 indicated resources established in 2010, metallurgical work completed by SGS Inc. and T. McNulty and Associates, process
facility designs by M3 Engineering as well as well field designs by Haley and Aldrich Inc. The reserve and resource
The resource and reserve estimation was completed by Taseko and Gibraltar mine staff under the supervision of Richard estimates use a long- term metal price of US$2.50/lb for copper. Mineral reserves are contained within the measured and
Weymark, P.Eng., MBA, Chief Engineer, of Taseko and a Qualified Person under National Instrument 43-101. Mr. Weymark indicated mineral resources. Mineral resources that are not mineral reserves do not have demonstrated economic viability
has verified the methods used to determine grade and tonnage in the geological model, reviewed the long range mine plan, (Under US standards no reserve declaration is possible until a full feasibility study is completed and financing and permits
and directed the updated economic evaluation. The reserve estimate uses long-term metal prices of US$2.75/lb for copper are acquired.)
and US$8.00/lb for molybdenum and a 0.80 C$/US$ foreign exchange. The resource estimate uses long term metal prices
of US$3.25/lb for copper and US$12.00/lb for molybdenum and 0.80 C$/US$ foreign exchange. Reserves and Resources
were updated and are stated as of Dec 31/19. Mineral reserves are contained within the measured and indicated mineral
resources. Totals may not sum due to rounding.
(1) Recovery rate per 43-101 technical report of 86%.
30Appendix
NI 43-101 Compliance
• Unless stated otherwise, Taseko Mines Limited (the “Company”) has prepared the technical information in this presentation including Mineral Reserve Mineral Resource estimates (“Technical Information”)
based on information contained in the technical reports and news releases (collectively the “Disclosure Documents”) available under the Company’s profile on SEDAR at www.sedar.com. Each Disclosure
Document was prepared by or under the supervision of a qualified person (“Qualified Person”) as defined in National Instrument 43-101 – Standards of Disclosure for Mineral Projects of the Canadian
Securities Administrators (“NI 43-101”). For readers to fully understand the information in this presentation, they should read the technical reports identified below in their entirety, including all qualifications,
assumptions, and exclusions that relate to the information set out in this presentation which qualifies the Technical Information. The Disclosure Documents and this presentation are each intended to be read
as a whole, and sections should not be read or relied upon out of context. The Technical Information is subject to the assumptions and qualifications contained in the Disclosure Documents.
• The Technical Information in this presentation has been prepared in accordance with NI 43-101 and has been reviewed and approved by Scott Jones, P.Eng, Vice-President Engineering of the Company,
and a “Qualified Person” under 43-101. Mr. Jones has verified the data disclosed in this presentation and no limits were imposed on his verification process.
• Mineral Reserve and Mineral Resource estimates are shown on a 100 percent basis for each project. The Measured and Indicated Resource Estimates are inclusive of those Mineral Resources modified to
produce the Mineral Reserve estimates. All estimates are current as of the effective date of their corresponding technical reports with the exception of those for the Gibraltar Mine which reflect mining
depletion since the effective date as documented in the Company’s most recent annual information form. Estimates for all projects are prepared by or under the supervision of a Qualified Person as defined in
NI 43-101. Mineral Reserve and Mineral Resource estimates for all projects have been calculated using metal prices, foreign exchange, recoveries, and costs stated in their respective technical reports.
• For further Technical Information on the Company’s properties, refer to the following technical reports, each of which is available on the Company’s SEDAR profile at www.sedar.com.
• Gibraltar Mine: technical report entitled “Technical Report on the Mineral Reserve Update at the Gibraltar Mine” issued June 15, 2015 with an effective date of May 31, 2015.
• Florence Copper Project: technical report entitled “NI 43‐101 Technical Report, Florence Copper Project, Florence, Pinal County, Arizona” issued February 28, 2017 with an effective date of January 16,
2017, as amended and restated December 4, 2017.
• Aley Project: technical report entitled “Technical Report on Mineral Reserves at the Aley Project” issued October 30, 2014 with an effective date of September 15, 2014, as amended and restated December
4, 2017.
• Prosperity Project: technical report entitled “Technical Report on the 344 Million Tonne Increase in Mineral Reserves at the Prosperity Gold – Copper Project” issued December 17, 2009 with an effective date
of November 2, 2009. Readers are cautioned that the Prosperity Technical Report has not been updated since 2009 and accordingly, caution needs to be advised when assessing its conclusions in light of
current operating and capital costs, appropriate technologies, metals price outlooks, and like matters. In light of the current negative position of the federal Canadian government regarding the Environmental
Assessment for this project performed in 2013, and notwithstanding the Company’s position that the negative outcome was the product of a flawed review process which we are legally challenging, we do not
consider the New Prosperity project to be material at this time although our materiality assessment could change in the event of a successful legal challenge.
31You can also read