REPORT OF THE CHARACTERIZATION OF SARDINIAN DAIRY SHEEP PRODUCTION SYSTEMS - SHEEPTOSHIP
←
→
Page content transcription
If your browser does not render page correctly, please read the page content below
With the contribution of the LIFE financial
                       instrument of the European Community

                                LIFE15 CCM/IT/000123

                                    Language: IT

Report of the characterization of
    Sardinian dairy sheep
      production systems

        A.1.3 Characterization of production systems
                  Version n. 1, 04-04-2017
                       Language: EN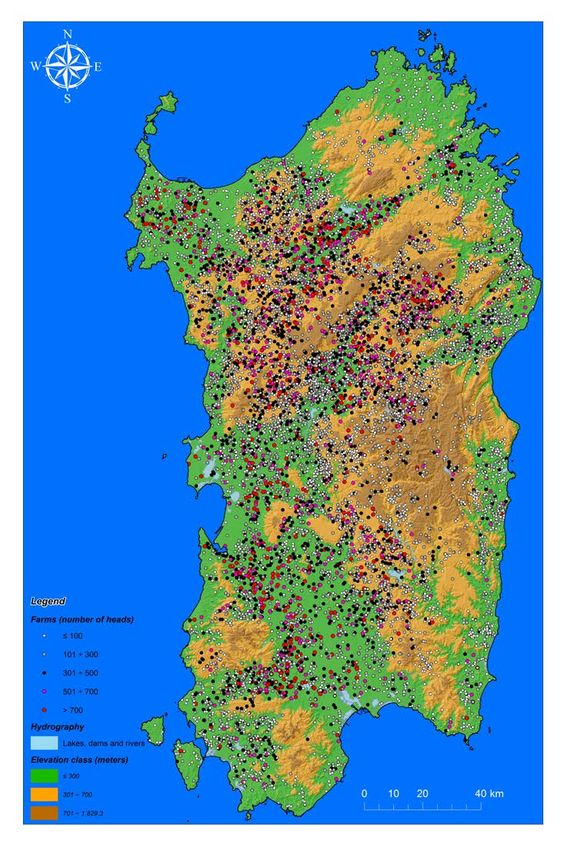
Authors                                                     Coordinated by:

Agris Sardegna
Giovanni Molle
Mauro Decandia

CNR Ibimet
Laura Sanna
Enrico Vagnoni
Gian Valeriano Pintus
Pierpaolo Duce

CNR ISPAAM
Antonello Franca

Dipartimento di Agraria UNISS
Alberto S. Atzori

Laore Sardegna
Alberto Manca
Domenico Usai

Acknowledgements
The authors wish to acknowledge Dr. Stefania Fanni of Agris Ricerca for her helpful advice on
soil classification. Dr. Sandro Rolesu of Istituto Zooprofilattico Sperimentale della Sardegna is
also thanked for providing the vectorial files of geo- referenced data of Sardinia sheep farms.

                                 Executive summary
       After an overview of Sardinian climate, soil features and dairy sheep sector, this
       report describes the methodology to distinguish and discriminate the main
       dairy sheep production systems in Sardinia. Finally this methodology is
       implemented on a wide database to characterize the sheep farms within the
       main production systems and to evaluate the most frequent values of key
       indicators of farm size, intensification level and performance and their
       variability within each production system.
Summary

Introduction .................................................................................................................................................. 1

1.     The climate of Sardinia ......................................................................................................................... 2

2.     The soils of Sardinia .............................................................................................................................. 5

3.     Overview of sheep production sector in Sardinia ................................................................................. 7

4.     Characterization of the of dairy sheep production system: A. methodology..................................... 11

5.     Characterization of dairy sheep production system: B. Application .................................................. 13

6.     Characterization of dairy sheep production system: C. Preliminary results....................................... 14

7.     Outlook ............................................................................................................................................... 23

References .................................................................................................................................................. 24
Introduction

Sardinia is a Mediterranean island of about 24,000 km2 traditionally devoted to livestock production and in
particular to dairy sheep raising due to poor land capability which prevents the use of Sardinian soil as
agricultural land. This report is aimed to provide an overview of the current status of Sardinian sheep
production sector and to characterise the main sheep production systems in Sardinia. This is a pre-requisite
for the following action of SheepToShip LIFE: i.e. the selection of representative sheep farms to be analysed
in depth for their environmental impact, using the Life Cycle Assessment method.
Keeping in mind this objective, the following chapters are intended to give an overview of the island in
terms of climate (Chapter 1) and soil (Chapter 2), to describe the Sardinian sheep dairy sector as a whole
(Chapter 3), the methodology adopted to characterize its main dairy sheep production systems (Chapter 4),
the application to this protocol to a wide database (Chapter 5) and the preliminary results of
characterization process (Chapter 6).

       1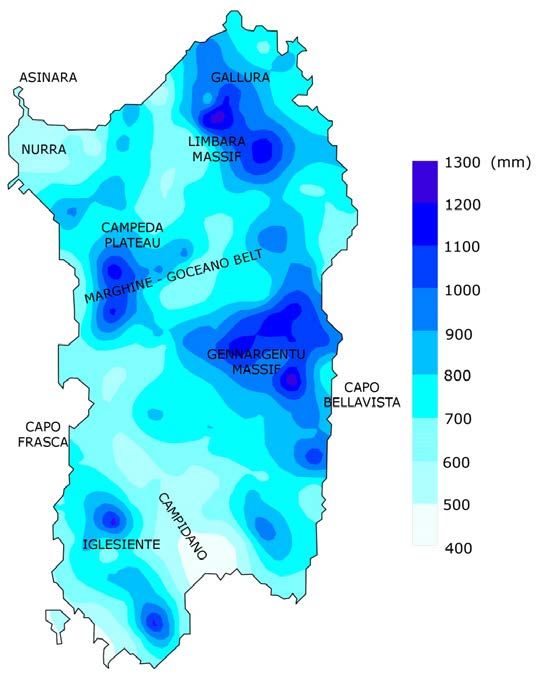
1. The climate of Sardinia
The Sardinia climate is classified as Mediterranean type, group C of the Köppen system. The “Csa” category
characterise most of the region, with the “Csb” category just in the inner areas above 800-1000 m of
altitude (Secci et al., 2010). It is characterized by contrast between two seasons with relatively mild and
rainy winters, hot-dry summers, and sharp transition periods among them (Chessa & Delitala, 1997). This
large-scale pattern reflects the position of the island in the middle of Mediterranean Sea, at the boundary
between the Tropical zone to the South and the Temperate zone to the North. In this transition area, large
inter-seasonal variations on precipitation and temperature occur, due to the oscillation of the arid
subtropical cells (the Azores Anticyclone) that migrate to North during the summers and regress toward the
South during the winters. This leaves the island exposed to the penetration of the North Atlantic humid air
masses (Delitala et al., 2000). At a regional scale, the inhomogeneous orographic distribution and the
presence of the sea are the main sources of local climate variability that leads to the existence of several
microclimates. Mediterranean types are widespread over 99.1% of the island while Temperate area, with
its Sub-Mediterranean category, is confined to the mountain reliefs (Gennargentu, Limbara and Goceano)
(Canu et al., 2015).
The aspects characterizing the Sardinian climate are the thermicity (thermal gradient and latitude), the
aridity (precipitation regime) and the continentality (elevation and distance inland). The mean annual
temperature ranges from 11.6 °C to 18.0 °C, allowing the presence of eight phytoclimatic horizons mainly
correlated with altitude (Canu et al., 2015). Its spatial distribution is affected by the orographic structure of
the island, distinguishing the plain landscapes (Campidano and Nurra) with the higher values, from the
colder mountainous territories. The hottest month is August with extreme values (>45 °C) recorded in the
Campidano plain and the coldest is January with low limit
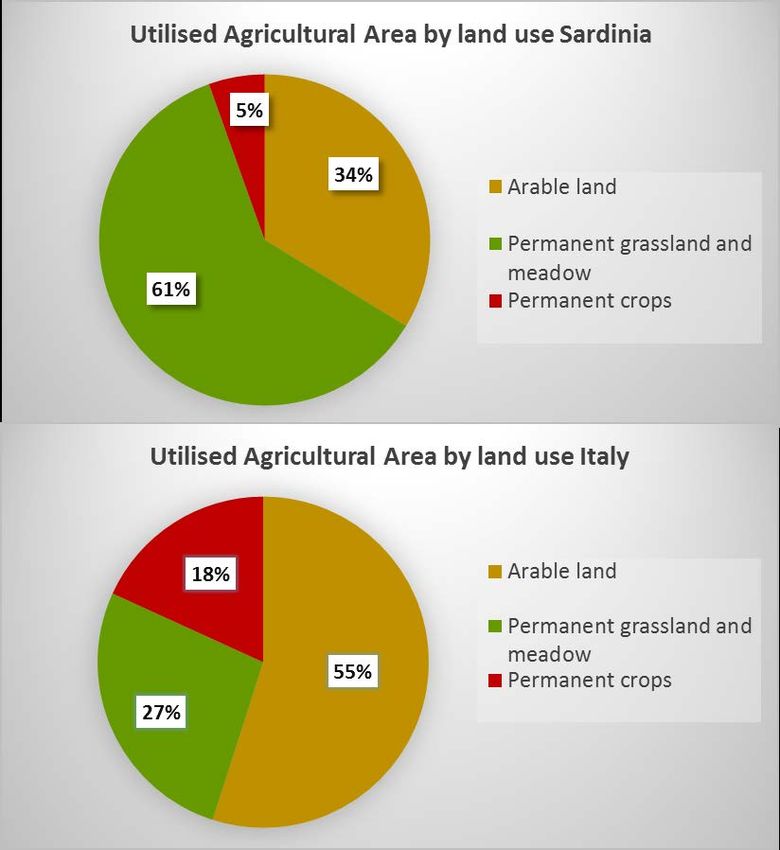
Figure 1. Distribution of the mean annual temperature over Sardinia (modified from Chessa & Delitala,
1997).

In Sardinia the total precipitation ranges from 411 mm to more than 1,215 mm in the inner mountain areas
(Canu et al., 2015). Its regime is sporadic and particularly irregular, varying greatly from year to year
without spatial correlation (Delitala et al., 2000). The seasonal precipitation is linked to large-scale
atmospheric circulation structures which connect westward to the North Atlantic Oscillation and northward
to the Artic Oscillation (Delitala, 2003). Based on the annual mean values, four different rainfall zones have
been distinguished: (1) the area around the Gennargentu Massif, (2) the central part of Gallura, (3) the
Campeda plateau and (4) the Iglesiente area. The Nurra and Campidano plains are the driest zones together
with a stripe surrounding the Coghinas watershed (Chessa & Delitala, 1997). Among these zones, the
highest rainfall fluctuations is recorded on the eastern coast, indicating that the meteorological phenomena
that determine the precipitation in this area are different from those that manifest over the rest of the
island (Figure 2).

       3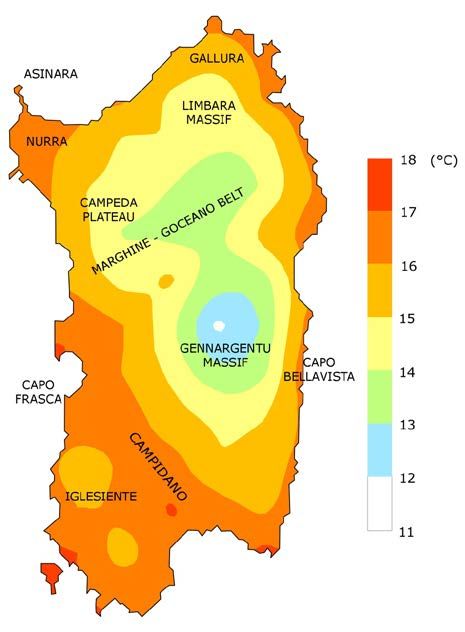
Figure 2. Distribution of the mean annual precipitation over Sardinia (modified from Chessa & Delitala,
1997).

In fact, exploring monthly data from 1946 to 1993, Delitala and co-authors (2000) recognised a rainy season
from October to April, often related to Alpine cyclogenesis. The maximum cumulate is on December
together with other months among the period from November to February. Conversely, during March and
October rainfall events, often quite intense, concentrate on the East coast due to hot and moist currents
coming from Africa (Bodini & Cossu, 2010). During summers, the occasional precipitations fall on the
mountain reliefs. They show a North-South gradient in July and August, the driest mounts, and an East-
West gradient in September.

The rainy days are always a small fraction of the year with a maximum rate of 80 days per year on
Gennargentu Massif, Campeda plateau and Limbara mountain, that are the zones with the highest
cumulate. The main rainy days have low values of mean daily intensity (between 1 and 10 mm), while the
intermediate classes (10-25 mm and 25-50 mm) identify the driest areas: Campidano and Nurra plains. The
extreme rainfalls (>50 mm) have a West-East gradient with a maximum value along the East coast (Chessa
& Delitala, 1997).

The main precipitation fall at high elevations, but there is a clear contrast between rain frequency and
intensity. The most frequent rainfalls have low intensity and are homogeneously widespread over the
whole Sardinia, whereas the rare high intensity events privilege the East zones. The extreme events (>400
mm) occur in the Central-East and South-East Sardinia with the maximum historical value of 1,400 mm in
four days in 1951. Such high intensities have never been documented on the north-western side of the
island and do not occur simultaneously (Chessa & Delitala, 1997). Even though in the last decade few

       4
intense precipitations were recorded over the island, the relative frequency seems not to have increased
the trend (Bodini & Cossu, 2008).
As regard the snowfall, it is an infrequent and irregular phenomenon that occurs just on the high-elevate
areas (around Gennargentu Massif, on the Maghine-Goceano Belt and on Limbara Massif) and limited to
the winter season, generally during the coldest months (January and February) for short periods (3-5 days)
and with a mantle not very thick (a mean 45 cm of snow on top of the mountains).
Due to its orographic structure, another important aspect of Sardinia climate is its air masses circulation. It
is very rare a day without wind, especially in winter and sea breezes characterize the region (Furberg et al.,
2002). The dominant winds are from West and North-West and blow in the high intensity class reaching
>13 m/s of speed at least one out the three days of the year. West and North-West winds are antagonist so
the predominance of one direction avoids the prevalence of the other one. Some areas are also exposed to
strong winds from East and South-East (Asinara), North-East (Capo Bellavista) and South-East (Capo Frasca)
that are more frequent in winter (from 40% to 70%). For the middle-intensity flow dynamics, again West
and North-West plus South, South-East and East sector are the most representative winds, whose regime is
opposite to that of high intensity, with great frequency in summer. The low-intensity winds have a
homogeneous distribution and are influenced by local factors as the inland distance (Chessa & Delitala,
1997).
2. The soils of Sardinia
Sardinian soils result from several cycles of deeply rooted pedogenetic processes of its substrate. The
basement of the island is constituted by a sector of the Variscan metamorphic belt as part of the Southern
European margin intruded by the granites (about 300 Ma ago) during late Paleozoic. After a period of
intense erosion during Permian, Sardinia was part of the carbonate platform of the Tethys during Mesozoic
and later affected by Cenozoic volcanism, related to the rotation of the Sardinia-Corse block. The volcanic
activity gave rise to trachyte plateaux of Miocene age (30-18 Ma) and Quaternary basaltic flat highland (3-
0.2 Ma) whose ridges typical shape the central western belts (Marghine-Planargia Belt) (Vardabasso, 1972).
Moreover, fluvial and marine dynamic deposited a variety of continental and marine sediments over the
whole island. Hence, Sardinian soils show diverse parental rocks and, according to them, they can be
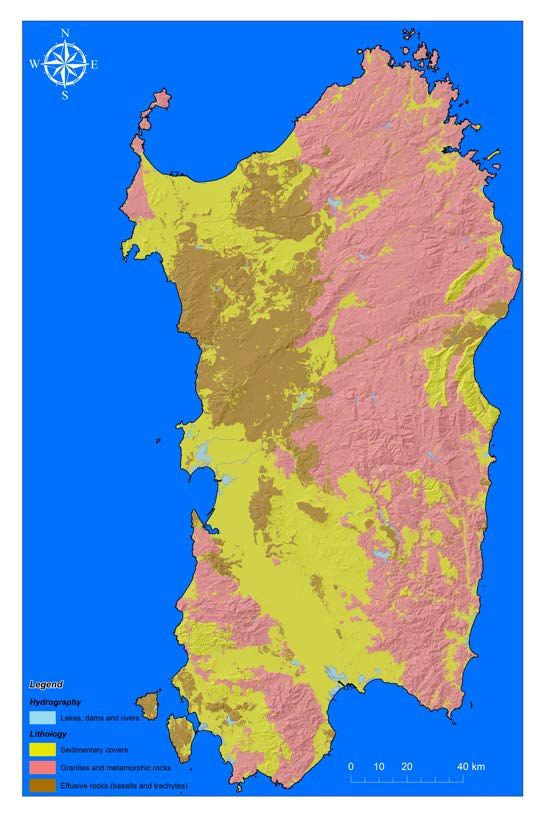
classified as follows (Figure 3):
• (S) Sedimentary soils: they feature most of the lowlands which stretch along the island from North to
South with a break around the middle where the Marghine belt and Campeda plateau. They have a
rather diverse composition depending on the presence of carbonate which can increase their fertility
and pH.
• (I) Soils based on crystalline (intrusive) rocks, i.e. granite and metamorphic rocks. They basically feature
all the eastern area of the island stretching again in the direction N-S. It is the basement of the Sardinia-
Corse block.
• (E) Soils based on effusive rocks, mainly trachyte and basalt. They characterize the central part of the
Island, with spots also in the south-western areas.
5Figure 3. The main source of Sardinian soils (modified from RAS, 2016; http://www.sardegnageoportale.it/).
These three types of matrix provide specific physical-chemical characteristics to the derived soils, with a
trend towards silt-clay texture with neutral-to sub-alkaline pH, particularly if rich of carbonate, and
moderate to high fertility for sedimentary sandy textured soils with sub-acidic pH. Soils derived from
granite or metamorphic rocks show moderate to poor fertility , while soils derived effusive matrix are
usually with moderate fertility with loam texture and pH from sub-acidic to sub-alkaline (Aru et al., 1991).
In this report, we refer to sedimentary, crystalline and effusive soils, respectively.
From a pedological point of view, a more detailed large scale classification has been suggested by a recent
update Italian soils map (Costantini et al., 2012).
It groups Sardinian soils in four classes:
• Soils of the Southern alluvial plain of Campidano and Sulcis (SW) areas, characterized by soils with clay
accumulation, , shallow water table and salt accumulation.
• Soils of hills zone on basic basalt and trachyte rocks. These soils cover an area approximately
perpendicular to the main axis of the island and covers the hills and mountains surrounding Macomer
(Marghine) towards the North plain (Nurra). They are often shallow but can be moderately fertile and
contain relevant level of organic matter.
6• Soils of the mountains and hills of Sardinia, on acid crystalline rocks which are often shallow soils with a
weakly differentiated profile. They are often of poor fertility with high erosion risk due to slope, and
often featured by stoniness and rockiness.
• Soils of mountains and hills of Sardinia based on metamorphic rocks. These soils are usually shallow and
acidic.
Although this classification is probably more accurate, the land capability is not well discriminated: for
instance the soils of southern and northern lowland or moderately sloped hills often falls in the same land
capability classes (classes 2 and 4).
The simplified 3-class clustering of Sardinian soils has been proven sufficiently adequate to explain the
variation occurring of natural vegetation between macro-areas (e.g. CORINE land cover map,
http://www.sinanet.isprambiente.it). At a landscape-scale classification the project Lacope aimed at
mapping the main Large Scale Grazing Systems (LSGS) in Europe (Caballero et al., 2009) the three main soil
classes have been used. In this study, overlapping RAS (2017b) map to the distribution of the main livestock
production systems in Sardinia four main LSGS were marked, which basically overlap the three soil classes
with exception of Gennargentu Massif, which was distinguished from the remaining granite-metamorphic
area only due to the presence of vast common land areas and a mixed grazing system including goats,
cattle, and pigs, with a scattered modest presence of sheep.
Said that, it is noteworthy that soils of Sardinia, particularly those of the class I of land capability are prone
to erosion being about 11.3% of Sardinia area deemed at risk of erosion (INEA, 2010). The content of C in
the soil on average low (1.68%) but it is particularly low in the lowland arable soils submitted to frequent
tillage (1.28%) (PSR Sardinia 2014-2020).
Climate changes will tend to exacerbate this phenomenon with a probable trend towards loss of soils, loss
of soil biodiversity and fertility and at last desertification. About 46% of Sardinian land is at risk of
desertification and almost 40% is regarded as fragile (PSR, Sardinia 2014-2020). This means that factors
impinging on the dynamic of pedogenesis, such as intensive cultivation or abandonment (no cultivation and
no grazing) can have catastrophic effects on these eco-systems. Another expected effect of climate change
is soil salinization: it is already a problem in some areas of Sardinia due to the intrusion of sea water into
water-tables adjacent to the coastline (INEA, 2010; Puddu et al., 2008). All these aspects are of course to be
taken into consideration when envisaging adaptation and mitigation strategies against climate change.
3. Overview of sheep production sector in Sardinia
Sheep production has become the basis of rural economy in Sardinia since the second half of XIX century
when the first cheese factories were settled by companies based in the Latium region of Italy, starting out
the production of what is still the main sheep dairy product in Sardinia and Italy: the Pecorino Romano PDO
(Protected Designation of Origin, European quality label) cheese. Since then, sheep production has
undergone a manifold development with a dramatic raise of milk yield per ewe and per farm, an
improvement of milk quality and animal welfare, an upgrading of cheese plant technologies and cheese
marketing. However, there are still facets of the system, which remain tightly bound to the ancient savoire
faire (“su connottu” in Sardinian language) of about two centuries ago. In particular, sheep nutrition is still
based on grazing (natural pasture and cultivated forages) and the main dairy product (hard mature cheese)
is still Pecorino Romano PDO cheese.
7Nowadays dairy sheep production in Sardinia is widespread on all the regional area with a collection and
processing of milk so developed and organized that can be considered as the most dynamic sector of
Sardinia agriculture, accounting for about 25% of total agriculture income of Sardinia. With some 3 million
sheep, 44% of national sheep stock (ISTAT, 2010) and about 3.5% of the EU total sheep stock (EUROSTAT,
2012) and a milk production of about 260,000 t year−1 (ISTAT, 2010), Sardinia is the top ranking EU region
for sheep milk production, representing more than 12% of the total European production (EUROSTAT,
2012). The average flock size is 239 heads (Table 1).
Table 1. Inventory of dairy sheep farms in Sardinia and Italy (ISTAT, 2010).
Sardinia Sardinia Italy
(total) (% of Italy)
Total sheep farms (n.) 12,669 24.8 51,096
Total sheep (n. heads) 3,028,373 44.7 6,782,179
Average flock size (n. heads) 239 133
Total sheep milk** (t) 260,779 65.6 397,509
**Milk collected by cheese factories in year 2015 (ISTAT, 2016).
Total number of sheep and sheep farms vary annually with some relevant discrepancy among sources
(National Database of Farm Animals, 2016; ISTAT, 2010). According to the National Database Farm Animals
(year 2016) the geo-referenced farms are 12,058, partitioned in flock size classes as shown in Table 2.
Table 2. Distribution of sheep farms on the basis of flock size (N. sheep heads/farm).
Flock size N. sheep % Tot. sheep n. sheep % Tot. sheep Average flock size
class farms farms heads heads n. heads/farm
< 100 3,455 28.65 148,119 4.88 43
100-300 4,982 41.32 976,736 32.16 196
300-500 2,245 18.62 860,538 28.34 383
500-700 778 6.45 455,775 15.01 586
> 700 598 4.96 595,598 19.61 996
Total/Average 12,058 3,036,766 252
This table shows the wide variability of flock size. Interestingly, although only about 30% of farms have a
flock size bigger than 300 sheep heads/farms, they include more than 60% of the total geo-referenced
sheep stock. If we consider only the two top size classes (size bigger than 500 heads) they represent 15% of
farms but 30% of total sheep stock.
Most of farms are managed directly by the land owners or their families (73.3%). The average farm size is
30.4 ha with huge variability within the region (ISTAT, 2010). In the last decades there has been a marked
decrease in farm number and a consequent increase of farm size and number of heads per farm. Therefore
8the number of sheep per farm has been boosted from 121 heads in 1982 to 239 heads in 2015 (ISTAT 2015)
and 252 heads in 2016 (National Database of Farms Animal, 2016) (Table 2).
Organic farms amount to 786 farms in 2010, in 65% of which dairy sheep are raised (208,000 heads) (ISTAT,
2010). These farms are located mainly in the inner areas of Nuoro province (46% of farms and heads) and
based on natural pastures (101,000 ha as total of all Sardinian organic farms).
The whole milk production is processed into cheese factories (industries, cooperatives and mini-dairies).
The number of cheese plants is estimated to be 71 in 2015, not including the mini-dairies (ISTAT, 2011).
According to data by ISTAT (ISTAT, 2016) the total number of dairies is set to 111. The main products are
the three PDO cheeses: “Pecorino Romano”, “Pecorino Sardo” and “Fiore Sardo” (Table 3). “Pecorino
Romano PDO” is one of the main Italian PDO products (ISMEA, 2012) and 95% of its production derives
from Sardinian cheese factories (Idda et al., 2010).
Table 3. PDO cheese production (t/year) (CLAL, 2016).
Cheese type 2008 2009 2010 2011 2012 2013 2014 2015
Pecorino Romano1 29,461 26,746 27,477 25,335 25,099 24,778 24,117 30,167
Pecorino Sardo 196 186 1,935 1,989 2,031 1,783 1,720 1,414
Fiore Sardo 650 712 800 752 735 515 515 550
Totale 30,307 27,644 30,212 28,076 27,865 27,076 26,352 32,131
1
About 95% of Pecorino Romano is produced in Sardinia.
Data on other types of dairy products are not validated. Total amount of PDO cheeses is approximately 55-
60% of total dairy product production in Sardinia, which totalized approximately 55,000 t in 2015 (our
estimate).
Meat (suckling lambs and culled sheep) represent around 20% of sheep farm total income. In 2010,
1,100,371 lambs were produced with an average live weight around 10 kg. Total meat production was
8,341 t, whereas lamb meat was 6,472 t. The greasy wool production is estimated around 1.5 kg/adult
sheep corresponding to a total amount of about 3,470 t per year in 2015 (ISTAT 2016). The cost of shearing,
usually made by professional shearers (around 1.2-1.7€ /adult head) is more than the corresponding
income (around 0.6-1€/adult head).
The dairy sheep farming system in Sardinia is mainly grassland-based with a wide range of levels of input
utilization and land uses. In fact, Sardinia is the Italian region with the highest share of land devoted to
permanent grassland (Figure 4, ISTAT 2014).
In the last decade, there has been a decreasing trend of the area covered by permanent grassland basically
due to the abandonment of utmost marginal areas, with bush encroachment or the replacement of
permanent pastures with cultivated forages, which cover an area of about 230,000 ha, including double
purpose cereals (oat, barley and triticale) (ISTAT 2010).
Conserved forages and concentrates are fed as supplements, particularly during late pregnancy-lactation
period. The total amount annually offered varies among farms. According to a survey carried out in three
9consecutive years (2002-2004) in 40 farms, it averages around 70 kg of hay and 100 kg of concentrate per
ewe per year (LEGGRAZE, data not published).
Figure 4. Land use in Sardinia and Italy as % of utilised agricultural area (ISTAT, 2014).
Economic data on dairy sheep farms are scanty. In a sample of 190 sheep farms (84,374 heads) the total
income and gross margin per livestock standard unit (LSU) has been estimated as shown in Table 4.
Table 4. Economic results of a sample of sheep farm (€/LSU per year) (INEA, 2013).
Total income (€/LSU1) Gross margin (€/LSU1)
Sardinia Italy Sardinia Italy
1,158 1,078 639 621
1
Livestock standard unit: 1 LSU is equivalent to 10 adult sheep heads.
Although gross margin is positive, around 64 €/ewe per year, net margin can be negative as suggested by
our analyses of survey data by Idda et al. (2010) in which average net margin was estimated to be 25
€/ewe, with almost 20% of farms displaying negative net margin values (G. Molle, unpublished data).
Fast variations of economic returns from dairy sheep farms are common. In fact, Sardinian sheep
production sector have traditionally suffered for cyclic severe drops of revenue, in the past related to cyclic
10variations of the exchange ratio between US $ and Italian liras (Savona, 1983) now much more related to
the cyclic increase of cheese offer following years of high milk price. In the last two years, after a peak of
milk price up to 1.0-1.1 €/l of milk, there has been a marked increase (about. +50%) of milk and cheese
production (particularly Pecorino Romano PDO) which in turn brought about a dramatic flop of milk price
down to the current level (0.6-0.7 €/l of milk). Several internal (national and regional) factors exacerbate
the negative impact of these ”swinging market conditions”, such as the high cost of energy (fuel),
purchased forages (hay) and concentrates. Therefore, Sardinian sheep farms are currently realizing low or
negative profit margins with dramatic consequences on Sardinian economy (Furesi et al., 2013). As a matter
of fact, the economic sustainability of Sardinian sheep farms is nowadays based on the aids of Common
Agricultural Policy payments, which account for more than 20% of sheep farm gross income (Idda et al.,
2010).
4. Characterization of the of dairy sheep production system: A. methodology
The Sardinian sheep farms have a various degree of farming system intensification depending on the
geographical location of farms, which affects key traits such as land capability (Caballero et al., 2009;
Porqueddu, 2008). Land capability of soils ranging from class 2 to 8 and annual rainfall ranging between
about 400 up to more than 800 mm make dairy sheep farms in Sardinia rather heterogeneous. The
availability of water for irrigation at low cost is another key factor which impinges on the production system
intensification level.
From the beginning of the green revolution of early sixties up to the end of eighties, a process of
sedentarization of sheep flocks and intensification of sheep production has been accomplished. During that
period, thanks to urban market expansion, decrease of land renting fees, and favourable milk price trend,
sheep farms have become increasingly able to base sheep flock nutrition on farm resources (cultivated
pastures and conserved forages) with an increasing proportion of the farm land owned by the farmer and a
decreasing use of rented land. Other factors in favour of sheep flock sedentarization were: the availability
and the ease of transport and delivery at farm gate of concentrate and conserved hays produced
elsewhere, sometimes in remote locations (Paoli, 1997).
At the end of this sedentarization and intensification process, a bipolar system emerged with big extensive
to semi-extensive farms, with moderate to low stocking rate, concentrated in the areas characterised by
low land capability (usually on hills and mountains) and small semi-intensive to intensive farms, with high
stocking rates, prevailing in areas where most of land was arable and possibly irrigated. Interestingly, due
to this bipolar trend and its consequence; the trade-off of land with labour and capital investments, the
economic return of sheep farms belonging to these systems has tended to converge (Natale et al., 1999).
Nowadays the picture of sheep sector has become more complex due to the superimposed growing impact
of EU legislation, which has supported in a biased way some of the systems while penalizing others.
Therefore, we can now grossly classify the production systems as follows (Porqueddu, 2008):
1. Sylvo-pastoral systems, which are typical of mountain areas. They are based on the combination of
herbaceous and ligneous feed resources. These are very rarely implemented with sheep only but often
are devoted to goats or used farms raising on common land sheep, goats cattle and pigs.
2. Agro-pastoral systems in the hilly areas with moderate slopes in which a small part of farm land (3. Cereal-based dairy sheep systems in the lowlands with higher land capability. In these systems, usually
located in the rainfed lowlands or in moderate sloping hills most of land farm is cultivated. Other crops
can be also used to rotate cereals such as grain legumes or forage legumes for grazing and haymaking
purposes.
4. Intensive irrigated systems where forage production includes irrigated legumes such as lucerne and
summer C4 forage crops (Sorghum spp. and maize for grain or silage). In these systems the use of total
or partial complete diet feeding technique is frequent.
Within these four classes, other strata can be identified using criteria such as: farm total area, arable land
area, flock size; agricultural mechanization level; feed self-sufficiency; organic vs. conventional farming.
Socio-cultural factors (for instance the age of farmer) can also play a role and are often superimposed to
bio-physic factors, impinging on structure and performance of the farm within each system class.
Although this conceptual classification, based on historical and bio-physic survey data is well rooted, a
statistical-based classification could be also envisaged. This can be implemented, for example, running a
principal component analysis and a cluster analysis of a well-designed and consolidated database. For
instance, this statistical procedure was successfully used by Usai et al., (2006) to cluster a representative
sample of goat farms in Sardinia and identify the variates, which contributed more to cluster separation.
However, this approach has some shortcomings such as in many cases it gives raise to spurious classes,
difficult to be explained on the basis of physical, biological or technical criteria because they just group
border-line cases falling between two or more main clusters. Moreover, this approach can give biased
classification response, if based on data gathered in a particular year in which management and
performance are odd due for example to extraordinary meteorological events .
In contrast, a clustering based on land capability and climate (biophysic criteria) can be useful in order to
assess the relative carbon footprint of a farm at system class scale. In fact, this relative index can be a useful
criterion to identify within the same background conditions (i.e. within the same system class): i) the top
and bottom carbon-friendly farms; ii) the best and worst practice within a limited range of possible
practices (equal opportunity conditions).
Therefore the approach proposed hereunder is based on the preliminary characterization of sheep
production systems featured by contrasting pedologic and climate conditions based on an ex-post analysis
of available data on farm structure and farm input and output.
A similar procedure was used in the EU “LEGGRAZE” project in Sardinia in early twenties. This project was
aimed at evaluating the role of legume forages in Sardinian dairy sheep farming. A survey was run on 40
sheep farms located in 5 zones with different average rainfall (high, North Sardinia; low South Sardinia)
and soil parental rocks (granite/metamorphic, effusive (only with high rainfall) and alluvial) in 3 consecutive
years (2002-2005). This study results overall suggested that:
- Sheep systems in different pedo-climatic zones have different land use, use different forages,
differentiate well each other for the level of supplementation and sheep milk performance;
- some territories within the Island are particularly suitable to produce milk and hence cheese rich of
nutracines, such as conjugated linoleic acid (CLA) and poly-unsaturated fatty acids FA (Addis et al., 2007).
125. Characterization of dairy sheep production system: B. Application
In this chapter the application of the procedure of characterization of sheep farms implemented in
LEGGRAZE survey is run using an updated database regarding around 12,000 dairy sheep farms. Moreover,
since nowadays GIS is the most potent available tool for mapping and analyzing geo-referenced data, the
use of this tool has been introduced and applied to the National Database of farms.
The detailed process of characterization of sheep farms as implemented in this report is detailed in Figure
5. It is a step-by-step process.
In step 1, the database on the geo-located sheep farms of Sardinia was exported from the National
Database of Farm Animals (2016) as a vectorial file, manageable by GIS. These data were then inserted on a
Sardinian map and validated to screen out farms with no sheep and farms with clearly wrong GPS
coordinates. The layer of geo-located farms was then overlapped by GIS to the soil map to assess the
parental rock type for each farm. This information was integrated with data on altitude and basic climate
features. At the end of step one, the data on geo-located 12,056 sheep farms were validated.
In step 2, three soil classes and two climatic regions (North and South) were discriminated as described in
Chapter 3, then farms were assigned to these pools. Descriptive statistics were run to characterize each
pool. In particular, the farm size was classified into five classes in terms of sheep heads (700 heads).The pools were then characterized for farm
distribution among these classes.
In step 3, a subsample of farms (sub-pools) was extracted from each pool, identifying on Sardinian GIS map
areas featured by high concentration of sheep farms, presumably representing the most of sheep milk
production within the pool area. These areas were: Nurra and Ozieri lowlands (SN), Campidano (SS) with
sedimentary soils but featured by different climatic features (approximately 50-100 more annual rainfall in
SN than SS); Marghine Belt (EC) featured by effusive soils in the Central western hilly area and Nuorese (IC),
featured by crystalline soils in the Central eastern mountainous area (Gennargentu Massif). Descriptive
statistics were then run to characterize each sub-pool as previously described for the pools.
13Figure 5. The sheep farm step-by-step characterization and sampling process. (SN: Nurra and Ozieri
lowlands; SS: Campidano; EC: Marghine belt; IC: Nuorese mountains).
In step 4 (not done yet) a smaller sample of representative farms (final sample) will be extracted from each
sub-pool. Although they will be featured by a similar biophysics background, they will be chosen in order to
explore a range of farm indicators such as stocking rate, production level and feed self-sufficiency. This will
help the detection of the hotspots and the tailoring of feasible mitigation-adaptation strategies. The farms
to be surveyed for LCA analysis will be selected within this final sample,.
6. Characterization of dairy sheep production system: C. Preliminary results
Figure 6 shows the map of Sardinian soil classes with indication of sheep farms whose location was
validated (step 1).
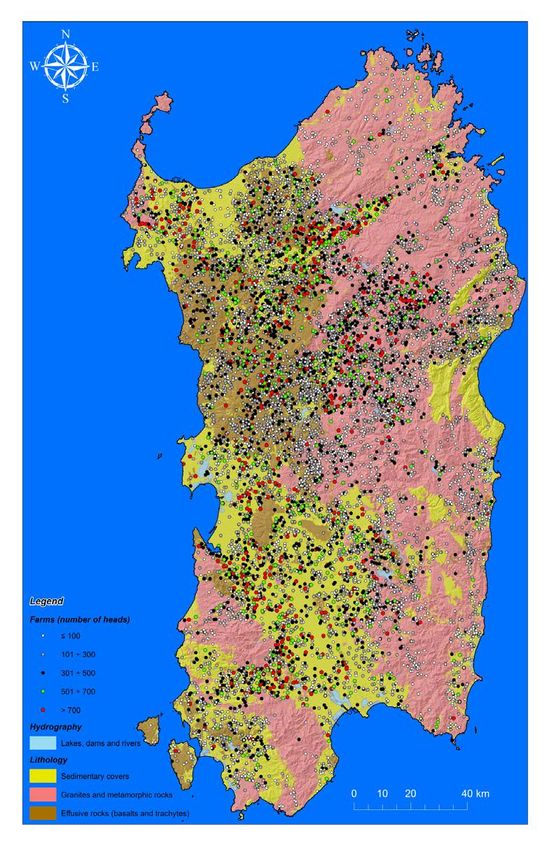
14Figure 6. Maps of Sardinian soils and sheep farms distribution classified on the basis of head number per
farm (geographic map modified from RAS, 2016; http://www.sardegnageoportale.it).
15Figure 7. Geographic map of Sardinia and sheep farms distribution classified on the basis of head number
per farm (modified from RAS, 2017a; http://www.sardegnageoportale.it) (ISTAT, 2017).
It is evident that sheep farms are spread over all the island, although with a lower apparent frequency on
the granite-metamorphic soil area, where are located the highest mountains (Figure 7).
Results of the descriptive statistics of the four identified pools (step 2) are summarised in the following
tables (5 to 8). Overall the four pools are constituted by about 82% of Sardinian geo-located sheep farms
and about 83% of sheep stock.
16Pools representing farms settled on sedimentary soils include 16% of farms with a stock bigger than 500
sheep (Tables 5 and 6). In these two pools, the overall share of sheep raised in these farms amount to 39%
in Northern farms and 44% in Southern farms. Average number of sheep per farm, is also slightly higher in
the Southern sedimentary pool. The size of the farm in terms of sheep stock tends to increase along with
the decrease of the altitude, particularly in the South sedimentary pool. This can be explained with a higher
frequency of these farms in the lowlands.
Table 5. Inventory of dairy sheep farms in an area of North Sardinia characterized by a soil of sedimentary
parent rocks.
Farms with N° Farms N° Heads Average farm Average
flock size of Total % Total % heard size elevation
< 100 339 26 13,632 4 40 222
100-300 529 41 106,097 31 201 258
300-500 238 19 91,290 26 384 259
500-700 101 8 59,332 17 587 236
> 700 75 6 76,034 22 1,014 177
Total 1,282 346,385 270 242
Table 6. Inventory of dairy sheep farms in an area of South Sardinia characterized by a soil of sedimentary
parent rocks.
Farms with N° Farms N° Heads Average farm Average
flock size of Total % Total % heard size elevation
< 100 464 26 19,902 4 43 214
100-300 679 38 130,345 26 192 208
300-500 361 20 137,463 27 381 171
500-700 135 8 79,111 16 586 161
> 700 134 8 140,664 28 1,050 141
Total 1,773 507,485 286 193
In the central part of the Island, where hills and mountain prevail, the proportion of farms with stock higher
than 500 decreases, being only 10% (corresponding to 32% of sheep stock) of the farms settled on
crystalline soil (Table 7) and 12% (32% of sheep stock) in those on a effusive soil (Table 8).
In these pools of farms, the main stock class is 100-300 with an average sheep number per farm of 229 and
267 on the granite-metamorphic and trachyte-basalt pools, respectively.
As expected, in general, altimetry is higher in these pools, with a numeric higher values in the farms settled
on crystalline soils.
It is worth noting that in the granite-metamorphic pool there is an opposite trend to what seen in the
lowland, with bigger farms on the highest altitude levels. This is not confirmed in the trachyte –basalt pool.
17Table 7. Inventory of dairy sheep farms in an area of Central Sardinia characterized by a soil of intrusive
(granite) and metamorphic parent rocks.
Farms with N° Farms N° Heads Average farm Average
flock size of Total % Total % heard size elevation
< 100 1,323 33.1 55,045 6.0 42 394
100-300 1,633 40.8 317,557 34.7 194 454
300-500 661 16.5 252,888 27.6 383 478
500-700 232 5.8 135,819 14.8 585 478
> 700 154 3.8 153,408 16.8 996 508
Total 4,003 914,717 229 442
Table 8. Inventory of dairy sheep farms in an area of Central Sardinia characterized by a soil of effusive
(mainly trachyte and basalt) parent rocks.
Farms with N° Farms N° Heads Average farm Average
flock size of Total % Total % flock size elevation
< 100 631 22.3 30,005 4.0 48 320
100-300 1,255 44.3 248,651 32.8 198 343
300-500 611 21.6 234,241 30.9 383 360
500-700 194 6.8 113,317 14.9 584 368
> 700 144 5.1 132,107 17.4 917 353
Total 2,835 758,321 267 344
Results on step 3 refer to areas (sub-pools) sketched in Figure 8.
18SN
IC
EC
SS
Figure 8. The sub-pools of sheep farms with homogeneous soil classes. SN is the “Nurra and Ozieri plain”
sub-pool based on sedimentary soils; EC is the “Marghine Belt” sub-pool based on effusive soils; IC is the
“Nuorese” sub-pool based on crystalline soils and SS is the “Campidano” sub-pool based on sedimentary
soils (geographic map modified from RAS, 2026; http://www.sardegnageoportale.it/).
19Descriptive analysis are summarized in tables 9 to 13.
The data in table 9 refer to the RAS (2017b) classification of soil use in the sub-pool areas above described
hereunder briefly termed as Nurra (SN: Nurra and Ozieri lowland), Campidano (SS), Nuorese (IC) and
Margine (EC). Overall, the sub-pool areas represent about 11% of Sardinia area.
The RAS (2017b) vegetation map layer shows that the sub-pool areas featured by the sedimentary soils, as
expected, are characterised by a high share of crops in irrigated arable land, which is the main class in both
Nurra (SN, 49%) and Campidano (SS, 75%). Including the non-irrigated crops, SN reaches 66% whereas SS
89% of total area.
Crop share decreases abruptly in the other two farm sub-pools being only 17% in the granite-metamorphic
sub-soil area (IC) and reaching an intermediate value in the sub-pool based on trachyte-basalt subsoil area
(EC). In these sub-pools the main classes are respectively the broad leaved forest (35.95%, mainly cork oak
forests) in the IC sub-pool and natural grassland (20.60%) in EC. In both sub-pools, maquis and garrigues
totalize c.a. 10% of the land share. Woodland based on cork and bushland are often grazed in the mountain
areas in Sardinia as well as in other Mediterranean areas. In Sardinia the grassland scattered with cork trees
is named “Pascolo arborato” or “Meriagos” (Puxeddu, Pintus and Pulina, 2008). This ecosystem is similar to
the Spanish “Dehesa” or the Portuguese “Montado”.
20Table 9. Land cover characterization of dairy sheep farms located in areas of Sardinia with different soil parent rocks (ha).
RAS code and description of land cover (2017b) Nurra and Ozieri lowlands Campidano (SS) Nuorese (IC) Marghine (EC)
(SN)
(ha) % (ha) % (ha) % (ha) %
2111 – Crops in non-irrigated arable land 8,364.65 9.51 7,012.34 11.35 3,767.60 6.13 5,750.13 11.17
2112 – Forage crops in non-irrigated arable land 6,552.96 7.45 1,914.99 3.10 3,975.32 6.46 6,859.44 13.33
2121 – Crops in irrigated arable land and open field vegetable gardens 43,070.95 48.95 46,103.66 74.65 2,769.48 4.50 5,072.53 9.86
231 – Permanent pastures 5,737.62 11.15
3111 - Broad-leaved forest 5,985.10 6.80 357.11 0.58 22,108.29 35.95 4,949.13 9.62
31121 – Eucaliptus, poplar, willow 154.32 0.18 1,220.56 1.98 0.04 0.00 4.30 0.01
31122 – Cork-oak forests 3,583.71 4.07 60.67 0.10 10,393.60 16.90 4,124.16 8.01
31124 – Other broad-leaved forest plants 10.92 0.02
3121 - Coniferous forest 154.40 0.18 14.22 0.02 545.71 0.89 49.32 0.10
313 - Mixed forest 128.81 0.15 245.08 0.40 56.81 0.11
321 - Natural grassland 6,146.97 6.99 1,360.84 2.2 3,208.82 5.22 10,601.20 20.60
3221 – Heathlands and moorlands 357.29 0.41 184.81 0.30 53.10 0.10
3222 – Riparian shrubland 271.88 0.31 200.04 0.32 32.51 0.05 9.77 0.02
3231 - Maquis 9,603.25 10.91 1,776.33 2.88 4,614.28 7.50 3,118.50 6.06
3232 - Garrigue 1,870.53 2.13 1,384.25 2.24 5,887.25 9.57 2,200.31 4.28
3241 – Young stands after cutting (and/or clear cuts) 1,706.11 1.94 120.53 0.20 653.06 1.06 2,706.47 5.26
3242 – Natural young stands 36.39 0.04 231.96 0.38 3,107.81 5.05 168.56 0.33
Total 87,987.31 61,757.4 61,504.5 51,461.3
21In the following tables the distribution of farms and sheep by stock classes is shown with reference to
Nurra (SN, Table 10) and Campidano (SS, Table 11). In these sub-pools the proportion of farms with a
size bigger than 500 sheep and the corresponding head number tends to be higher than in the source
pools. This is because sub-pools were selected in order to represent most of milk production in each
pool area. In both these sub-pools almost 50% of sheep are raised in big farms (> 500 sheep per farm).
Table 10. Inventory of a sample of dairy sheep farms in an area of North Sardinia (Nurra and Ozieri
lowland) characterized by sedimentary soil (SN-sub-pool).
Farms with flock N° Farms N° Heads Average farm
size of Total % Total % heard size
700 41 10 42,624 32 1040
Total 425 131,584 310
Table 11. Inventory of a sample of dairy sheep farms in an area of South Sardinia (Campidano)
characterized by sedimentary soil (SS sub-pool).
Farms with flock N° Farms N° Heads Average farm
size of Total % Total % heard size
< 100 69 20 2,846 2 41
100-300 123 36 24,861 22 202
300-500 82 24 31,107 27 379
500-700 38 11 22,635 20 596
> 700 32 9 33,237 29 1,039
Total 344 114,686 333
Also the sub-pools located in the hilly areas include a higher share of big farms than the parental pools,
although in this case the proportion of big farms was only 13% (29% of sheep) in the Nuorese (IC, Table
12) and 19% (41% of sheep) in the Marghine sub-pool (EC, Table 13).
22Table 12. Inventory of a sample of dairy sheep farms in an area of Central Eastern Sardinia (Nuorese)
characterized by crystalline soils.
Farms with flock N° Farms N° Heads Average farm
size of Total % Total % heard size
< 100 62 12.4 3,318 2.3 54
100-300 258 51.6 53,712 37.2 208
300-500 119 23.8 45,661 31.6 384
500-700 43 8.6 25,668 17.8 597
> 700 18 3.6 16,029 11.1 891
Total 500 144,388 289
Table 13. Inventory of a sample of dairy sheep farms in an area of Central Western Sardinia (Marghine)
characterized by effusive soils (mainly trachyte and basalt).
Farms with flock N° Farms N° Heads Average farm
size of Total % Total % heard size
700 30 7.4 28,926 21.0 964
Total 405 138,039 341
Interestingly, sub-pool farms located on the effusive soils were characterised also by a numerical higher
average sheep stock number per farm.
7. Outlook
In the next months, detailed data collected from the Regional Breeder Association (ARAS) will become
available. These data will be used i) to compare the sub-pools in terms of farm structure, input and
output; ii) to compute indicators of performance and efficiency within layer; iii) to identify candidate
farms featured by contrasting indicators within layer to be selected for the following steps (LCA analysis,
identification of hotspots and application of mitigation strategies). In parallel with this process, data on
cheese factories gathered by LAORE will be used to select the cheese factories to be submitted to
detailed LCA scrutiny. These dairy plants will be chosen on the basis of the following criteria: they
should fall in one of the sub-pool areas or anyway gather and process a relevant amount of milk sourced
from these areas; they should produce at least one of Sardinian PDO cheeses (at least one dairy plant
per PDO cheese type).
23References
Addis, M. Cabiddu, A., Decandia, M., Fiori, M., Spada, S. Bulleddu, C. Cammelli, R. Caria, A., Lai, V.
Lutzoni, G. Natale, A. Oppia, P. Pintus, C. Spiga, A. Piredda, G. Porqueddu, C. Molle, G. 2007. A survey
on the milk fatty acid composition of forty dairy sheep flocks in Sardinia. Italian Journal of Animal
Science, 6 (Suppl. 1), 532-534.
Aru, A., Baldaccini, P., Vacca, A., Delogu, G., Dessena, M.A., Madrau, S., Melis, R.T., Vacca, S. 1991. Nota
illustrativa alla carta dei suoli della Sardegna. Dipartimento di Scienze della Terra, Università degli Studi
di Cagliari, Assessorato regionale alla Programmazione Bilancio ed Assetto del Territorio, Cagliari, 83 pp.
Bodini, A., Cossu, Q.A., 2008. Analisi della piovosità in Ogliastra (Sardegna, Italia) nel periodo 1951-1999.
IMATI MI/4, CNR, 56 pp.
Bodini, A., Cossu, Q.A., 2010. Vulnerability assessment of Central-East Sardinia (Italy) to extreme rainfall
events. Nat. Hazards Earth Syst. Sci., 10, 61-72.
Caballero, R., Fernadez-Gonzalez, F., Molle, G., Roggero, P.P., Bagella, S., D’Ottavio, P., Papanastasis,
V.P., Fotidias, G., Sidiropoulou, A., Ispikoudis, I. 2009. Grazing systems and biodiversity in
Mediterranean areas: Spain, Italy and Greece. Pastos XXXIX, pp. 154.
Canu, S., Rosati, L., Fiori, M., Motroni, A., Filigheddu, R., Farris, E. 2015. Bioclimate map of Sardinia
(Italy), Journal of Maps 11:5, 711-718.
Chessa P., Delitala, A., 1997. Il Clima della Sardegna. Servizio Agrometeorologico Regionale, Sassari,
Italy, 200 pp.
CLAL, 2016, http://www.clal.it/index.php?section=formaggi_dop.
Costantini, E.A.C., L'Abate, G., Barbetti, R., Fantappié, M., Lorenzetti, R., Magini, S. 2012. Carta dei suoli
d’Italia, scala 1:1.000.000 (Soil map of Italy, scale 1:1,000,000) – Consiglio per ricerca e la
sperimentazione in agricoltura - S.EL.CA. Firenze, Italia.
Delitala, A.M., Cesari, D., Chessa, P.A., 2000. Precipitation over Sardinia (Italy) during the 1946-1993
rainy season and associated large-scale climatic variations. International Journal of Climatology 20, 519-
542.
Delitala, A., 2003. Le variazioni delle precipitazioni in Sardegna nel XX secolo. Atti Workshop “CLIMAGRI
– Cambiamenti Climatici e Agricoltura” Cagliari, 16-17 gennaio 2003, 47-54.
Furberg, M., Steyn, D.G., Baldi, M. 2002. The climatology of sea breezes on Sardinia. International
Journal of Climatology 22, 917-932.
Furesi, R., Madau, F.A., Pulina, P., 2013. Technical efficiency in the sheep dairy industry: an application
on the Sardinian (Italy) sector. Agricultural and Food Economics, 1:4. DOI: 10.1186/2193-7532-1-4.
24EUROSTAT, 2012. http://ec.europa.eu/eurostat.
Idda, L., Furesi, R., Pulina, P., 2010. Economia dell’allevamento ovino da latte. Produzione,
trasformazione, mercato. Franco Angeli, Milano (Italy) pp. 314.
INEA, 2010. Valutazione del rischio di salinizzazione dei suoli e di intrusione marina nelle aree costiere
delle regioni Meridionali in relazione agli usi irrigui. R. Napoli (ed.). INEA, pp. 232.
INEA, 2013. L’agricoltura in Sardegna, caratteristiche strutturali e risultati aziendali. Report 2013.
www.rica.inea.it/public/it/view_file.php?action=commenti_risultati_contab
ISMEA 2012. Italian institute for food and agricultural products. Database available at:
http://www.ismea.it/flex/cm/pages/ServeBLOB.php/L/IT/IDPagina/4173.
ISTAT 2010. 6° Censimento agricoltura 2010. http://www.istat.it/it/censimento-agricoltura/agricoltura-
2010.
ISTAT 2014. Annuario Statistico Italiano, Istituto nazionale di statistica, pp. 774. www.istat.it
ISTAT 2015. Annuario Statistico Italiano, Istituto nazionale di statistica, pp. 810. www.istat.it
ISTAT 2016. Annuario Statistico Italiano, Istituto nazionale di statistica, pp. 779. www.istat.it
ISTAT 2017. Zona altimetrica, Istat, http://www3.istat.it/cgi-bin/glossario/indice.pl
Natale, A., S.R. Sanna, P. Oppia, A. Carta and S. Ligios, 1999. Economic significance of some productive
traits in Sarda sheep farming systems. Proceedings of the meeting of the Sub-Network on Genetic
Resources of the FAO-CHIHEAM Inter-Regional Cooperative Research and Development Network on
Sheep and Goats, jointly organized by CIHEAM and FAO-REU, with the support of FAO-AGA, Zaragoza
(Spain), 18- 118 D. 20 November 1999, pp. 27-31.
National Database of Farms Animal 2016. https://www.vetinfo.sanita.it/
Paoli, J.C., 1997. Patrons and bergers sardes: origine et transformations d’un élevage ovin
méditerranéen. PhD thesis, pp. 377.
Porqueddu C., 2008. Low-input farming systems in southern Europe: the role of grasslands for
sustainable livestock production. In: Biala K., Terres J.M., Pointereau P. and Paracchini M.L. (eds.)
Proceedings of the JRC Summer University on ‘Low input farming systems: an opportunity to develop
sustainable agriculture’, Ronco (Italy) 2–5 July 2007, pp. 52–58.
PSR, Plan of Rural Development of Sardinia 2014-2020.,
http://www.regione.sardegna.it/speciali/programmasvilupporurale/psr-20142020
25Puddu, R., Fanni, S., Loddo, S., Manca, D., 2008. La salinizzazione dei suoli nelle piane agricole della
Sardegna. Distribuzione, intensità e valutazione del rischio. Pubblicazione AGRIS, 80 pagg., aprile 2008,
cod. ISBN 978-88-903404-1-3.
Puxeddu, M., Pintus, A., Pulina, G. 2008. I Meriagos: il confine tra prateria e foresta.
http://www.sardegnaagricoltura.it/documenti/14_43_20081014112126.pdf
RAS - Regione Autonoma della Sardegna, 2016. SardegnaGeoportale, Carta Geologica di base della
Sardegna in scala 1:25.000. http://www.sardegnageoportale.it/ (last access: november 2016).
RAS - Regione Autonoma della Sardegna, 2017a. SardegnaGeoportale, Modello Digitale di elevazione,
passo 10 metri. Available at: http://www.sardegnageoportale.it/
RAS - Regione Autonoma della Sardegna, 2017b. SardegnaGeoportale, Carta dell'Uso del Suolo in scala
1:25.000. http://www.sardegnageoportale.it/ (last access: january 2017).
Savona, P., 1983, Il settore lattiero-caseario in Sardegna Aspetti e Prospettive, Franco Angeli, Milano
(Italy), pp. 290 pp.
Secci, D., Patriche, C.V., Ursu, A., Sfîcă, L., 2010. Spatial interpolation of mean annual precipitations in
Sardinia. A comparative analysis of several methods. Geographia Technica, 1, 67-75.
Usai, M.G., Casu, S., Molle, G., Decandia, M., Ligios, S., Carta, A. 2006. Using cluster analysis to
characterize the goats farming system in Sardinia. Livestock Science 104, 63-76.
Vardabasso, 1972. Sguardo alle vicende geologiche della Sardegna, Fossataro, Cagliari (Italy), pp. 14.
26You can also read