A unique, exciting, global precious metals company - IR meeting presentation May 2020 - Vault
←
→
Page content transcription
If your browser does not render page correctly, please read the page content below
A unique, exciting,
    global precious
  metals company

IR meeting presentation

                 May 2020
Disclaimer

The information in this announcement may contain forward-looking statements within the meaning of the “safe harbour” provisions of the United States Private Securities Litigation
Reform Act of 1995. These forward-looking statements, including, among others, those relating to Sibanye Stillwater Limited’s (“Sibanye-Stillwater” or the “Group”) financial
positions, business strategies, plans and objectives of management for future operations, are necessarily estimates reflecting the best judgment of the senior management and
directors of Sibanye-Stillwater.

All statements other than statements of historical facts included in this announcement may be forward-looking statements. Forward-looking statements also often use words such
as “will”, “forecast”, “potential”, “estimate”, “expect” and words of similar meaning. By their nature, forward-looking statements involve risk and uncertainty because they relate to
future events and circumstances and should be considered in light of various important factors, including those set forth in this disclaimer. Readers are cautioned not to place
undue reliance on such statements.

The important factors that could cause Sibanye-Stillwater’s actual results, performance or achievements to differ materially from those in the forward-looking statements include,
among others, our future business prospects; financial positions; debt position and our ability to reduce debt leverage; business, political and social conditions in the United States,
South Africa, Zimbabwe and elsewhere; plans and objectives of management for future operations; our ability to obtain the benefits of any streaming arrangements or pipeline
financing; our ability to service our bond instruments; changes in assumptions underlying Sibanye-Stillwater’s estimation of their current mineral reserves and resources; the ability to
achieve anticipated efficiencies and other cost savings in connection with past, ongoing and future acquisitions, as well as at existing operations; our ability to achieve steady
state production at the Blitz project; the success of Sibanye-Stillwater’s business strategy; exploration and development activities; the ability of Sibanye-Stillwater to comply with
requirements that they operate in a sustainable manner; changes in the market price of gold, PGMs and/or uranium; the occurrence of hazards associated with underground and
surface gold, PGMs and uranium mining; the occurrence of labour disruptions and industrial action; the availability, terms and deployment of capital or credit; changes in relevant
government regulations, particularly environmental, tax, health and safety regulations and new legislation affecting water, mining, mineral rights and business ownership, including
any interpretations thereof which may be subject to dispute; the outcome and consequence of any potential or pending litigation or regulatory proceedings or other
environmental, health and safety issues; power disruptions, constraints and cost increases; supply chain shortages and increases in the price of production inputs; fluctuations in
exchange rates, currency devaluations, inflation and other macro-economic monetary policies; the occurrence of temporary stoppages of mines for safety incidents and
unplanned maintenance; the ability to hire and retain senior management or sufficient technically skilled employees, as well as their ability to achieve sufficient representation of
historically disadvantaged South Africans in management positions; failure of information technology and communications systems; the adequacy of insurance coverage; any
social unrest, sickness or natural or man-made disaster at informal settlements in the vicinity of some of Sibanye-Stillwater’s operations; and the impact of HIV, tuberculosis and the
spread of other contagious diseases, such as coronavirus (“COVID-19”). Further details of potential risks and uncertainties affecting Sibanye-Stillwater are described in Sibanye-
Stillwater’s filings with the Johannesburg Stock Exchange and the United States Securities and Exchange Commission, including the Integrated Annual Report and the Annual
Report on Form 20-F.

These forward-looking statements speak only as of the date of the content. Sibanye-Stillwater expressly disclaims any obligation or undertaking to update or revise any forward-
looking statement (except to the extent legally required).
                                                                                                                                                                                       2
A unique, diversified, global, precious metal company
Long life Reserves (70Moz), only 14% of                              US PGM contribution to Adj. EBITDA to                                                         Americas assets
          Resources (493Moz)                                              increase as Blitz ramps up

                                                                                                                                                                                                          Marathon project (49%)
                                                                                                 15%                                                                                                      with Generation mining
                          22%                                                                                             US PGM
                                                                              33%
                                                                                                                          East Boulder mine(100%)                                                         Denison project (80%)
   38%                                                                               Adj EBITDA1
              Reserves                                                                                                    Reserves: 10.2Moz 2E                                                            with Wallbridge Mining
                 (%)                                                                   (Rm %)
                                                                                                                          Stillwater mine(100%)                                                           Altar project (100%)
                2019                                                                  H2 2019                             Reserves: 16.7Moz 2E                                                            with Aldebaran (in
                                                                                                                                                                                                          Argentina)
                                               17%                                                52%
                        40%
                                                                  31%
                                                 Production                                                               SA PGM                             Southern African assets                      SA GOLD
                                                    (oz %)                                                                Mimosa (50%)                                                                    Cooke surface (100%)
                                                                                              SA gold (oz%)
                                                   H2 2019                                                                Reserves: 1.7Moz 4E                                                             Reserves: 0.1Moz Au
                                                                                              SA PGM (4E %)               Marikana (100%)4                                                                Kloof (100%)
                                               52%                                            US PGM (2E %)               Reserves: 9.2Moz 4E                                                             Reserves: 4.5Moz Au

                                                                                                                          Platinum Mile (91.7%)                                                           Driefontein (100%)
                                                                                                                          Reserves: n.a.                                                                  Reserves: 2.6Moz Au

   Shares in issue1                      2,675,009,860                                                                    Rustenburg (100%):                                                              DRDGOLD (50.1%)
   Shares in ADR form2                   549,995,384 (ADR ratio 1:4 ordinary share)                                       Reserves: 16.1Moz 4E                                                            Reserves: 2.2Moz Au
   Market cap¹                           R94 billion (US$5 billion)
                                                                                                                          Kroondal (50%)                                                                  Beatrix (100%)
   Listings                              JSE Limited share ticker: SSW                                                    Reserves: 1.2Moz 4E                                                             Reserves: 1.5Moz Au
                                         NYSE ADR programme share ticker: SBSW                                            Various SA PGM projects                                                         Various SA gold projects
                                                                                                                          Resources: 86.8Moz 4E                                                           Reserves: 4.5 Moz Au
                                                                                                                                                                                                          Resources: 44.3Moz Au

Geographically diversified, with unique precious metals mix and long life assets
¹ Shares in issue and market cap as at 8 May 2020 2 American depository receipts (ADRs) as at 17 April 2020 3 Definition as per debt covenants which includes 12 months pro-forma adjusted EBITDA of Marikana operations *The
Group reports adjusted earnings before interest, taxes, depreciation and amortisation (EBITDA) based on the formula included in the facility agreements for compliance with the debt covenant formula. For a reconciliation please   3
refer to the additional results disclosure available on https://www.sibanyestillwater.com/news-investors/
Update on operations in the light of COVID-19

• Anglo Platinum Force Majeure on 6 March               • The Safety, health and wellbeing of
  2020 due to converter outage affecting PGM              our employees, contractors and
  processing                                              communities is our primary concern
  - On 17 March 2020, agreed that material from         • Every effort continues to be made
    Rustenburg, Platinum mile, and 50% of Kroondal
                                                          to identify and minimise the risks
    would be processed at Marikana facilities started
    processing on similar terms                           posed by COVID-19 to employees
                                                          and contractors
• 25 March 2020 lockdown announced in SA
  due to COVID-19
  - SA operations placed on care and maintenance
    from 27 March to 14 April 2020
  - Limited mining (surface and related processing)
    commenced on 14 April 2020
  - From week of 20 April, SA operations stated to
    resume operations in a phased build-up to 50% of
    capacity (of workforce)
• US PGM operations operating with reduced
  contractor workforce
  - Non-essential capital growth capital suspended
  - Blitz project build-up affected

                                                                                                4
COVID-19 Actions and support in line with Group values, vision and purpose

                                                                       Employee
                                                 Employee wages
                            Contributions to                           donations
                                                    paid during
                           the SA relief funds                       matched by the
                                                 lockdown period
                                                                       company

                                                   Social relief        Schools and
                                                  food parcels,         education –
                           Support to local,
                                                   water tanks,       sanitisation and
                           small businesses
                                                  blankets and           catch-up
                                                    mattresses         programmes

                                      Health and safety        COVID-19
                                      preparedness and         awareness
                                           support           communication

                                                                                         5
Summary of COVID-19 contributions
Financial contributions                                                                                                                                   Total
Contributions to the SA national relief funds            Employee wages and benefits                        Employee volunteerism scheme                  R24.8 million
•  Solidarity fund                                       •  Wages and benefits paid to employees            • Up to R1.0million employee donations will   contributions
       •   Salary sacrifice by board and Executive =        during lockdown period = R1.5 billion             be matched by company = potential           + R1.5 billion
           R2.8 million                                  •  No obligation to pay even though no work          R2.0 million contribution                   wages
       •   Additional corporate donation =                  no pay would legally apply
           R12.0 million
•  SA Future Trust Fund
       • Corporate donation = R9.0 million

Local community support                                                                                                                                   Total
Support to local, small businesses                       Social relief                                      Schools and education                         R23.0 million
• CEO SMME fund (internal fund) to stimulate local       • 8,000 food parcels for indigent community        • School sanitisation and support for catch
  economic growth in local communities = R14.5             members = R4 million                               up programme in North West, Free State
  million                                                • 20 water tanks for communities around              and Gauteng = R3.0 million
• Focused spend on local suppliers for COVID               Marikana and donation of 600 blankets and
  related PPE (cloth PPE for employees` families and       mattresses for homeless shelters = R500,000
  old aged homes = R1.0 million

Health education and COVID-19 prevention support                                                                                                          Total
Health preparedness and support                          • Employee health preparedness                     COVID-19 awareness communication              R30.2 million
• PPE for health facilities in local clinics (masks,     • Conversion of hostels to quarantine facilities   • 10,000 leaflets with soaps delivered to
  gowns, gloves and boots) = R2.0 million                  in the Free State, West Rand and Rustenburg        communities
• Sanitisation of local health facilities, old age         = R2.9 million SA PGM + R2.0 million SA gold     • Radio slots in local media around our
  homes, taxi ranks and schools = R3.0 million           • Isolation facilities for employees at local        operations
• Tracing and screening of employees in labour             hospitals = R15.0 million
                                                                                                            • Community billboards around our
  sending areas and referrals for their families =R1.8   • Medical App to trace, screen and educate           operations
  million                                                  employees = R2.5 million annually
                                                         • Partnership with Gauteng Province on a           • Taxi rank communication
                                                           facility (isolation or treatment) in West Rand   • Total = R1.0 million

                                                                                                                                                                           6
Embedding ESG
in line with our purpose
       of improving lives
Our values define the way we do business – in the interests of all stakeholders

                                                OUR VISION

                                                                                         PURPOSE
                                          SUPERIOR VALUE CREATION
                                         FOR ALL OUR STAKEHOLDERS
                                           through the responsible
                                                                                        Our mining
                                            mining of our mineral
                                                                                       improves lives
                                                 resources

                                     •   Recognised the importance of all stakeholders to the success and
                                         sustainability of our business from the start – superior value creation
                                         for all of our stakeholders

                                     •   26 August 2019: 181 CEO’s of the Business Round table in the United
                                         States released a statement on “the Purpose of a Corporation”
                                         which moves away from shareholder primacy and includes a
                                         commitment to lead companies for the benefit of all stakeholders
                                                                                                                   8
Environmental, social and governance (ESG) – a key strategic focus

                                                            STRATEGIC THEMES

        ENVIRONMENTAL                  SOCIAL                                                                               GOVERNANCE

 Promoting natural resources         COMMUNITIES            STAKEHOLDER ENGAGEMENT          SAFETY AND HEALTH       Respecting human rights of
 and improving life -                                                                                               stakeholders and doing our
                               Unlocking the potential of   Our stakeholders will be    Aiming to improve the
 sustainable use through                                                                                            business with integrity and
                               communities affected by      heard through transparent   holistic wellbeing of our
 increased environmental                                                                                            from an ethical foundation
                               our operations through       engagements and             workforce through the
 consciousness and continual                                                                                        by adherence to good
                               economic empowerment,        incorporating the           pursuit of risk-based
 improvement, minimising                                                                                            governance principles and
                               institutional development    knowledge gained into       monitoring of safety and
 environmental impacts and                                                                                          legal compliance
                               and creating local benefit   our business                health factors and
 a measured transition to a
                               that inspires sustainable                                improvement in safety
 low carbon future
                               living                                                   and health performance.

 ESG

Creating sustainable value
                                                                                                                                                  9
E SG – our products combat climate change

 Auto                                              Renewable energy generation                  Alternative power generation
 catalysts                                         and conservation                             and storage

 Platinum (Pt), palladium (Pd) and rhodium         Ruthenium(Ru) a component of wind            Pt’s unique catalytic properties make it an
 (Rh) - unique catalytic properties transform      turbine blades and high-quality glass for    essential component of the hydrogen
 noxious exhaust gasses - hydrocarbons (HC),       photo voltaic (solar) panels                 economy.
 nitrogen oxide (NOx) and carbon monoxide
 (CO) - into more benign components                Rh utilised in energy efficient fiberglass   An environmentally friendly source of
 (water (H2O), carbon dioxide (CO2) and            which is widely used as an insulating        energy - Pt’s conductivity makes it ideal for
 nitrogen gas (N2))                                material to reduce heat loss                 the electrolysis of hydrogen from water
                                                                                                 • Hydrogen fuel cells – an efficient and
 One of the world's largest recycler of auto                                                       environmentally friendly alternative for
 catalysts – re-use of critical metals. Treating                                                   generating electricity
 more recycled ounces than mined ounces
 in the US operations

Making a difference – one PGM ounce at a time
                                                                                                                                                10
E SG –Improving our leading safety performance
Fatal injury frequency rate* (SA gold operations)
• Industry leading safety performance in 2019 0.25
- SA gold fatality free since Aug 2018 0.20
- 620 days – 11.5 million fatality free shifts (on 6 May 2020) 0.15
• US PGM operations fatality free since Oct 2011 0.10
• Sibanye-Stillwater peer recognition 0.05
0.065 0.108 0.086 0.237 0.000 0.000
- SAMI Safety and health excellence awards 0.00
› JT Ryan Award - mining company with the best safety 2015 2016 2017 2018 2019 Q1 2020
improvement
› Platinum - 1st place: Bathopele operations and
Fatal injury frequency rate* (Group)
3rd place: Kroondal West 0.18
0.16
› Processing - 1st place: ChromTech at the SA PGM
0.14
operations and 2nd place: Precious Metals Refinery 0.12
in South Africa 0.10
0.08
• SA PGM operations regrettably had 4 fatalities during 0.06
Q1 2020 0.04
0.02 0.060 0.100 0.070 0.161 0.036 0.084
0.00
2015 2016 2017 2018 2019 Q1 2020
Source: Company information. * Per million hours worked 11E SG – through our Zero harm strategic framework
OUR VALUES
ENABLING ENVIRONMENT • Real risk reduction initiatives ongoing
Aim to maintain – Working place layout improvements
Commitment a safe working environment with › Focus on the elimination of ‘A’ Hazards
equipment, tools and material that – Infrastructure improvement
enable sustainably safe production › Rail-bound equipment safety enhancements
– Rock mass management
Accountability
EMPOWERED PEOPLE
LEADERSHIP
ENGAGED
• Safe Production leadership and culture
Continue to train – Individual, team and organisation
people to apply relevant standards – Mirror sessions at SA gold operations
Respect and procedures to work safely – Values-based decisions intervention
• Safety days
– Section 23 withdrawals reinforcement
FIT-FOR-PURPOSE SYSTEMS • Bow-tie risk management process • Enhanced Trigger Action Response Plan
Enabling
Subscribing to international best practice introduced (TARP) for improved rock mass
principles and integrated systems with a – University of Queensland coaching management
sessions on critical controls • ISO 45001 Occupational Health & Safety
view to certification in the longer term
– Root cause analysis Management System implementation on
• Independent high potential incident reviews track
Safety • Life-saving rules introduced • ICMM membership
OUR VALUES
12A new base established
2013 – 2019:
creating a leading
precious metal companyTo build this unique Group we had to transform significantly over 6 years
2013¹ Market cap: • Reduced costs
• Improved flexibility and quality of mining
US$1.2bn (R10bn) • Substantial increase in reserves enhanced by synergistic acquisitions
Perceived high • Significantly extended operating life
cost, short life SA • Included Cooke and Wits gold acquisitions
gold company • Reduced debt/gearing
• Delivered consistent, industry leading returns
• Significant PGM acquisitions (Aquarius and Rustenburg operations in 2016) at the
bottom of the PGM price cycle
Value accretive • Innovatively financed strategic growth enhancing value
and high quality • Implementation of operating model and realisation of consolidation synergies
PGM acquisitions yielding superior value ahead of schedule
• Acquisition of Stillwater (located in Montana, United States) in May 2017 was
transformative, creating a globally competitive and unique SA mining company
• Unique commodity mix and global geographic presence
A major, global • Lonmin acquisition in June 2019 concluded 4th step in PGM strategy
precious metal • Secures entire beneficiation chain in SA as well as providing significant optionality to
company PGM prices
• Acquired SFA (Oxford) to fast track and build internal competencies and knowledge
2020² Market relating to power train technology, related metals and battery metal technology
cap: • Acquired 50.1% in DRDGOLD, a listed company Specialist mining company delivering
US$5bn/ R94bn value through re-treatment of legacy surface tailings
• Well positioned for further value creation
Delivering value while diversifying risk at the bottom of the cycle
¹ 11 February 2013, Source: IRESS
² 8 May 2020, Source: IRESS 14Significant transformation into a leading, global precious metals company
Sibanye-Stillwater global PGM ranking – Primary production
2018A platinum 2018A palladium
production (Moz) production (Moz)
Sibanye-Stillwater² 1.48 Norilsk¹ 2.73
Sibanye-Stillwater² 1.13
Amplats¹ 1.32
Amplats¹ 1.01
Impala¹,* 1.31
Impala¹ 0.82
Norilsk¹ 0.65
North American Palladium¹ 0.22
Northam¹ 0.30
Northam¹ 0.14
RBPlats¹ 0.26 RBPlats¹ 0.11
Source: Company filings
Notes:
1. Peer group information using public company filings with platinum, palladium and rhodium reflect primary production (where available) for 2018 actual. RBPlats based on H1 2019 production. Impala does not
disclose primary production for palladium and therefore a similar ratio as the platinum primary production to total production was assumed. North American Palladium also does not disclose primary production
for palladium therefore total production was used
2. 2018 full year production from Sibanye – Stillwater proforma Lonmin (Sep 2018 annuals) excluding recycling volumes
* Impala’s production represent the June 2019 year-end results issued on 5 September 2019
Positioned globally as a leading precious metals producer
15Significant transformation into a leading, global precious metals company
Sibanye-Stillwater global PGM ranking – Primary production Sibanye-Stillwater global gold ranking
2018A rhodium 2018A gold and gold equivalents production (Moz)
production (Koz)
Sibanye-Stillwater²
Newmont Goldcorp¹ 7.40
196
Barrick¹ 5.81
Amplats¹ 178
Sibanye-Stillwater² # 3.64
Impala¹,* 164 AngloGold¹ 3.40
Kinross¹ 2.48
Northam¹ 44
Polyus¹ 2.44
RBPlats¹ 21 Freeport-McMoRan¹ 2.44
Gold produced
Gold equivalents
Source: Company filings
Notes:
1. Peer group information using public company filings with platinum, palladium and rhodium reflect primary production (where available) for 2018 actual. RBPlats based on H1 2019 production. Impala does not
disclose primary production for rhodium therefore a similar ratio for platinum primary production to total production was assumed
2. 2018 full year production from Sibanye – Stillwater proforma Lonmin (Sep 2018 annuals) excluding recycling volumes
# Gold equivalents calculated using a PGM basket price of R473,548/kg and gold price of R552,526/kg
* Impala’s production represent the June 2019 year-end results issued on 5 September 2019
Positioned globally as a leading precious metals producer
16…with quality assets and abundant reserves and resources*
Reserves Resources
2019:
2019:
70Moz 1%
3% 494Moz
18% 16%
4% 6% 26% 2%
40%
41% 8%
38%
32% 2018: 2018: 3% 10%
63Moz 309Moz 10%
31%
7% 16%
16% 9%
0%
44%
7%
12%
DRDGOLD US PGM operations Americas projects (PGM&Au)
SA gold operations Gold projects SA PGM operations
SA PGM projects
SA PGM projects at Marikana add future optionality
Source: Company information
* Mineral Reserves and Mineral Resources are declared as at 31 December 2019, based on three year trailing price averages and currently a significant discount to spot prices 17Building a leading PGM company…
• Built a leading and influential PGM business at a favourable stage
in the precious metals cycle for a total of US$3bn1 (R43.0 bn) within four years
US$269m1 (R4.0bn) for Aquarius in Apr 2016
US$331m1 (R4.5bn²) for Rustenburg in Nov 2016
US$2.2bn (R30bn1) for Stillwater in May 2017
US$290m1 (R4.3bn³) for Lonmin in June 2019
…. by successfully building a leading global PGM business through well priced transactions
1. Exchange rate applied to acquisition prices: Aquarius at US$/R14.87 on 12 April 2016, Rustenburg at US$/R13.60 on 1 Nov 2016, Stillwater at US$/R13.64 on 4 May 2017 and Lonmin at US$/R14.83 on 10 June 2019
2. Minimum payment of R4.5 billion (R1.5bn upfront payment made). Balance settled from 35% of free cash flows from the Rustenburg operations
3. Estimate purchase price (not accounting value) of the Lonmin transaction based on Lonmin share capital figure of 290,394,531 shares in fixed ratio of 1:1 resulting in 290,394,531 18
new Sibanye- Stillwater shares. Considerations estimate based on spot Sibanye-Stillwater closing share price on the JSE of R14.83 per share on 7 June 2019…value accretive acquisitions at a low point in the commodity price cycle
300
Aquarius and Stillwater DRDGOLD Lonmin
250 Rustenburg transaction transaction transaction
transactions announced - announced - announced –
Relative price performance (%)
announced - US$/2E basket R/kg gold R/4E basket
200 R/4E basket price up 170% price up 29% price up 145%
price up 180% since
171%
150
130%
109%
100
97%
50 48%
0
-50
Gold US$/oz Gold R/kg PGM basket (R/4Eoz) PGM basket (US$/4Eoz) PGM basket (US$/2Eoz)
PGM prices significantly outperforming the gold price – US$/oz 4E/2E basket prices are more than 45% higher than US$ gold price
19
Source: IRESSSibanye-Stillwater is well positioned
US PGM operations
7%
35%
Group PGM 2019 Palladium 46% 2019 Platinum
production 51% supply supply
42% 54%
H2 2019
65%
Pt Pd Rh Primary supply Secondary supply Primary supply Secondary supply
(mined) (recycled) (mined) (recycled)
• Relative to its peers, Sibanye-Stillwater • Sibanye-Stillwater is one of the world’s leading recyclers of PGMs
has a production prill split that is most • Recycling plays an increasingly important role in ESG
closely aligned to global demand
Source: Company data 20Balanced portfolio positioned to excel and underpinned by fundamentals
Group (excl. SA gold operations) SA PGM operations US PGM operations
100%
86%
78%
80%
59%
60%
50%
46%
41% 36%
40% 34%
30% 29%
30%
22%
22%
20% 14%
9%
7%
1% 1% 2% 2%
0%
Platinum Palladium Rhodium Gold Platinum Palladium Rhodium Gold Platinum Palladium
First bar: Metal produced as a % of 4E/2E basket Second bar: Average revenue % contribution based on basket price per metal
Geographical and product diversification providing a balanced exposure to metal prices and the risk profile
1. The Group reports adjusted earnings before interest, taxes, depreciation and amortisation (EBITDA) based on the formula included in the facility agreements for compliance with the debt covenant
formula. For a reconciliation of profit/loss before royalties and tax to adjusted EBITDA, see note 11 of the relevant notes in the condensed consolidated provisional financial statements 21
*Calculations based on H2 2019 production and average basket prices for H2 2019Q1 2020 Operating
updateKey statistics Q1 2020
US dollar SA rand
Quarter ended Quarter ended
Mar 2019 Dec 2019 Mar 2020 KEY STATISTICS Mar 2020 Dec 2019 Mar 2019
UNITED STATES (US) OPERATIONS
PGM operations1
130 899 161 849 141 585 oz 2E PGM production2 kg 4 404 5 034 4 071
201 289 229 540 221 798 oz PGM recycling1 kg 6 899 7 140 6 261
1 305 1 609 2 053 US$/2Eoz Average basket price R/2Eoz 31 569 23 684 18 283
104.6 171.4 133.8 US$m Adjusted EBITDA3 Rm 2 058.6 2 522.5 1 465.9
27 28 30 % Adjusted EBITDA margin3 % 30 28 27
833 798 894 US$/2Eoz All-in sustaining cost4 R/2Eoz 13 756 11 747 11 671
SOUTHERN AFRICA (SA) OPERATIONS
PGM operations5
263 508 461 719 418 072 oz 4E PGM production2 kg 13 004 14 361 8 196
1 221 1 600 2 158 US$/4Eoz Average basket price R/4Eoz 33 192 23 558 17 104
62.8 259.7 523.0 US$m Adjusted EBITDA3 Rm 8 043.1 3 822.7 880.0
51 39 51 % Adjusted EBITDA margin3 % 51 39 51
845 1 040 1 089 US$/4Eoz All-in sustaining cost4 R/4Eoz 16 745 15 309 11 841
Gold operations
143 278 300 578 238 076 oz Gold production kg 7 405 9 349 4 456
1 306 1 415 1 608 US$/oz Average gold price R/kg 795 323 669 797 588 040
(115.0) 76.4 73.2 US$m Adjusted EBITDA3 Rm 1 125.8 1 125.1 (1 611.4)
(63) 17 19 % Adjusted EBITDA margin3 % 19 17 (63)
2 030 1 314 1 500 US$/oz All-in sustaining cost4 R/kg 741 858 621 943 914 590
GROUP
57.7 502.8 723.8 US$m Adjusted EBITDA3,6 Rm 11 131.8 7 401.4 808.0
14.01 14.72 15.38 R/US$ Average exchange rate
1 The US PGM operations’ underground production is converted to metric tonnes and kilograms, and performance is translated to SA rand. In addition to the US PGM operations’ underground production, the operation treats
recycling material which is excluded from the 2E PGM production, average basket price and All-in sustaining cost statistics shown. PGM recycling represents palladium, platinum, and rhodium ounces fed to the furnace
2 Platinum Group Metals (PGM) production in the SA operations (including attributable production from Mimosa) is principally platinum, palladium, rhodium and gold, referred to as 4E (3PGM+Au). The US operations primarily
produce palladium and platinum, referred to as 2E (2PGM)
3 The Group reports adjusted earnings before interest, taxes, depreciation and amortisation (EBITDA) based on the formula included in the facility agreements for compliance with the debt covenant formula. Adjusted EBITDA may
not be comparable to similarly titled measures of other companies. Adjusted EBITDA is not a measure of performance under IFRS and should be considered in addition to and not as a substitute for other measures of financial
performance and liquidity. Adjusted EBITDA margin is calculated by dividing adjusted EBITDA by revenue
4 See “salient features and cost benchmarks for the quarters” for the definition of All-in sustaining cost
5 The SA PGM operations’ results for the quarter ended 31 March 2019 excluded the Marikana operations 23
6 The Group adjusted EBITDA includes the impact of the streaming transaction which is only recognised at the Corporate levelBenefits of strategic transformation clearly apparent (Rm)
Profitability (adjusted EBITDA1 Rm) and R/US$ exchange rate
12 000 16
10 000
15
8 000
14
6 000
R million
R:US$
4 000 13
2 000
12
0
11
(2 000)
(4 000) 10
Q1 2018 Q2 2018 Q3 2018 Q4 2018 Q1 2019 Q2 2019 Q3 2019 Q4 2019 Q1 2020
SA Gold SA PGM US PGM Average rand: US dollar exchange rate (RHS)
Record
Source: R11 billion
Company quarterly adjusted EBITDA1 achieved in Q1 2020
results information
1. The Group reports adjusted earnings before interest, taxes, depreciation and amortisation (EBITDA) based on the formula included in the facility agreements for compliance with the debt covenant
formula. For a reconciliation of profit/loss before royalties and tax to adjusted EBITDA, see note 11 of the relevant notes in the condensed consolidated provisional financial statements 24
Note: Q4 2018, Q1 2019, Q2 2019 at the SA gold operations have been impacted by the five month gold strike from Nov 2018 to April 2019 with subsequent gradual build up to new normalised levelsBenefits of strategic transformation clearly apparent (US$m)
Profitability (adjusted EBITDA1 US$m) and R/US$ exchange rate
800 16
700
15
600
500
14
US$ million
400
R:US$
300 13
200
12
100
0
11
(100)
(200) 10
Q1 2018 Q2 2018 Q3 2018 Q4 2018 Q1 2019 Q2 2019 Q3 2019 Q4 2019 Q1 2020
SA Gold SA PGM US PGM Average rand: US dollar exchange rate (RHS)
Record
Source: US$724
Company resultsmillion quarterly adjusted EBITDA1 achieved in Q1 2020
information
1. The Group reports adjusted earnings before interest, taxes, depreciation and amortisation (EBITDA) based on the formula included in the facility agreements for compliance with the debt covenant
formula. For a reconciliation of profit/loss before royalties and tax to adjusted EBITDA, see note 11 of the relevant notes in the condensed consolidated provisional financial statements 25
Note: Q4 2018, Q1 2019, Q2 2019 at the SA gold operations have been impacted by the five month gold strike from Nov 2018 to April 2019 with subsequent gradual build up to new normalised levelsUpdate on recent acquisitions
Integration of Marikana progressing well
                                                              10 Dec
                                                              CCMA                      Jan 2020
                                 25 Sep                     consultation               Workforce                      Aug 2020E
  10 Jun                       Issued S189                    process                   transition                   Operational
  Day 1                           notice                     complete                  concluded                     stabilisation

                 14 Jun                            15 Nov                  Marikana                    Jul 2020E
               AMCU sets                        Signed                     Christmas                    System
                 wage                           wage                        Break                     integration
                demand                        agreement                                                complete

Day 1-180 functional stream plan execution                                              Evaluation of projects (K4, Newman and Pandora)

Change and stakeholder impact assessment                                                Continued stakeholder engagement

Synergy Initiative identification and evaluation                                        Synergy initiative monthly tracking and reporting

Management of interdependencies and risks across functional streams                     Integration management office (IMO) milestone
                                                                                        achievement tracking
Signed wage agreement and completion of restructuring (closure of the
Generation 1 shafts)

Delivery of anticipated synergies on track and ahead of initial expectations
                                                                                                                                            27
…annualised synergies from Marikana (Lonmin) surpassing initial estimates
Estimated
Initial benefits Realised benefits annual
identified since acquisition benefits
Category Summary of key initiatives (Rm) (Rm) (Rm)*
Closure of London offices • Corporate rationalisation (closing London office and delisting) 138 17 198
Operating (mine) and • Employees and management configured to reflect the 374 68 818
regional shared services Sibanye-Stillwater operating model
synergies (Labour savings) • Consolidation of duplicated production and support functions
Optimal use of surface • Footprint reduction 125 74 127
infrastructure • Concentrator consolidation/optimisation
Sourcing and stores • Improved procurement and supply chain management 30 4 7
management
ICT • Payroll system aligned to Sibanye-Stillwater 63 5 20
• SAP system consolidation for South Africa
• Infrastructure consolidation
Other • Functional optimisation 0 12 33
Total • Savings R730m per annum R180m R1.2bn
(over 3 - 4 years) (over 7 months) (2020)
Additional possible savings • Processing synergies 550 0 0
Financing cost savings • Refinancing of the $169 million Lonmin PIM Prepay 0 120 210
Expected to realise 65% more annualised cost savings for the 2020 year
*Expected annual benefits have been calculated based on the current Marikana integration process
28Global PGM cost curve (cash cost + capital)
Global PGM cash cost & capital curve (CY19E - at spot)
Cumulative annual production (4E Koz)
499 999 1 499 1 999 2 499 2 999 3 499 3 999 4 499 4 999 5 499 5 999 6 499 6 999 7 499 7 999 8 499
2 500 2 500
2 250 Spot PGM Basket price received 2 250
Cash cost and basket Price (USD/oz)
2 000 2 000
Marikana to move
1 750 down the cost curve 1 750
as savings are
1 500 1 500
realised
1 250 1 250
1 000 1 000
750 750
500 500
250 250
- -
Zondereinde (NHM)
Impala Mine (IMP)
Kroondal (SGL/AMS)
BRPM (RBP)
Modikwa (ARM/AMS)
Mogalakwena (AMS)
Union (SIY)
Unki (AMS)
Sylvania Dumps (SLP)
Zimplats (IMP)
Mototolo (GLEN/AMS)
Marula (IMP)
Two Rivers (ARM/IMP)
Mimosa (IMP/SGL)
Amandelbult (AMS)
Rustenburg (SGL)
Boulder (SGL)
Booysendal (NHM)
Stillwater (SGL)*
Marikana (SGL)
LDI (IMP)
Realisation of synergies to move Marikana down the cost curve
Source: Nedbank, February 2020
*Excludes current growth capital from Blitz 29Strategic stake in DRDGOLD - ESG focused dump retreatment specialist
• About DRDGOLD • A strategic investment with a strong commercial
underpin
- Specialist mining company delivering value
through re-treatment of legacy surface tailings - 50.1% shareholding in listed entity currently worth
R7.5 billion (US$410 million)
- Reduces environmental liabilities and potential
- Vended in selected surface assets for 38.05% stake
health risks for surrounding communities
› No value attributed to assets by market
- For more information, refer to
https://www.drdgold.com › Significant future rehabilitation liability and expense
- Paid cash of R1.1 billion ((US$76 million) to increase
stake to 50.1% on 22 Jan 2020
› Price paid R6.46 per share versus current price R17.97*
value uplift = R1.94 billion
- Dividends received to date: R52m (Aug 2019) and
R108m (US$7.2 million) (Feb 2020)
Delivering value while addressing environmental liabilities
* DRDGOLD share price on 9 May 2020 30Intellectual capacity into tomorrow’s metals - SFA Oxford acquisition
• About SFA (Oxford) - Acquired in March 2019
- World-renowned authority on - Expected an update on work done on battery metals for Sibanye-
platinum-group metals and Stillwater in Q2 2020
provides in-depth market
- In-depth market research and integrity are underpinned by extensive
intelligence on battery raw
consulting from mine to market to recycler
materials and precious
metals for industrial, - Unrivalled understanding of industry dynamics
automotive, and smart city
technologies, as well as on SFA works across the whole industry value chain
jewellery and investment
trends
- For more information refer to
https://www.sfa-oxford.com/
Fast tracking our PGM insights & technology
31Borrowings and
leverageDeleveraging continues
Net debt to adjusted EBITDA1 US$m • Continued de-leveraging
- Net debt reduced to US$1,125 million
(R20 billion), from US$1,497 million (R21
$2 500 3.5 billion) in December 2019
- Net debt: adjusted EBITDA reduced
3.0 to 0.75x, from 1.25x in December 2019
$2 000
2.5 • Factors impacting on leverage
$1 500
during the Q1 2020
US$ million
2.0
x
- Whilst the US$ value of debt has
$1 000 reduced by US$372 million, Rand
1.5 weakness has increased the reported
Rand value of the predominantly US$
debt
$500
1.0
- This includes a downwards
revaluation of the CB’s due to share
$0 0.5 price weakness reducing debt by
US$211 million
Jun 17 Sep 17 Dec 17 Mar 18 Jun 18 Sep 18 Dec 18 Mar 19 Jun 19 Sep 19 Dec 19 Mar 20
- Significant abnormal inventory build
Net debt excl Convertible bond (lhs) Convertible bond (lhs) up during the quarter has utilised
approximately US$200 million of cash
Net debt: Adjusted EBITDA (rhs) Covenant limit (rhs) that should be available for
application towards debt during the
remainder of the year
Net debt reduced to US$1,125 million (R20 billion) with ND:EBITDA of 0.75x as at 31 March 2019
1. The Group reports adjusted earnings before interest, taxes, depreciation and amortisation (EBITDA) based on the formula included in the facility agreements for compliance with the debt covenant
formula. For a reconciliation of profit/loss before royalties and tax to adjusted EBITDA, see note 11 of the relevant notes in the condensed consolidated provisional financial statements
2. For covenant calculations Marikana’s pro forma EBITDA is utilised (i.e. adjusted to represent a full 12-month period, rather than 10 month as consolidated for accounting purposes) in order to more 33
accurately represent the enlarged entity post an acquisitionVery limited debt maturities during 2020 and 2021
• Net debt reduced to US$1,125 million at 31
March 2020, from US$1,497 million at 31
Debt maturity ladder (i.e. Capital repayment profile) as at 31 March 2020 December 2019
$2 500
- US$372 million quarterly reduction includes
a US$211 million downwards revaluation of
$2 000
$345 the CB’s
$1 500 $882 - RCF’s were mostly drawn during March
$413
2020 to ensure simple access to liquidity,
$368 $12 with net cash on hand of US$882 million
US$ million
$1 000 $2 007
(R15.7 billion) at 31 March 2020
$354
$500 $1 125 • The remaining one year extension of the USD
$308
RCF’s maturity is awaiting final approval, with
$74
$0 $147 five of eight lenders having approved the
extension to April 2023
-$500 • The ZAR RCF includes two one-year extension
2020 2021 2022 2023 2024 2025 Gross debt Net cash Net debt Committed options, the first of which would be considered
(incl drawn Undrawn
overdrafts) facilities by the lenders in October 2020. This could
ultimately extend the ZAR RCF maturity date to
November 2024
$600m USD RCF R5.5bn ZAR RCF $354m 6.125% 2022 bonds
$384m 1.875% 2023 convertible $347m 7.125% 2025 bonds Gross or Net debt
• The soft call option on the 2023 CB’s at
approximately R36/share (US$2.03/share) may
Net cash (incl drawn overdrafts) Committed undrawn facilities
allow for conversion after October 2020,
reducing net debt and 2023 maturities
Next meaningful maturity being the US$354 million (R6.3 billion) June 2022 bond’s
1. Graph indicates book values 34
2. Net cash includes drawn overdrafts (i.e. gross cash of US$917 million less drawn overdrafts of US$35 million results in net cash of US$882 million at 31 March 2020)Strategy and share
performance
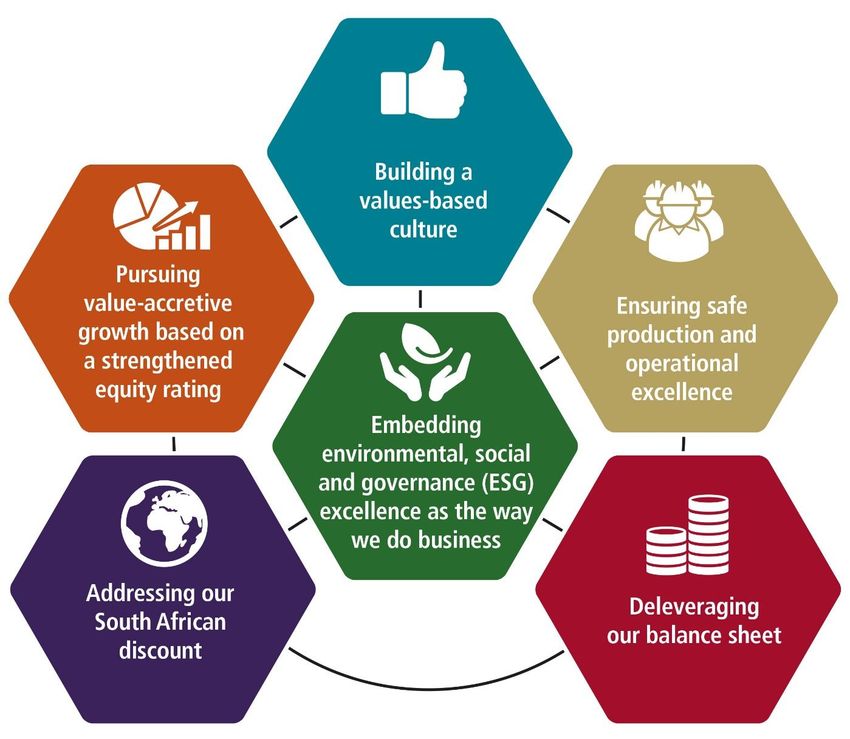
ConclusionOur strategic focus areas
Strengthen our position
as a leading international
precious metals mining
company by:
Significant progress made in 2019 addressing investor strategic concerns
36Strong shareholder value creation returns – intention to resume dividends*
• Significant value created 300 Relative share price performance
by share price increase
• Outperformed peers over 250
14 months but came off
low base
200
• PGM stocks significantly
outperforming gold stocks
150
• Previous discount related
to safety incidents in 2018, %
100
five months gold strike, high
gearing and delayed
Lonmin transaction 50
0
Jun-19 Jul-19 Aug-19 Sep-19 Oct-19 Nov-19 Dec-19 Jan-20 Feb-20 Mar-20 Apr-20 May-20
-50
Sibanye-Stillwater AngloGold Gold Fields Harmony FTSE/JSE ALSI AngloPlat Implats
Source: IRESS
* Intention to pay dividends, depending on impacts of COVID-19 and subject to current commodity prices, ongoing management review and approval by the Board 37Questions?
Contacts
James Wellsted/ Henrika Ninham/Chris Law
ir@sibanyestillwater.com
Tel:+27(0)83 453 4014/ +27(0)72 448 5910/ +44 (0)7923126200
JSE: SGL ticker changed to SSW from 19 February 2020
NYSE: Ticker SBGL changed to SBSW on 24 February 2020Competent persons’ declaration
For the United States Region operations, the lead competent person designated in terms of the SAMREC Code, who takes responsibility for the consolidation and reporting of the Stillwater
and East Boulder Mineral Resources and Mineral Reserves, and for the overall regulatory compliance of these figures, is Brent LaMoure, who gave his consent for the disclosure of the 2019
Mineral Resources and Mineral Reserves Statement. Brent [B.Sc Mining Eng] is registered with the Mining and Metallurgical Society of America (01363QP) and has 25 years’ experience
relative to the type and style of mineral deposit under consideration. Brent is an ex permanent employee of Sibanye-Stillwater and is currently a Contract Ore Reserve Manager to the
company.
For Resource estimation for the project in the Americas, the competent persons are Stanford Foy (Altar and Rio Grande) and Rodney N Thomas (Marathon). Stan is a full-time employee of
Aldebaran Resources Inc. and a consultant to Sibanye-Stillwater, is registered with the Society for Mining, Metallurgy and Exploration Inc. (4140727RM) and has 28 years’ experience relative
to the type and style of mineral deposit under consideration. Rodney is registered with the Society for Professional Geoscientists (Ontario) and has 40 years’ mineral industry experience,
including several years relative to the type and style of mineral deposit under consideration and is a full-time employee and the designated Qualified Person for Generation Mining Limited.
For the Southern African Platinum Operations, the lead competent person designated in terms of the SAMREC Code, who takes responsibility for the consolidation and reporting of the SA
Platinum Operations Mineral Resources and Mineral Reserves, and for the overall regulatory compliance of these figures, is Andrew Brown, who gave his consent for the disclosure of the
2019 Mineral Resources and Mineral Reserves Statement. Andrew [M.Sc Mining Eng] is registered with SAIMM (705060) and has 36 years’ experience relative to the type and style of mineral
deposit under consideration. Andrew is a full-time, permanent employee of Sibanye-Stillwater.
For the Southern African Gold Operations, the lead competent person designated in terms of the SAMREC Code, with responsibility for the consolidation and reporting of the SA Gold
Operations Mineral Resources and Mineral Reserves, and for overall regulatory compliance of these figures, is Gerhard Janse van Vuuren, who gave his consent for the disclosure of the
2019 Mineral Resources and Mineral Reserves Statement. Gerhard [GDE (Mining Eng), MBA, MSCC and B. Tech (MRM)] is registered with SAIMM (706705) and has 32 years’ experience
relative to the type and style of mineral deposit under consideration. Gerhard is a full-time, permanent employee of Sibanye-Stillwater.
For the 38.05% attributable portion (as at 31 December 2019) of the DRDGOLD current surface tailings operations includes the ERGO and FWGR operations, the company was reliant on
external competent persons as follows: For the ERGO Mineral Resources the Competent Person designated in terms of SAMREC is Mr M Mudau, MSc Eng, Pr. Sci. Nat., the Resource
Geology Manager at the RVN Group. The Competent Person designated in terms of SAMREC who takes responsibility for the reporting of the surface Mineral Reserves, is Professor S
Rupprecht, Principal Mining Engineer of the RVN Group. The Competent Person designated in terms of SAMREC who takes responsibility for the reporting of the Mineral Reserves for the Far
West Gold Recoveries operation, is Mr Vaughn Duke of Sound Mining Proprietary Limited.
39You can also read