2020 Regional Optimisation Day - Dairy Business of the Year
←
→
Page content transcription
If your browser does not render page correctly, please read the page content below
2020 Regional Optimisation Day
River Terrace Dairy Limited
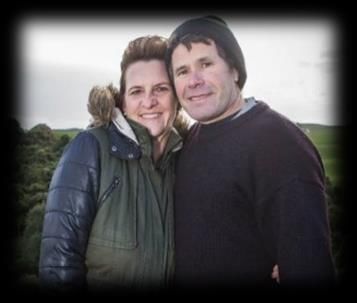
Brent & Rebecca Miller
Andy & Rachele Morris
908 Withells Road, Ashburton – S/N 39616
Best Canterbury Farm Performance
Business Resilience Lowest COP
Medium Input Farm with Best Financials
Best People Leadership
Key Performance Indicators Summary
Please Note: benchmarks used in this report should be considered as indicative only and may or may not
precisely reflect the regional average.

 Farm System                                                 Farm            District         New Zealand
                                                            2018/19          Average            Top 10%
    Usable Hectares                                           411              425                288
    Milking Hectares                                          326              360                244
    Peak Milking Cows                                        1,120            1,246               807

 People Productivity                                         Farm         DBOY          District           New
                                                            2018/19      National       Average          Zealand
                                                                         Average                         Top 10%
    People Investment per Cow ($)                             $365        $487              -               -
    Cows per Full Time Equivalent (50hr FTE)                   223         176             153             177
    Milk Solids per worked hour                              43.08        29.94             -               -
    Training spend per FTE in Dollars ($)                    $1,870       $337              -               -
    Training spend per FTE in Time (hrs)                     45.72         6.24             -               -
    Unplanned Costs per FTE ($)                                 $0        $510              -               -
    Unbudgeted Days Lost per FTE                              0.80         3.63             -               -
    Labour Turnover - Management Staff (%)                     0%           4%              -               -
    Labour Turnover - Non-Management Staff                     0%          23%              -               -
    % days lost due to injury per FTE                          0%           5%              -               -
    Rostered days off per annum per FTE                      106.27       63.39             -               -

 Environmental                                                Farm                                   DBOY
                                                             2018/19                              National
 Management                                                                                        Average
    Effluent Pond                                             Lined                                  Lined
    % of Farm Irrigated with Effluent                          57%                                    38%
    N Loading on Effluent Area (kg/ha)                          76                                    131
    KgMS/ha per KgN Loss/ha                                     16                                     53
    N Leached (kg/ha)                                          106                                     46
    N Conversion Efficiency (%)                                22%                                    29%
    Soluble N Use (kg/ha)                                      358                                    142
    P Loss (kg/ha)                                              0.7                                    1.4
    Olsen P Levels                                        At Optimum                             At Optimum
    Winter Cropping % of Farm                                   0%                                     3%
    Winter Soil Management                                Cows Moved                                Formal
                                                           Frequently                              Standoff
   Green House Gases (Total CO2 Equivalents)                  6,257                                  3,660
Livestock Management                           Farm     District   New Zealand
                                              2018/19   Average      Top 10%
Peak Milking Cows                              1,120     1,246         807
Milksolids per Cow (kgMS/cow)                   503       421          477
Milksolids as % of Cow Liveweight               103        86           95
Milksolids per Milking Hectare (kgMS/ha)       1,725     1,460        1,579

Pasture &                                      Farm     District   New Zealand
                                              2018/19   Average      Top 10%
Feed Management
Annual Stocking Rate – milking area            3.43       3.46        3.25
Homegrown Grazed Feed as % of Diet              81         82          63
Total Feed Fed (tDM/cows)                      5.12       4.61        5.58
Grazed Feed Fed (tDM/cows)                     4.35       4.14        3.60
Homegrown Feed – Direct Costs ($/tDM)          101        100          96
Grazed Feed – Direct Costs ($/tDM)             100         93          64
Conserved Feed – Direct Costs ($/tDM)          250        274         251
Fodder Purchased – Direct Costs ($/tn)         290        232         307
Concentrate Purchased – Direct Costs ($/tn)    416        374         352

Profitability & Resilience                     Farm     District   New Zealand
                                              2018/19   Average      Top 10%
Milk Income per kgMS ($/kgMS)                   6.37      6.61          6.67
Total Assets Managed per Hectare ($/ha)        77,964    67,637       63,430
Gross Farm Income per Hectare ($/ha)           11,984    9,673        11,095
Operating Costs per Hectare ($/ha)             7,523     6,552         7,165
Earnings before Interest and Tax per Ha        4,499     3,150         3,934
Return on Total Asset (%)                        5.8       4.7           6.3
Operating Profit Margin (%)                     37.5      31.9          36.3
Gross Farm Income per kgMS ($/kgMS)             6.95      6.62          7.05
Operating Costs per kgMS ($/kgMS)               4.36      4.52          4.48
Cost of Production per kgMS ($/kgMS)            3.93      5.00          4.52
Cost of Production + Financing per kgMS ($)     5.19      5.95          5.55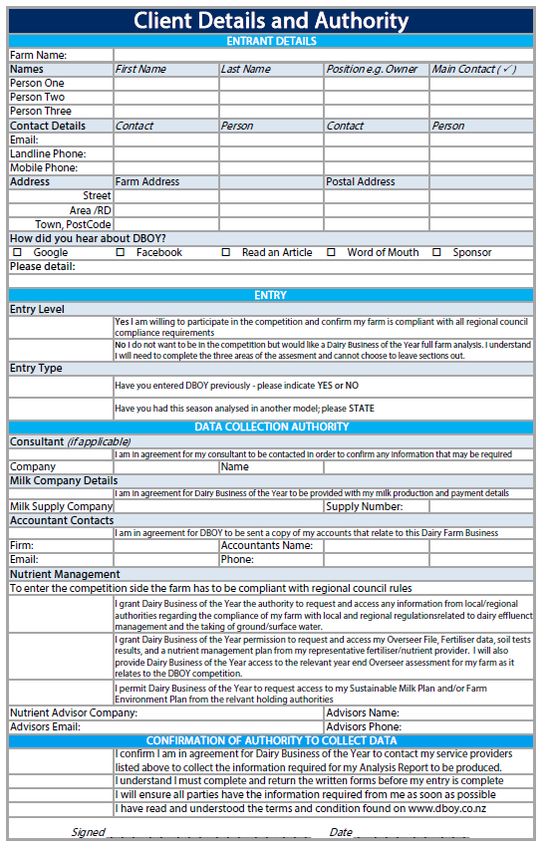
Definitions of KPIs
UNDERSTAND WHAT YOU’RE COMPARING
It is important to have an understanding of how your physical and financial Key
Performance Indicators (KPIs), and the benchmarks you are comparing, are calculated. See
www.dboy.co.nz for more detail.

Gross Farm Income calculations for the DBOY competition are determined using an accrual
basis, which means that the gross farm income is calculated on the milk produced in the
season that is being analysed, times (multiplied by) the amount paid for the milk that was
produced in that same season. It is important to note that this differs from the actual gross
revenue that is received within the dairy farming enterprise, as income received in the
season being analysed includes last year’s deferred payments and a portion of the
payments received for the season being analysed.
When measuring financial performance within a production season to determine business
profitability, using non-accrual gross revenue is somewhat misleading when there is
significant season to season variation in payout, and/or above normal variability in weather
conditions, i.e. if the season prior to the production season being analysed had a higher
payout it would bump up the gross farm income received in the production season being
analysed. Because DBOY uses accrued income when calculating gross farm income, it
provides a truer representation of the income generated in the season being analysed, so
cost, production, and income, are more aligned.

Total Operating Costs is the total operating costs that are incurred during the production
season being analysed and adjusted for feed/supplements on hand at opening and closing
of the season, imputed (unpaid) labour and management, depreciation, and other expense
adjustments. Total Operating Costs does not include financing costs. This includes
adjustments for expenses paid in the year being analysed that relate to production from the
previous or coming year, such as prepaid fertiliser.

EBIT (Earnings Before Interest and Tax) per hectare is gross farm income minus total
operating costs or operating surplus +/- adjustments divided by usable hectares. EBIT per
hectare excludes all financing expenses.

Farm Working Expenses per kgMS (FWE/kgMS) is all physically paid expenses (real cash
payments). This gives an indication of cashflow but is not a comparable figure between
businesses. Adding financing cost to FWE/kgMS will provide the break-even point in terms
of cashflow, indicating the revenue required from milk and livestock sales to ensure there is
cash in the bank.

Operating Costs per kgMS (OC/kgMS) is the FWE +/- non-cash adjustments including
depreciation and imputed labour and inventory changes. This indicates the overall expense
of the business on a per kgMS basis. Adding financing costs to OC/kgMS provides the break-
even point for the full business or the income required from milk and livestock profit (gross
farm income per kgMS).
Operating Profit Margin represents the percentage of total farm income retained as profit
for interest payments, principal repayments, tax and true 'profit' (e.g. a 25% margin would
mean $0.25 for every dollar is available for paying interest, principal and tax). The higher the
OPM the more secure and resilient the business is. OPM target levels should be relative to
the farm system being operated, with high feed-input systems generally achieving lower
operating profit margins than low feed-input systems.
Cost of Production of a kgMS (COP/kgMS) is the Farm Working Expenses plus depreciation
and imputed labour +/- feed inventory changes, +/- livestock inventory changes minus
livestock purchases. This calculation includes the cost of producing milk, livestock and feed.
This is a key indicator of resilience, as having a low COP will enable a business to withstand
fluctuations in milk payouts. The cost of production/kg milksolids plus financing is
effectively the milksolids price the business requires to break even, as it combines both
COP/kgMS and debt servicing costs.

Return on Total Assets (ROTA) equals EBIT divided by total assets FARMED. The most
important measure of profitability is Return on Total Assets (ROTA). This is calculated by
dividing EBIT by the total value of all assets (both owned and leased). This generates a
profitability value which can be compared across all business types, and accounts for farms
with a lower milk production capability against those with a high milk production capability,
based on resources available to them. To maximise ROTA it is important not to over-
capitalise, as this in turn would require an increase in EBIT to achieve the same ROTA. The
capital includes: all land (milking and support), livestock, vehicles, plant and machinery,
and dairy company shares and other farm related shares and current assets.

Return on Asset (ROA) is EBIT minus lease fees divided by total assets OWNED. This is all
farm assets owned by the business, meaning it includes all assets whether financed or
owned outright and excludes all leases.

Return on Equity (ROE) is EBIT, less lease fees, less interest, divided by equity. ROE includes
all assets that are owned outright and excludes all leases and the financed portion of assets,
providing a comparison to money invested in the bank. ROE provides the most important
indicator of net wealth growth.

Grazed Feed and Conserved Feed Costs are calculated based on the total homegrown
feed costs, including costs such as pasture renovation, irrigation and fertiliser and
apportioned based on the proportion of homegrown feed that comes from grazed feed
versus conserved feed for the year. Conserved feed also includes the direct hay & silage
making costs of the business.
Agenda & Table of Contents

9.50am - Introductions
Welcome .............................................................................................................. 1
Health and Safety – Emergency Plan ......................................................................... 2
Sponsors Introduction............................................................................................ 4
Objectives of the Day.............................................................................................. 6
10.10am - Overview of the Farm System
Farm System and Farmers History ............................................................................ 7
10.30am - Sustainability Measures
People Leadership and Productivity ........................................................................10
Environmental Management ..................................................................................13
11.00am - Livestock and Pasture Farm Walk
Livestock and Production ......................................................................................16
Feed Management ................................................................................................17
11.40am - Profitability and Resilience Discussion
Profitability of the Business ....................................................................................18
Farm Business Snapshot ........................................................................................20
Discussion ...........................................................................................................21
12.10pm - Analysing Your Business
Entering DBOY 2021 ..............................................................................................26
12.30pm - Lunch Break
Lunch Break ........................................................................................................22
1.15pm - Informal Discussions with our Sponsor Partners
Progressing Your Business – Where to Start ..............................................................23
Welcome
Regional Optimisation Days are held on the DBOY20 Regional Winners' farms throughout
New Zealand during November. These field day events are a great day out and an excellent
opportunity to hear and learn from some of New Zealand's most resilient, sustainable and
innovative dairy farmers. Attending these events provide the opportunity to see first-hand
those farming principles that are applied on these profitable and resilient farms, and a
perfect time to ask questions, share ideas, and to expand your own farm knowledge that
could then be applied to your farming system.
As outlined in the DBOY purpose statement, there is also a focus on the environmental
management and people productivity at these events, which, along with the financial
performance, demonstrates why and how these farming enterprises are sustainable
businesses that perform year on year.
Remaining profitable during years of volatile milk payouts, while staying focused on
environmental good practice, and supporting the people on your farm to perform at their
best for themselves and for your business, are critical factors in operating a sustainable and
resilient business.
Benchmarking across a number of Key Performance Indicators (KPIs) is the only way to
objectively assess your business performance against your peers. While focusing on farm
performance, this field day also places an emphasis on the use of benchmarking to
continually refine and modify business performance.
DBOY’s Vision & Purpose Statement
The strategic purpose of Dairy Business of the Year is to contribute to dairy farmers and the
dairy industry in New Zealand by:
1. challenging paradigms to bring about ongoing improvements in farm profitability;
2. developing resilient and sustainable farming systems;
3. recognising and reinforcing the value of motivated and innovative people within
farming enterprises;
4. increasing the awareness of dairy farming practices that minimise dairy farming
impact on the environment;
To bring about positive change across these four core objectives Dairy Business of the Year
activities and events encourage dairy farmers of every scale and business model to benchmark
profit, people management and environmental practices to identify gaps and implement
solutions.
0800 735 588 team@dboy.co.nz www.dboy.co.nz 1 |P a g e
Health and Safety – Emergency Plan
General Information
Property Address: 908 Withells Road, Ashburton – S/N #39616
DBOY Officer: Jono Buchly Phone: 027 202 7034
Hosts Names: Brent & Rebecca Miller Phone: 021 989 633
Evacuation Procedures
Evacuation Signal Safe Assembly Area Location
Air Horn and/or Verbal Instruction Cowshed Garden
Accident Procedures Earthquake Procedures
1. Stay Calm. 1. Seek Shelter under a table or solid
2. Shut Down any plant or equipment. object that will provide protection
3. Provide first aid if someone is injured. from falling debris.
4. Dial 111 and ask for the appropriate 2. Keep Clear of collapsible structures.
emergency Services.
5. Arrange for someone to meet them at
the front of the site when they arrive.
Other Emergencies Procedures:
In the event of a Fire, Chemical Spill, Gas Leak, Electrical Event or any other Emergency:
1. Evacuate the Site to a Safe Assembly Area.
2. Dial 111 and ask for FIRE.
3. Report to the Officer or Host.
Health and Safety Kit
“Red Box” located prominently at the event meeting place contains:
✓ First Aid Kit(s).
✓ Fire Extinguisher or Fire Blanket.
✓ Air Horn.
✓ Sun Block.
0800 735 588 team@dboy.co.nz www.dboy.co.nz 2 |P a g eEmergency Contacts First Aider on Site: Monique Stewart 027 438 8085 Nearest Medical Centre/ Hospital: Four Peaks Medical Centre 03 693 8880 Police / Fire / Ambulance: Dial 111 Hazardous and Restricted Areas This is a working farm so please follow the below: 1. Stay clear of tanker tracks. 2. Do not touch electric fences as they may be live. 3. Stay clear of any drains and culverts - these will be pointed out to you. 4. Watch for bulls on farm, do not aggravate. 5. Do not enter paddocks or cross fences unless instructed to do so. 6. When in a paddock tread carefully and watch for rabbit holes and uneven surfaces. 7. Stay clear of effluent ponds, do not pass fences or climb structures. 8. Where children have been brought along, please supervise at all times in locations. 0800 735 588 team@dboy.co.nz www.dboy.co.nz 3 |P a g e
Sponsors Introduction
Gold Sponsors
Jono Buchly, Business Manager
027 202 7034
jono.buchly@headlands.co
0800 73 55 88
www.headlands.co
Jane Davidson, Principal Advisor, Animal Sector
022 069 1822
jane.davidson@mpi.govt.nz
0800 00 83 33
www.mpi.govt.nz
Silver Sponsor
Matt Macfie, Sales & Marketing Manager
021 803 412
matt.macfie@nutrinza.com
0508 768 723
www.nutrinza.com
0800 735 588 team@dboy.co.nz www.dboy.co.nz 4 |P a g eBronze Sponsors
Dean Williamson, Publisher
027 889 3070
dean.williamson@globalhq.co.nz
www.globalhq.co.nz
Steve Sutherland, Marketing Manager
027 543 0989
steve.sutherland@genetic.co.nz
www.pioneer.co.nz
Jon Watson, National Manager - Rural
027 306 8732
jon.watson@nzi.co.nz
www.nzi.co.nz
Jackie Harrigan, Editor
027 359 7781
jackie.harrigan@nzfarmlife.co.nz
www.nzfarmlife.co.nz
Taryn Joseph, Marketing Manager
021 188 1595
taryn@fertco.co.nz
www.mineralboost.co.nz
Supporting Sponsors
Toni Trusler, General Manager
027 599 8909
toni@no8hr.com
www.no8hr.co.nz
Alastair Taylor, Business Development Manager
021 857 627
ataylor@overseer.org.nz
www.overseer.org.nz
0800 735 588 team@dboy.co.nz www.dboy.co.nz 5 |P a g eObjectives of the Day ✓ Gain an understanding of how this farm has achieved top performance across financial, environmental and human resources management ✓ Increase awareness of the critical Key Performance Indicators (KPIs) that influence resilience and sustainablility within a successful dairy system ✓ Recognise the value of benchmarking and identify potential growth opportunities within your dairy system ✓ Review the Return on Total Assets (ROTA) achieved by DBOY finalists at various milk payouts with the purpose of asking this important question – how does your business compare? ✓ Address all queries and comments What areas of your business do you need to spend more time in or on? 0800 735 588 team@dboy.co.nz www.dboy.co.nz 6 |P a g e
Farm System and Farmers History
Farm System Farm District New Zealand
2018/19 Average Top 10%
Usable Hectares 411 425 288
Milking Hectares 326 360 244
Peak Milking Cows 1,120 1,246 807
Farm and Personal History
▪ Job History:
o Andy & Rachele – both come from sheep and beef background
o Brent – grew up in Christchurch until teenage years when his parents bought a
small farm in north Canterbury. In 1997-98 he completed his Diploma in
Agriculture.
o Rebecca – grew up with a dairy farming family and moved around the North Island
experiencing and learning dairy farming at the grassroots. Working in National and
International businesses, in corporate sales, marketing, travel and tourism, and
administration roles. Farmers, American Express, Gulliver’s Travel, NZITO, and
Connect NZ.
▪ How did you get to where you are now?
o Brent has been dairy farming for over 21 years in various operations, from family-
based to corporate, large to small scale system, systems 1-5 from areas-Southland,
West Coast, Waikato, and Canterbury region. He has been involved with judging the
NZ Dairy Industry Awards, Dairy Business of the Year benchmarking, involved with
DairyNZ project – Dairy Fatigue and has been on the Hinds school board of trustees.
o Rebecca comes from a dairy farming family background, with 22years of dairy
farming experience, 13 of which have been in the corporate farming arena,
delivering practical, functional systems to create a stable and resilient whole team
environment. She has been involved with the Dairy Women’s network as a
convener, facilitator, and now Ashburton Business Group leader is the Mid-
Canterbury Federated, Farmers Sharemilker section chair, and is involved with
DairyNZ for project work for the Good Boss campaign and many other projects. She
completed her Kellogg Rural leader project in 2018 research the viability of Land
Events. Rebecca also has 10 years’ experience working in national and
international business in corporate sales, marketing, and analyst roles.
▪ Farm History:
o River Terrace conversion was completed in the 2014-15 season. It is in its sixth year
of operation. Previously it was used as a dairy support block for the larger
partnership that was Ealing Pastures. The irrigation system was upgraded, and the
whole farm was redeveloped. In 2018-2019 season we added an additional 75ha
0800 735 588 team@dboy.co.nz www.dboy.co.nz 7 |P a g eblock that was adjacent to the farm. It was an excellent move, and it squared off the
farm, increasing cow numbers from 925 to 1150 cows.
Farm Philosophy and Systems
▪ What makes your business what it is? The Septuple bottom line: 7 areas of
excellence:
PARADIGM: Our framework,
criterion, and discipline for Milk
IQ Limited.
PASSION: Our compelling
emotion and spiritual
connection to each other and
the land.
PURPOSE: Our WHY – the reason
we do what we do, mission and
vision
PERFORMANCE: Top 1% Goal
attainment, benchmarking, KPI’s
budget, reporting, BTI –
Business-Team-Individual and
STO -Strategic-Tactical-
Operational.
PEOPLE: FARMILY™: Looking after our people, care, body & mind.
PLANET: Conscious care for our environment, recycle, reuse, and repurpose,
environmental audit A+
PROFIT: High profit-low cost resilient business. Care in all areas of the Septuple bottom
line leads to tangible and intangible profit.
▪ What drives the success?
o The main drivers for the success of the business are both tangible and intangible
results – everyone has a win-win, whatever that may be. So the drivers may look
different depending on what they want out of the business. For us, the cohesion of
the team, and the happiness of the whole operation both on farm, and off is
success to us. We look at the whole business as a benchmark. We understand that
success sometimes cannot be seen, and therefore hard to qualify or quantify.
Some of the best success in our business is intangible.
▪ Who’s involved in the business?
o The whole business is a microcosm, and when we say whole business – it is from
the Directors to staff and contractors. Anyone who helps MilkIQ, and River Terrace
Dairy to operate at pace.
0800 735 588 team@dboy.co.nz www.dboy.co.nz 8 |P a g e▪ What system do you run and why?
o System 4 feeding in the shoulders to extend lactation and support feed shortfalls
while maximising pasture intake.
o We feed grain and palm kernel in the spring,
o Palm Kernel and fodder beet in the autumn to transition cows onto winter feed.
0800 735 588 team@dboy.co.nz www.dboy.co.nz 9 |P a g ePeople Leadership and Productivity
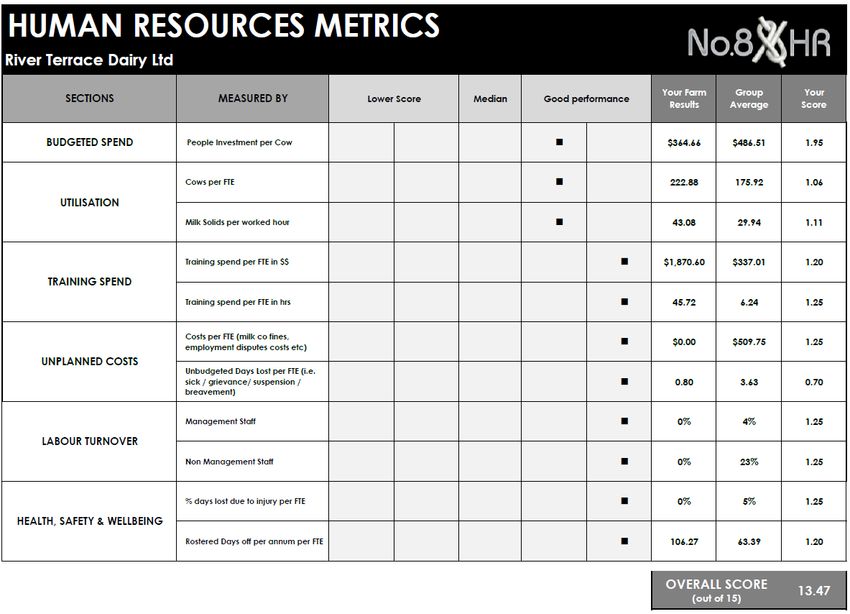
People Productivity Farm DBOY District New
2018/19 National Average Zealand
Average Top 10%
People Investment per Cow ($) $365 $487 - -
Cows per Full Time Equivalent (50hr FTE) 223 176 153 177
Milk Solids per worked hour 43.08 29.94 - -
Training spend per FTE in Dollars ($) $1,870 $337 - -
Training spend per FTE in Time (hrs) 45.72 6.24 - -
Unplanned Costs per FTE ($) $0 $510 - -
Unbudgeted Days Lost per FTE 0.80 3.63 - -
Labour Turnover - Management Staff (%) 0% 4% - -
Labour Turnover - Non-Management Staff 0% 23% - -
% days lost due to injury per FTE 0% 5% - -
Rostered days off per annum per FTE 106.27 63.39 - -
Key Concepts
▪ Rosters:
o Before the beginning of the season, we give the team a choice of roster. This is so
that they can evaluate whether the current roster is still working for the whole
team.
o The current roster is a 6 on 2 off with light duties on the weekends.
o We give an annual laminated roster so that everyone can plan ahead of time. This
idea came about because we all have a life outside of the farm and if we know in
advance when we have time off, then it is easier to plan.
o There is still flexibility, and the team can swap if needed.
o Trust and flexibility on life events, such as school events, appointments – the team
manages these events themselves so that everyone can have this time off.
▪ Motivating and Engaging staff by:
o Team dinners, lunches, paintball, in the past Tekapo hot pools. Celebrations
o Continuous flow of communication
o Profit sharing if the business makes more so does everyone
o Big birthdays, Celebration, Easter, and Christmas dinner
▪ What’s Important to you as an employer:
o Farmily™ - A Farmily is an intentional community on farm who look out for one
another. The concept is simple, we form a cohesive environment where we look at
the whole person. On our farm we have extended out our reach to the teams’
family. This means, if they need to go to a school production, dentist, or doctor,
0800 735 588 team@dboy.co.nz www.dboy.co.nz 10 |P a g ethey can – this won’t be taken off their annual leave. If the whole family is happy,
then we are happy. We want to protect our people with psychological safety; they
can go home to their families physically and mentally safe. When employing our
last team member, we asked the whole team who they wanted. It was a matter of
having a new person fit within our established culture. Everyone was included in
the process.
o Psychological Safety: This is especially important to us as employers of people. It’s
not just about protecting the person physically; we need to also protect their minds
and hearts. We have always tried to create an environment where people aren’t
afraid to ask any question or be themselves. Our main goal is that their time with
us, no matter how long or short, is one that adds value to their lives, not to detract.
This section of the DBOY Farm Performance Report is managed by No8HR. For further
information on the people leadership scorecard or for advice with your own staffing,
please contact No8HR on 07 870 4901 or visit www.no8hr.co.nz
0800 735 588 team@dboy.co.nz www.dboy.co.nz 11 |P a g e 0800 735 588 team@dboy.co.nz www.dboy.co.nz 12 |P a g e
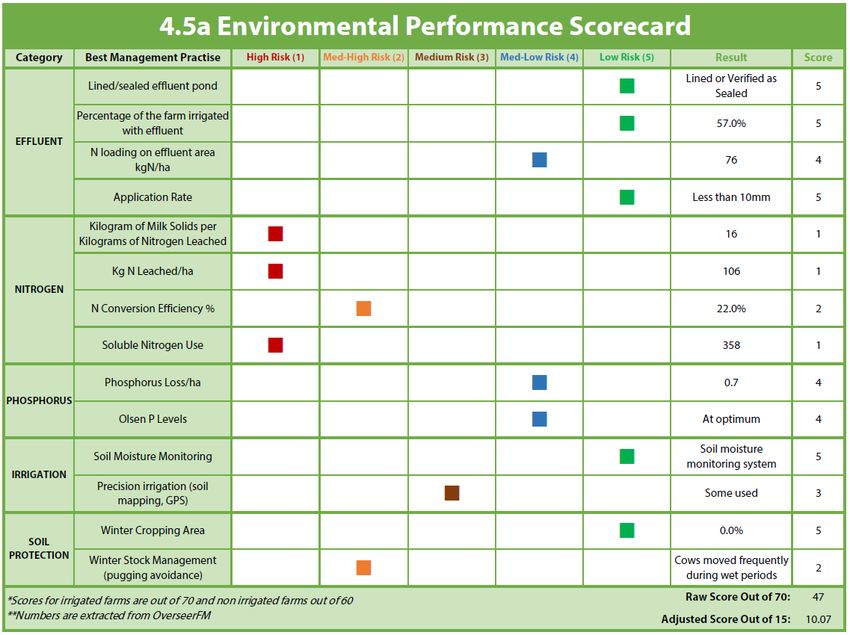
Environmental Management
Environmental Farm DBOY
2018/19 National
Management Average
Effluent Pond Lined Lined
% of Farm Irrigated with Effluent 57% 38%
N Loading on Effluent Area (kg/ha) 76 131
KgMS/ha per KgN Loss/ha 16 53
N Leached (kg/ha) 106 46
N Conversion Efficiency (%) 22% 29%
Soluble N Use (kg/ha) 358 142
P Loss (kg/ha) 0.7 1.4
Olsen P Levels At Optimum At Optimum
Winter Cropping % of Farm 0% 3%
Winter Soil Management Cows Moved Formal
Frequently Standoff
Green House Gases (Total CO2 Equivalents) 6,257 3,660
Key Concepts
o We are extremely conscious of the environmental impact dairy farming has.
Especially now with the Essential freshwater policy. We will do all we can to
mitigate our impact. Our intention is to be compliant in all areas and do what we
can within our control to achieve this.
o Our next step for River Terrace is to reduce our N loading. Work with Mayfield Hinds
water and Irrigo to investigate and understand how we can decrease Nitrogen
loading.
o At present we are putting in catch crops after winter feed.
o We have a lower stocking Rate which is 3.6/ha. We are targeting higher per cow
production through actively monitoring and managing the feed per cow.
o Actively using our moisture probes to determine water deficits or surpluses. We
also monitor soil temperatures, for the application of fertilisers, in conjunction of
monitoring grass growth.
o Soil Testing: Every three years we action a whole farm soil test, to identify exactly
what base fertiliser needs to go on and where. From this and variable rate
application of the fertiliser we have decreased our overall base fertiliser usage and
had a huge impact on the cost savings. This has paid for itself well and truly.
o Effluent application: effluent is applied to 57% of the farm at low rates through
pivot irrigation with proof of placement through telemetry.
0800 735 588 team@dboy.co.nz www.dboy.co.nz 13 |P a g eo Usage of water activated nitrogen (Ammo 31 and n- protect urea). This means less
evaporation and wastage of Nitrogen into the environment and a more uniformed
application of sulphur throughout the year.
o We are looking into variable rate application of nitrogen on our spreading truck.
This will prevent overlap of spreading on headlands and fence lines. It will also let
us reduce rates at the front part of paddocks.
o Staying fully compliant with being audited and verified.
o Staff are fully trained and aware of our necessity to remain compliant and keep in
line with best practice.
0800 735 588 team@dboy.co.nz www.dboy.co.nz 14 |P a g e 0800 735 588 team@dboy.co.nz www.dboy.co.nz 15 |P a g e
Livestock and Production
Livestock Management Farm District New Zealand
2018/19 Average Top 10%
Peak Milking Cows 1,120 1,246 807
Milksolids per Cow (kgMS/cow) 503 421 477
Milksolids as % of Cow Liveweight 103 86 95
Milksolids per Milking Hectare (kgMS/ha) 1,725 1,460 1,579
Key Concepts
▪ Main Focuses:
o Our main focus is keeping our cows at optimum health and fully feed throughout
the season. We believe getting the cows to maximum intakes as soon as possible
and maintaining high quality feed will get the cows to peak faster and hold the peak
longer. Keeping the cows fully fed will mean more days in milk and result in a
higher kgMS/cow production.
o Management decisions are made throughout the season on cow condition with
lighter cows put on once a day or dried off in April/May.
o Days in milk is also a key driver for the farm. The more days in milk the cow has
through the season the less she is costing the business.
▪ Stocking Rate:
o The reason for the stocking rate on our farm is that it gives us more grass
availability to fully feed our cows and deliver a high per cow production.
o This stocking rate on our farm keeps up with overall grass grown throughout the
season and minimise the use of supplement
o At peak growth when cows cannot keep up with grass growth silage is shut up on
the platform to increase the stocking rate and make winter silage for the support
block which is decreasing wintering costs as well.
▪ Cows:
o 25th October start of mating. 1st August calving main herd, 25th July heifers
o PW=110/50 BW=78/42
o Condition score targets 4.5 dryoff, 5-5.5 calving
o Breed Friesian X
o Culling policies – In the list below, we look to first cull empty cows, then low
producers, repeat mastitis/lame/non-cyclers, high somatic and 3 quartered cows.
▪ Young Stock
o 25% replacement rate.
o Growth targets as per Dairy NZ guidelines.
o No extra stock reared.
0800 735 588 team@dboy.co.nz www.dboy.co.nz 16 |P a g eFeed Management
Pasture & Farm District New Zealand
2018/19 Average Top 10%
Feed Management
Annual Stocking Rate – milking area 3.43 3.46 3.25
Homegrown Grazed Feed as % of Diet 81 82 63
Total Feed Fed (tDM/cows) 5.12 4.61 5.58
Grazed Feed Fed (tDM/cows) 4.35 4.14 3.60
Homegrown Feed – Direct Costs ($/tDM) 101 100 96
Grazed Feed – Direct Costs ($/tDM) 100 93 64
Conserved Feed – Direct Costs ($/tDM) 250 274 251
Fodder Purchased – Direct Costs ($/tn) 290 232 307
Concentrate Purchased – Direct Costs ($/tn) 416 374 352
Key Concepts
▪ Pasture
o We plate meter twice a week to get a better understanding of what the grass
growth rates are doing and make timely decisions on increasing/decreasing round
length, reducing nitrogen, shutting silage up and when to introduce supplements.
o Target drying off cover is between 2050-2100 kgDM/ha
o Winter management cows grazed on support block on beet kale, baleage and straw
o Summer quality management Topping/silage made to keep quality up 2800-2900
pre grazing. 1600kg residual
▪ Supplements
o PKE, Grain in Spring. PKE Beet Autumn.
o We use supplements in the shoulders of the season to extend lactation and
transition cows to beet for winter.
o 10ha beet on platform for Autumn and winter transitioning.
o 40ha beet, 15ha Kale for wintering.
o 30 ha grass for young stock during milking season.
o Every March go through a cropping plan to outline where and when crops will be
going for the next season. Giving us timings for spraying out paddocks, fertilisers
and other sprays, etc. This then means that we can book in cultivation, spray and
fertiliser contractors in advance to get it actioned in a timely fashion. This also
means that we can get the right timing into the budget.
o Feed such as PKE and grain is bought on contract when a fair price is available and
in enough quantity for the whole season.
0800 735 588 team@dboy.co.nz www.dboy.co.nz 17 |P a g eProfitability of the Business
Profitability & Resilience Farm District New Zealand
2018/19 Average Top 10%
Milk Income per kgMS ($/kgMS) 6.37 6.61 6.67
Total Assets Managed per Hectare ($/ha) 77,964 67,637 63,430
Gross Farm Income per Hectare ($/ha) 11,984 9,673 11,095
Operating Costs per Hectare ($/ha) 7,523 6,552 7,165
Earnings before Interest and Tax per Ha 4,499 3,150 3,934
Return on Total Asset (%) 5.8 4.7 6.3
Operating Profit Margin (%) 37.5 31.9 36.3
Gross Farm Income per kgMS ($/kgMS) 6.95 6.62 7.05
Operating Costs per kgMS ($/kgMS) 4.36 4.52 4.48
Cost of Production per kgMS ($/kgMS) 3.93 5.00 4.52
Cost of Production + Financing per kgMS ($) 5.19 5.95 5.55
Key Concepts
o Strategically: Budgets are developed and monitored closely, monthly.
o Tactics for tight times never left us, it is important that we are always thinking
about cost vs value. To us the timing of a tactical decision is just as important as
making the decision and acting. Making the decision too late because of indecision
may cost us more money. An example of this is the timing of when to bring the feed
in the shoulders.
o The need to measure, manage and monitor continuously and keep in front of any
discrepancies, so that we can mitigate and create tight cost controls.
o Operationally, we want to ensure that the tools of the trade are always promptly
seen to, maintained and ready to use. If there is delay, then there is pressure, and if
there is pressure our whole operation slows down. Time is money.
o Grass is king, it’s a big motivator to get as much grass down the throat as possible
as it’s our cheapest form of feed.
o All eyes on the prize. Everyone in our team are key players in keeping the operation
flowing and growing like a well-oiled machine.
Cost Control Techniques
o Budgets are completed on CashManager Rural and we monitor expenses through
reporting.
o Benchmarking: DairyBase, MacFarlane Rural Business – DSM and DBOY. Through
benchmarking and analysing our operation we can find the places easily where we
can improve.
0800 735 588 team@dboy.co.nz www.dboy.co.nz 18 |P a g eo Cost savings are key, and we do this through our own trouble shooting, if not
actioning the repairs and maintenance ourselves. Working with our neighbours for
feed and grazing of young stock, creating win-win as well.
0800 735 588 team@dboy.co.nz www.dboy.co.nz 19 |P a g e 0800 735 588 team@dboy.co.nz www.dboy.co.nz 20 |P a g e
Discussion
Current and Future Strategies
▪ Current strategies
o Our current strategies are to ensure our people on both farms are happy, and to
take some time after calving to work on team cohesiveness.
o We will be looking at reducing the debt levels.
o Planting edible and non-edible trees in the corners of the farm, and boundary fence
lines.
o Keeping a low-cost farm, highly productive operation.
o Looking further into implementing strategies to reduce environmental impact.
o Be present in Primary Industry and take care of our people.
▪ Future plan. Where to next?
o Increasing equity and looking for opportunities to grow in the industry.
Discussion Notes
0800 735 588 team@dboy.co.nz www.dboy.co.nz 21 |PageLunch Break
Lunch break is a great opportunity to network. You may wish to record details of those you
talk to so you can contact them later for further discussions.
Name Phone Email Discuss more about
Lunch Kindly Sponsored by Nutrinza
Nutrinza is a New Zealand-owned feed company and a proud
sponsor of Dairy Business of the Year. They aim to give farmers
maximum flexibility and options in terms of the feed
supplements they can use to maximise production and/or
profitability.
Nutrinza allows farmers to customise each of their feed blends to suit their farm, animals,
production and fertility targets as well as financial strategy. This enables farmers to choose
a combination of feeds that it not only best for the business, but also limits wastage and the
impact this wastage has on the environment.
Nutrinza is privileged to sponsor DBOY as it is a dairy industry award that focuses on a farm's
overall performance in terms of return on investment, human resources and the
environment.
Matt Macfie
Sales & Marketing Manager
Mobile 021 803 142
Email: matt.macfie@nutrinza.com
Your local rep:
James Bowker
Technical Sales Representative
Mobile 027 216 8049
Email: james.bowker@nutrinza.com
0800 735 588 team@dboy.co.nz www.dboy.co.nz 22 |PageExploring Business Growth Opportunities Informal Discussion with our Sponsor Partners - Use the space below to brainstorm your ideas. PROGRESSING YOUR BUSINESS - WHERE TO START FARM SYSTEM – PHYSICAL OR FINANCIAL PEOPLE ENVIRONMENT 0800 735 588 team@dboy.co.nz www.dboy.co.nz 23 |Page
WHAT DO YOU THINK? FIVE CORE STRENGTHS OF THE BUSINESS 1. 2. 3. 4. 5. 0800 735 588 team@dboy.co.nz www.dboy.co.nz 24 |Page
FIVE OPPORTUNITIES FOR IMPROVEMENT OR BUSINESS
GROWTH
1.
2.
3.
4.
5.
0800 735 588 team@dboy.co.nz www.dboy.co.nz 25 |PageEntering DBOY 2021
Why Enter
✓ Detailed Analysis Report for all Entrants. The report highlights strengths and opportunities to
fine-tune the business by reviewing Profit (financials and farm system management), People
Leadership and Planet (environmental and nutrient management). Example report can be
viewed at www.dboy.co.nz.
▪ Profit: analysis of financial and physical performance, including farm system
management and financial performance.
▪ People: an assessment of labour management, staff engagement and overall
performance. With people management being one of the leading areas of a successful
business.
▪ Planet: a review of nutrient management and environmental preservation. The
assessment not only assesses the environmental impact, but how you could use nutrients
more effectively which can also be financially beneficial.
✓ Quick and Easy to Enter. The data forms are simple to complete, and no interviews are required,
analysis is based on performance results, so the hard work is already done.
✓ Huge Value for a Small Entry Cost. Thanks to the subsidies provided by our generous sponsors
you receive over $2,000 of information for only $450+GST for full analysis.
✓ Great Benefits for Top Performers. Along with the Award prizes there is an exclusive Leaders
Optimisation Day where all finalists can assess each other’s businesses and learn from other top
performers from around the country.
“The detailed physical and financial analysis and report from DBOY
provided us with a better understanding of the KPIs in our business. The
report reinforced our low-cost structure and identified areas that we
could tweak to gain even greater efficiencies. Winning the Regional and
Supreme has put us in good stead with our bank, and they have greater
confidence in us and see us as a low risk which is really important,
especially for any future developments or opportunities we may want
to pursue.” Andrew & Sibylle Sulzberger
“We have entered DBOY three times now as the data gained via the Farm
Performance Assessment Report is invaluable in assisting us make
evidence-based decisions for our business. DBOY allows us to
benchmark ourselves with other top-end businesses and provides an
accurate “warts and all” critique of our business. The report also helps
us set KPIs that ensure relevance for our goals. We now have a
comprehensive set of data that we use to not only assess performance,
but also assist with planning/modelling future strategies.” Tim
Montgomerie
0800 735 588 team@dboy.co.nz www.dboy.co.nz 26 |PageHow to Enter
All forms can be completed online at www.dboy.co.nz, or by contacting DBOY via email
at team@dboy.co.nz, or phone 0800 735 588 and request an electronic entry form that
can be completed within Excel.
STEP ONE - ENTRY FORM
1. Can we enter?
Any business entity can enter (owner operators, sharemilkers with property owners,
lease farms, equity partnership, companies). As long as we receive the season's
financial information for the whole business system, we can combine them into one
business for the competition, e.g. owner and sharemilker.
2. Do I have to be in the competition?
No - You can choose to opt out of “competing” and you will still receive all the same
comprehensive analysis and report. All sections of the entry form must still be
completed; you cannot choose to drop sections out. NOTE that only businesses
that comply with regional council regulations are eligible to compete.
3. Global Dairy Farms
View DBOY Example Report online at www.dboy.co.nz
i. $450+GST for a full analysis; physical data forms must be completed
4. Complete Entry Form / Client Authority Form
i. Complete online or request a form or complete overleaf (~5 minutes)
STEP TWO - COMPETE DATA COLLECTION
1. People Productivity Form
i. Complete online or request a form (~10 minutes)
2. Environmental Form
i. Complete online or request a form (~10 minutes)
3. Financial/Physical Forms
i. Global Dairy Farms – Complete online or request a form (~30 minutes)
STEP THREE - PROVIDE REQUIRED INFORMATION
1. Where required, ensure you have requested further information ahead of time from
either your accountant and/or nutrient advisor (for an updated Overseer) in order to
provide all the information required by DBOY.
2. Answer any questions the DBOY team may have that will allow your business to be
analysed promptly and accurately.
0800 735 588 team@dboy.co.nz www.dboy.co.nz 27 |Page 0800 735 588 team@dboy.co.nz www.dboy.co.nz 28 |Page
Feedback Form
We would appreciate if you could complete this form and hand it to the DBOY presenter.
Name
1. Where did you hear about the field day? (tick box)
Flyer in mailbox
Ad in the paper
Facebook
DBOY website – www.dboy.co.nz
Word of mouth – friend or co-worker
Word of mouth – through one of the sponsors
Word of mouth – local store or other rural professionals
Other, please specify
2. Please rate how satisfied you were with the event
(1= disappointed, 10= very satisfied)
1 2 3 4 5 6 7 8 9 10
3. What did you find of particular interest during the day and would like to see again on
another farm next year?
4. Is there anything you were hoping to get out of the day which was not covered?
5. Is there anything you felt didn’t need to be covered, or you did not enjoy?
0800 735 588 team@dboy.co.nz www.dboy.co.nz 29 |Page6. Will you be coming to the Regional Optimisation Days in your region next year? Yes / No
If no, why not?
7. How aware are you of DBOY’s analysis and reporting on your own business?
This is the first time I knew that DBOY completed a business analysis and report
A friend or neighbour had mentioned that DBOY prepared an analysis and report
My consultant/bank manager/other had mentioned that DBOY completes a business
analysis and report, but I haven’t taken it further
I have entered in the past
I have entered in the last few years, and am very familiar with a DBOY report
I have recently reviewed the DBOY webpage
I am aware of the analysis and report through the DBOY Facebook page
Other
8. Would you be interested in having DBOY analyse your farm business? Yes / No
If no, why not?
Please contact me regarding entry/analysis
Name:
Email:
Phone:
Thank you!
0800 735 588 team@dboy.co.nz www.dboy.co.nz 30 |PageYou can also read