BUILDING QUÉBEC'S FIRST DIAMOND MINE - Update, July 22nd 2012 - TMXmoney
←
→
Page content transcription
If your browser does not render page correctly, please read the page content below
BUILDING QUÉBEC’S FIRST DIAMOND MINE
Update, July 22nd 2012

Matt Manson
President and CEO

                                                                                                                                                              2

Forward-Looking Information

 This presentation contains "forward-looking information" within the meaning of Canadian securities legislation and “forward-looking statements”
 within the meaning of the United States Private Securities Litigation Reform Act of 1995. This information and these statements, referred to herein
 as “forward-looking statements”, are made as of the date of this presentation and the Company does not intend, and does not assume any
 obligation, to update these forward-looking statements, except as required by law.

 Forward-looking statements relate to future events or future performance and reflect current expectations or beliefs regarding future events and
 include, but are not limited to, statements with respect to: (i) the amount of mineral resources and exploration targets; (ii) the amount of future
 production over any period; (iii) net present value and internal rates of return of the mining operation; (iv) capital costs and operating costs; (v) mine
 expansion potential and expected mine life; (vi) expected time frames for completion of permitting and regulatory approvals and making a
 production decision; (vii) future exploration plans; (viii) future market prices for rough diamonds; and (ix) sources of and anticipated financing
 requirements. Any statements that express or involve discussions with respect to predictions, expectations, beliefs, plans, projections, objectives,
 assumptions or future events or performance (often, but not always, using words or phrases such as “expects”, “anticipates”, “plans”, “projects”,
 “estimates”, “assumes”, “intends”, “strategy”, “goals”, “objectives” or variations thereof or stating that certain actions, events or results “may”,
 “could”, “would”, “might” or “will” be taken, occur or be achieved, or the negative of any of these terms and similar expressions) are not statements
 of historical fact and may be forward-looking statements.

 Forward-looking statements are made based upon certain assumptions and other important factors that, if untrue, could cause the actual results,
 performances or achievements of Stornoway to be materially different from future results, performances or achievements expressed or implied by
 such statements. Such statements and information are based on numerous assumptions regarding present and future business strategies and the
 environment in which Stornoway will operate in the future, including the price of diamonds, anticipated costs and ability to achieve goals. Certain
 important factors that could cause actual results, performances or achievements to differ materially from those in the forward-looking statements
 include, but are not limited to: (i) estimated completion date for the Environmental and Social Impact Assessment; (ii) required capital investment
 and estimated workforce requirements; (iii) estimates of net present value and internal rates of return; (iv) receipt of regulatory approvals on
 acceptable terms within commonly experienced time frames; (v) the assumption that a production decision will be made, and that decision will be
 positive; (vi) anticipated timelines for the commencement of mine production; (vii) anticipated timelines related to the Route 167 extension and the
 impact on the development schedule at Renard; (viii) anticipated timelines for community consultations and the conclusion of an Impact and
 Benefits Agreement; (ix) market prices for rough diamonds and the potential impact on the Renard Project’s value; and (x) future exploration plans
 and objectives. Additional risks are described in Stornoway's most recently filed Annual Information Form, annual and interim MD&A, and other
 disclosure documents available under the Company’s profile at: www.sedar.com.

 When relying on our forward-looking statements to make decisions with respect to Stornoway, investors and others should carefully consider the
 foregoing factors and other uncertainties and potential events. Stornoway does not undertake to update any forward-looking statement, whether
 written or oral, that may be made from time to time by Stornoway or on our behalf, except as required by law.
3

  Why Stornoway?
                    100% Ownership in Renard:

        One of the World’s Best Development
              Stage Diamond Projects

           In Québec, one of the World’s Best
                 Mining Jurisdictions

    Renard

          Strong Feasibility Base Case Economics

          Extensive Resource Upside

    Diamonds

          Excellent Long Term Fundamentals

          Few New Mining Projects

    Stornoway

          Experienced Team

          Strong Québec Backing

                                                                                                                                                                                                  4
  Stornoway’s Operating Credentials
  Board and Management Team

Executive Officers

                                                                                                Stornoway recently announced the relocation
                                                                                                   of its head office to Montréal, which will
                                                                                                become the platform for the expansion of the
                                                                                                  mining team and corporate support staff.
  Matt Manson                Pat Godin                 Zara Boldt
 President, CEO            COO & Director              CFO and VP
   & Director                                            Finance

Non-Executive Directors

                          Michel Blouin                                     John LeBoutillier       Monique Mercier
  Tony Walsh              Independent/                Yves Harvey             Independent/           Independent/            Peter Nixon            Ebe Scherkus             Serge Vézina
   Chairman               IQ Designate                Independent             IQ Designate           IQ Designate            Independent             Independent              Independent

Key Managers

                                                                                                        John
   Ghislain           Yves Peron             Robin           Dave Skelton        Brian Glover                          Martin Boucher      Guy Bourque          Helene           Patrick Houle
                                                                                                      Armstrong
   Poirier           VP Engineering         Hopkins            VP Project          VP Asset                                Manager,         Chief Mining       Robitaille          Manager,
                                                                                                    Diamond Resource
VP Public Affairs    & Construction       VP Exploration      Development          Protection                           Sustainable Dev      Engineer         Director, HR       Community Dev.
                                                                                                        Specialist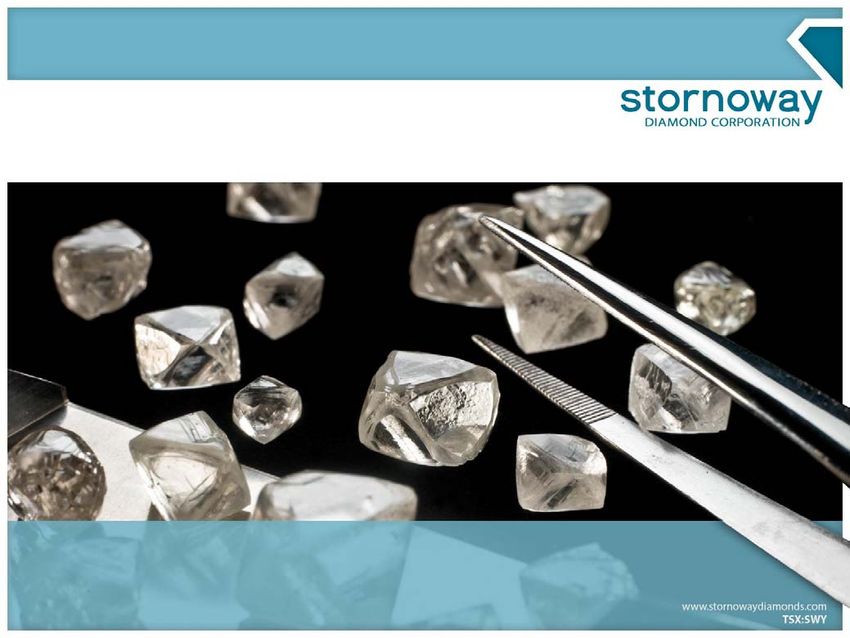
5
The Last 8 Months
Moving Forward with Québec’s First Diamond Mine

  November 2011: Released project BFS

  December 2011: Filed project ESIA

  February 2012: Announced commencement
  of access road construction.

  March 2012: Signed project Impacts and
  Benefits Agreement (“Mecheshoo
  Agreement”)

  March-May 2012: Raised $40m in a 50/50
  debt/equity ratio

  May 2012: Announced $28.4m 2012 Pre-
  Development Program

  May 2012: Announced establishment of head
  office in Montréal

  July 2012: Signed the Declaration of
  Partnership with Chibougamau and Chapais

                                                                                                                                  6

Renard Kimberlite Bodies

                                       0       1        2
                                           Kilometers
  N
                                                                                                      60      0      60     120
                                                                                                              Kilometers

                                                                                                              Laforge 2
                                                                                                              La
                                                                                                Laforge 1
                                                                                                Laforg
                       R10                                                                                             Brisay
                                                                                                                       B
                                                                                              LG4
                                                                                              L
                                                                                              LG4
                                                                        LG2
                                                                        L
                             R7                                                 LG3
                                                                                L

                                                                                                       Foxtrot Property
              Hibou           R1
                                                                              Eleonore
                                                             Wemindji                                             Renard
                               R65                                                 Western Troy
                                                                                              y             Eastmain Mine
                      R4                                                                                    St t
                                                                                                            Strateco
                                  R8

                      R9               R3                                     Troilus Mine
                             R2                                                                     Temiscamie

      Lynx                                                                                     Mistissini
                                                             Matagami
                                                                                             Chibougamau
                      Kimberlite Bodies with
                        Probable Reserves
                                                            Legend
                                                              ge
                                                            LEGEND:
                      Kimberlite Bodies with                   Stornoway Properties                    HydroQuébec
                       Inferred Resources                      HydroQuébec Facility                    Powerlines

                                                               Renard Kimberlites                      Route 167 Extension
                      Kimberlite Bodies with                                                           Road
                                                               Kimberlitic Dyke
                        Resource Potential                                                             Exploration/ Mining
                                                               Regional Kimberlites
                                                                                                       Projects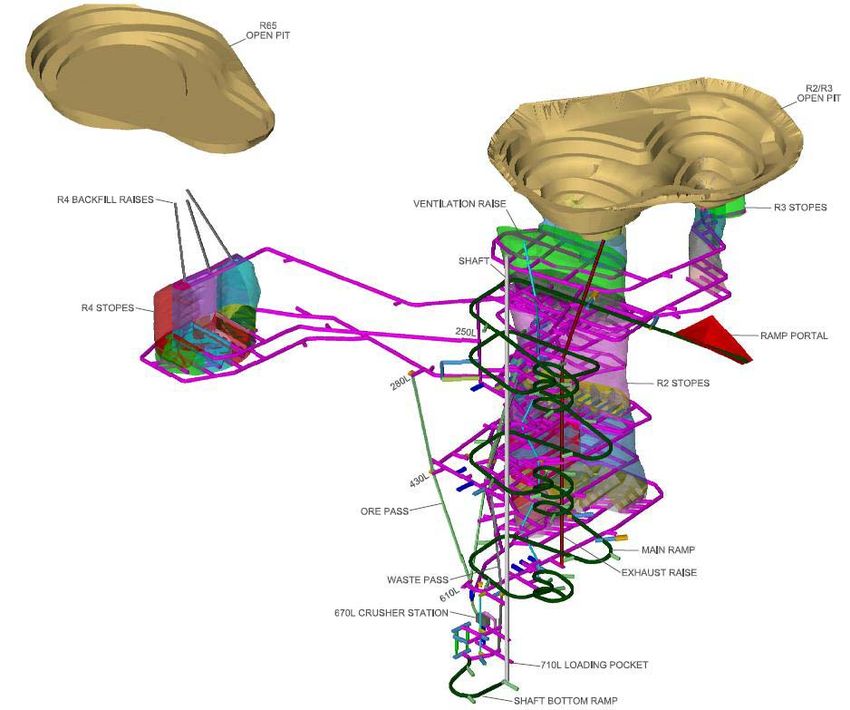
8
Renard NI 43-101 Mineral Reserves and Resource
Resource announced January 24th, 2011. Reserve announced November 16th, 2011
PROBABLE RESERVE Renard 65
29cpht
Drill Delineated Renard 3
Micro/Macro Diamond Sampling Renard 2 106/118cpht
103/118cpht
Bulk Sampling for Value
18 million carats
Renard 4
53/44cpht Renard 9
INFERRED RESOURCE 47cpht
Lower Resolution Drilling,
or no Bulk Sample
17 million carats
EXPLORATION UPSIDE
Lower Resolution Diamond
Sampling, or no Drilling.
24 - 49 million carats
Notes: Grades illustrated are for Indicated and Inferred Mineral Resources respectively at a +1DTC sieve size cut-off. Reserve and Resource categories are compliant with the "CIM Definition
Standards on Mineral Resources and Reserves". Mineral resources that are not mineral reserves do not have demonstrated economic viability. The potential quantity and grade of any Exploration
Target (previously referred to as a “Potential Mineral Deposit”) is conceptual in nature, and it is uncertain if further exploration will result in the target being delineated as a mineral resource.
10
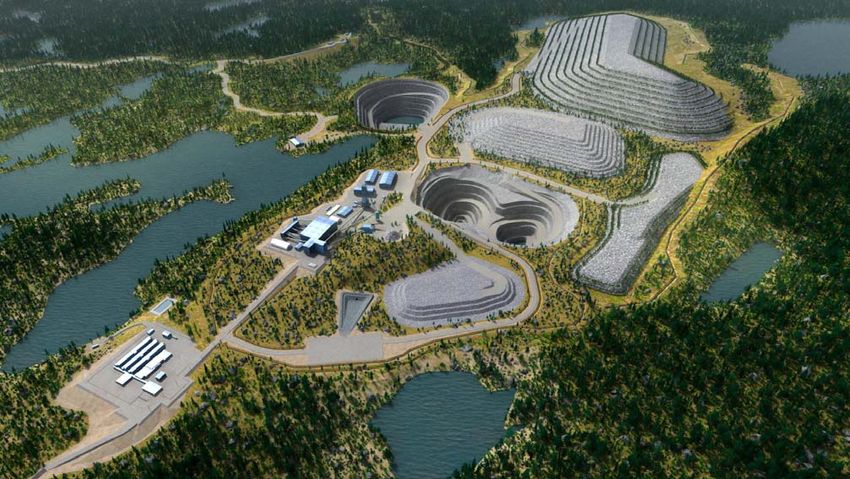
General Project Arrangement
Small Footprint of 3.1km2
Processed Kimberlite
Containment (PKC)
R65
Waste Rock
R2-R3 Overburden
Stockpile
Plant
Ore Stockpile
Camp
Route 167 Extension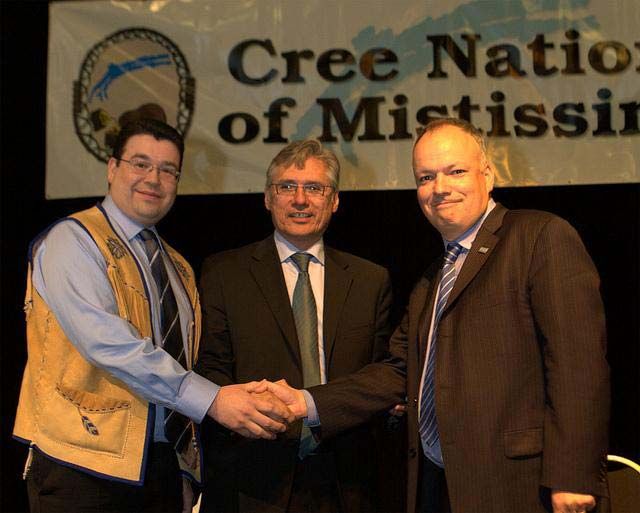
11
Mine Plan
A Combined Open Pit and Underground Mine
Open Pit Mining at Renard 2 & 3
                                                                                      Renard 65
(years 1-2)

Underground Mining Renard 2,
3 & 4 (years 3-11)

Blast Hole Shrinkage with waste
backfill from pits. Dilution and
recovery estimates recently validated
in post-BFS REBOP analysis.

6,000 tpd plant capacity,                                                                                                                                             Renard 3
(2.2mtonnes/annum).

Pit at Renard 65 (initially) as a borrow-
pit and waste water sump, pending
resource conversion.                                                                   Renard 4

                                                                                                                                                             Renard 2

                                                                     Renard 3
                         Renard 2

                                                                                                                                                                                 12
Summary of Feasibility Results
Released November 16th, 2011

     Valuation
        NPV7% and IRR of C$672m and 18.7% (Pre-Tax) and C$376m and 14.9% (After-Tax)

     Mining and Production Parameters
        11 year reserve-based mine life

        Peak diamond production reaching 2.1Mcarats per year, averaging 1.7Mcarats over LOM, and
        at a weighted average US$180/carat

        Operating cash flow of C$2.7B
     Costs
        Initial Capital Cost Estimate of C$802m including contingencies

        LOM Operating Cost Estimate of C$54.71/tonne (C$70.27/carat) giving a 68% operating margin

     Reserves and Resources1
        Probable Mineral Reserve of 18.0 Mcarats (23.1Mtonnes at an average 78 cpht)

        Inferred Mineral Resources of 17.5 Mcarats (31.1Mtonnes at an average 56 cpht)

    Key Assumptions
        C$1=US$1, Oil US$90/barrel, 2.5% real terms diamond price growth Q311-Q425, 83.5% ore recovery, 19.4% mining dilution, 0cpht
        dilution grade, January 1 2012 effective date for NPV and IRR calculation.
     1
       Reserve and Resource categories are compliant with the "CIM Definition Standards on Mineral Resources and Reserves". Mineral resources that are not mineral reserves do
     not have demonstrated economic viability.
13

Long Term Business Plan

                                                                       Renard 65
  Stornoway has also developed a Long Term
  Business Plan (“LTBP”) based on the                                                                  Renard 3
  Project’s total Indicated and Inferred Mineral
  Resources to a depth of 700m.

  This material is within the scope of the mine
  infrastructure costed within the Feasibility
  Study, and includes:
    • 6.1 Mcarats of high grade Inferred Mineral
      Resources between 600-700 meters
      depth in Renard 2.
    • 3.7 Mcarats of open pittable Inferred
      Mineral Resources to 290 meters depth in
      Renard 65

  Although highly accretive, the project’s
  Inferred Mineral Resources are not included               Renard 4
                                                                                             Renard 2
  in the Feasibility Study economic analysis in
                                                                          Renard 9
  accordance with NI 43-101, but do form the
  basis of the project’s ESIA and mine
  permitting.                                                          Mineral Reserve Included in
                                                                       Feasibility Mine Plan

                                                                       Upside Materials Not Included in
                                                                       Feasibility Mine Plan

                                                                                                                  14

Feasibility Mine Plan Production Schedule and Cash Flow

         Open Pit & Underground Mining
           Schedule (Ktonnes of Ore)                                        Plant Feed (Ktonnes)
2,500                                                          2,500

2,000                                                          2,000
                                                   R4 UG
1,500                                              R3 UG       1,500                                        R4
1,000                                              R2 UG       1,000                                        R3
 500                                               R3 Pit        500                                        R2

   -                                               R2 Pit         -
        2013
        2014
        2015
        2016
        2017
        2018
        2019
        2020
        2021
        2022
        2023
        2024
        2025
        2026

                                                                        2013
                                                                        2014
                                                                        2015
                                                                        2016
                                                                        2017
                                                                        2018
                                                                        2019
                                                                        2020
                                                                        2021
                                                                        2022
                                                                        2023
                                                                        2024
                                                                        2025
                                                                        2026

           Carat Production (Kcarats)                                      Gross Revenue (C$M, Real)
2,500                                                          600.0

2,000                                                          500.0

                                                               400.0
1,500                                              R4                                                        R4
                                                               300.0
1,000                                              R3                                                        R3
                                                               200.0
 500
                                                   R2                                                        R2
                                                               100.0
   -                                                              -
        2013
        2014
        2015
        2016
        2017
        2018
        2019
        2020
        2021
        2022
        2023
        2024
        2025
        2026

                                                                        2013
                                                                        2014
                                                                        2015
                                                                        2016
                                                                        2017
                                                                        2018
                                                                        2019
                                                                        2020
                                                                        2021
                                                                        2022
                                                                        2023
                                                                        2024
                                                                        2025
                                                                        2026
15
    Renard 65 Bulk Sample
    Announced July 23rd, 2012.

     Stornoway will commence the process of converting
     the project’s Inferred Mineral Resources with a 5,000
                                                                                                             Existing R65 Pit           Northern R65 Contact
     tonne bulk sample of the Renard 65 kimberlite,
     starting in July 2012.

     Renard 65 has a good potential to return large
     diamonds, and it is expected that 1,000 carats will
     be recovered for valuation.
                                                                                                                                             5,000t Trench
     Ore will be trenched from the northern end of
     Renard 65 where kimberlite is already exposed at
     surface. Processing will occur at the 10 tph plant
     located at the project site, with diamond recovery at
     Stornoway’s North Vancouver facility.
                                                                                                           A 4 carat, top quality diamond
     Conversion of Renard 65 will allow an increase in                                                     recovered from Renard 65 drillcore
     planned production rate to 7,000 tonnes per day (2.6
     Mtonnes/annum) and an extension of the project’s
     mine life and reserve tail.

     Results are expected by year end.

                                                                                                                                                              16
Renard’s Diamonds
Valuation Conducted by WWW International Diamond Consultants Ltd. May 8th-13th, 2011

     Renard kimberlite pipes have a diamond population with a coarse size distribution and high proportion
     of large white gems. Lynx and Hibou kimberlite dykes have a finer distribution of browner stones.

     99% by weight gem/near-gem quality. 1% industrial quality boart.

     Coarse size distribution: potential for significant “Specials”, not accounted for in the current resource
     work. (Three to six 50-100ct stones and one to two +100ct stones every 100,000 carats.)

     Implied grade loss through sampling breakage 15%-38%, not accounted for in the current resource
     work
                                                                                                                            Renard 3 Bulk Sample Stones larger
                                                                                                                                   than 2 carats. “Run of Mine”
                         Size of                Largest                 May 2011
    Kimberlite          Valuation              Diamonds                 Diamond             Sensitivities
    Body                 Sample                Recovered                  Price           (Minimum to High)
                                                                                      1
                             (carats)             (carats)              (US$/carat)
    Renard 2                  1,580        15.46, 8.80, 8.42                                $163 to $236
    Renard 3                  2,753        10.15, 7.78, 6.36
                                                                          $182              $153 to $205
    Renard 4                  2,674         5.92, 5.74, 3.99               $1122            $105 to $185
    Lynx Dyke                  535         21.53, 5.36, 5.34               $119              $99 to $144
    Hibou Dyke                 772          3.14, 3.07, 2.72               $118              $88 to $136
1
Based on an average of five independent valuations conducted between May 9 th and 13th 2011, and supervised by
WWW International Diamond Consultants Limited.
2
 The Renard NI 43-101 compliant Mineral Resource of January 2011 and the Feasibility Study of November 2011
utilize a higher diamond price based on an analysis of diamond breakage and poor plant recovery of the Renard 4
valuation sample, which is   $164/carat. All samples utilize a +0.85mm (+1 DTC) cutoff
17

Permitting and Development Schedule

                                       2011           2012                 2013                        2014                      2015

                                      2H         1H   2H        1H        2H              1H          2H              1H          2H

                BFS (Complete)

                ESIA (Complete)

          Community Hearings

     COMEX and CEAA Review

      Specific Mine Permits (50)

           Detailed Engineering

              Project Financing

             Road Construction                                            First Vehicle Access

             Mine Construction

  Commissioning and Ramp-up

        Commercial Production

                                                                                                                                                                 18
Regional Infrastructure
A Canadian Diamond Project with an All Season Highway and Potential Grid Power

Road: The Québec Ministry of Transportation
“Route 167 Extension”, a new 2-lane gravel                 Route 167 Extension                      Hydro Facility
                                                                                                                                   Caniapiscau

highway with a 70km/h speed limit.                         Existing Winter Road                  Existing Hydro Line
                                                            Stornoway Claims                     Potential Hydro Line
  Initial road construction cost of $332m will         Mining/Exploration Projects
  be funded by Québec. Stornoway will                                                                                            Laforge 2

  contribute $44m amortized over 10 years,                                                                                                        Brisay

  starting in 2015. Additional Industry                                                                         Laforge 1

  contributions expected.                                                                                       LG4
                                                                 LG2              LG3
                                                                                                             Mirage                   Potential
  Road construction commenced January                                                                        Camp                     Powerline
  2012. Vehicle access is expected to be
  available to the Renard site to commence
  project construction in 2013.                                         Eleonore                                                         Renard
                                                                       (Goldcorp)
                                                                                                     McLeod Lake
Power: Separate feasibility study on a 165km                                                        (Western Troy)
                                                                                                                                   Eastmain
161kV powerline connecting Renard to the                                           Eastmain 1
                                                                                                                                  (Eastmain)
Laforge-1 generating station is ongoing.                                                           Route 167                      Matoush
                                                                                                   Extension                      (Strateco)
  The powerline would add capital cost to the                                                       (268km)                          Existing
                                                                                                                                    Winter Road
  project ($174m) but offers substantial
  operating cost savings ($9/tonne).                                                            Troilus                 Temiscamie
                                                                                                (Inmet)

  Stornoway has elected to proceed initially                                                    Mistissini
  with diesel powered gensets for production                                                                       60        0               60            120
  startup, and will assess a powerline as a                                                                                   Kilometers
                                                                                                       Chibougamau          Scale: 1:3,000,000
  potential phase 2 capital program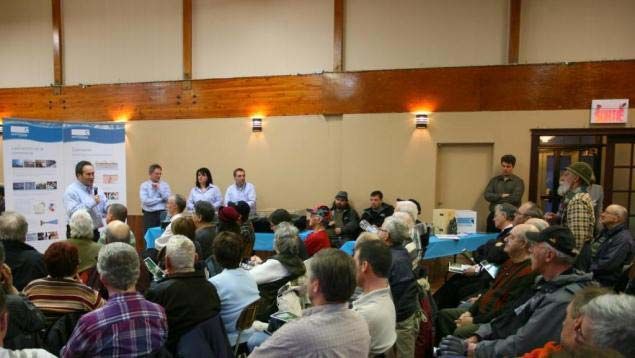
19
Permitting
On-Track for Completion in 2012
  Renard falls under the environmental protection
  regime of the James Bay and Northern Québec
  Agreement (JBNQA) and the Canadian
  Environmental Assessment Act.

  Permitting Milestones:
   • December 2011: Filing of the Renard Environmental
     and Social Impact Assessment (ESIA)
   • June 2012: Successful public hearings in Mistissini
     and Chibougamau hosted by the federal regulator
   • August 2012: Scheduled public hearings under the
     auspices of the Review Committee of the JBNQA.

  Renard is on track for the receipt of its
  “Certificates of Authorization” within 2012.

  The Renard ESIA describes a limited-footprint
  project with modest impacts on the local
  environment, all of which are well within existing
  Québec and federal standards.

  Stornoway has published the complete ESIA, the
  Environmental Baseline Study, and the project
  Closure Plan online.

                                                                                                                                 20
The “Mecheshoo” Agreement (IBA)
Renard’s Social Licence

  The Renard Diamond Project is situated close to
  the Cree Nation of Mistissini (CNM).

  In March 2012 Stornoway concluded an Impacts
  and Benefits Agreement, the “Mecheshoo
  Agreement”, with the CNM and the Grand
  Council of the Crees (EI).

  The Mecheshoo Agreement provides for
  employment and business opportunities for the
  Crees, fosters cultural, environmental and social
  protection, and provides for the Crees’
  participation in the project’s long term financial
  success.
                                                                From left: Chief Richard Shecapio, of the Cree Nation of
                                                              Mistissini, Grand Chief Matthew Coon-Come, of the Crees of
 “Stornoway has demonstrated an immense openness                Eeyou Itschee, and Matt Manson, CEO of Stornoway, in
  and has been willing to adapt the project in a manner      Mistissini on March 27th, 2012, on the occasion of the signing of
                                                                               the Mecheshoo Agreement.
 that respects the Crees of Mistissini, our interests, our
values, our culture and our way of life…At this point, we
can assure without a doubt that this project has a clear
           social acceptability from Mistissini”

      Chief Richard Shecapio, CNM, March 2012.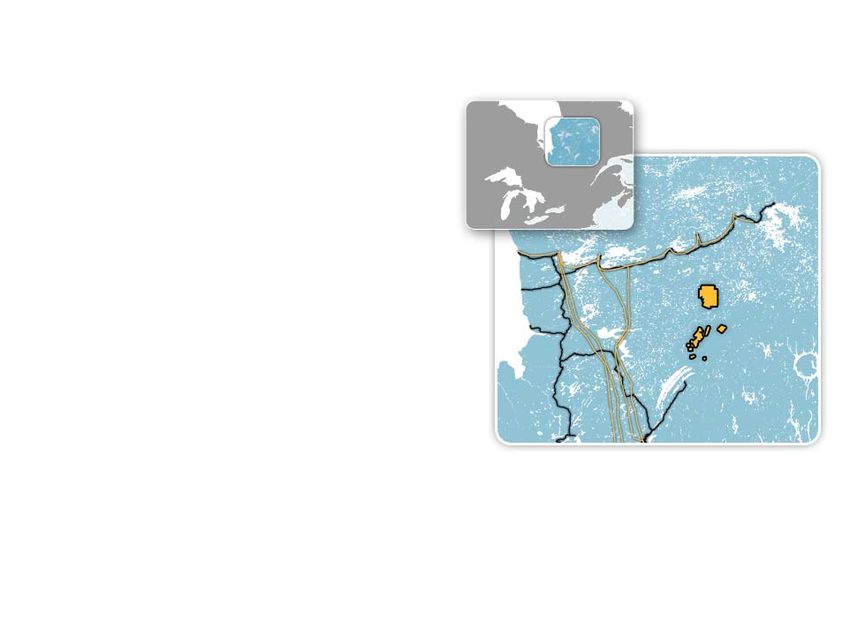
21
Strong Sponsorship in Québec
One of the World’s Best Mining Jurisdictions

Stornoway enjoys strong support from
Investissement Québec and the
Québec government
 • IQ is a 25% equity shareholder (34% fully
   diluted) with pre-emptive right to maintain
   ownership at 25%
 • IQ is committed to providing material
   lending support ($100M in project finance)

The Québec government is committed
to infrastructure development as part of
its “Plan Nord”
 • Québec has budgeted C$1.2B in
   infrastructure developments over the next
   five years, including the Route 167
                                                    Jean Charest, Premier of Québec, and Matt Manson, CEO of Stornoway, in
   Extension highway project.                       Chibougamau on August 1st for the announcement of Route 167 Extension
 • Stornoway’s involvement in the financing       Financing Agreement. Mr. Charest is holding core from Renard 65 containing a
                                                                              four-carat diamond.
   of the Route 167 Extension represents the
   first agreement signed under the “Plan
   Nord”.

                                                                                                                                    22
Declaration of Partnership
Cooperation Agreement with Chapais and Chibougamau

 In July 2012 Stornoway concluded a
 “Declaration of Partnership” with the neraby
 communities of Chapais and Chibougamau.

 Chapais and Chibougamau are important
 regional hubs for civic and mining services.

 The Declaration provides for a framework to
 address issues of mutual interest such as
 communication, employment, economic
 diversification, and attracting people to move
 to the region.

                                                             From left : Steve Gamache the Mayor of Chapais, Manon Cyr the
                                                            Mayor of Chibougamau and Patrick Godin the COO of Stornoway on
“The Declaration of Partnership is part of a new era         July 5th, 2012, on the occasion of the signing of the Declaration of
   of economic and social development based on                                          Partnership
respect, mutual trust and a shared understanding of
            the issues of each partner ”

M. Steve Gamache , Mayor of Chapais, July 5 2012
23
Stornoway’s Project Pipeline and Technical Credentials
As a strategic priority, Stornoway Mineral resources that are not mineral reserves
do not have demonstrated economic viability.
maintains an active exploration The potential quantity and grade of any “Target
for Further Exploration” (“TFFE”) is conceptual
program and technical team in nature, and it is uncertain if further
exploration will result in the target
based in Vancouver. being delineated as a mineral resource.
Stornoway’s project pipeline Aviat (90%)
comprises both advanced and Qilalugaq (100%) Advanced Project
Advanced Project 24-40 mcarats “TFFE”
grassroots projects. 26 mcarats Inferred
• Internal growth opportunities
through the advanced Aviat and
AEON (100%)
Qilalugaq Projects.
Grassroots
Exploration
• Grassroots discovery potential in
Saskatchewan (“Pikoo”) and
Québec (“AEON”) based on un- Pikoo (100%)
sourced indicator mineral Grassroots Exploration
anomalies with diamond potential.
Stornoway considers the
maintenance of in-house technical Renard (100%)
NI 43-101 Resource
expertise key to the growth of a 24 mcarats Indicated
successful diamond mining 17 mcarats Inferred
24-49 mcarats “TFFE”
business.
24
Stornoway’s Platform for Project Development and Financing
BALANCE SHEET*
Market Capitalization:
C$ 119 million
ANALYST COVERAGE
(based on voting and non-voting shares)h
RBC
Total Shares Outstanding: Outperform-
161 million Des Kilalea, $2.05
(Basic and Non-voting convertible shares) Speculative Risk
May11th, 2012
Total Options & Warrants Outstanding: 31 million Paradigm
David Davidson Buy $3.15
Nov 17th, 2011
Cash and Short Term Deposits:
C$ 47 million
(as of April 30th, 2012 and May 4th Financing) BMO
Ed Sterck Market Perform $1.00
Debt: June 7th 2012
C$ 20 million
($100m Standby Facility with IQ undrawn)
Desjardins
Fully Speculative Buy $1.70
PRO-FORMA SHAREHOLDING* Basic
Diluted
Brian Christie
May 8th, 2012
(common shares) 25.0% Laurentian
IQ** 33.7%
(non-voting convertible shares) -------- Eric Lemieux Buy $2.75
July 5th, 2012
Agnico-Eagle 10.6% 8.9%
National Bank
Caisse de dépôt et placement du Outperform-
9.0% 7.5% Eldon Brown $2.00
Québec Speculative Risk
May 4th, 2012
Rio Tinto plc 3.1% 2.4%
Float 52.3% 47.5%
Notes: Debt Facility: In December 2010, Stornoway announced a $100 million Credit Support Agreement with a subsidiary of Société générale de financement du Québec, now Investissment
Québec, with respect to future project debt financing. The Credit Support Agreement has an annual commitment fee of 175 bps undrawn, and will take the form of a direct project loan ranking
pari passu with concurrent senior lenders or, as appropriate, on a stand alone basis on terms no less favourable than prevailing commercially reasonable market terms.
*Based on market close of $0.74 on July 12 2012.
**IQ: Investissement Québec, the Québec government's industrial and financial holding company whose mission is to foster the growth of investment in Québec, thereby contributing to
economic development and job creation in every region25
Value Creation Through Project Financing
Aber Diamond Corporation, 1995-2007
Feasibility Study
July 1999- Market Low
26
Outlook
Renard: One of the world’s leading undeveloped
diamond projects
• Strong base case economics
• Extensive resource upside
• On-track permitting
• Strong social licence
• Good jurisdiction
• Infrastructure under development
The next 6-12 months
• $28.4m Pre-Development Program (EPCM)
• Permitting milestones through 2H 2012
• Resource Growth: Renard 65 Bulk Sample
• Project financing by 1H 2013
Financing Strategy
• Starting point: strong sponsor support ($100m credit
support agreement with Investissement Québec and
25% pre-emptive right on new equity).
• Currently pursuing a balanced debt-equity mix, with
engagement in the commercial debt market.
• Currently pursuing financing options tied to future
diamond supply.27
Appendix 1: Diamond Market Overview
28
Major Diamond Mines and Development Projects Worldwide
Few Enough Mines to Fit on One Map
Canada
• Ekati (BHPB)
• Diavik (Rio Tinto/Harry Winston) Russia
• Victor, Snap Lake, Gahcho Kue (De Beers) • Arkhangelsk District (Alrosa)
• Renard (Stornoway) • Yakutia District (Alrosa)
• Star (Shore Gold/Newmont) • Grib (LUKOIL)
India
• Bundar (Rio Tinto)
Australia
Sierra Leone • Argyle (Rio Tinto)
• Koidu, (Steinmetz Group) • Ellendale (Gem Diamonds)
Democratic Republic of Congo Tanzania
• Mbuyi-Mayi • Williamson (Petra Diamonds)
Angola
• Catoca (Alrosa)
Lesotho
Botswana South Africa • Letseng (Gem Diamonds)
• Jwaneng, Orapa (De Beers) • Venetia (De Beers) • Kao (Namakwa Diamonds)
• Gope (Gem Diamonds) • Finsch, Premier (Petra Diamonds) • Liqhobong (Firestone)
• AK6 (Lucara Diamonds) • Lace (DiamondCorp) • Mothai (Lucara)29
The Rough Diamond Business in Context
1/8th the Size of the Copper Business in 2011
160
140
Value World Production (Billion USD)
120
100
2008
80 2009
2010
60 2011
40
20
0
Diamond Pt-Pd Ni Al Au Cu
Source: USGS, LME, Kimberly Process
30
Rough Diamond Production
Stornoway Estimates
2011 Production, by Company, by Value 2011 Production, by Company, by Carats
Others
Others
27.2%
22.7%
Zimbabwe
HW 2.5% Zimbabwe
1.9% 7.1%
HW
Gem 2.1%
1.8%
Petra Gem De Beers
De Beers 0.2% 24.4%
1.4%
34.7%
Rio Tinto Petra
4.9% 1.1% Rio Tinto
BHPB 9.1%
5.1%
BHPB Alrosa
Alrosa 2.0% 26.9%
25.2%
Source: Company Reports and SWY Estimates 2010 Production, by Country, by Value Source: Company Reports and SWY Estimates
Russia
19.6%
Botswana
21.2%
Others
3.4%
Congo
1.4% Canada
Lesotho 18.9%
1.6%
Australia
2.1%
Zimbabwe
2.8% Namibia Angola South Africa
6.1% 8.0% 14.8% Source: Kimberly Process31
World Rough Diamond Resource Base
De Beers and Alrosa maintain the bulk of the world’s formerly established diamond resources (78% by
SWY estimates).
Not all diamond resources are created equal: large diversity in ore body grades and diamond value.
Resources (mCarats) Estimated Prices per Carat (US$)
$2776
1,800 1,000
950
1,600 900
850
800 $731
1,400 750
700
1,200 650
600
1,000 550
500
Mcts
800 450
$360 $335
$US
400
600 350
300
250
400 `
200 $182 $155
150 $137 $121 $120
200 100
50 $34
0 0
Source: Company Reports. De Beers shown at 100% Source: Stornoway Estimates, or Company Reports based on FY2011 reporting.
32
Global Rough Diamond Production Forecast
Almost all rough diamond production forecasts show flat or declining production long term.
Alrosa is an optimistic forecaster, with a 23% increase in carat supply 2010 to 2020. Others (such as RBC
below) forecast 15-17% supply growth. Rough production may not reach 2008 levels in carat terms again.
No large scale diamond mine has been discovered since the discovery of EKATI and Diavik in the early
1990s. New production from projects under development is not expected to materially impact overall supply.
AK6 (LUC) Renard (SWY) Star-Orion (SGF)
Koidu (Steinmetz) Gahcho Kue (MPV, De
Global Rough Diamond
Zimbabwe Production (MMct)
200 Beers)
180
160
140
120
Ct MM
100
80
60
40
20
0
2011E
2012E
2013E
2014E
2015E
2016E
2018E
2019E
2007A
2008A
2009A
2010A
2017E
2006A
Angola Australia Botswana Canada DRC Namibia Russia South Afr ica Zimbabwe Other
Source: RBC Capital Markets33
Rough Diamond Supply and Demand Forecasts
Alrosa October 2011
Current rough diamond demand forecasting focusses
on the expected expansion of the diamond jewelry
Normal GDP Forecast by Region
markets in Asia.
80,000 CAGR
10-20
Asian diamond jewelry demand growth is expected to 136,959
outpace GDP growth between 2010 and 2020 as the 60,000
26,112 +9.8%
$billions
101,845
traditions of diamond gifting become established within
40,000
the growing middle classes. 76,047 16,769
11,175 +10.4%
10,260 6,756 5,756 +2.9%
20,000 4,168 5,097
Alrosa (after Global Insight, October 2011) forecast 4,322
22,087 +4.3%
17,770
global diamond jewelry consumption g CAGR of 5.6% a 0
14,527
year, reaching $128bn by 2020, helping rough diamond 2010 2015F 2020F
demand to grow by 10.4% on average till 2020 and to United States Japan India China World
Source: Alrosa October 2011 after Global insight
reach $40.8bn (from 2010 level of $15.1bn). Note: GDP at purchasing power parity
Rough Diamond Demand Diamond Jewellery Consumption by Region
50 CAGR
73.8 97.4 127.8
120 10-20
45 40.8 28.2%
40 100
35 26.0 +12.5%
$billions
80 24.5%
30 21.5%
$billions
25.4 15.1 20.5
25 60
12.5 +11.0%
8.0 10.0
20 40 7.2 8.8
15.1 +2.4%
15 7.9
20 44.5
35.7 +4.7%
10 28.2
5 0
2010 2015F 2020F
0
2010 2015F 2020F United States Japan India China % of India to China World
Source: Alrosa October 2011 Source: Alrosa October 2011 after Global insights and Company estimates
34
Diamond Price Growth
Rough and Polished Diamonds Against a Basket of Indicators, 2003-April 2012
Commodity Index Data
700 16000
S&P TSX Composite Index Weekly Closing
14000
600
12000
500
Index October 2003 = 100
10000
400
8000
300
6000
200
4000
100
WWW R.I. Polished Prices Index Gold IMF CPI 2000
IMF IPI IMF CPI NonFuel IMF Coal(Aust) IMF Metal
IMF Cu S&P TSX Comp Index
0 0
01/01/07 01/01/08 31/12/08 31/12/09 01/01/11 01/01/12
Source: LME, IMF, Rough Diamond Price data after WWW International Diamond Consultants Limited Indexed to October 200335
Diamond Price Growth
The Impact of Rising Prices on Producer Results and Cutting Centre Liquidity
De Beers Sales, 2000-2011
$8
Long term price growth since
$7 2000 has caused De Beers
Sales (Billion USD)
$6 sales volumes to increase in
$5
$4 dollar terms despite a
$3 shrinking market share.
$2
$1
$- De Beers average sales price
2000
2001
2002
2003
2004
2005
2006
2007
2008
2009
2010
2011
up +27% 2009-2010 and
Source: Company Reports +29% 2010-2011.
Cutting Centre Debt, 2000-2011 Long term increase in cutting
$16
center debt levels to
$14 accommodate higher value
Debt (Billion USD)
$12 business with based on
$10
$8 disproportionately smaller
$6 change in sales volumes.
$4
$2
$-
2000
2001
2002
2003
2004
2005
2006
2007
2008
2009
2010
2011
Source: RBC Capital Markets
36
Future Rough Diamond Price Growth
Market Estimates and Stornoway’s Views
Production and Demand in Rough Terms
(Q1 2012 values)
Recent WWW supply and demand $60bn
modeling predicts excess diamond supply Production
$50bn Demand
between 2011 and 2014, and a Rough
Diamond Price CAGR of 7.5% (Nominal) $40bn
between 2011 and 2025.
$30bn
WWW modeling highlights short term $20bn
discrepancy between rough and polished
diamond pricing, yielding short term price $10bn
caution and long term optimism
$0bn
2003 2005 2007 2009 2011 2013 2015 2017 2019 2021 2023 2025
Recent De Beers supply and demand source:WWW Forecasts Ltd
Source: WWW February 2011
modeling contains no surplus supply
prediction, and is closer to the Alrosa
rough demand 10% CAGR (Nominal)
forecast to 2020, but with a more
pessimistic supply forecast.
In line with its peers and based on
guidance from WWW, Stornoway
assumes a 2.5% real price growth factor
to 2025 in the the Renard Feasibility
Study in the all-equity case valuation and
for mine planning purposes. A 0% factor
(ie flat diamond prices) is assumed in the
Financing Case model. Source: De Beers November 201137
Appendix 2: Feasibility Study Materials
38
Feasibility Study Contributors
Capital and Operating Cost Estimates, Onsite Infrastructure Design,
Construction Strategy, Risk Assessment
Process Plant, Underground Mine Design and Underground Reserve
Open Pit Design, Open Pit Reserve and Financial Analysis
Geotechnical, Processed Kimberlite Containment, Waste Water Management
Environmental, Social and Permitting Considerations
Rock Mechanics, Hydrogeology
NI 43-101 Resource
Human Resources, Operating Plan, Marketing Plan39
Financial Analysis
Project Assumptions, Valuation and Pay-Back
Key Assumptions in the Financial Model
Reserve Carats (m) 18.0
Tonnes Processed (m) 23.0
Recovered Grade (cpht) 78
Mining Average Ore Recovery (%) 83.5%
Parameters Average Mining Dilution (%) 14%
Dilution Grade (cpht) 0
Processing Rate (Mtonnes/a) 2.2
Mine Life (years) 11
Pre-Production Cap-ex (C$m) $802 Valuation Results (C$m)
Cost LOM Cap-Ex (C$m) $994
Parameters Oil Price (US$/barrel) $90 Pre-Tax After Tax
LOM Op-ex (C$/tonne) $54.71
NPV5% $899 $534
LOM Op-ex (C$/carat) $70.27
Gross Revenue (C$m) $4,112 NPV7% (Base Case) $672 $376
Marketing Costs 2.7% NPV9% $490 $248
Revenue DIAQUEM Royalty 2.0%
Parameters Operating Cash Flow (C$m) $2,677 IRR 18.7% 14.9%
(real terms) Operating Margin 68% Pay-Back (years) 4.65 4.80
Total Taxes and Mining Duties (C$m) $571
After Tax Net Cash Flow (C$m) $1,151
Renard 2 and Renard 3 (US$/carat) $182
Diamond
Renard 4 (US$/carat) $164
Price
Diamond Price Escalation, 2012-2025 2.5%
Parameters
Exchange Rate 1C$=1US$
Effective Date for NPV Calculation January 1 2012
Schedule Construction Mobilization July 1 2013
Parameters Plant Commisioning Commences July 1 2015
Commercial Production Declared January 1 2016
40
Financial Analysis
Capital Costs
Capital Costs (C$m) Direct Costs (C$531m)
Site Preparation & General $22.9 Onsite
Plant utilities
Mining $236.9 and infra.
32%
Mineral processing plant $168.4 19%
Onsite utilities and infrastructures $102.4
Owner’s Cost $86.2
Spares, fills, tools $10.2 Site Prep.
EPCM services $45.0 & General
Mining 4%
Field indirect costs, vendor representatives $22.5 45%
Construction camp & Catering $25.0
Freight and duties $8.1 Field,
Indirect Costs (C$271m)
$74.3 Vendor
Contingency EPCM reps
Total Pre-Production Capital $801.8 17% 8%
$57.3 Spares Camp
Escalation Allowance on Initial Capital
4% 9%
Pre-Production Revenue ($24.6)
Freight
Deferred & Sustaining Capital $138.8 3%
Deferred Capital (Route 167 Extension) $44.0
Salvage Value2 ($22.9) Owner’s
Cost
Total LOM Capital $994.4 32% Conting.
27%41
Financial Analysis
Operating Costs
Operating Unit Costs (Real Terms; C$)
$/tonne
Open Pit Mine $19.99
Underground Mine $24.11
Plant $14.82
G&A $14.69
Total $54.71 ($70.27/ct)
Notes: Pit costs incurred before January 1st, 2016 are capitalized
Operating Costs LOM Operating Costs (C$1,260m)
70 G&A,
$334.00 ,
60 27%
Plant,
50 $337.00 ,
27%
40 Others
Open Pit
30
Power Mine,
20 $40.70 ,
Labour 3%
10 Undergrou
nd Mine,
0 $547.90 ,
2016
2017
2018
2019
2020
2021
2022
2023
2024
2025
2026
43%
42
Financial Analysis
Valuation Sensitivities
30.0% PRE-TAX IRR 1,200,000 PRE-TAX NPV7%
25.0% 1,000,000
20.0% 800,000
15.0% 600,000
10.0% 400,000
5.0% 200,000
0.0% -
80% 90% 100% 110% 120% 80% 90% 100% 110% 120%
Operarting Cost 20.7% 19.7% 18.7% 17.7% 16.7% Operating Cost 808,813 740,372 671,932 603,487 535,040
Capital Cost 23.7% 21.0% 18.7% 16.7% 15.0% Capital Cost 829,526 750,717 671,932 593,125 514,316
Revenue 11.6% 15.4% 18.7% 21.8% 24.6% Revenue 235,672 453,813 671,932 890,040 1,108,14
30.0% AFTER-TAX IRR 700,000 AFTER-TAX NPV7%
25.0% 600,000
500,000
20.0%
400,000
15.0%
300,000
10.0%
200,000
5.0% 100,000
0.0% -
80% 90% 100% 110% 120% 80% 90% 100% 110% 120%
Operating Cost 16.5% 15.7% 14.9% 14.0% 13.2% Operating Cost 463,661 419,627 375,577 331,523 287,283
Capital Cost 19.1% 16.8% 14.9% 13.2% 11.8% Capital Cost 488,669 432,381 375,577 318,658 261,323
Revenue 9.2% 12.2% 14.9% 17.4% 19.8% Revenue 94,589 236,370 375,577 513,934 651,29643
Financial Analysis
Renard Diamond Valuation. Conducted by WWW May 9th to 13th 2011
Conducted by WWW International Diamond
Consultants Ltd. May 9th-13th 2011
Achieved Prices for the Valuation Samples WWW Price Modeling
Valuation
Kimberlite Average of Minimum of Maximum of WWW
Sample Number of WWW WWW Base WWW "High"
Body Independent Independent Independent "Minimum"
(carats) Independent Valuation Case Model Model
Valuations Valuations Valuations Model
Valuations (US$/carat) (US$/carat) (US$/carat)
(US$/carat) (US$/carat) (US$/carat) (US$/carat)
Renard 2 1,580 5 $173 $143 $195 $195 $182 $236 $163
Renard 3 2,753 5 $171 $137 $195 $190 $182 $205 $153
Renard 4 2,674 5 $100 $87 $107 $107 $1121 $185 $105
1
The Renard Feasibility Study of November 2011, consistent with the NI 43-101 compliant Mineral Resource of January 2011, utilizes a higher diamond price based on an analysis of
diamond breakage and poor plant recovery of the Renard 4 valuation sample, which is $164/carat. All samples utilize a +0.85mm (+1 DTC) cutoff.
44
Financial Analysis
Renard Diamond Valuation Sensitivities
WWW determine High and Minimum sensitivities on their Base Case diamond price model. WWW state that
it is unlikely that an actual diamond price achieved for each kimberlite body upon production would fall below
the “Minimum” sensitivity, but it is possible that the actual diamond price achieved may be higher than the
“High” sensitivity, which is not a maximum price.
The Feasibility Study Base Case diamond price of US$182/carat for Renard 2 and 3 and US$164/carat for
Renard 4 derives from a value modeling approach that assumes a single diamond size distribution in the
three kimberlites.
An alternative interpretation, that each kimberlite’s diamond population is unique and is correctly represented
by its diamond sample, yields diamond price models of US$208/carat for Renard 2, US$165/carat for Renard
3 and US$112/carat for Renard 4.
WWW
WWW Base WWW "High"
"Minimum"
Kimberlite Body Case Model Model
Model
(US$/carat) (US$/carat)
(US$/carat)
Scenario 1 (Base Case): Utilizing an R2-R3 Size Frequency Model $182 $201 $163
Renard 2
Scenario 2 (Alternative): Utilizing an R2 only Size Frequency Model $208 $236 $186
Scenario 1 (Base Case): Utilizing an R2-R3 Size Frequency Model $182 $205 $168
Renard 3
Scenario 2 (Alternative): Utilizing an R3 only Size Frequency Model $165 $183 $153
Scenario 1 (Base Case): Utilizing an R2-R3 Size Frequency Model $164 $185 $152
Renard 4
Scenario 2 (Alternative): Utilizing an R4 only Size Frequency Model $112 $121 $10545
Financial Analysis
Renard Diamond Valuation Sensitivities
This “Alternative” diamond price model is highly accretive to the project’s valuation given the dominance of
Renard 2 in the mine plan. The interpretation of similarity in the diamond populations is the more
conservative approach.
Pre-Tax After-Tax
Kimberlite Body NPV7% Pay-Back NPV7% Pay-Back
IRR IRR
(C$m) (years) 1 (C$m) (years) 1
WWW Minimum Model $397 14.6% 5.34 $199 11.5% 5.46
Feasibility Study Base Case Model $672 18.7% 4.65 $376 14.9% 4.80
Alternative Model $871 21.8% 4.07 $502 17.4% 4.20
WWW High Model $1,261 26.5% 3.49 $747 21.4% 3.90
1Calculated on an after-tax basis
A real-terms diamond price growth factor of 2.5% per annum has been applied between 2012 and 2025.
This is consistent with well constrained rough diamond supply and demand forecasts and industry best-
practice. WWW have advised that Stornoway’s assumptions on diamond price and diamond price growth
are “reasonable in the context of the overall supply and demand environment” of the diamond industry.
The project shows strong sensitivity to future diamond price growth.
Pre-Tax After-Tax
Diamond Price Escalation (2012-2025)1
NPV7% Pay-Back NPV7% Pay-Back
IRR IRR
(C$m) (years) 1 (C$m) (years) 1
0% per annum $227 11.8% 5.80 $93 9.2% 5.91
2.5% per annum (Base Case) $672 18.7% 4.65 $376 14.9% 4.80
5% per annum $1,228 25.1% 3.87 $724 20.3% 4.00
1Calculated on an after-tax basis
46
Reserves and Resources
Renard Mineral Reserve Estimate, Announced November 16th, 2011
Mining Recovery Factors Utilized in the Reserve
Probable Mineral Reserve
Calculation
Contained Internal Mining Mining
Grade Tonnes
Kimberlite Carats
(cpht) (millions) Dilution Recovery Dilution
(Millions)
Renard 2 OP 95 1.31 1.24 0.0% 96.0% 7.1%
Renard 2 UG 84 16.30 13.66 6.9% 83.2% 14.0%
Renard 3 OP 93 0.72 0.67 0.0% 96.0% 10.5%
Renard 3 UG 84 1.00 0.84 21.1% 85.0% 14.0%
Renard 4 UG 42 3.72 1.58 1.4% 78.2% 14.0%
Total
Indicated
78 23.06 18.00 5.9% 83.5% 13.5%
Tonnage Carats Revenue
R4,
R4, 9% R4, 8%
16%
R3, R3, 8%
8%
R3,
R2 ,
7%
76% R2 , R2 ,
83% 84%
Notes: Reserve categories are compliant with the "CIM Definition Standards on Mineral Resources and Reserves". Totals may not add due to rounding. Grades are estimated at a
+1DTC sieve size cut-off.47
Reserves and Resources
Renard Mineral Resource Estimate, Announced January 24th, 2011
Kimberlite Grade Tonnes Contained Carats
(cpht) (millions) (Millions)
Renard 2 103 17.63 18.09
Renard 3 106 1.75 1.85
Renard 4 53 7.25 3.81
Renard 9 -- -- --
Lynx Dyke -- -- --
Hibou Dyke -- -- --
Total Indicated 89 26.63 23.76
Renard 2 118 5.21 6.14
Renard 3 118 0.54 0.64
Renard 4 44 4.76 2.09
Renard 9 47 5.70 2.69
Renard 65 29 12.94 3.72
Lynx Dyke 107 1.80 1.92
Hibou Dyke 144 0.18 0.26
Total Inferred 56 31.12 17.45
Notes: Resource categories are compliant with the "CIM Definition Standards on Mineral Resources and Reserves". Mineral resources that are not mineral reserves do not have
demonstrated economic viability. Indicated Mineral resources are Inclusive of the Mineral Reserve. Totals may not add due to rounding. Grades are estimated at a +1DTC sieve size
cut-off.
48
Reserves and Resources
Renard Exploration Upside, Announced January 24th, 2011
Kimberlite Grade Tonnes Contained Carats
(cpht) (millions) (Millions)
Renard 2 103 to 188 4.0 to 4.6 4.1 to 8.6
Renard 3 107 to 168 0.8 to 1.6 0.8 to 2.8
Renard 4 38 to 79 11.1 to 15.3 4.2 to 12.1
Renard 9 45 to 50 3.9 to 6.3 1.7 to 3.2
Renard 65 23 to 33 29.5 to 41.6 6.8 to 13.7
Lynx Dyke 96 to 120 3.1 to 3.2 3.0 to 3.8
Hibou Dyke 104 to 151 2.7 to 2.9 2.9 to 4.3
Total Exploration
Upside
55.1 to 75.5 23.5 to 48.5
Notes: The potential quantity and grade of any exploration target (previously referred to as “potential mineral deposit”) is conceptual in nature, and it is uncertain if further exploration
will result in the target being delineated as a mineral resource. The exploration upside for the Renard kimberlite pipes has been determined by projecting reasonable kimberlite
volumes from the base of the inferred Resource to a depth of 700m below surface. In the case of the Lynx and Hibou dykes, the exploration upside was established on the basis of
known drill intersections of kimberlite for which insufficient diamond sampling exists to adequately estimate a diamond resource grade.49
Processed Kimberlite Containment
PKC site selection was based on a
comprehensive evaluation of 5 sites.
Geochemical characterisation of Processed
Kimberlite (“PK”) and country rock waste
indicates minimal metal leach potential and
no acid generation.
PKC facility will be a dry stacked facility with
no requirement for a liner. Dewatered PK Characterisation
Ch
PKC facility can accommodate all current
Indicated and Inferred Resources (44.3 Mt).
Waste rock can be used as construction
aggregate.
PK will be de-watered by centrifuge and
trucked to the PKC site. PKC is an
engineered facility requiring compaction of
berms and placement of erosion barriers.
The PK deposition plan allows for
progressive rehabilitation and re-vegetation.
No fish habitat will be impacted by PK
disposal.
PKC Facility in 2026
50
Water Management
All water in contact with mining materials will be collected and treated prior to release. Treated water will
meet standards defined by Québec MDDEP Directive 019, Québec environmental effluent objectives for
the protection of aquatic life, and the Canadian Metal Mining Effluent Regulation.
Single watershed impacted by all mining activities.
Water recycling for process plant.
Water management system includes a network of collection ditches, a
pumping network, a catch basin sump at Renard 65, a water
treatment plant, and submerged discharge within Lake Lagopede Wastewater Treatment Plant
Waster Water Management Schematic
PKC
Mine wastewater
astewater
treatment
ent plant
R65
Waste
ste Rock
Was
R2/R3
R Overburden
Overburde
en
Process Plant
Ore
Pump Station
Collection Ditches51
Closure Plan
Stornoway acknowledges that it is only a temporary
user of land that will be returned to its traditional
users at the end of mine life. In this context, project
design has prioritized minimal environmental
footprint and progressive rehabilitation.
Buildings have been designed and materials
selected to facilitate dismantling, recycling and site
re-vegetation at the end of the mine life.
Mine planning ensures that all waste rock will be
used for construction, backfill of the underground
Before
mine. Open-pits will be flooded to create new fish
habitats.
PKC facility has been designed to ensure
progressive re-vegetation and ease of maintenance
during operations.
Benches will be progressively rehabilitated.
Airstrip will either be rehabilitated or vested to
authorities to become a regional infrastructure.
Post-closure environmental monitoring program will
be implemented. After
52
Appendix 3: Project Comparables53
Project Comparables
Recent Canadian Diamond Mines Compared as of the Date of each BFS
Ekati (1998) Diavik (1999) Victor (2008) Renard FS
BHPB, As Built Rio-Tinto, As De Beers, As (2011)
Estimates Built Estimates Built Estimates
Resource Parameters
Resource (m carats) 161 133 No data 41
Resource (US$) $10B $6.7B No data $7.2B
Resource Grade (cpht) 110 360 No data 72
Average Resource Diamond Price $60 $50 No data $175
Resource Mine Life 25 25 No data n/a
Reserve Parameters
Reserve (carats) 72 102 6 18
Reserve (dollars) $6B $5.5B $2.4B (est) $3.2B
Reserve Grade (cpht) 109 400 20 78
Average Reserve Diamond Price $84 $55 $400 $180
Average Reserve Ore Value (US$) $92 $220 $80 $140
Reserve Mine Life 17 19 12 11
Production Parameters
Annual Production (mCarats) Up to 3.6 Up to 7 0.5 Up to 2.1
Annual Revenue (US$m) $302 $385 $215 $364
LOM Op-ex (Cdn$/tonne) $100 to $60 $100 No data $55
LOM Op-ex (Cdn$/carat) $92 to $55 $25 No data $70
Canadian-US Dollar c.$0.75 $0.67 c.$1.00 $1.00
Pre-Production Cap-ex (Cdn$) $900m $1.3B $982m $802m
Source: Company Reports and Stornoway Estimates. Excludes resource and diamond price upside from both projects. Excludes
diamond price escalators. Assumes similar diamond recovery and mining dilution parameters.
54
Project Comparables
Recent Canadian Diamond Development Projects Compared as of the Date of each BFS
Gahcho Kué FS (2010) Star-Orion FS (2011) Renard FS (2011)
Mountain Province Shore Gold
Resource Parameters
Resource (m carats) 61 43 41
Resource (US$) $5.1B $11B $7.2B
Resource Grade (cpht) 168 12 72
$85 (WWW Apr 10)
Average Resource Diamond Price $256 (WWW Feb 11) $175 (WWW May 11)
$65 (DTC Apr 10)
Resource Mine Life n/a n/a n/a
Reserve Parameters
Reserve (carats) 49 34 18
Reserve (dollars) $3.7B $8.2B $3.2B
Reserve Grade (cpht) 157 12 78
Average Reserve Diamond Price $75 $242 $180
Average Reserve Ore Value (US$) $118 $30 $140
Reserve Mine Life 11 20 11
Production Parameters
Annual Production (mCarats) 4.5 1.7 Up to 2.1
Annual Revenue (US$m) $338 $411 $364
LOM Op-ex (Cdn$/tonne) $49 $14 $55
LOM Op-ex (Cdn$/carat) $31 $114 $70
Canadian-US Dollar 0.96 0.945 1.00
$550m
Pre-Production Cap-ex (Cdn$) $1.9B $802m
($800m De Beers Dec 11)
Source: Company Reports. Excludes resource and diamond price upside from both projects. Excludes diamond price escalators.
Assumes similar diamond recovery and mining dilution parameters.55
Project Comparables
Diamond Industry Cost Curve (Anglo American November 2011 after De Beers 2010)
COST/REVENUE
2.0
Gahcho Kue (development project)
10.5
Cost/revenue (x)
Renard with Powerline
Namedeo operations
Snap lake
1.0
Damtshaa
Renard
Orapa
Venetia
Jwaneng
0.5
0.0
0 2,000 4,000 6,000 8,000 10,000 12,000 14,000 16,000
Cumulative revenue (US$m)
Source: Anglo-American (After De Beers, November 2011), and Stornoway Estimates
56
Appendix 4: Management Biographies57
Appendix: Management Biographies
Matt Manson, PhD.
Matt Manson was appointed President of Stornoway Diamond
Corporation in March 2007 following the acquisition of Ashton
Mining of Canada and Contact Diamond Corporation, and
subsequently President & CEO in January 2009.
As President & CEO, Mr. Manson is responsible for the
management of the company as a whole, playing a leadership role
in all key business units including finance and budgets, exploration,
human resources, investor relations and advanced project
development including the Renard Diamond Project.
PRESIDENT, CHIEF EXECUTIVE
OFFICER AND DIRECTOR Between 1999 and 2005 he was employed by Aber Diamond
Corporation (now Harry Winston Diamond Corporation) as VP
Marketing and subsequently VP Technical Services & Control,
during which time he participated in the US$230m project financing
for the Diavik Diamond Project and oversaw Aber's technical and
marketing operations during the feasibility, construction and early
production phases of Diavik. Between 2005 and 2007 he was
employed by Contact Diamond Corporation, formerly Sudbury
STORNOWAYDIAMOND COPRORATION Contact Mines and a 40% owned subsidiary of Agnico-Eagle Mines
Limited, as President & COO and subsequently President & CEO.
36 TORONTO STREET, SUITE 1000
TORONTO, ONT, M5C2C5 Mr. Manson is a graduate of the University of Edinburgh (BSc
Geophysics, 1987) and the University of Toronto (MSc Geology 1989
TEL. : (416) 304-1026
and PhD Geology, 1996), and has over 17 years of experience in
www.stornowaydiamonds.com TSX:SWY
diamond exploration, development and production.
58
Appendix: Management Biographies
Patrick Godin, Eng., Asc.
Pat Godin joined Stornoway as Chief Operating Officer in May 2010 and
was appointed to the Board of Directors in October 2011. He is
responsible for the development of the Renard Diamond Project in north-
central Québec, on track to becoming Québec’s first diamond mine.
Prior to joining Stornoway Diamond, Mr. Godin acted as Vice President,
Project Development for GMining Services, focused on the development
of mining projects in the Americas and West Africa, and was responsible
for the developed of the Essakane Mine in Burkina Faso under contract to
IAMGOLD.
CHIEF OPERATING OFFICER He was previously Vice President of Operations for Canadian Royalties,
AND DIRECTOR
specifically heading the development of their nickel project in Northern
Québec. He was also President and General Manager of CBJ-CAIMAN
S.A.S., a French subsidiary of Cambior / IAMGOLD, holder of the Camp
Caïman gold mining project located in French Guiana. For many years, he
was involved in Cambior’s various Canadian properties in Abitibi-
Témiscamingue, through progressive management positions in project
development and mine management.
He holds a bachelor’s degree in mining engineering from Université Laval
LES DIAMANTS STORNOWAY (CANADA) INC. in Québec. Mr. Godin is a member of the “Ordre des Ingénieurs du
Québec”, of the Certified Directors College and of The Canadian Institute
1111 RUE ST. CHARLES
of Mining, Metallurgy and Petroleum (CIM). He is the Chairman of the
LONGUEUIL, QUÉBEC J4K 4G4 Board of Orbit-Garant Drilling and is a member of the Technical Advisory
TEL. : (450) 616-5555
Committee for CANMET, known for its technical excellence in mining and
www.stornowaydiamonds.com TSX:SWY
mineral processing.59
Appendix: Management Biographies
Zara Boldt, B.A., CGA
Zara Boldt was appointed Vice President, Finance with Stornoway
in May 2007, after serving as Stornoway’s Controller between 2004
and 2007, and Chief Financial Officer in March 2010.
As Vice President Finance and CFO, Ms. Boldt is responsible for the
management of the corporate and financial affairs of the
corporation, and for the oversight of its regulatory reporting
requirements.
Ms. Boldt has held positions of progressive responsibility with
VICE PRESIDENT, FINANCE AND several mineral exploration companies, in addition to severeal years
CFO of experience with a national investment dealer. Her most recent
resource industry roles include CFO for Sherwood Copper
Corporation from May 2006 to May 2007 and Controller for the
Northair Group of Companies between May 2004 and April 2007.
Ms. Boldt is a Certified General Accountant and a graduate of the
University of Puget Sound in Tacoma, Washington. She is a director
of Troon Ventures Ltd., where she serves as Chair of the Audit
STORNOWAYDIAMOND COPRORATION
Committee.
980 W FIRST STREET, #116
NORTH VANCOUVER, BC V7P 3N4
TEL. : (604) 983-7750
www.stornowaydiamonds.com TSX:SWYYou can also read