Boliden Summary Report Garpenberg
←
→
Page content transcription
If your browser does not render page correctly, please read the page content below
9

      Boliden Summary Report
                  Resources and Reserves | 2020

Garpenberg

               Prepared by Morvan Derrien
Table of contents
1       Summary                                                        3

1.1     Competence                                                     3

2       General introduction                                           4

2.1     Pan-European Standard for Reporting of Exploration Results,
        Mineral Resources and Mineral Reserves – The PERC Reporting
        Standard                                                   4

2.2     Definitions                                                    4

2.2.1   Mineral Resource                                               4

2.2.2   Mineral Reserve                                                5

3       Garpenberg                                                     6

3.1     Project Outline                                                6

3.2     Major changes 2020                                             6

3.2.1   Technical studies                                              6

3.3     Location                                                       6

3.4     History                                                        8

3.5     Ownership                                                      9

3.6     Permits                                                        9

3.7     Geology                                                       10

3.8     Exploration procedures and data                               13

3.8.1   Drilling techniques and downhole survey                       14

3.8.2   Logging and sampling                                          14

3.8.3   Density                                                       14

3.8.4   Analysis and QAQC                                             14

3.9     Exploration activities and infill drilling                    15

3.10    Mining methods, processing and infrastructure                 16

3.11    Prices, terms and costs                                       18

3.12    Mineral resources                                             20

3.13    Mineral reserves                                              21

3.14    Comparison with previous year                                 23

3.15    Reconciliation                                                27

4       References                                                    29
4.1     Public references                                             29

4.2     Internal references                                           29

Appendix 1                                                            30

              Boliden Summary Report, Resources and Reserves 2020, Garpenberg| 2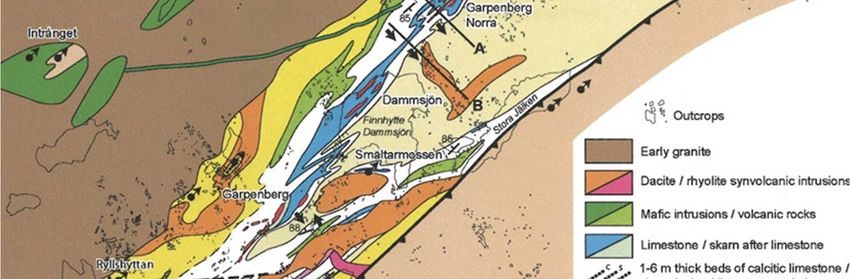
1 SUMMARY
In 2020 the total mineral reserves in Garpenberg increased by 14.7 Mt (million metric
tonnes) to 89.5 Mt. Measured and indicated resource in Garpenberg decreased by 7.7 Mt to
36.6 Mt. Inferred resource increased by 1.4 Mt to 25.5 Mt.

Table 1-1 Mineral Resources and Mineral Reserves in Garpenberg 2020-12-31

                                              2020                                          2019
                              kton    Au      Ag      Cu     Zn     Pb      kton    Au      Ag      Cu     Zn     Pb
Classification                        (g/t)   (g/t)   (% )   (% )   (% )            (g/t)   (g/t)   (%)    (%)    (%)
Mineral Reserves
Proved                       23 500   0.23     97     0.03   3.1    1.2    21 000   0.2     101     0.03   3.60   1.41
Probable                     66 000   0.35     93     0.05   2.7    1.3    53 800   0.3      94     0.05   2.89   1.39
                     Total   89 500   0.3     94      0.04   2.8    1.3    74 800   0.3     96      0.05   3.10   1.40
Mineral Resources
Measured                     3 900    0.33     94     0.06   3.4    1.7     4 300   0.3     100     0.06   3.32   1.57
Indicated                    32 600   0.35     89     0.05   2.7    1.3    40 000   0.3      88     0.05   2.76   1.33
                 Total M&I   36 600   0.35    90      0.06   2.8    1.4    44 300   0.3     90      0.05   2.82   1.36
Inferred                     25 500   0.42     57     0.07   2.5    1.4    24 100   0.5      56     0.08   2.84   1.68

1.1 Competence
Multiple participants have been involved and contributed to this summary report. Roles and
responsibilities are listed in Table 1-2.

Table 1-2. Contributors and responsible competent persons for this report

    Description                               Contributors                                  Responsible CP

    Compilation of this report                Morvan Derrien                                Thomas Hedberg
    Geology                                   Morvan Derrien                                Gunnar Agmalm
    Resource estimation                       Sofia Höglund                                 Gunnar Agmalm
    Metallurgy                                Anders Sand                                   Anders Sand
    Mining                                    Catarina Barreira                             Thomas Hedberg
    Environmental and legal permits           Lotta Tanse                                   Nils Eriksson

Thomas Hedberg has a background in numerous Managerial positions in Boliden from
Mining Engineering to Mine Manager in Sweden and Canada. He currently holds a position
as Senior Project Manager for Boliden Mines. This experience gives the general view and
understanding of the whole mining process from exploration to concentrate.
Member in FAMMP 1 since 2018.

1   Fennoscandian Association for Metals and Minerals Professionals

                 Boliden Summary Report, Resources and Reserves 2020, Garpenberg| 3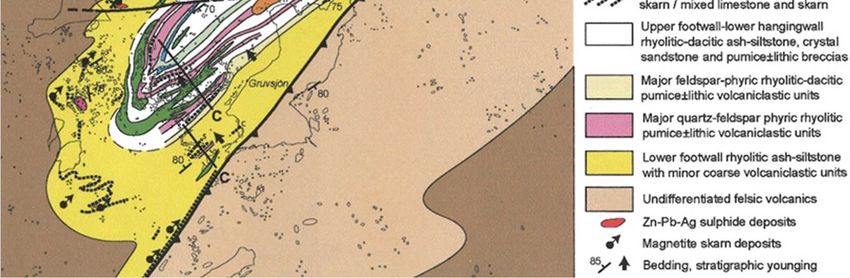
2 GENERAL INTRODUCTION
This report is issued annually to inform the public (shareholders and potential investors) of
the mineral assets in Garpenberg held by Boliden. The report is a summary of internal /
Competent Persons’ Reports for Garpenberg. Boliden method of reporting Mineral
Resources and Mineral Reserves intends to comply with the Pan-European Reserves and
Resources Reporting Committee (PERC) “PERC Reporting Standard 2017”.

The PERC Reporting Standard is an international reporting standard that has been adopted
by the mining associations in Sweden (SveMin), Finland (FinnMin) and Norway (Norsk
Bergindustri), to be used for exploration and mining companies within the Nordic countries

2.1   Pan-European Standard for Reporting of Exploration Results, Mineral
      Resources and Mineral Reserves – The PERC Reporting Standard
PERC is the organisation responsible for setting standards for public reporting of
Exploration Results, Mineral Resources and Mineral Reserves by companies listed on
markets in Europe. PERC is a member of CRIRSCO, the Committee for Mineral Reserves
International Reporting Standards, and the PERC Reporting Standard is fully aligned with
the CRIRSCO Reporting Template.

The PERC standard sets out minimum standards, recommendations and guidelines for
Public Reporting of Exploration Results, Mineral Resources and Mineral Reserves in Europe.

2.2 Definitions
Public Reports on Exploration Results, Mineral Resources and/or Mineral Reserves must
only use terms set out in the PERC standard.

Figure 2-1. General relationship between Exploration Results, Mineral Resources and Mineral Reserves
(PERC 2017).

2.2.1 Mineral Resource
A Mineral Resource is a concentration or occurrence of solid material of economic interest
in or on the Earth’s crust in such form, grade or quality and quantity that there are
reasonable prospects for eventual economic extraction.

              Boliden Summary Report, Resources and Reserves 2020, Garpenberg| 4
2.2.2 Mineral Reserve
A Mineral Reserve is the economically mineable part of a Measured and/or Indicated Mineral
Resource.

It includes diluting materials and allowances for losses, which may occur when the material is
mined or extracted and is defined by studies at Pre-Feasibility or Feasibility level as
appropriate that include application of Modifying Factors. Such studies demonstrate that, at
the time of reporting, extraction could reasonably be justified.

            Boliden Summary Report, Resources and Reserves 2020, Garpenberg| 5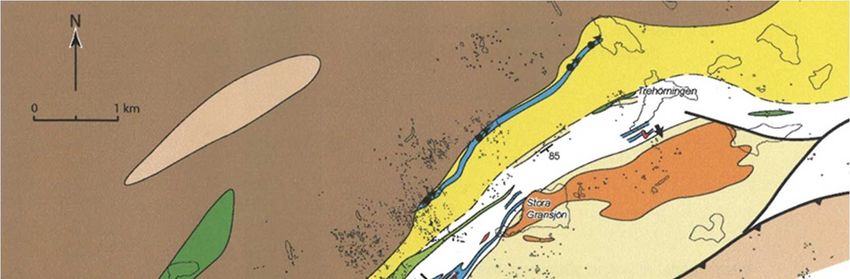
3 GARPENBERG
3.1 Project Outline
Garpenberg is a Zn-Pb-Ag-(Cu-Au) underground mine where the ore is mined from between
500 meters to more than 1 400 meters below surface. The mine encompasses several
polymetallic ore bodies. See Figure 3-3, Figure 3-4 and Figure 3-5.
The mined out ore tonnage in 2020 totaled 3000 Kton which is an increase of 135 Kton from
previous year. Almost 80 % of the mined tonnage derives from the largest ore body,
Lappberget.
Zinc and silver are the most valuable commodities in Garpenberg, each accounting for about
37.5 % of the revenue, followed by lead at 15 % and copper-gold at 10 %.
3.2 Major changes 2020
In 2020 the total mineral reserves in Garpenberg increased by 14.7 Mt (million metric
tonnes) to 89.5 Mt. Measured and indicated resource in Garpenberg decreased by 7.7 Mt to
36.6 Mt. Inferred resource increased by 1.4 Mt to 25.5 Mt.
3.2.1 Technical studies
In 2020, a technical report was completed regarding the upgrade of parts of Kvarnberget
mineral resource into ore reserve (Derrien 2021). The upgrade from resource to reserve
concerns position KVARN 1050-1150Z and KVARN 650-1050Z central pillar.
A technical study was also conducted to consider the technical and economic feasibility of
mining 2 nd pass stopes in Lappberget (Barreira & Derrien 2020).
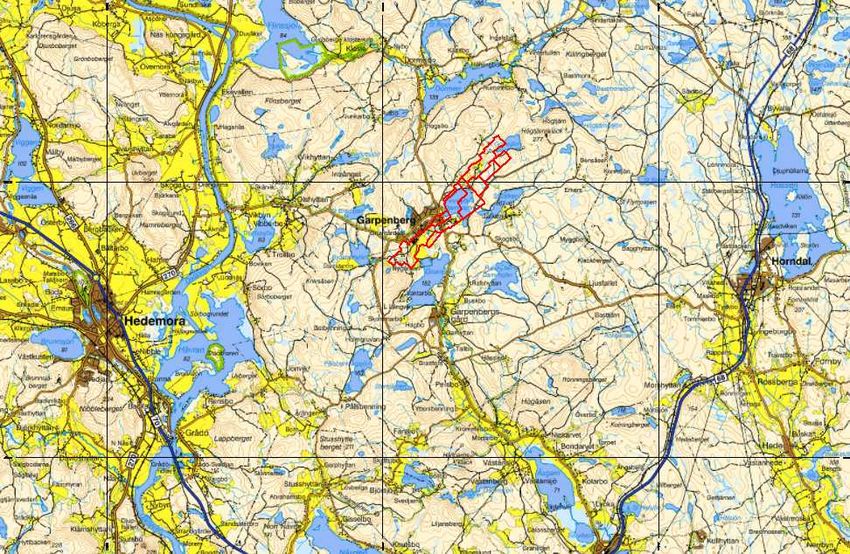
3.3 Location
Garpenberg is located in the Hedemora municipality in central Sweden 180 km NW of
Stockholm at coordinates (WGS84) latitude 60° 19’ 27”N, longitude 16° 13’ 38”. Figure 3-1
and Figure 3-2 show the geographic location and the mining concessions of Garpenberg.
Boliden Summary Report, Resources and Reserves 2020, Garpenberg| 6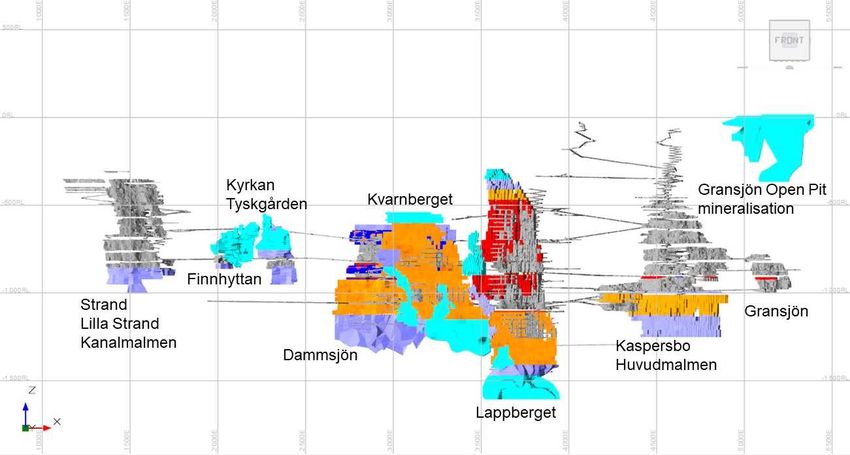
Figure 3-1. Regional map showing Garpenberg mining concession licenses in red colour.
Coordinate system in the map is RT90 2.5 gon W .

Figure 3-2. Detailed map of Garpenberg mining concessions.

              Boliden Summary Report, Resources and Reserves 2020, Garpenberg| 7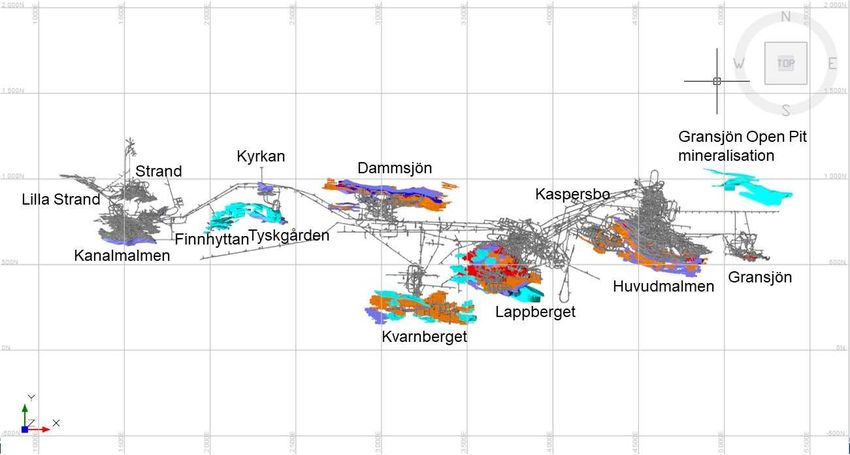
3.4 History
Historical documents show that systematic mining has been conducted in Garpenberg since
the 13th century. Recent studies from lake sediments 2017 however push back the evidence
for early ore mining in Garpenberg even further, from the Middle Ages to the pre-Roman
Iron Age around 400 BC (Bindler et al., 2017).

In 1957 Boliden acquired the Garpenberg mine from AB Zinkgruvor. A total of 54.4 Mt of
ore has been processed since Boliden took over the operations (Table 3-1).

A chronological list of historically significant events is presented in appendix 1.

Table 3-1. Annual production numbers 1957-2019. Between 1957 and 1995 the processed ore tonnes and
grades are presented with 5-year intervals, while figures for mined ore are missing. From 2005 to 2014 ore
from the Lovisagruvan mine was also processed in Garpenberg. A total of 54.4 Mt of ore has been processed
since Boliden acquired the mine from AB Zinkgruvor in 1957.

 Year         Mined      Processed        Grades                                                 Lovisa
              Ore        Ore
              Kton       Kton             Au g/t        Ag g/t        Zn %          Pb %         Kton

 1957                    260              1.2           69            2.84          2.34
 1960                    306              0.7           81            4.3           3.0
 1965                    297              0.9           116           4.9           3.3
 1970                    307              0.9           110           4.2           2.7
 1975                    349              0.6           114           3.2           1.9
 1980                    427              0.5           112           3.0           1.8
 1985                    534              0.4           138           3.0           1.9
 1990                    747              0.5           135           3.6           2.0
 1995                    750              0.4           133           4.3           2.2
 2000         1003       976              0.5           141           3.9           1.9
 2001         1018       984              0.4           136           3.9           1.8
 2002         997        1058             0.4           153           4.0           1.8
 2003         1067       1062             0.4           151           4.6           1.9
 2004         1087       1074             0.3           124           5.6           2.2
 2005         1115       1102             0.3           117           5.8           2.3          13.3
 2006         1167       1182             0.4           123           5.7           2.2          17.1
 2007         1218       1255             0.3           126           6.3           2.5          17.1
 2008         1341       1365             0.3           130           6.9           2.6          27.7
 2009         1425       1394             0.3           139           7.3           2.8          31.7
 2010         1369       1443             0.3           133           6.6           2.5          28.9
 2011         1441       1456             0.3           134           6.1           2.4          37.5
 2012         1602       1484             0.27          130           5.6           2.1          39.0
 2013         1600       1495             0.3           153           5.2           2.1          39.8
 2014         1891       2224             0.31          136           5.1           2.1          38.7
 2015         2304       2367             0.32          156           5.0           2.1

              Boliden Summary Report, Resources and Reserves 2020, Garpenberg| 8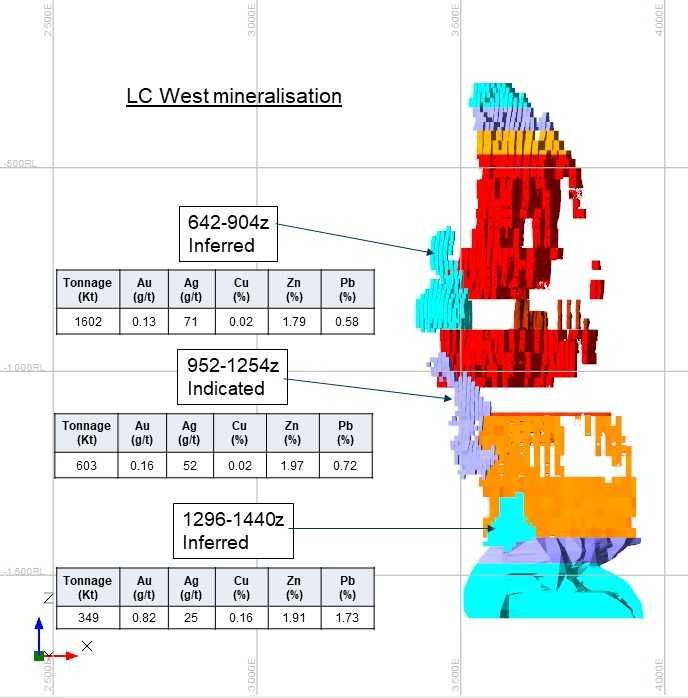
2016        2610        2622            0.31        150         4.4          1.8
 2017        2630        2634            0.30        134         4.3          1.8
 2018        2625        2622            0.29        135         4.1          1.6
 2019        2865        2861            0.26        118         4.1          1.5
 2020        3000        3000            0.30        109         3.8          1.5

Resource estimates for new ore bodies are produced by the exploration department by
drilling the mineralized rock body in a 50 x 50 m grid, producing an inferred of indicated
resource. This is typically followed up by denser drilling carried out by the mine department
resulting in a measured resource and eventually a mineral reserve. More on mineral resources
and mineral reserves in chapters 3.12 and 3.13, respectively.

The mineral reserve estimates are constantly being revised against the metal grades of the
actual mined tonnage through the reconciliation process, see chapter 3.15.

3.5 Ownership
Boliden Mineral AB owns 100 % of the Garpenberg mine.

3.6 Permits
Boliden is the owner of all land where the mining operations are currently developed.
Boliden has 10 mining concessions covering the mine area. The concessions are presented in
Table 3-2, Figure 3-1 and Figure 3-2.

Table 3-2. Mining concessions in Garpenberg.

 Name                      Active from          Expires         Minerals
 Garpenberg K nr 1         2000-01-01           2025-01-01      Zinc, lead, silver, copper, gold
 Garpenberg K nr 2         2000-01-01           2025-01-01      Zinc, lead, silver, copper, gold
 Garpenberg K nr 3         2001-06-18           2026-06-18      Zinc, lead, silver, copper, gold
 Garpenberg K nr 4         2001-06-18           2026-06-18      Zinc, lead, silver, copper, gold
 Garpenberg K nr 5         2002-12-13           2027-12-13      Zinc, lead, silver, copper, gold
 Garpenberg K nr 6         2002-12-13           2027-12-13      Zinc, lead, silver, copper, gold
 Garpenberg K nr 7         2002-12-13           2027-12-13      Zinc, lead, silver, copper, gold
 Garpenberg K nr 8         2003-01-07           2028-01-07      Zinc, lead, silver, copper, gold
 Garpenberg K nr 9         2003-04-17           2028-04-17      Zinc, lead, silver, copper, gold
 Garpenberg K nr 10        2004-03-19           2029-03-19      Zinc, lead, silver, copper, gold

Boliden has the necessary environmental permits in place to operate the mine. The main
permit, in accordance to the Swedish Environmental Act, was issued by the Swedish
Environmental Court in 2012 (M461-11 2012-01-31) and the final discharge limits to water
were set in 2016 (M461-11 2016-04-15). In 2018 Boliden applied for some changes in the
permit which were approved in December 2018 (M467-18, 2018-12-20). These changes allow
Boliden to deposit waste-rock according to life-of-mine plan and tailings for 10 years (the
longest building period allowed for activities under chapter 11 in the Swedish Environmental
Act) in the existing tailings management facility. The permit allows Boliden to operate the
mine as described in the application and in particular to (chapter 9 Environmental Act):

              Boliden Summary Report, Resources and Reserves 2020, Garpenberg| 9
extract and process up to 3 Mtpa of ore in Garpenberg,
deposit tailings in the Ryllshyttan tailings management facility (TMF), and backfill
the mine.
In addition, the permit allows Boliden to (chapter 11 Environmental Act):
raise the dams at Ryllshyttan TMF to the level of +256m with the maximum water
level of +254 m and to construct a new outlet,
extend the waste-rock dumps,
set the financial guarantee for closure to 490 MSek,
raise the water level in the clarification pond to the level of +227,9 m,
extract mine water, and
extract up to 1,9 Mm3/yr fresh water from the lakes Gruvsjön och Finnhytte-
Dammsjön, of which a maximum of 0,95 Mm3 from Finnhytte-Dammsjön.
The permit is associated with a series of conditions and limit values regarding e.g., discharge
water quality and noise levels in neighboring houses.
In November 2020 Boliden applied to the Swedish Environmental Court for an extension of
the permit to extract and process up to 3,5 Mtpa of ore in Garpenberg, without changing
anything else in the conditions of the environmental permit Boliden have today.
Boliden is studying and evaluating different options for tailings management beyond year
2028. It is Boliden’s assessment that it is reasonable to believe that a permit will be granted
for future tailings management well in time for having a solution in place before 2028.
The long history of mining in Garpenberg has resulted in a complex environmental situation
with numerous historical objects on and around Boliden’s land holdings in Garpenberg. Due
to the age of these objects, Boliden is assessed to have very limited liability for any future
remedial works to limit the environmental impact of these objects; however, Boliden has the
responsibility as landowner to conduct investigations in order to determine the impact of
these historical objects. These investigations are ongoing, as well as a dialogue with the
competent authority regarding the extent of the liability for any future remedial actions on
these objects. A process has been initiated by the Water Authority to assess if it necessary to
modify the environmental quality standards (EQS) for lake Gruvsjön and downstream lying
water bodies as it has been shown that it is not a realistic to reach current EQS, even in a
long-term perspective.
3.7 Geology
The Garpenberg mine is situated in the mineralized Palaeoproterozoic igneous province of
Bergslagen, south central Sweden, which is host to a variety of ore deposits, and especially
Fe-oxide and polymetallic sulphide deposits. Garpenberg is the largest sulphide deposit in
the region, and comprises several individual ore bodies distributed over a distance of 4 km
along a limestone horizon, see Figure 3-3. The main host rock is calcitic marble (limestone)
altered to dolomite and Mg +/- Mn-rich skarns. The footwall comprises of strongly
phlogopite-biotite-cordierite-sericite-quartz altered felsic volcaniclastic rocks, whereas the
hanging-wall comprises relatively unaltered volcaniclastic and sedimentary rocks and dacitic
Boliden Summary Report, Resources and Reserves 2020, Garpenberg| 10intrusions. The stratigraphic succession is attributed to the volcanic cycle of a felsic caldera
complex, and includes rhyolitic to dacitic, juvenile pumiceous, graded mass-flow breccia
deposits and rhyolitic to dacitic ash-siltstone and sandstone in the footwall, and polymict
conglomerates and juvenile, rhyolitic, pumiceous breccias in the hanging-wall. These
pumiceous breccias in the hanging-wall record a climactic eruption that formed a caldera
over 500 m deep and over 9 km in diameter in the Garpenberg area. The limestone hosting
the ore is interpreted as a stromatolitic carbonate platform, formed in a shallow, marine
environment during a hiatus in volcanism.
The ore-host limestone shows a complex geometry due to large scale folding, shearing and
faulting. Folding and late faults have locally remobilized the ore into fault- and fracture-
hosted sulphide veins, some of which have been thick enough and rich enough to mine.
These structural features have resulted in complex synforms and antiforms, and have a major
influence on the position, geometry and metal grades of the ore bodies. The Lappberget ore
body is interpreted as an over 1.5 km long, subvertical anticlinal tube fold with the top of the
antiform just below 200z. The initial main stage of mineralization and alteration at all the
known Garpenberg ore bodies is interpreted to be essentially syn-volcanic in timing and to
pre-date regional metamorphism and deformation (Jansson & Allen, 2011).
The Garpenberg mine encompasses several ore bodies which follow a limestone-marble
horizon occurring in a synform structure. The structure is compressed at the southern end
and opens to the north. The horizon is strongly isoclinally folded and the structure tectonic
and divided into blocks. The ore bodies occur in the contact zone between the limestone and
underlying siltstones. The contact zone is heavily altered to skarn and the limestone to
dolomite. The structures are consistently steeply dipping.
Boliden Summary Report, Resources and Reserves 2020, Garpenberg| 11Figure 3-3. Geological map of Garpenberg. From Allen et al., 2003.
Mineralization is mainly of replacement style and is likely to have taken place where metal-
bearing fluids penetrated up along synvolcanic, extensional faults and came in contact with
reactive limestone to form large, massive sulphide bodies.
The different ores are strongly structurally related and the largest ore bodies linked to
antiforms as Lappberget and Kaspersbo. The mineralization comprises pyrite, sphalerite,
galena and silver mineral in some places forming semi-compact blisters in the quartzite and
skarn-altered contact zones. Also, between the ore bodies, there are occurrences of
mineralization controlled by tectonic mica-rich shear zones. In the entire field occurs
mineralization also as remobilization along the axial planes. Remobilizations intersect the
more or less semi-compact lenses and both expand and extend the ore bodies, especially at
depth.
Boliden Summary Report, Resources and Reserves 2020, Garpenberg| 12500 m
Figure 3-4. Front view of the Garpenberg ore bodies looking north in the local coordinate system. Colors
according to resource category.
500 m
Figure 3-5. Top view of the Garpenberg ore bodies. Colors according to resource category.
3.8 Exploration procedures and data
Boliden Summary Report, Resources and Reserves 2020, Garpenberg| 133.8.1 Drilling techniques and downhole survey
Diamond drilling assay data is used for mineral resource estimation. Diamond drilling is
performed by drilling contractor Drillcon and supervised by Boliden personnel. By default
drilling dimension in Garpenberg is B-size with a core diameter of 39 mm. The current
practice is to measure all drillholes longer than 100 m for deviation with Reflex Maxibor2.
Drill holes longer than 400 m are measured with IS Gyro.
3.8.2 Logging and sampling
The drill core is logged by Boliden geologists and sampled by Boliden technical personnel.
Different level of logging detail is being applied depending on whether drill holes are
exploration or infill drill holes. However, features which are always logged are: lithological
units, fractures, level of schistosity and content of talc. For infill drill holes, the whole core is
usually sampled, leaving no core left in the core boxes. Exploration drill holes are sawed in
half along the drill core axis and one half is sent for analysis while the other half is stored in
Boliden’s core archive.
3.8.3 Density
Density data has been collected from bulk samples from each ore lens. This data has been
used to produce individual density formulas for each ore body based on metal content. As an
example, the density formula for Lappberget is 2.8 +0.004Cu + 0.004Zn + 0.02Pb +
0.0365S. Average bulk densities for the different ore bodies vary between 2.71 (Garpenberg
south) and 3.15 (Gransjön).
3.8.4 Analysis and QAQC
Drill core analyses are carried out by ALS laboratories. Sample preparation is done in Piteå,
Sweden and assays are carried out in ALS’s hub-lab in Loughrea, Ireland. ALS laboratories
are accredited according to ISO/IEC 17025. Umpire lab check assays are done by MS
Analytical. An overview of the different analytical methods is presented in table Table 3-3
Table 3-3. Overview of ALS’s designation of analytical methods. Over-range method applies to samples where
assay result reached upper detection limit of primary method.
Method Over-range method
Preparation PREP-31B
Assay Au Au-ICP21 Au-AA25/Au-GRA21
Assay Ag, Cu, Pb, Zn ME-OG46 Ag - GRA21
Pb - AAORE
Zn - ME-ICPORE
Assay S IR08
Assay other (48 elements) ME-MS61
Specific gravity (core) OA-GRA08
Specific gravity (pulp) OA-GRA08b
Preparation of the samples, coded PREP-31B, comprises crushing the rock to 70% less than
2mm, riffle splitting off 1 kg and pulverizing the split to better than 85% passing 75 microns.
Au-ICP21 is a package of fire assay with an ICP-AES analysis. In ME-OG46, Aqua Regia is
used to dissolve base metals and silver while assay is done with ICP-AES. IR08 is used for
Boliden Summary Report, Resources and Reserves 2020, Garpenberg| 14total sulphur analysis using a Leco Sulphur analyzer. ME-MS61 is a package of a 4-acid
digestion process with an ICP-MS analysis. Specific gravity is measured either directly on
drill core (OA-GRA08), or on pulps using a pycnometer (OA-GRA08b).
All samples are prepared and analyzed with Au-ICP21, ME-OG46 and IR08 while selected
drillholes are analyzed with ME-MS61 and Specific Gravity as well. For the latter, analysis on
pulp is the preferred method. Table 3-4 shows which elements are analyzed with lab codes
ME-OG46 and ME-MS61.
Table 3-4. Elements analyzed with ME-OG46 and ME-MS61.
H He
Li Be B C N O F Ne
Na Mg Al Si P S Cl Ar
K Ca Sc Ti V Cr Mn Fe Co Ni Cu Zn Ga Ge As Se Br Kr
Rb Sr Y Zr Nb Mo Tc Ru Rh Pd Ag Cd In Sn Sb Te I Xe
Cs Ba La* Hf Ta W Re Os Ir Pt Au Hg Tl Pb Bi Po At Rn
Fr Ra Ac¨ Ku Ha
* La Ce Pr Nd Pm Sm Eu Gd Tb Dy Ho Er Tm Yb Lu
¨ Ac Th Pa U Np Pu Am Cm Bk Cf Es Fm Md No Lr
ME-OG46 ME-MS61
Quality assessment and quality control is continuously monitored using QAQC samples such
as in-house standards, blanks and umpire lab checks (pulp duplicates). It is required that each
sample batch is submitted with at least one blank sample and one standard sample. Batches
with more than 16 samples also require a pulp duplicate sample. As the number of samples in
a batch increases so does the required QAQC samples, for example a batch with 100 samples
requires two blanks samples, three standard samples and one pulp duplicate sample.
A review of all yearly QAQC samples utilized shows that the results fall within the
predetermined acceptable limits. The results have been summarized in Boliden’s internal
QAQC report (Derrien 2020).
3.9 Exploration activities and infill drilling
In 2020, near mine exploration focused on two key objectives. Firstly, resource drilling
targeted the Lappberget deposit, primarily from the recently completed exploration drifts at
1432 and 1450 levels with drill programme DP200003 (ca. 9500 metres drilled). In addition
to delineation drilling at depth, work was also performed on the western extent of the
deposit between 600 – 800 z with drill programme DP200052 (1324 metres drilled). Drilling
results from DP200052 were utilized in the 2020 resource update of Lappberget LC west
between 642 – 904z (see chapter 3.14).
Drilling at depth (DP200003) is part of an extensive programme which started in 2020 and will
finish in 2021. Therefore no resource estimate for this work was undertaken in 2020.
Boliden Summary Report, Resources and Reserves 2020, Garpenberg| 15In addition to resource drilling, near mine exploration has also pursued exploration objectives
at the southern depth extent of the mine from the southern limit of the 1075 drift with drill
programme DP 200001 (2584 metres drilled). In the north, drilling from the surface has tested
the northern depth extent of the Gransjö deposit with two holes totaling 1589 metres
(DP200006). These programmes delivered prospective intercepts however exploration remains
at an early stage and is therefore not covered in this report.
Figure 3-6. Distribution of near mine exploration resource drilling (red traces) in 2020.
The Ore Reserve Department has carried out resource estimation work on areas drilled by near
mine exploration in 2019, primarily Lappberget above 390 z and Kvarnberget above 600 z.
These calculations are presented in chapter 3.12 and 3.14 in this report and will not be repeated
here, they were performed in 2020 as drilling was completed late in 2019.
The mine department conducted several infill drilling programs in 2020. Drilling from
Kvarnberget 1050z, initiated in 2019, was completed in order to delineate with more precision
the lower part of Kvarnberget ore body between 1050 –1150z. Infill drilling was also conducted
in different positions in Lappberget between 800-1300z, targeting in particular the western
extent of Lappberget (ca. 7600 meters drilled).
In Dammsjön, an extensive infill program was started in 2017 for the area below 1050z, and
will be finalized in early 2021. This drilling is not included in the current resource estimation.
A complete update of the Dammsjön mineral resource will be completed in 2021.
3.10 Mining methods, processing and infrastructure
Almost 90% of the mined ore in Garpenberg is extracted by sublevel stoping (also called
longhole stoping), where the ore is mined in layers between two drifts vertically 25 m apart.
Most areas are mined with transversal longhole stoping, where the development and stope
axis are perpendicular to the strike of the orebody. In some more narrow areas,
longitudinal longhole stoping is used. The orientation of this method is along or parallel to
the strike of the orebody. The ore body is split into primary and secondary stopes, which are
mined in a predefined order and pyramid shape sequence. The standard stope dimensions are
24 - 25m high, 10 m wide for primary stopes and 15 m wide for secondary stopes. In
Lappberget, the ore body is divided in mining blocks with 6 levels of stopes in each block.
Boliden Summary Report, Resources and Reserves 2020, Garpenberg| 16The last level of each mining block is the sill pillar, which separates the different mining
blocks. This division allows the mine to have several production areas being scheduled and
mined at the same time.
Another consideration that was recently introduced concerning the mine design of
Lappberget is the division into a main and a second pass sequence (2pass). The main
sequence contains more of the high grade areas and is scheduled prior to the second pass
sequence, which in general contain lower grade ore (Figure 3-7).
a) b)
Figure 3-7. Example of mine design in Lappberget
a) High grades layout – main sequence; b) Main sequence (high grades) and 2pass (low grades).
Other mining methods include cut and fill and avoca (rill) (Table 3-5). With the cut and fill
method, mining is carried out in slices along the steeply dipping, narrow ore body. The
bottom slice is mined first. The excavated area is then backfilled, so mining can continue
with the slice above. The rill method used in Garpenberg is in fact similar to longitudinal
stopping, but the stopes are split in 20 m long slices. After being blasted and mucked, the
stopes are backfilled before the next slice is blasted. This process repeats until the full size of
the stope is done.
Table 3-5. Mining method for Garpenberg ore bodies.
Mining method Ore body Min width (m)
Sublevel stoping Lapp, Kvarn, Kasp, 10 alt 15
Damm, Huvudmalmen
Cut and fill Damm 7
Avoca (rill) Damm 7
Mine reconciliation is the comparison of the planned stopes against the actual outcome.
Table 3-6 shows the reconciliation for the large scale mining methods in 2019.
Boliden Summary Report, Resources and Reserves 2020, Garpenberg| 17Table 3-6. Reconciliation for sublevel stoping and rill in 2019.
Stopes Average Recovery (t) Average OverBreak (%) Edges Dilution (m)
Primary 87,71% 17,14 0,40
RILL 88,36% 14,10 0,48
Secondary 82,39% 17,41 0,55
Total average 86,35% 17,17 0,48
The expansion project to 2.5 Mt which was completed in 2014 increased the capacity of the
mine with the construction of new crushers, shafts, ore hoists, etc. Today there are two
underground crushing plants at 700 z and 1087 z. Transport to the crushers is done by trucks
from the active mining areas. The crushed ore is hoisted to surface in a shaft, unloaded into a
bin in the headframe and then transported by conveyor belts to an intermediate ore storage,
which can hold approximately a week of production.
In the concentrator, the ore is ground in two stages with autogenous grinding in the primary
stage and pebble mill grinding in the second. After grinding, the ore is screened, with the
coarse fraction being returned to the primary mill and the fine fraction undergoing
gravimetric separation (Knelson) in order to separate coarse gold out at an early stage of the
process. Knelson concentrate is collected in big bags. After gravity separation, material is
classified using hydrocyclones. The overflow constitutes the main flotation feed, while the
underflow undergoes flash flotation in the grinding circuit, from which the concentrate is
sent directly to CuPb separation in the flotation plant and the tailings back to the mills.
Flotation is carried out in a three-stage process flotation circuits: CuPb flotation, CuPb
separation and Zn flotation. Regrind mills are installed both in the CuPb and Zn circuits.
The mineral concentrates are dewatered using thickeners and pressure filters. Three mineral
concentrates are produced in flotation: zinc, lead and copper concentrates. The precious
metals report primarily to the copper and lead products. Of the flotation tailings,
approximately 1/3 is utilized in the paste plant for producing backfill material for the mine
and 2/3 is deposited at the tailings management facility.
The zinc and lead concentrates are transported by truck to Gävle port and from there by ship
to Boliden’s smelters in Finland, Sweden and Norway. The copper and Knelson concentrates
are trucked, the copper concentrate later being reloaded to rail, for onward transport to the
Boliden Rönnskär smelter in Skelleftehamn.
3.11 Prices, terms and costs
Mineral Resources and Mineral Reserves are the basis for the company’s long-term planning
and will be mined for many years to come. Planning prices, which are an expression of the
anticipated future average prices for metals and currencies, are, therefore, primarily utilized
in the estimations. The planning prices are used to calculate the NSR (Net Smelter Return),
expressed in SEK/t, in the geological block models. Boliden currently uses the prices shown
in Table 3-7.
Boliden Summary Report, Resources and Reserves 2020, Garpenberg| 18Table 3-7.Long term planning prices currently used in Boliden.
Commodity / Currency Planning prices 2020
Copper USD 6,600/tonne
Zinc USD 2,400/tonne
Lead USD 2,100/tonne
Gold USD 1,300/tr.oz
Silver USD 17/tr.oz
USD/SEK 8.00
EUR/SEK 9.35
EUR/USD 1.17
The direct costs for mining and processing a tonne of ore is defined as the variable costs.
Included in the variable costs are for example consumables, transportation costs and mine
sustaining investments. The variable costs are summarized to around 270 SEK/t.
The site operational costs include not only the variable costs, as defined above, but also fixed
costs, such as personnel costs and facility maintenance, and costs for future strategic mine
development. Depreciations and capital investments are not included in the site operational
costs. The site operational costs are around 530 SEK/t.
The variable and site operational cut-offs respectively are based on the cost levels explained
above.
A table of the costs distributions and the cut-offs are summarized in Table 3-8.
Table 3-8.The different cut-offs considered for Garpenberg.
Total
Operational
Cut-off value (SEK/t)
Costs distribution
Mine - variable costs (V)
Structure services - V
Structure services - F
Investment ( sustaining)
Costs for development
Mine - fixed costs (F)
Investment ( capital)
Reclamation fund
Mill plant - V
Mill plant - F
Depreciation
Variable 270
X X X X
costs SEK/t
Site
530
operational X X X X X X X X X
SEK/t
costs
Boliden Summary Report, Resources and Reserves 2020, Garpenberg| 193.12 Mineral resources
Several criteria are used to classify mineral resources. As a rule of thumb a drilling grid of
100 x 100 m is required for inferred resource, 50 x 50 m for indicated and 25 x 25 m for
measured resource. However, Tyskgården-Finnhyttan is an exception, because complex
geological conditions demand a denser drilling pattern. The final classification depends on
drilling pattern in combination with a number of other criteria listed below.
Geological complexity
Quality and quantity of informing data
o Confidence in analytical results
o Confidence in borehole surveying
o Analytical data
o Results of the geostatistical analysis, variography, and QKNA
Metallurgical factors or assumptions
Confidence in the block estimates
All mineral resources are reported according to the PERC standard (See Figure 2-1).
Bench scale processing tests are systematically done on ore from new mineral resources in
order to confirm that the ore is technically extractable and economically mineable. In 2020
tests were carried out on ore from Kvarnberget above 600z and Lappberget above 400z as
well as at 800z.
Mineralization is interpreted according to NSR (Net Smelter Return) and geological
assumptions. Traditionally the mineral resources were calculated directly from mineralization
wireframes. However, in recently estimated areas a RPEEE (Reasonable Prospect of
Eventual Economic Extraction) has been created in Deswik Stope Optimizer employing
existing geological interpretation and block model (more information on the Deswik Stope
Optimizer in chapter 3.13). The latter case stands for more realistic mineable tonnage and
grades, which signifies less adjustments when eventually converting mineral resources into
mineral reserves.
All reserve and resource tonnes and grades are interrogated from the seven active block
models in Garpenberg (See Table 3-9).
Table 3-9. Block models in Garpenberg.
Block model Ore bodies
BLGAR Garpenberg South*
BLTYS Finnhyttan and Kyrkan-Tyskgården
BLDAM Dammsjön
BLKVB Kvarnberget
BLLPB Lappberget
BLNOR Kaspersbo, Huvudmalmen and Gransjön UG
BLGRN Gransjön Open Pit
* Including Kanal, Strand, Finnhyttan and Kyrkan-Tyskgården
Boliden Summary Report, Resources and Reserves 2020, Garpenberg| 20In Garpenberg, two different estimation methods are used. Ordinary Kriging is usually used
in areas where there is sufficient drillhole data and Inverse Distance is usually used in areas
with less data. Mineralization models are created in Leapfrog Geo, and then resource
estimation is calculated in Datamine. There are still some older mineralization models and
block models in use that were created in Propack, which is an add-on to the CAD program
MicroStation. Table 3-10 shows estimation methods and software used for each of the ore
bodies in Garpenberg and Table 3-11 shows block sizes for each model. The block sizes are
selected from spacing in supporting data in combination with complexity in ore geometry
and scale of mining.
Table 3-10.Estimation methods for the Garpenberg ore bodies.
Block Ore body code Name Method Software
model
BLGAR Garpenberg south Inv Dist Datamine
BLTYS FI1-6, TY1-3, KY1-2 Finnhyttan, Kyrkan-Tyskgården Inv Dist Datamine
BLDAM DAM Dammsjön Inv Dist Propack
BLKVB KVA, KVB, KVC, KVD Kvarnberget Kriging Datamine
BLLBP LA, LB, LC Lappberget Kriging Datamine
BLNOR D, E, F, G Huvudmalmen 881-918 Z Inv Dist Propack
BLNOR HU1-HU6 Huvudmalmen 990-1250 Z Kriging Datamine
BLNOR KA Kaspersbo Kriging Propack
BLGRN AAA, BBB, CCC, DDD Gransjön Open Pit Inv Dist Propack
Table 3-11. Block sizes and subdivision for Garpenberg block models.
Model Xsize Ysize Zsize Subdivision
BLDAM 4 6 6 2
BLGAR 3 10 5 2
BLGRN 5 10 10 2
BLKVB 4 6 12.5 1
BLLPB 6 10 6 1
BLNOR 10 20 6 2
3.13 Mineral reserves
When converting mineral resources to mineral reserves, a number of parameters have to be
considered, the most important ones being economic feasibility and rock mechanics. The
rock mechanic conditions determine the amount and size of pillars and sill pillars as well as
the length and width of mined stopes. Weak or unstable rock volumes might be discarded
completely from the mineral reserves. The volume and geometry of the mineralization will
likely determine which mining method to apply. The choice of mining method should also
optimize the NPV (net present value) of the ore volume.
With the sublevel stoping method, the mineral reserves are defined by designed stopes
whereas the corresponding mineral resources are defined either by designed stopes or by the
mineralized envelope above cut-off. Since designed rooms mostly are formed as cubes with
90 degree corners and the mineralized envelope is irregular some of the ore at the edge of
Boliden Summary Report, Resources and Reserves 2020, Garpenberg| 21the mineralization might get left out when converting resources to reserves. Likewise, some
waste rock might be included at the edges of the mineralization.
Boliden Garpenberg utilizes the mine planning tool Deswik Stope Optimizer (SO) for
designing of stopes. SO automates the design process and allows for a number of stope
properties including general shape and orientation, cut-off grade, dilution and pillar size.
Table 3-12 summarizes the criteria used by SO in different areas in Garpenberg.
Table 3-12. Design properties used by SO to generate stopes in different ore bodies in Garpenberg.
SO criteria Allow up min max
Waste material 20%
Dilution 25%
Stope length Lappberget/ - 7m 80 m
Huvudmalmen/Dammsjön
Stope length Kvarnberget/ - 7m 40 m
Södra malm
Stope height - 24-25 m 40 m
The cut-off grade used is based on the cost distribution presented in chapter 3.11. Each
stope needs the NSR to be higher than the variable costs, and the average NSR for each time
period needs to be higher than the site operational costs. Moreover, the cut-off is adjusted
for each ore body and mining method.
For Lappberget the separation into a main and a second pass sequence, as mentioned in
chapter 3.10, is done based on different cut-offs for different mining etages. The cut-off is
chosen in such a way that both mining sequences are mineable and a favorable NPV is
achieved. The different cut-off used for design with SO are presented in Table 3-13.
Table 3-13. Different cut-off values used for design of the stopes with SO in the different areas in Garpenberg.
Cut-off Cut-off for main
Orebody Mining block
(SEK/t) sequence (SEK/t)
Lappberget E1100 300 -
E530 270 520
E700/880/1250/1400/1550 270 760
Kvarnberget all 300 -
Kaspersbo all 300 -
Dammsjön all 520 -
Huvudmalmen all 520 -
Table 3-14 shows the Mineral Resources and Mineral Reserves Garpenberg Area as per 2020-
12-31.
Boliden Summary Report, Resources and Reserves 2020, Garpenberg| 22Table 3-14. Mineral Resources and Mineral Reserves in Garpenberg 2020-12-31
2020 2019
kton Au Ag Cu Zn Pb kton Au Ag Cu Zn Pb
Classification (g/t) (g/t) (% ) (% ) (% ) (g/t) (g/t) (%) (%) (%)
Mineral Reserves
Proved 23 500 0.23 97 0.03 3.1 1.2 21 000 0.2 101 0.03 3.60 1.41
Probable 66 000 0.35 93 0.05 2.7 1.3 53 800 0.3 94 0.05 2.89 1.39
Total 89 500 0.3 94 0.04 2.8 1.3 74 800 0.3 96 0.05 3.10 1.40
Mineral Resources
Measured 3 900 0.33 94 0.06 3.4 1.7 4 300 0.3 100 0.06 3.32 1.57
Indicated 32 600 0.35 89 0.05 2.7 1.3 40 000 0.3 88 0.05 2.76 1.33
Total M&I 36 600 0.35 90 0.06 2.8 1.4 44 300 0.3 90 0.05 2.82 1.36
Inferred 25 500 0.42 57 0.07 2.5 1.4 24 100 0.5 56 0.08 2.84 1.68
3.14 Comparison with previous year
In 2020 mineral reserves increased by 14.7 Mt to 89.5 Mt. As a result of upgrading resources
to reserves, measured and indicated resource decreased by 7.7 Mt to 36.6 Mt. Inferred
resource increased by 1.4 Mt to 25.5 Mt. Table 3-15 shows the changes in detail, including
changes in metal grades.
There are several factors that explain the large increase in mineral reserve in 2020. A new
design was completed for Lappberget, Kvarnberget, Huvudmalmen and Kaspersbo, using
Deswik Stope Optimizer (SO).
In Kvarnberget, in the new design for levels 600-1050z, SO used a cut-off of 300 SEK/t. A
number of stopes were shortened or even suppressed when the stopes were too small, or the
grades were considered too low (Figure 3-8). The central pillar of Kvarnberget between -
600z and -1050z, previously classified as indicated resource, was included in the mineral
reserve. The new tonnage of level 600-1050z is 14.5 Mt with average metal grades of 0.33 g/t
Au, 117 ppm Ag, 2.87% Zn and 1.31% Pb, which is slightly higher than the previous grades
reported for that position. The position between -1050z and -1150z was upgraded from
indicated resource to probable reserve, resulting in the addition of 3.9 Mt to the mineral
reserve. A technical and economical assessment was completed for the new reserve positions
in Kvarnberget (Derrien 2021).
Boliden Summary Report, Resources and Reserves 2020, Garpenberg| 23Figure 3-8. Oblique view of Kvarnberget level -730z.The outline of 2019 reserve is in grey, and the 2020
reserve is in orange. Several of the stopes were either shortened or discarded in the new design. The blue
shape is the central pillar of Kvarnberget which was included in the reserve in 2020.
In Lappberget, the new design is based on a new block model completed in November 2019.
The new block model includes more low grade mineralization than previously, especially in
the western area where mineralization style is of remobilized character and is less massive
than the eastern and central areas. Most of the added tonnage in Lappberget comes from
western area, as well as on the edges (Figure 3-9 shows an example of changes of the reserve
at level 1340z). The cut-off used for the stope design with SO is variable between the
different etages (Table 3-13). For 2 nd pass stopes, a cut-off of 270 kr/t was used, but all
stopes with an average NSR below 400 SEK/t were discarded from the reserve. The new
design resulted in the addition of 6.2 Mt to the mineral reserve.
Two areas previously classified as resource were also included in the mineral reserve. The
completion of flotation tests for the different ore lenses between -400z and -800z allowed to
upgrade the area between -408z and -466z, adding 2.6 Mt to the mineral reserve. Completion
of infill drilling and subsequent update of the mineralization model and of the block model
allowed to upgrade 1.5 Mt indicated resource to probable reserve between -1102z and -
1257z.
Boliden Summary Report, Resources and Reserves 2020, Garpenberg| 24Figure 3-9. Oblique view of Lappberget level -1340z.The outline of 2019 reserve is in grey, and the 2020
reserve is in orange. In the new design, some of the stopes are wider on the edges, some new stopes were
included on the western side of Lappberget.
In Huvudmalmen and Kaspersbo, the new design now includes areas previously classified as
indicated or measured resource. Moreover, most of the stopes are bigger than in the previous
design (Figure 3-10).The total increase in tonnage in mineral reserve for Huvudmalmen and
Kaspersbo is 1.8 Mt.
Boliden Summary Report, Resources and Reserves 2020, Garpenberg| 25Figure 3-10. Example of changes in resource and reserve in Kaspersbo and Huvudmalmen at level -1040z.
Exploration drilling was also carried out in the upper parts of Lappberget and Kvarnberget,
which resulted in the addition of 1.4 Mt of indicated resource and 0.7 Mt of inferred
resource at level 291-390z in Lappberget, and 1.0 Mt of inferred resource at level 520-600z in
Kvarnberget.
Exploration and infill drilling targeting the western part of Lappberget and the area between
Lappberget and Kvarnberget was also completed in 2020. This drilling, coupled with new
interpretation of historical data allowed to define three new resource positions between -642
and -1440z (Figure 3-11).
Boliden Summary Report, Resources and Reserves 2020, Garpenberg| 26Figure 3-11. New resource positions in the western area of Lappberget. The image is a front view of
Lappberget ore body, looking north.
Mined out tonnage in 2020 totals 3 000 kton, which is an increase of 135 kton from previous
year. Metal grades of the mined out tonnage is as follows: 3.8% Zn, 1.5% Pb and 109 ppm
Ag. Almost 80% of all mined out ore derives from Lappberget.
Table 3-15. Mineral Resources and Mineral Reserves in Garpenberg as per December 31, 2020. Numbers in
brackets show changes from last year.
Classification Kton Au Ag Cu Zn Pb
(g/t) (g/t) (% ) (% ) (% )
Mineral Reserves
Proved 23 485 (+2 449) 0.23 (-0.01) 97 (-2) 0.03 (-0.01) 3.1 (-0.4) 1.2 (-0.2)
Probable 66 037 (+12 238) 0.35 (+0.01) 93 (-2) 0.05 (-) 2.7 (-0.2) 1.3 (-0.1)
Total Mineral Reserve 89 522 (+14 687) 0.32 (+0.01) 94 (-2) 0.04 (-0.01) 2.8 (-0.3) 1.3 (-0.1)
Mineral Resourcess
Measured 3 912 (-411) 0.33 (+0.02) 94 (-6) 0.06 (-) 3.4 (+0.1) 1.7 (+0.1)
Indicated 32 648 (-7 314) 0.35 (-) 89 (-) 0.05 (-) 2.7 (-) 1.3 (-)
Total M&I 36 560 (-7 724) 0.35 (-) 90 (-) 0.06 (-) 2.8 (-) 1.4 (+0.1)
Inferred 25 466 (+1374) 0.42 (-0.01) 57 (-2) 0.07 (-) 2.5 (-0.1) 1.4 (-0.1)
Total Mineral Resource 62 026 (-6351) 0.38 (-) 76 (-3) 0.1 (-) 2.7 (-) 1.4 (-)
3.15 Reconciliation
In order to confirm the precision of the geological interpretation, modelling, grade
interpolation etc. actual mining volumes times block model grades are checked against the
Boliden Summary Report, Resources and Reserves 2020, Garpenberg| 27measured results from the processing plant. This procedure is called reconciliation and is
carried out every month and presented quarterly. Monthly estimates vary dramatically
depending on the mine’s logistics of stocks in mine and on surface. The turnover of the
stocks also varies a lot.
The grades of the mined out ore are calculated from the block model using the tonnage
reported as loaded from the stopes and surveyed tonnage from cut and fill and development
ore. The ore can either be transported directly to the plant or put in stockpiles underground.
Above ground there is an ore storage facility which at the beginning of 2020 contained 33
Kton of ore. During the year the tonnage fluctuated between 8 kton and 63 kton. At the end
of the year the storage contained 33 kton of ore.
For the annual report of reserves and resources the reconciliation is compiled from a
weighted aggregation of the four quarters (rolling 4 quarters). Table 3-16 shows monthly and
quarterly results for 2020 from the mine and the processing plant. The year total is shown on
the bottom row. The official grades for Garpenberg are those of the processing plant. The
total tonnage reported derives from production reports and differs slightly from the
processed tonnage and from tonnage calculated from the block model in Table 3-16.
Table 3-16. Comparing measured results from the processing plant with calculated results from the block
model. Note that the numbers from the processing plant for December are preliminary.
Metal grades of processed ore Metal grades of mined ore (from block model)
Quarter kton Au g/t Ag g/t Cu % Zn % Pb % PP kton Au g/t Ag g/t Cu % Zn % Pb %
Jan 211.5 0.26 101 0.06 3.57 1.26 243.0 0.30 96 0.04 3.19 1.28
Feb 228.0 0.39 99 0.08 3.91 1.79 224.0 0.61 108 0.09 3.83 1.97
Mar 266.9 0.46 120 0.09 4.31 1.80 235.9 0.45 115 0.06 3.84 1.55
2020 Q 1 706.4 0.38 107 0.07 3.96 1.63 702.9 0.45 106 0.06 3.61 1.59
Apr 225.9 0.34 114 0.05 4.57 1.69 225.8 0.31 97 0.04 4.20 1.69
May 252.1 0.28 82 0.06 2.97 1.32 281.3 0.41 102 0.04 3.17 1.41
Jun 290.9 0.33 101 0.05 3.57 1.33 276.5 0.32 95 0.04 3.36 1.31
2020 Q 2 769.0 0.32 99 0.05 3.67 1.43 783.6 0.35 98 0.04 3.53 1.46
2020 Q 1+2 1475.4 0.35 103 0.06 3.81 1.53 1486.5 0.40 102 0.05 3.57 1.52
Jul 245.3 0.34 102 0.05 4.08 1.44 234.5 0.26 95 0.03 3.63 1.25
Aug 265.2 0.26 92 0.06 3.25 1.27 280.5 0.29 94 0.04 3.49 1.38
Sep 264.9 0.28 124 0.05 3.96 1.55 304.5 0.24 130 0.04 4.34 1.75
2020 Q 3 775.4 0.29 106 0.05 3.75 1.42 819.5 0.26 107 0.04 3.83 1.46
2020 Q 1-3 2250.8 0.33 104 0.06 3.79 1.49 2306.0 0.35 104 0.05 3.67 1.51
Oct 286.7 0.25 147 0.05 4.26 1.79 268.4 0.26 151 0.04 4.36 1.92
Nov 190.5 0.24 100 0.06 3.97 1.23 206.0 0.25 79 0.04 3.54 1.38
Dec 257.8 0.30 116 0.05 3.33 1.29 244.8 0.32 108 0.05 2.87 1.20
2020 Q 4 735.1 0.26 124 0.05 3.86 1.47 719.2 0.28 116 0.04 3.62 1.52
2020 Q 1-4 2985.9 0.31 109 0.06 3.81 1.48 3025.2 0.33 107 0.04 3.65 1.50
The rolling 4-quarter graph for zinc, lead and silver is shown below in Figure 3-12. The
graph shows the difference in % in weighted metal grades between processed ore and mined
ore and is calculated with the following equation: (Metal Grade Processing Plant/Metal
Grade Block Model)-1. Thus a positive number means that the grade is higher in the
processing plant than in the block model. The values for Q 1-4 2020 seen at the rightmost
side of the graph are: +4.2% Zn, -1.3% Pb and +2,1% Ag.
Boliden Summary Report, Resources and Reserves 2020, Garpenberg| 28Figure 3-12. Metal grades in processed ore vs metal grades of the mined ore based on the block model, over
a ten-year period.
4 REFERENCES
4.1 Public references
Allen, R.L., Bull, S., Ripa, M. and Jonsson, R. 2003. Regional Stratigraphy, Basin Evolution,
and the Setting of Stratabound Zn-Pb-Cu-Ag-Au Deposits in Bergslagen, Sweden. Final
report SGU-FoU project 03-1203/99, Geological Survey of Sweden.
Bindler R., Karlsson J., Rydberg J., Karlsson B., Berg Nilsson L., Biester H., Segerström U.
2017. Copper-ore mining in Sweden since the pre-Roman Iron Age: lake-sediment evidence
of human activities at the Garpenberg ore field since 375 BCE. Journal of Archaeological Science
Reports 12: 99-108
Jansson, N.F., Allen, R.L. 2011. Timing of volcanism, hydrothermal alteration and ore
formation at Garpenberg, Bergslagen, Sweden. Geologiska Föreningens Förhandlingar 133: 3-18.
Pan-European Standard for reporting of Exploration results, Mineral Resources and Mineral
Reserves (The PERC Reporting standard 2017). www.percstandard.eu
4.2 Internal references
Barreira, C. and Derrien, M. 2021. Technical Report second pass Lappberget. Boliden, DMS
#1702354.
Derrien, M. 2020. Garpenberg - årlig sammanfattning av QAQC resultat Infill och Gruvnära
diamantborrning 2019. Boliden, DMS #1701317.
Derrien, M. 2021. Changes in Mineral Reserves – Garpenberg – Kvarnberget 1050-1150 and
central pillar. Boliden, DMS #1702221.
Boliden Summary Report, Resources and Reserves 2020, Garpenberg| 29APPENDIX 1
A historical overview
~1200 Mining operation commences
1544 Gustav Wasa takes over the mining operation
1840 Discontinuation of mining operation
1906 Mining operation resumed
1908 The first concentrator was built
1923 AB Zinkgruvor, Falun takes over the activity from AB Garpenbergs Odalfält
1928 A new concentrator was built
1950-53 New shaft, head frame and a new concentrator were built
1957 Boliden – new owner
1972 The Garpenberg Norra mine in operation
1989 Increased capacity in the concentrator
1994 Shaft extension to 800 m level in Garpenberg Norra
1996 New hoisting shaft, the Gruvsjö shaft, in the Garpenberg mine
1997 A 1000 m long drill hole was sunk towards the south from the ramp in Garpenberg
Norra whereupon Kaspersbo and Lappberget were indicated
2000 Connection drift, development starts
2003 Lappberget diamond core drilling to 800 and 1000 meter level
2003 Lappberget in operation. Kvarnberget was indicated in a drill hole drilled from
Lappberget. The connection drift between the two mines was completed – one
mine.
2007 Paste plant was built and the mining method sublevel stoping commenced
2008 Pre-project study for extension to 2 Mt
2009 Concept study of Water-inflow in Garpenberg
2010 Pre-project study for extension to 2.5 Mt
2011 The expansion to 2.5 Mt commenced during the year
Drainage drilling in 500 level in Lappberget started
2013 Drainage pumping has started. The expansion project 2.5 is nearing
completion. Kvarnberget has prepared for mining with the first ore blast in
December 2013.
2014 Expansion project to 2.5 Mt completed. New crusher, shafts, ore hoists etc.
taken into use. First ore from Kvarnberget delivered to the concentrator. Level
1300 Z passed in Lappberget
2016 Production of 2.6 Mt successfully reached. Ventilation shaft to LAPP 554
ready. Record production of paste, 1005 kTon. First transverse stope mined in
KVB.
Boliden Summary Report, Resources and Reserves 2020, Garpenberg| 30You can also read