Obsidian Energy Corporate Presentation - Amazon S3
←
→
Page content transcription
If your browser does not render page correctly, please read the page content below
Obsidian Energy
Corporate Presentation
                         May 2020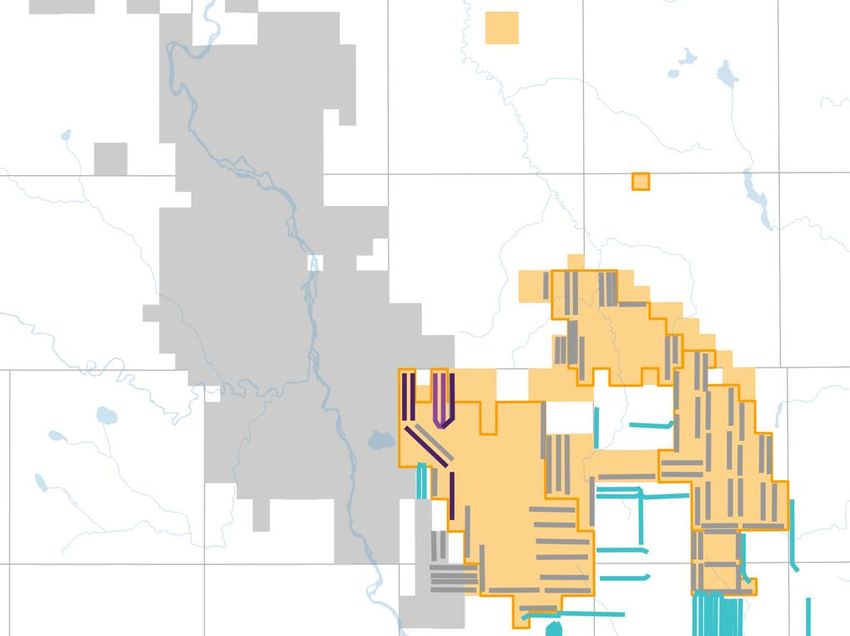
Important Notice to the Readers
This presentation should be read in conjunction with the Company’s unaudited interim consolidated
financial statements, Management's Discussion and Analysis ("MD&A") for the three months ended
March 31, 2020. All dollar amounts contained in this presentation are expressed in millions of Canadian
dollars unless otherwise indicated.
Certain financial measures included in this presentation do not have a standardized meaning
prescribed by International Financial Reporting Standards (“IFRS”) and therefore are considered non-
generally accepted accounting practice (“Non-GAAP") measures; accordingly, they may not be
comparable to similar measures provided by other issuers. This presentation also contains oil and gas
disclosures, various industry terms, and forward-looking statements, including various assumptions on
which such forward-looking statements are based and related risk factors. Please see the Company's
disclosures located in the Appendix & Endnotes at the end of this presentation for further details
regarding these matters.
All slides in this presentation should be read in conjunction with “Definitions and Industry Terms”,
“Non-GAAP Measure Advisory”, “Oil and Gas Information Advisory”, “Reserves Disclosure and
Definitions Advisory” and “Forward-Looking Information Advisory”. All locations are considered to be
Unbooked locations unless otherwise noted.

                                                                                                          2
Corporate Overview

       Market Summary

      Ticker Symbol                                     OBE                                 Peace River
      Shares Outstanding                    MM           73                                 4,040 boe/d Q1 2020
                                                                                             Cold flow heavy oil
                                                                                           Manage base production
      Market Capitalization                 MM           $22

      Net Debt                              MM          $517

      Enterprise Value                      MM          $539

       Corporate Summary
      Reserves (2P YE 2019)                mmboe         126                                         Cardium
      RLI (2P YE 2019)                     years         14                                           21,739 boe/d Q1 2020
                                                                                                Light oil conventional development
                                                                                                     Manufacturing model for
      PDP Decline (YE 2019)                 %             17
                                                                                                  extensive, repeatable inventory.
                                                                                                   Leverage shallow decline base
      Tax Pools (YE 2019)                   MM         $2,547

       H1 2020 Guidance
      Production                           boe/d   25,500 – 26,000

      Capital Expenditures                  MM          $43

      Decommissioning                       MM           $8

      Operating Costs                      $/boe    $11.50 – 11.90                               Alberta Viking
                                                                                                      830 boe/d Q1 2020
      General &                            $/boe     $1.65 – 1.85                                     Higher GOR oil play
      Administrative                                                                                Manage base production

                                                                     *Legacy Asset Production of 483 boe/d Q1 2020
See end notes for additional information                             *Deep Basin production is now included with Cardium     3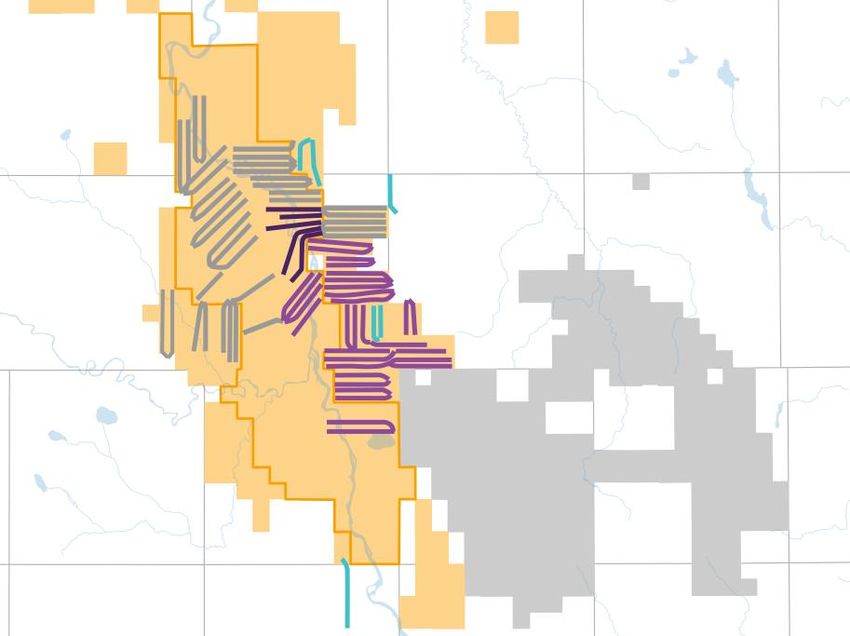
Strategic Priorities
Short-term Priorities
•   Protect long-term asset value
     •   Temporarily shut-in uneconomic properties
     •   Temper new well production
     •   Defer development capital program
•   Maintain liquidity
     •   Cost reduction initiatives

Long-term Priorities

                             Superior Shareholder Return

                                     Generate excess free cash flow
        Drive per share growth via                                    Create scale and decrease cost
                                      while holding production flat
      organic development and debt                                        structure via Cardium
                                       with growth optionality at
                pay down                                                  consolidation strategy
                                      increased commodity prices

                                                                                                       4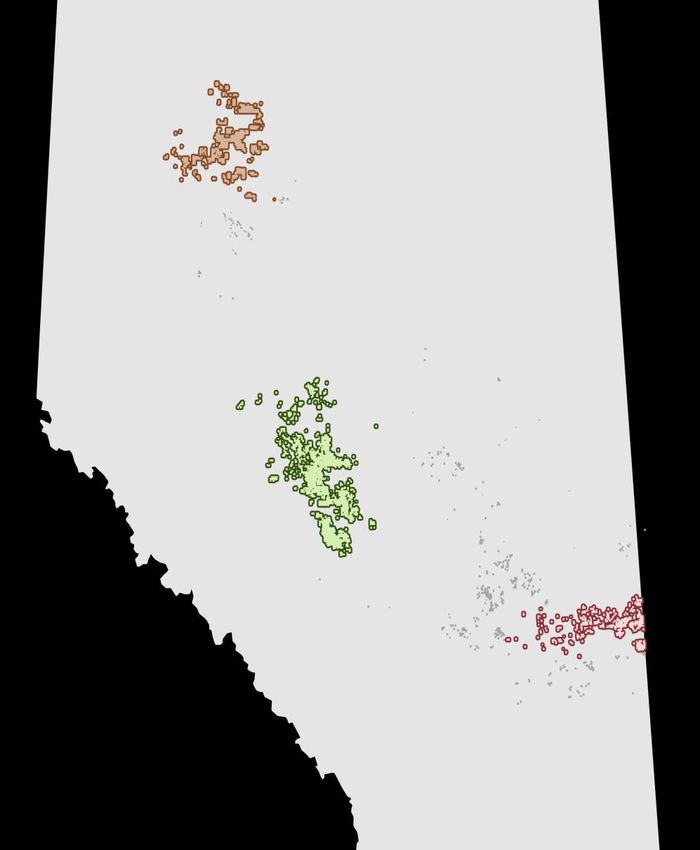
Short-term Actions - Q2 2020
Taken in this Low Price Environment

Temporarily Shutting-in Currently Uneconomic Production:

                        Production           Light Oil         Heavy Oil              NGLs               Gas
Area                       (boe/d)            (bbl/d)            (bbl/d)           (bbls/d)           (mcf/d)
Cardium                      576                438                  -                 23               692
Alberta Viking               144                  -                130                  -                 81
Peace River                3,064                  -              2,538                  2              3,148
Total                      3,784                438              2,668                 25              3,921

Cost Control Measures

•   Operating costs reduced by ~$8 million from our original 2020 estimate through savings with suppliers
    and shut-in production
•   Personnel costs temporarily reduced by ~$10 million, if annualized, through 20% reduction in Calgary
    office compensation, 10% reduction in field salaries, suspension of employer savings plan contributions,
    cancellation of certain contractor arrangements, 10% reduction in annual retainer of Board members
    and other savings
•   Calgary office lease renegotiation reduced net costs by ~$7 million per year on an annualized basis and
    reduced the overall liability by ~$100 million

Government Aid Programs
•   Applied for the federal government Canada Energy Wage Subsidy (CEWS), which provides potentially
    12 weeks of funding for up to 75% of employee wages (up to a cap)
•   Applied for the first phase of the Alberta government abandonment and reclamation program ($100
    million), whereby the government will fund service providers directly to perform abandonment and
    reclamation projects
•   Credit liquidity enhancement programs have been announced but details are still forthcoming and we
    will evaluate the applicability and potential benefit of those programs to our situation
                                                                                                               5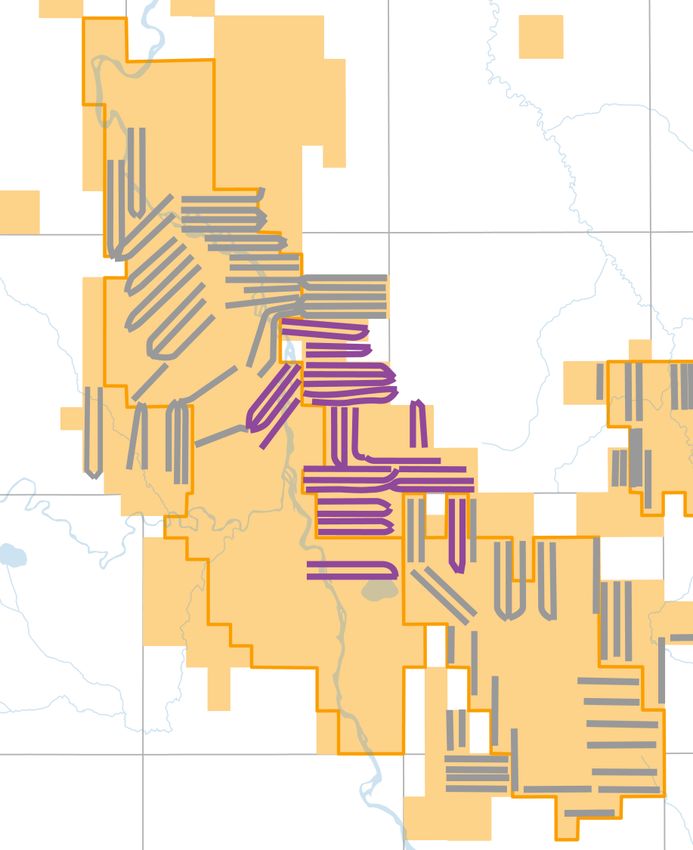
Investment Highlights
                                               •   Largest acreage holder in the Cardium

                                               •   Cardium is one of Canada’s lowest cost light oil resources,
                                                   with strong IRR and recycle ratios

                                               •   Strong well performance since the beginning of 2018 in the
                                                   Willesden Green Cardium (Crimson Lake and East Crimson)
                                                    •   Average IP30 rates of 550 boe/d (82% oil) and
                                                        IP90 rates of 376 boe/d (77% oil) per well
        High Quality                                •   FY 2019 Opex of $5.37 per boe in Willesden Green
        Assets and                                  •   ~11% decrease in DCE&T costs in 2019 program versus
        Large Acreage                                   2018 internal costs estimates
                                                    •   All 10 wells in H1 2020 program are producing, or ready to produce. The
        Position                                        initial rates on a number of these wells have exceeded expectations and
                                                        are some of the strongest seen to date in our multi-year Cardium program

                                           •       Flexible operations allow for quick reaction to commodity price changes at
                                                   minimal cost without risk of long-term reservoir impairment

                                           •       Over 400 gross type curve quality Cardium locations

                                           •       Additional opportunities, such as waterflood and EOR projects, become
                                                   competitive with increased pricing

                                           •       Ownership and control of strategic infrastructure including pipelines,
        Infrastructure                             processing and compression facilities
        Ownership and                      •       Ability to grow near-term production in both Willesden Green and Pembina
        Control                                    with minimal infrastructure spend

See end notes for additional information                                                                                        6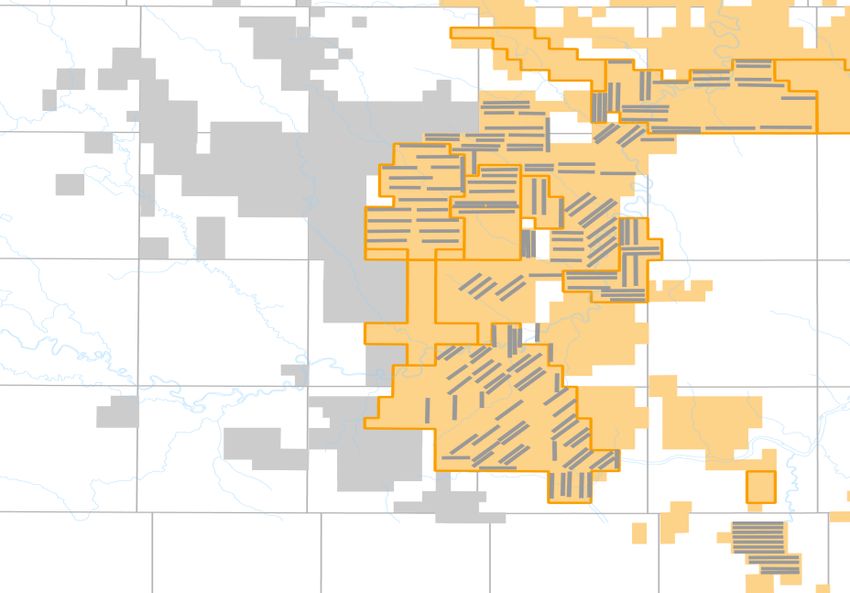
Cardium Development Program
Focused on Delivering Strong Capital Returns

Willesden Green
                   • Drilling prioritized to target highest return opportunities
Focused

Strong Economics   • Wells ranked by IRR with focus on recycle ratio

                   • Program is license ready and scalable with an inventory of drill ready
Flexible             locations to add significant program optionality

                   • Additional capital can be allocated to highly efficient, liquids weighted
Optimization         optimization projects yielding rapid project returns

                   • Well spacing and frac designed for cost efficiency and
Well Design          tailored to our target reservoirs

                   • Minimal infrastructure spend required
Infrastructure
                   • Drill order optimized to manage infrastructure capacity

                                                                                                 7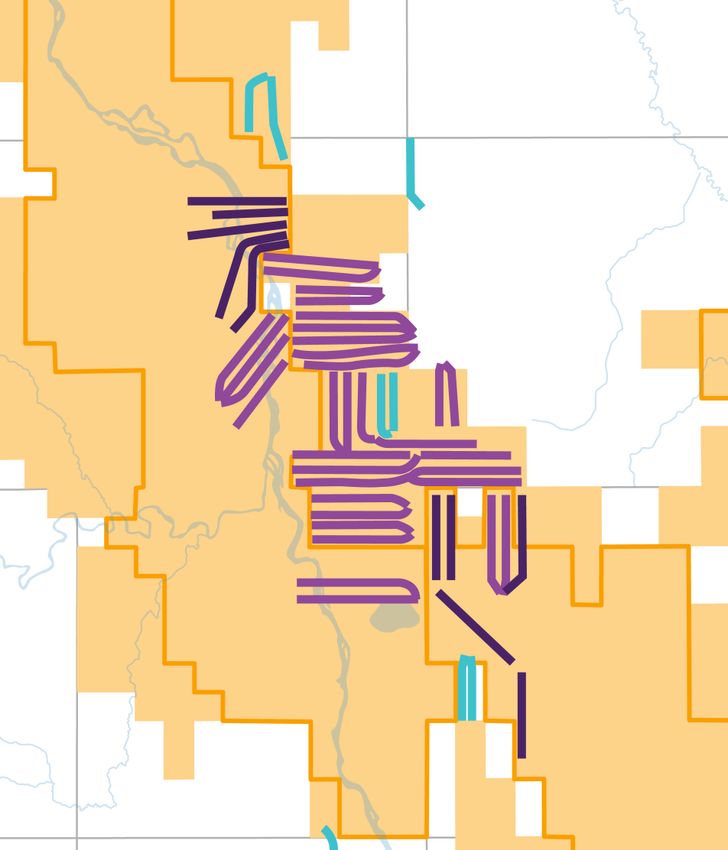
Execute Operationally
        Crimson 2018/2019 Development Program Summary

 Willesden Green Peer Comparison – Cumulative Oil                   Crimson Lake – 2018-2019 Per Well Rates (33 wells)

                                                                                                                                      OBE 2018-2019 well
                                                                    14-24 Pad (2 wells)            12-18 Pad (3 wells)                Inventory
                                                                    IP30: 575 boe/d (77% Oil)      IP30: 620 boe/d (83% Oil)          Unit land
                                                                    IP90: 430 boe/d (69% Oil)      IP90: 427 bioe/d (73% Oil)         OBE Cardium WI land
                       Since 2018, OBE Willesden Green wells have
                        averaged more oil production than peers
                                                                                                                     5-18 Pad (2 wells)
                                                                    7-24 Pad (2 wells)                               IP30: 463 boe/d (90% Oil)
                                                                    IP30: 438 boe/d (73% Oil)                        IP90: 346 boe/d (82% Oil)
                                                                    IP90: 314 boe/d (66% Oil)

                                                                                                                                   14-1 Pad (2 wells)
                                                                                                                                   IP30: 439 boe/d (83% Oil)
                                                                    8-9 Pad (3 wells)                                              IP90: 298 boe/d (82% Oil)
                                                                    IP30: 633 boe/d (75% Oil)
                                                                    IP90: 415 boe/d (68% Oil)
                                                                                                                                   2-18 Pad (2 wells)
                                                                                                                                   IP30: 323 boe/d (84% Oil)
                                                                                                                                   IP90: 275 boe/d (75% Oil)

                                                                    1-15 Well
                                                                    IP30: 777 boe/d (65% Oil)
                                                                    IP90: 493 boe/d (60% Oil)                                      12-6 Pad (3 wells)
                                                                                                                                   IP30: 597 boe/d (88% Oil)
                                                                                                                                   IP90: 391 boe/d (82% Oil)

                                                                    9-2 Pad (2 wells)
                                                                    IP30: 477 boe/d (91% Oil)
                                                                    IP90: 355 boe/d (89% Oil)                                      4-6 Pad (3 wells)
                                                                                                                                   IP30: 529 boe/d (91% Oil)
                                                                                                                                   IP90: 527 boe/d (81% Oil)

                                                                    10-36 Pad (2 wells)
                                                                    IP30: 375 boe/d (89% Oil)                                      3-29 Pad (2 wells)
                                                                    IP90: 292 boe/d (85% Oil)                                      IP30: 434 boe/d (90% Oil)
                                                                                                                                   IP90: 295 boe/d (86% Oil)

                                                                    1-36 Pad (2 wells)               1-25 Pad (2 wells)
                                                                    IP30: 683 boe/d (93% Oil)        IP30: 224 boe/d (82% Oil)
                                                                    IP90: 519 boe/d (87% Oil)        IP90: 191 boe/d (76% Oil)

                                                                            Rates shown here are an average per well on each respective padsite.
See end notes for additional information                                                                                                               8
Execute Operationally
         H1 2020 Development Program
Crimson Lake                                                                                     2020 H1 – 10 Well Program

                         R8W5                  3 kms                          INDEX MAP          • Early deliverability results from the first half program to
                                               2 miles                                             date have been particularly strong

12-26 Pad (3 wells)                                                                                    • Pad 12-26 on-stream delivering IP10: 1,215 boe/d
IP10: 1,215 boe/d (82% light oil)
IP30: 1,027 boe/d (74% light oil)
                                                                                                         (82% light oil) and IP30: 1,027 boe/d (74% light
                                                            H1 2020 Development                          oil) are our strongest oil-equivalent rates in our
                                                               Program directly                          primary Cardium program.
                                                             offsetting successful
                                                             2018-2019 programs                  • All 10 wells in the program are on production or are
                                                                                                   ready to produce as desired by the Company.

                                                                                           T43   • Development capital spending paused for balance of
                                                                                                   2020 in the current oil price environment.

                                                         3-6 Pad (2 wells)
                                                         IP10: 783 boe/d (90% light oil)
1-27 Pad (2 wells)                                       IP30: 528 boe/d (89% light oil)         Current H1 2020 Capital Summary ($51 million)
Production held for improved
pricing

                    14-17 Pad (2 wells)
                    IP10: 204 boe/d (90% light oil)

                             3-29 Pad (1 well from existing pad)
                             IP30: 443 boe/d (90% light oil)

      OBE H1 2020 program
      OBE 2018-2019 well
      Peer well
      Unit land
      OBE Cardium WI land

See end notes for additional information                                                                                                                         9
Cardium Growth & Operational Improvements
Total Cardium Production Commentary
25,000
• Our 2017-2019 drilling programs in Crimson Lake have
A verage Daily Production (boe/d)
15% Liquids Growth delivered robust production growth with high-
20,000
Netbacks and low operating costs
• Cardium
15,000 52% 55%
54% • 15% Liquids Growth since 2017
10,000 • 7% Total Production growth since 2017
11% 10 %
11%
• Willesden Green
5,000
36% 37% 35% • 105% Liquids growth since 2017
0 • 84% Total Production growth since 2017
FY 2017 FY 2018 FY 2019
Gas (boe/d) NGL (bbl/d) Oil (bbl/d)
• 27% Opex/boe improvement since 2017
Willesden Green Production Willesden Green Operating Costs
14,000
A verage Daily Production (boe/d)
12,000 105% Liquids Growth
10,000
50%
8,000
41%
6,000
42% 11%
13 %
4,000
13 %
2,000 46% 39%
45%
0
FY 2017 FY 2018 FY 2019
Gas (boe/d) NGL (bbl/d) Oil (bbl/d)
See end notes for additional information 10Optimization
Finding low cost, high value opportunities in our base
Total Optimization Program Production Commentary
1,800
787 boe/d (71% Oil) Annual Average Proven
2019
1,600
2019 Summary
2020 • $8.4MM Capital spend
1,400 • 2019 Capital Efficiency of $10,700/boe
1,200 2020 Optimization • 12 Month Capital EfficiencyCrimson Lake Cost Reduction Trajectory
Drill, Complete, Equip & Tie-In Costs ($M) Commentary
Construction
• Utilization and expansion of existing pads
$4,000 to reduce construction and infrastructure
costs
($65) • Construction timing optimization to
reduce weather related impact and
($190) equipment mobilization costs
Drilling
• Monobore where reservoir pressure
permits
• Single bit runs over extended reach
($200) HZ wells
• Multi-well pads and geographically
focused programs mitigate rig move costs
Completions
$3,545
• Frac optimization and nitrogen reduction
• Elimination of c-rings to reduce
water costs
11% improvement in drilling costs since • Utilizing industry proven
2018 internal estimates Coil-Shift Frac technology
• Lateral placement targeted to improve
drilling and completion efficiency
Site Facilities
• Leverage existing infrastructure and
inventory
• Develop within current infrastructure
Q2 2018 Construction & Drill Complete FY19 capacity
Infrastructure
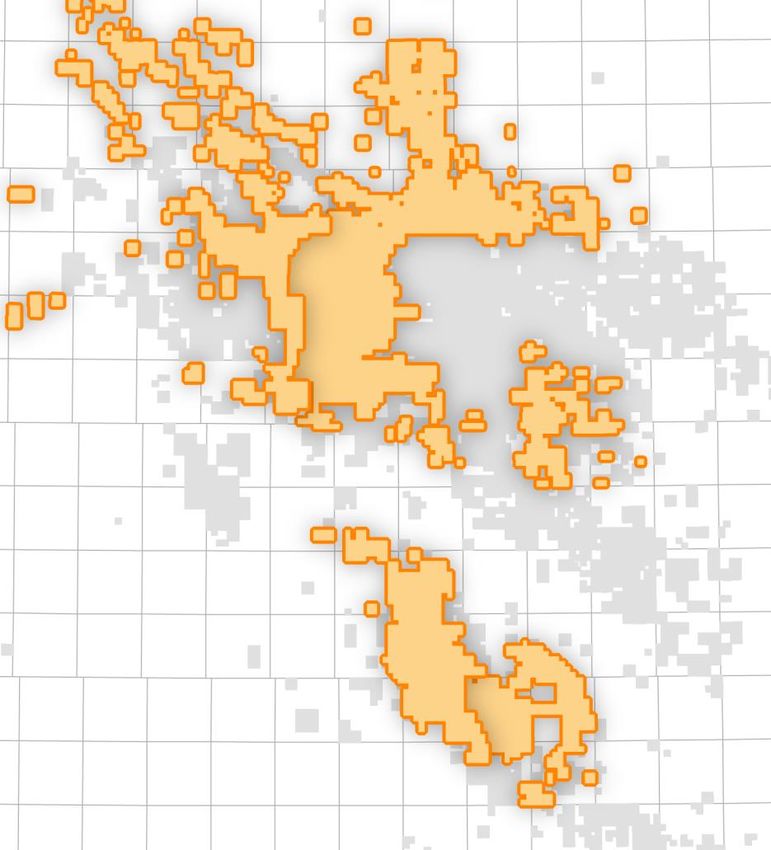
See end notes for additional information 12Cardium Play Fairways
A Large High-Graded Inventory
West Pembina Central Pembina
132 R10W5 INDEX MAP
171
Type Curve Locations Type Curve Locations
• Well established • Individual fairways and
productive trend unit boundaries in
significantly de-risked by historically pressure
major Cardium players West supported properties
• Underdeveloped acreage Pembina • Ability to waterflood for
• Easy access to existing Central minimal capital through
OBE facilities and direct Pembina existing infrastructure
access to regional • Technical de-risking
transportation through reservoir
modelling
Crimson Lake East Crimson
T45
36 71
Type Curve Locations 15 kms Type Curve Locations
10 miles
• Banked oil from historical East • Continued eastward
pressure maintenance Crimson Crimson extension of Crimson Lake
• Top quality reservoir Lake development program
previously • De-risked by new
underdeveloped by competitor drilling in
vertical drilling OBE Cardium WI land
Peer lands
2018/2019
• Recent top quartile results • Existing flexible
• Existing flexible infrastructure
infrastructure 410 type curve assigned locations
600+ total identified inventory
135 YE 2019 Net Booked Cardium Locations
See end notes for additional information 13Crimson Lake – Near Term Focus
Summary Economics
• Q1 2020 average production of 9,664 boe/d Total Capex ($MM) $3.5
• Obsidian Energy cornerstone for revitalized primary EUR (Mboe) 229
development on our Cardium acreage
• Banked oil from historical pressure maintenance in Oil IP365 (bbl/d) 157
WGCU#9 Total IP365 (boe/d) 235
• Top quality reservoir previously undeveloped due to
NPV BTAX 10% ($MM) $2.3
topographic and infrastructure challenges for vertical
drilling IRR (%) 75%
• Existing flexible infrastructure at the Crimson 13-27
Payout (years) 1.2
facility with optionality to East Crimson
Technical F&D ($/boe) $15.50
R7W5
OBE H1 2020 program
OBE 2018-2019 well 12M Efficiency ($/boed) $14,900
Peer well
Inventory
Unit land Breakeven (IRR 10%) WTI ($US/bbl) $27.23
OBE Cardium WI land
OBE East Crimson land
Type Curve – Crimson Lake
500 160
450
T43 140
A verage Daily Production (boe/d)
Cu mulative Production (mboe)
400
120
350
100
300
250 80
Crimson Lake - Daily Production
200
5 kms WGCU#9 Crimson Lake - Cumulative Production 60
150
3 miles 40
100
20
50
0 0
0 12 24 36
*Economics Flat Pricing Assumptions: WTI USD$50.00, Ed Par Diff USD$6.00, AECO CAD$2.25, FX CAD/USD $1.41 M onths
See end notes for additional information 14East Crimson – Mid Term Focus
Summary Economics
• Q1 2020 average production of 2,851 boe/d Total Capex ($MM) $3.5
• Continued Eastward extension of the successful EUR (Mboe) 203
Crimson Lake development program
Oil IP365 (bbl/d) 136
• Area has been de-risked by recent peer drilling results
supporting the revitalized development Total IP365 (boe/d) 194
• Shared and scalable infrastructure with the Crimson NPV BTAX 10% ($MM) $1.2
Lake program
• Combination of pressure supported edge drilling and IRR (%) 44%
underdeveloped unit fairways Payout (years) 1.6
Technical F&D ($/boe) $17.30
R7W5 OBE H1 2020 program
OBE 2018-2019 well
12M Efficiency ($/boed) $18,000
Peer well
Inventory Breakeven (IRR 10%) WTI ($US/bbl) $35.20
Unit land
OBE Cardium WI land
OBE Crimson land
Type Curve – East Crimson
400 140
350
A verage Daily Production (boe/d)
120
Cu mulative Production (mboe)
T43
300
100
WGCU#1
250
80
WGCU#2
200
East Crimson - Daily Production 60
150 East Crimson - Cumulative Production
5 kms
WGCU#6 40
100
3 miles
50 20
WGCU#3
0 0
0 12 24 36
*Economics Flat Pricing Assumptions: WTI USD$50.00, Ed Par Diff USD$6.00, AECO CAD$2.25, FX CAD/USD $1.41 M onths
See end notes for additional information 15West Pembina – Mid Term Focus
Summary Economics
• Q1 2020 average production of 4,492 boe/d Total Capex ($MM) $3.2
• Proven oil rich Cardium trend with undeveloped EUR (Mboe) 196
primary development acreage
Oil IP365 (bbl/d) 148
• Significant offsetting production from established
Cardium players throughout the West side of Pembina Total IP365 (boe/d) 163
• Underdeveloped core acreage NPV BTAX 10% ($MM) $2.2
• Existing flexible infrastructure with significant available IRR (%) 59%
capacity in multiple facilities
• Additional uncaptured inventory in non-operated lands Payout (years) 1.5
Technical F&D ($/boe) $16.32
R10W5 Inventory
Unit land 12M Efficiency ($/boed) $19,630
OBE Cardium WI land
OBE Pembina land
Breakeven (IRR 10%) WTI ($US/bbl) $28.86
Type Curve – West Pembina
300 120
A verage Daily Production (boe/d)
Cu mulative Production (mboe)
250 100
T48 200 80
150 60
West Pembina - Daily Production
West Pembina - Cumulative Production
100 40
50 20
5 kms
3 miles 0 0
0 12 24 36
*Economics Flat Pricing Assumptions: WTI USD$50.00, Ed Par Diff USD$6.00, AECO CAD$2.25, FX CAD/USD $1.41 M onths
See end notes for additional information 16Central Pembina – Long Term Focus
Summary Economics
• Q1 2020 average production of 4,732 boe/d Total Capex ($MM) $2.5
• The epicenter of low decline and pressure maintained EUR (Mboe) 290
development
Oil IP365 (bbl/d) 73
• Strong technical model is the foundation for additional
development from unswept fairways Total IP365 (boe/d) 90
• Ability to de-risk through geological and reservoir NPV BTAX 10% ($MM) $2.2
modelling
IRR (%) 41%
• Proven and booked waterflood response as the
foundation for growth – Strong F&D Payout (years) 2.4
• Ability to grow waterflood scale through existing wells
Technical F&D ($/boe) $8.60
and infrastructure for minimal capital cost allows for
corporate decline maintenance 12M Efficiency ($/boed) $27,930
Inventory
Unit land Breakeven (IRR 10%) WTI ($US/bbl) $25.94
OBE Cardium WI land
OBE Pembina land
Type Curve – Central Pembina
180 80
160 70
A verage Daily Production (boe/d)
Cu mulative Production (mboe)
140
60
120
5 kms 50
100
3 miles 40
80 Central Pembina - Daily Production
30
60 Central Pembina - Cumulative Production
20
40
20 10
0 0
0 12 24 36
M onths
*Economics Flat Pricing Assumptions: WTI USD$50.00, Ed Par Diff USD$6.00, AECO CAD$2.25, FX CAD/USD $1.41
See end notes for additional information 17Peace River Oil Partnership (PROP)
Summary PROP
• Q1 2020 average production of 4,040 boe/d R25 R20 R15W5
• Large contiguous heavy oil resource developed with T90
cold-flow, multi-leg horizontal wells
• Reliable and steady base production with
multiple sales points to allow for pricing optimization
• Emerging Clearwater formation oil play and
EOR potential provides additional upside
• In response to current economic conditions, 3,064 Nampa
boe/d has been shut-in, as of May 1, 2020 T85
Cadotte
Historical Production (boe/d)
Harmon Valley Seal
South
T80
T75
OBE land
See end notes for additional information 18Corporate Cost Improvements
Corporate Opex Commentary
Operating Costs
• Total reduction in Opex per boe of
21% from 2017 to Q1 2020
Further Opex Improvements
• Take advantage of Crimson Lake’s
low operating costs with continued
development focus
• Continue to optimize and drive
Corporate G&A efficiencies across our entire
Cardium footprint
G&A
• Total reduction in G&A per boe of
39% from 2017 to Q1 2020
See end notes for additional information 19Decommissioning Liability Improvement
Commentary YTD Well Abandonment Costs
Wa inwright 2019 C a rdium 2019
• Obsidian Energy is a participant and supporter of 115 Wells 12 Wells
the AER’s Area-Base Closure (ABC) program $5.0 $0.8
50% 35%
Well Abaondonment Costs ($MM)
Well Abandonment Costs ($MM)
• 2019 ABC activity highlights $4.0
Decrease $0.6 Decrease
• Savings of up to 50% on wellbore $3.0
$0.4
abandonments
$2.0
• 189 net downhole abandonments plus $0.2
$1.0
additional surface abandonments
$0.0 $0.0
• 1,139 km net of pipelines abandoned D11 XI Actuals D11 XI Actuals
Historical Reductions in Abandonment Costs –
• Pipeline abandonment activity now under
Undiscounted & Uninflated
$3,000/km
• Proactive engagement with the AER and Industry
associations to drive improvements in regulations 76% decrease
and best-practices since 2015
• Many wells in the Cardium can be reactivated,
recompleted, or used for reservoir monitoring
$2 ,543MM
• Applied for the first phase of the Alberta
government abandonment and reclamation $1,379MM
$975MM
program ($100 million), whereby the government $847MM
$621MM
will fund service providers directly to perform
abandonment and reclamation projects 2015 2016 2017 2018 2019
See end notes for additional information 20Undeveloped Reserves
2019 PDP/1P Ratio 2019 2P Locations/Section
1.60
100%
90% 1.40
80%
1.20
70%
1.00
60%
0.80
50%
40% 0.60
30%
0.40
20%
0.20
10%
0.00
0%
Peer OBE Peer Peer Peer Peer Peer Peer Peer Peer
Peer OBE Peer Peer Peer Peer Peer Peer Peer Peer
1 2 3 4 5 6 7 8 9
1 2 3 4 5 6 7 8 9
Commentary
• OBE has booked undeveloped locations based on achievable capital spending over the next 5 years. In comparison to
peers, OBE is conservatively booked with one of the highest ratio of PDP/1P of all identified companies
• High PDP/1P ratio demonstrates mature asset base with low risk reserves that do not rely on significant capital
spending
• OBE has a significant land base with a low booked location per section metric compared to peers indicating significant
room to book future locations as development progresses
21Current Hedge Strategy and Position
Hedging Strategy
• Hedge up to 50% of production volumes after royalty
• Hedge at price levels to:
• Protect FFO
• Support economic capital program
• Potential debt repayment
• Hedges are done on a $CAD basis to avoid FX management
Hedged Oil Position & Exercise Price (CAD$/bbl) Hedged Gas Position & Exercise Price (CAD$/GJ)
30,000
10,000
$1.59 $1.59 $1.59
$7 6.61 25,000 $1.60 $1.60 $1.60
$7 8.98 $2.40
He dged Oil Volumes (bbl/d)
Hedged Gas Volumes (gj/d)
7,500 $7 8.58
20,000 $2.33
5,000 15,000
$7 8.11
$7 7.92 10,000
2,500 $7 7.41
5,000
0 0
Jan Feb Mar Apr May Jun Jan Feb Mar Apr May Jun Jul Aug Sep
2020 2020 2020 2020 2020 2020 2020 2020 2020 2020 2020 2020 2020 2020 2020
*Hedged Positions are current as of May 5, 2020
See end notes for additional information 22Environmental, Social & Governance
Environmental Social Governance
Obsidian Energy is committed to Obsidian Energy is committed to Obsidian Energy makes it a
minimizing the impact of our making a positive impact in the priority to ensure all
operations on the environment. communities in which we stakeholders have a clear
operate and live. understanding of our approach
The ABC program allows for
to business operations and our
significant progress on Obsidian Energy supported and
expectations for regulatory
abandonment and reclamation donated to children’s
compliance.
of areas as a whole while development organizations, the
increasing efficiencies and Prostate Cancer Center, and The Board is comprised of 88%
decreasing costs of managing mental health organizations in independents, with an average
our ARO profile. 2019. tenure for Board members of 3
years.
Our environmental programs Obsidian Energy is a member of
aim to meet or exceed all Explorers and Producers Our governance policies include
environmental regulation, Association of Canada (EPAC), written documents such as a
encompass stakeholder supporting Canada’s Diversity Policy, Business
communication, resource conventional energy producers Conduct, Ethics Code of
conservation, and proper site and its employees across Conduct and Whistleblower
abandonment and reclamation western Canada. Policy.
practices.
23Experienced management and
strong technical team
Stephen E. Loukas, Interim President and Chief Executive Officer Financial and commercial
• Vast experience in corporate transactions, capital markets, corporate finance Strong financial,
and leadership
$$
commercial and capital
• Mr. Loukas is a partner, managing member, and portfolio manager at
FrontFour Capital Group LLC, one of the Company’s top shareholders, and
markets experience
has been a member of the Board of Directors since 2018 leading the Company
Peter D. Scott, Senior Vice President, Chief Financial Officer Drilling, completions and
• 30 years of extensive financial experience, 20 years in CFO roles primarily in Subsurface technical
Canadian Oil and Gas companies Strong understanding of
• Previously, Senior Vice President and Chief Financial Officer at Ridgeback geological subsurface,
Resources Inc., previously Lightstream Resources Ltd. reservoir modelling,
advanced design,
Aaron Smith, Senior Vice President, Development & Operations construction and
production of multi-stage
• 20 years of engineering expertise across a broad range of technical and
leadership roles fractured horizonal wells
• Prior to Obsidian, VP-level leadership roles at Sinopec Canada and early
career experience in Corporate Planning, Completions, and Reservoir
Engineering Encana Corp. Operations
Well-established routines
Gary Sykes, Vice President, Commercial with methodical planning
▪ Over 25 years of experience in a variety of technical, operational and and preparations, which
managerial positions in domestic and international oil and gas, primarily with has resulted in exemplary
ConocoPhillips
safety performance
• Extensive Board experience, including the Qatargas 3 joint venture, The
Mackenzie Valley Pipeline Board and Calgary Zoo
Mark Hawkins, Vice President, Legal, General Counsel and Employees
Corporate Secretary Deeply experienced with
• Served as the corporate secretary at Obsidian Energy since 2015 and was long track-record,
formerly the General Counsel and Corporate Secretary representing the top tier
• 15 years of legal experience of Cardium expertise
24Appendix &
Endnotes
25End Notes
Slide 3: Corporate Overview Slide 14 - 18: Asset Slides
Market Capitalization and Enterprise Value was determined at the close of business on May 5, 2020. Inventory locations are internal estimates and are subject to change. No inventory locations have been assigned
Net Debt, Tax Pools and Common Shares Outstanding is based on Q1 2020 financials. to land where Obsidian Energy is not the operator.
Reserves (2P), RLI, NPV10, is based on 2P, PDP Decline are as disclosed in our press release dated Economic metrics are defined from provided type curves, on the Plan Pricing Scenario and break-even IRR10%.
February 6, 2020, titled “Obsidian Energy Releases 2019 Reserves Results” (the “Release”).
Type curve production is defined by existing productive wells within the defined trend displaying similar reservoir
See end note for Slide 13 – 17 for production breakdown. and geological characteristics and normalized for horizontal length and completion. Development plan well
counts are indicative and based on internal estimates under our Plan Pricing Scenario.
Slide 6: Investment Highlights
Production amounts are averaged per well and the data set includes 38 wells for the IP30 and 33 wells Historical PROP production includes production data as of March 31,3030.
for the IP90 wells. Year to date Opex in Willesden Green are as of December 2019. Drilling costs are
averaged per a normalized 2,600m lateral well. Production and drilling costs are internal estimates. Q1 2020 Asset Production is broken down as follows:
Crimson Lake: Light Oil – 5,028 bbl/d, NGL – 994 bbl/d, Gas – 21,857 mcf/d
See slide 11 for further details regarding 2018 internal estimates DCE&T costs. East Crimson: Light Oil – 1,433 bbl/d, NGL – 332 bbl/d, Gas – 6,513 mcf/d
West Pembina: Light Oil – 3,075 bbl/d, NGL – 333 bbl/d, Gas – 6,505 mcf/d
Slide 7: 2020 Cardium Development Program Central Pembina: Light Oil – 2,661 bbl/d, Heavy Oil – 40 bbl/d, NGL – 508 bbl/d, Gas – 9,133 mcf/d
Timing is based on internal estimates. Optimization capital efficiency and oil weighting are internal PROP: Light Oil – 0 bbl/d, Heavy Oil – 3,432 bbl/d, NGL – 3 bbl/d, Gas – 3,626 mcf/d
estimates. AB Viking: Light Oil – 219 bbl/d, Heavy Oil – 44 bbl/d, NGL – 37 bbl/d, Gas – 3,177 mcf/d
Legacy: Light Oil – 91 bbl/d, Heavy Oil – 128 bbl/d, NGL – 31 bbl/d, Gas – 1,367 mcf/d
Slide 8: Execute Operationally Crimson 2018/2019 Development Program Summary Divested: Light Oil – 5 bbl/d, NGL – 0 bbl/d, NGL – 31 Gas – 2 mcf/d
Production amounts and Drilling Costs are averaged per well. Production was calculated via data from
Accumap with the following search parameters: Horizontal wells spud on or after January 1, 2018 in the Slide 20: Decommissioning Liability Improvement
Willesden Green Field and is current as of January 2020. Cost estimates are based on internal estimates.
Slide 9: Execute Operationally – H1 2020 Development Program Slide 21: Underdeveloped Reserves
H1 2020 Capital Summary is based on the corporate and operational update press release dated April Reserves data was collected from publicly available. Peers include BNE, CJ, IPO, PRQ, SGY, TVE, TOG, WCP
23, 2020. and YGR.
Slide 10: Cardium Growth & Operational Improvements Slide 22: Current Hedge Position and Strategy
Year to date numbers are as of December 2019. Liquids include oil, condensates, and propane. Current Hedge Position and the weighted average price, or the “Exercise Price” is current as of May 5, 2020. All
Production is A&D adjusted. hedges have been executed in Canadian dollars.
Slide 11: 2019 Optimization Program Overview
Production and Capital costs are internal estimates.
Slide 12: Crimson Lake Cost Reduction Trajectory
Costs have been normalized to a 2,600m lateral well and are internal estimates.
Slide 13: Cardium Play Fairways
Individual play fairways are Obsidian Energy defined trends displaying similar reservoir and geological
characteristics. The “410 type curve assigned locations” are based on gross locations and are
estimates that full field development based on the inventory locations outlined would achieve an
estimated average production consistent with the defined type curve for that fairway. Type curves are
defined by existing productive wells within the defined trend displaying similar reservoir and geological
characteristics and normalized for horizontal length and completion. Inventory not included within the
assigned 410 has not been assigned a production profile and has not been included in development
plan models or forward-looking production estimates.
(1) Production profiles are based on reserve profiles
(2) Reserves data based on YE 2019 reserves evaluation (Sproule Associates Limited) 26Definitions and Industry Terms
PDP means proved developed producing reserves as per Oil and FFO means funds flow from operations, detailed in the Non-GAAP NPV means net present value, before tax discounted at 10 percent
Gas Disclosures Advisory measure advisory
NYSE means New York Stock Exchange
1P means proved reserves as per Oil and Gas Disclosures FY means fiscal year
Advisory Opex means operating costs
GJ/D means gigajoules per day
2P means proved plus probable reserves as per Oil and Gas
Disclosures Advisory Payout means the time it takes to cover the return of your initial cash
G&A means general and administrative expenses outlay
12M Efficiency means 12 month capital efficiency in $/boe/d
GOR means gas oil ratio PCU means Pembina Cardium Unit
ABC means area based closure program initiative from the AER
A&D means oil and natural gas property acquisitions and H1 means first half of the year Plan Pricing Scenario means the flat price deck at WTI USD$50.00,
divestitures Ed Par Diff USD$6.00, AECO CAD$2.25, FX CAD/USD $1.41
H2 means second half of the year
AER means Alberta Energy Regulor
POR means porosity
ARO means Asset Retirement Obligation Hz means horizontal well
Perm means permeability
Avg means Average
IP means initial production, which is the average production over a
bbl and bbl/d means barrels of oil and barrels of oil per day, specified number of days PROP and Peace River means Peace River Oil Partnership
respectively
IRR means Internal Rate of Return which is the interest rate at Release means our a press release dated February 6, 2020
BHA bottom hole assembly which the NPV equals zero
bopd means barrel of oil per day Recycle Ratio means Netback divided by F&D
Liquids means crude oil and NGLs
boe, boe/d means barrels of oil equivalent and barrels of oil RLI means Reserve Life Index
equivalent per day, respectively LLR means Licensee Liability Rating Program
CAD means Canadian Dollar SEC means U.S. Securities and Exchange Commission
M or k means thousands
Capital Expenditures & Capex includes all direct costs related to Spud means the process of beginning to drill a well
our operated and non-operated development programs including MM means millions
drilling, completions, tie-in, development of and expansions to
existing facilities and major infrastructure, optimization and EOR Unbooked means locations that are internal estimates based on
activities MMcf means million cubic feet and MMcf/d means million cubic feet Obsidian Energy’s prospective acreage and an assumption as to the
per day number of wells that can be drilled per section based on industry
Company or OBE means Obsidian Energy Ltd; as applicable practice and internal review. Unbooked locations do not have
Mboe means thousand barrels oil equivalent attributed reserves or resources (including contingent and
D11 refers to the AER Directive 11 which governs Licensee prospective). Unbooked locations have been identified by
Liability Rating (LLR) Program - Updated Industry Parameters and management as an estimation of Obsidian Energy’s multi-year drilling
Liability Costs MMboe means million barrels oil equivalent activities based on evaluation of applicable geologic, seismic,
engineering, production and reserves information.
DCE&T means drilling, completion, equip and tie-in Mbbl & MMbbl means thousands barrels of oil and million barrels of
Decommissioning means decommissioning expenditures oil, respectively USD means United States Dollar
Enviro means decommissioning expenditures MSW means Mixed Sweet Oil Blend. It is often referred to as WCS means Western Canadian Select
Edmonton Par
EOR means enhance oil recovery
WI means working interest
EUR means estimated ultimate recovery N, S, E, W means the North, South, East, West or in any
combination
F&D means finding and development costs WF means waterflood
NAV means net asset value
Frac means fraccing or fracturing, short name for Hydraulic WTI means West Texas Intermediate
fracturing, a method for extracting oil and natural gas Netback means the summary of all costs associated with bringing
one unit of oil to the marketplace and the revenues from the sale of YE means year end
Free Cash Flow, which is Funds Flow from Operations less Total all products generated from that same unit and is expressed as a
Capital Expenditures gross profit per barrel YOY means year over year
FX means foreign exchange rate, in our case typically refers to C$ NGL means natural gas liquids which includes hydrocarbon not YDT means year to date
to US$ exchange rates marketed as natural gas (methane) or various classes of oil
27Non-GAAP Measures Advisory
In this presentation, we refer to certain financial measures that are not determined in accordance with IFRS. These measures as presented do not have any standardized meaning
prescribed by IFRS and therefore they may not be comparable with calculations of similar measures for other companies. We believe that, in conjunction with results presented in
accordance with IFRS, these measures assist in providing a more complete understanding of certain aspects of our results of operations and financial performance. You are
cautioned, however, that these measures should not be construed as an alternative to measures determined in accordance with IFRS as an indication of our performance. These
measures include the following:
Enterprise Value is the measure of a company’s total value and includes all ownership interests and asset claims from both debt and equity. It is calculated as share price multiplied
by total shares outstanding plus Net Debt
Funds flow is cash flow from operating activities before changes in non-cash working capital, decommissioning expenditures and office lease settlements
Funds flow from operations or FFO is cash flow from operating activities before changes in non-cash working capital, decommissioning expenditures and office lease settlements
which also excludes the effects of financing related transactions from foreign exchange contracts and debt repayments and certain other expenses and is representative of cash
related to continuing operations.
Netback is a measure of cash operating margin on an absolute or per-unit-of-production basis and is calculated as the absolute or per-unit-of-production amount of revenue less
royalties, operating costs and transportation. The measure is used to assess the operational profitability of the company as well as relative profitability of individual assets. For
additional information relating to netbacks, including a detailed calculation of our netbacks, see our latest management's discussion and analysis which is available in Canada at
www.sedar.com and in the United States at www.sec.gov; and
Net Debt is the amount of long-term debt, comprised of long-term notes and bank debt, plus net working capital (surplus)/deficit. Net debt is a measure of leverage and liquidity
28Oil and Gas Information Advisory
Barrels of oil equivalent ("boe") may be misleading, particularly if used in isolation. A boe conversion ratio of six thousand cubic feet of natural gas to one barrel of crude oil is based
on an energy equivalency conversion method primarily applicable at the burner tip and does not represent a value equivalency at the wellhead. Given that the value ratio based on the
current price of crude oil as compared to natural gas is significantly different from the energy equivalency conversion ratio of 6:1, utilizing a conversion on a 6:1 basis is misleading as
an indication of value.
Inventory
This presentation discloses drilling locations in three categories: (i) proved locations; (ii) probable locations; and (iii) unbooked locations. Proved locations and probable locations are
derived from the Sproule Report and account for drilling locations that have associated proved and/or probable reserves, as applicable. Unbooked locations are internal estimates
based on our prospective acreage and an assumption as to the number of wells that can be drilled per section based on industry practice and internal review. Unbooked locations do
not have attributed reserves or resources.
Corporately, the Company has 212 gross booked proved locations and 228 gross booked probable locations as set forth in the Sproule Report.
Unbooked locations have been identified by management as an estimation of our multi-year drilling activities based on evaluation of applicable geologic, seismic, engineering,
production and reserves information. There is no certainty that we will drill all unbooked drilling locations and if drilled there is no certainty that such locations will result in additional oil
and gas reserves, resources or production. The drilling locations on which we actually drill wells will ultimately depend upon the availability of capital, regulatory approvals, seasonal
restrictions, oil and natural gas prices, costs, actual drilling results, additional reservoir information that is obtained and other factors. While certain of the unbooked drilling locations
have been derisked by drilling existing wells in relative close proximity to such unbooked drilling locations, other unbooked drilling locations are farther away from existing wells where
management has less information about the characteristics of the reservoir and therefore there is more uncertainty whether wells will be drilled in such locations and if drilled there is
more uncertainty that such wells will result in additional oil and gas reserves or production.
29Reserves Disclosure and Definitions
Unless otherwise noted, any reference to reserves in this presentation are based on the report ("Sproule Report") prepared by Sproule Associates Limited dated February 3, 2020 where they evaluated one
hundred percent of the crude oil, natural gas and natural gas liquids reserves of Obsidian Energy and the net present value of future net revenue attributable to those reserves effective as at December 31,
2019. For further information regarding the Sproule Report, see our Release. It should not be assumed that the estimates of future net revenues presented herein represent the fair market value of the reserves.
There is no assurance that the forecast price and cost assumptions will be attained and variances could be material. The recovery and reserves estimates of crude oil, natural gas liquids and natural gas
reserves provided herein are estimates only and there is no guarantee that the estimated reserves will be recovered. Actual crude oil, natural gas and natural gas liquid reserves may be greater than or less
than the estimates provided herein. The estimates of reserves for individual properties may not reflect the same confidence level as estimates of reserves for all properties, due to the effects of aggregation.
Production and Reserves
The use of the word "gross" in this presentation (i) in relation to our interest in production and reserves, means our working interest (operating or non-operating) share before deduction of royalties and without
including our royalty interests, (ii) in relation to wells, means the total number of wells in which we have an interest, and (iii) in relation to properties, means the total area of properties in which we have an
interest. The use of the word "net" in this presentation (i) in relation to our interest in production and reserves, means our working interest (operating or non-operating) share after deduction of royalty
obligations, plus our royalty interests, (ii) in relation to our interest in wells, means the number of wells obtained by aggregating our working interest in each of our gross wells, and (iii) in relation to our interest in
a property, means the total area in which we have an interest multiplied by the working interest owned by us. Unless otherwise stated, production volumes and reserves estimates in this presentation are stated
on a gross basis. All references to well counts are net to the Company, unless otherwise indicated.
Reserve Definitions
Reserves are estimated remaining quantities of oil and natural gas and related substances anticipated to be recoverable from known accumulations, as of a given date, based on the analysis of drilling,
geological, geophysical, and engineering data; the use of established technology; and specified economic conditions, which are generally accepted as being reasonable. Reserves are classified according to the
degree of certainty associated with the estimates.
proved reserves are those reserves that can be estimated with a high degree of certainty to be recoverable. It is likely that the actual remaining quantities recovered will exceed the estimated
proved reserves.
probable reserves are those additional reserves that are less certain to be recovered than proved reserves. It is equally likely that the actual remaining quantities recovered will be greater or less
than the sum of the estimated proved plus probable reserves.
Each of the reserves categories (proved and probable) may be divided into developed and undeveloped categories:
Developed reserves are those reserves that are expected to be recovered from existing wells and installed facilities or, if facilities have not been installed, that would involve a low expenditure (for example,
when compared to the cost of drilling a well) to put the reserves on production. The developed category may be subdivided into producing and non-producing.
Developed producing reserves are those reserves that are expected to be recovered from completion intervals open at the time of the estimate. These reserves may be currently producing or, if
shut-in, they must have previously been on production, and the date of resumption of production must be known with reasonable certainty.
Developed non-producing reserves are those reserves that either have not been on production, or have previously been on production, but are shut-in, and the date of resumption of production is
unknown.
Undeveloped reserves are those reserves expected to be recovered from known accumulations where a significant expenditure (for example, when compared to the cost of drilling a well) is required to render
them capable of production. They must fully meet the requirements of the reserves category (proved, probable) to which they are assigned.
For additional reserve definitions, see the Release.
30Forward-Looking Information Advisory
Certain statements contained in this presentation constitute forward-looking statements or information (collectively "forward-looking statements. Forward-looking statements are typically identified by words such as "anticipate",
"continue", "estimate", "expect", "forecast", "budget", "may", "will", "project", "could", "plan", "intend", "should", "believe", "outlook", "objective", "aim", "potential", "target" and similar words suggesting future events or future
performance. In addition, statements relating to "reserves" or "resources" are deemed to be forward-looking statements as they involve the implied assessment, based on certain estimates and assumptions, that the reserves
and resources described exist in the quantities predicted or estimated and can be profitably produced in the future. Please note that initial production and/or peak rates are not necessarily indicative of long-term performance or
ultimate recovery. In particular, this presentation contains, without limitation, forward-looking statements pertaining to the following: our first half 2020 guidance including production, capital expenditures including
decommissioning, operating and G&A cost range; the expected decline rates and reserve life index on reserves; our go-forward strategic priorities in both the short and long term; our cost control measures for operating costs,
personnel costs and office lease gong forward; the potential impact of the government aid programs and that we will evaluate the applicability and potential benefit of the credit liquidity enhancement program to our situation; that
our flexible operations allow for quick reaction to commodity price changes at minimal cost without risk of long-term reservoir impairment; that there are additional opportunities in the portfolio, such as waterflood and EOR
projects, which become competitive with increased pricing; our ability to grow near-term production in both Wilesden Green and Pembina with minimal infrastructure spend; our Cardium development program including timing,
locations, costs, optionality, spacing and frac design; that the 10 weell H1 Cardium program are either on production or ready to produce as desired by the Company; our current H1 2020 capital summary and flexibility depending
on commodity price; how our optimization program is repeatable and impactful; that certain locations have been de-risked due to various reasons; how we plan to target certain oil banks and the keys to its success; how we plan
to reduce certain costs; our potential locations; that the emerging Clearwater formation oil play provides potential upside with stacked development potential and that there is future EOR potential which can provide additional
upside; our ability to waterflood certain locations and for minimal capital through existing infrastructure and impact that has on corporate decline maintenance; that we are proactively engaging with the AER and industry
associates to drive improvements and best-practices; that many wells in the Cardium can be reactivated, recompleted, or used for reservoir monitoring; that the Company has significant room to book future location as
development progresses; our hedge thresholds, pricing levels, and impact that has on the Company generally; and our goals for environmental, social and governance programs.
The key metrics for the Company set forth in this presentation may be considered to be future-oriented financial information or a financial outlook for the purposes of applicable Canadian securities laws. Financial outlook and
future-oriented financial information contained in this presentation are based on assumptions about future events based on management's assessment of the relevant information currently available. In particular, this presentation
contains projected operational and financial information for 2020 and beyond for the Company. The future-oriented financial information and financial outlooks contained in this presentation have been approved by management
as of the date of this presentation. Readers are cautioned that any such financial outlook and future-oriented financial information contained herein should not be used for purposes other than those for which it is disclosed herein.
With respect to forward-looking statements contained in this document, we have made assumptions regarding, among other things: we will have the ability to continue as a going concern going forward and realize our assets and
discharge our liabilities in the normal course of business; our ability to complete asset sales and the terms and timing of any such sales; the Alberta government mandated production curtailment; the impact of regional and/or
global health related events on energy demand; global energy policies going forward; the economic returns that we anticipate realizing from expenditures made on our assets; future crude oil, natural gas liquids and natural gas
prices and differentials between light, medium and heavy oil prices and Canadian, WTI and world oil and natural gas prices; future capital expenditure levels; future crude oil, natural gas liquids and natural gas production levels;
drilling results; future exchange rates and interest rates; future taxes and royalties; the continued suspension of our dividend; our ability to execute our capital programs as planned without significant adverse impacts from various
factors beyond our control, including weather, infrastructure access and delays in obtaining regulatory approvals and third party consents; our ability to obtain equipment in a timely manner to carry out development activities and
the costs thereof; our ability to market our oil and natural gas successfully; our ability to obtain financing on acceptable terms, including our ability to renew or replace our reserve based loan; that we are able to move forward
through the various reconfirmation, redetermination dates with the credit facility and our ability to finance the repayment of our senior secured notes on maturity; and our ability to add production and reserves through our
development and exploitation activities. In addition, many of the forward-looking statements contained in this document are located proximate to assumptions that are specific to those forward-looking statements, and such
assumptions should be taken into account when reading such forward-looking statements.
Please note that illustrative examples are not to be construed as guidance for the Company and further details on assumptions can be found in the End Notes section of the presentation.
Although Obsidian Energy believes that the expectations and assumptions on which such forward-looking information is based are reasonable, undue reliance should not be placed on the forward-looking information because
Obsidian Energy can give no assurances that they will prove to be correct. Since forward-looking information addresses future events and conditions, by its very nature it involves inherent risks and uncertainties. Actual results
could differ materially from those currently anticipated due to a number of factors and risks. These include, but are not limited to: the risks associated with the oil and gas industry in general such as operational risks in
development, exploration and production; the possibility that the semi-annual borrowing base re-determination under our reserve-based loan is not acceptable to the Company or that we breach one or more of the financial
covenants pursuant to our amending agreements with holders of our senior, secured notes; the impact that any government assistance programs could have on the Company in connection with, among other things, the COVID-
19 pandemic and other regional and/or global health related events; the possibility that we are not able to continue as a going concern and realize our assets and discharge our liabilities in the normal course of business; the
impact on energy demands due to regional and/or global health related events; delays or changes in plans with respect to exploration or development projects or capital expenditures; the uncertainty of estimates and projections
relating to reserves, production, costs and expenses; health, safety and environmental risks; commodity price and exchange rate fluctuations; interest rate fluctuations; marketing and transportation; loss of markets;
environmental risks; competition; incorrect assessment of the value of acquisitions; failure to complete or realize the anticipated benefits of acquisitions or dispositions; ability to access sufficient capital from internal and external
sources; failure to obtain required regulatory and other approvals; reliance on third parties; and changes in legislation, including but not limited to tax laws, royalties and environmental regulations. Readers are cautioned that the
foregoing list of factors is not exhaustive. Additional information on these and other factors that could affect Obsidian Energy, or its operations or financial results, are included in the Company's Annual Information Form (See
"Risk Factors" and "Forward-Looking Statements" therein) which may be accessed through the SEDAR website (www.sedar.com), EDGAR website (www.sec.gov) or Obsidian Energy's website.
Unless otherwise specified, the forward-looking statements contained in this document speak only as of May 5, 2020. Except as expressly required by applicable securities laws, we do not undertake any obligation to publicly
update or revise any forward.
31You can also read