Spatial and Multicriteria Analysis of Dimension Stones and Crushed Rocks Quarrying in the Context of Sustainable Regional Development: Case Study ...
←
→
Page content transcription
If your browser does not render page correctly, please read the page content below
sustainability

Article
Spatial and Multicriteria Analysis of Dimension
Stones and Crushed Rocks Quarrying in the Context
of Sustainable Regional Development: Case Study of
Lower Silesia (Poland)
Jan Blachowski *          and Anna Buczyńska
 Faculty of Geoengineering, Mining and Geology, Wrocław University of Science and Technology,
 50-370 Wroclaw, Poland; anna.buczynska@pwr.edu.pl
 * Correspondence: jan.blachowski@pwr.edu.pl; Tel.: +48-71-320-68-75

 Received: 12 March 2020; Accepted: 7 April 2020; Published: 9 April 2020

 Abstract: This study aimed to analyze and assess the spatial and temporal trends in distribution
 of reserves and production of igneous and metamorphic dimension stones and crushed rocks in
 the Lower Silesia region, which with 90% of total supply is the key source region of these rock raw
 materials in Poland. The research utilized descriptive statistics to examine temporal variations of
 production, as well as to determine sufficiency of these resources for four different scenarios and
 seven main lithological groups of rocks. Spatial statistics in the geographic information system
 was used to map changes in spatial distribution of production with the density function, as well as
 to determine areas of highest concentration in the 2010–2018 period. Then, 169 communes in the
 region were assessed using the multicriteria analytical hierarchy process (AHP) technique to identify
 local communities prospective for development of this mining sector. Strong, positive correlation
 (r = 0.645) between year to year production change with annual rate of gross domestic product was
 determined. Sufficiency of economic reserves was estimated, in four scenarios, as being the lowest
 for melaphyre and porphyry (25–49 years), and the highest for marble (380–389 years). Reserves of
 basalt and amphibolite should last for approximately 50 years (32–60 and 36–67 years, respectively),
 granite for 82 to 110 years, and gabbro and gneiss for over 100 years (78–159 and 76–189 years,
 respectively). Maps revealed a possible trend of increasing production in quarries located in the
 central and eastern parts of Lower Silesia, whereas multicriteria analysis allowed for the identification
 of nine communes with the highest potential for rock raw material quarrying. The practical outcome
 of this study is a knowledge database for authorities, upon which sustainable management of regional
 rock raw materials can be based in the context of economic, social, and environmental impacts of
 their extraction.

 Keywords: dimension stones; crushed rocks; spatial statistics; spatial analysis; analytical hierarchy
 process; Poland; Lower Silesia; economy

1. Introduction
     Dimension stones and crushed rocks (DSCR) include igneous rocks such as basalt, diabase, gabbro,
granite, melaphyre, porphyry, and syenite; metamorphic rocks such as amphibolite, gneiss, hornfels,
metamorphic slate, marble, migmatite, serpentinite, and greenstones; and sedimentary rocks such
as chalcedonite, dolomite, quartzite, slate, marl, sandstone, limestone, greywacke, travertine, and
conglomerate. According to the United States Geological Survey [1], the main types of dimension
(ornamental) rocks include granite, limestone, sandstone and marble, with the first three and dolomite
also being sources of crushed rocks [1]. Other sources indicate the use of slate, gabbro, and travertine,

Sustainability 2020, 12, 3022; doi:10.3390/su12073022                       www.mdpi.com/journal/sustainability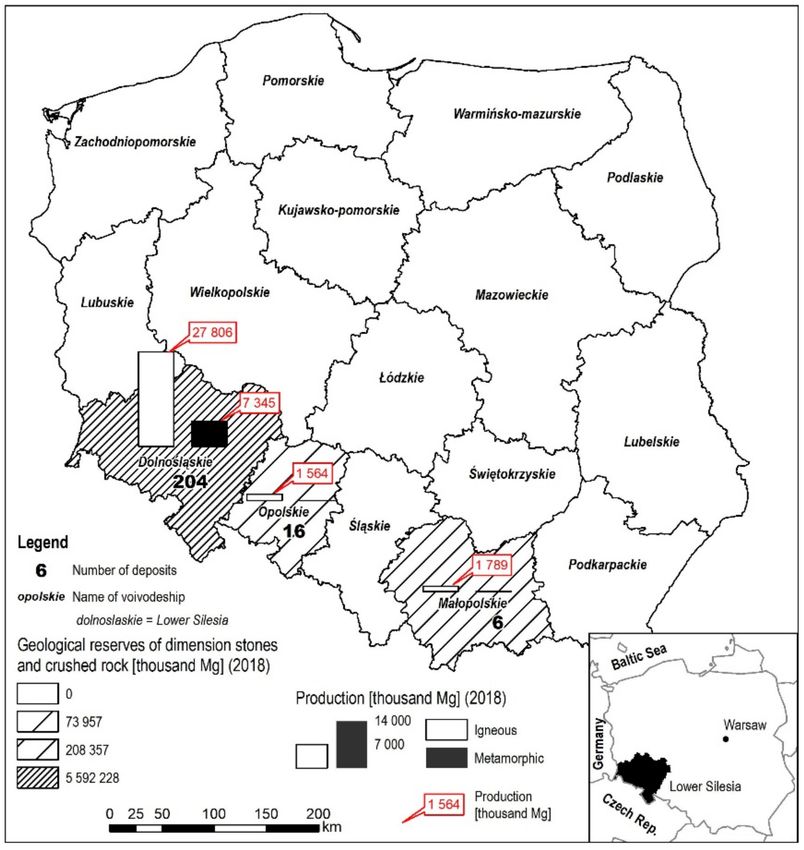
Sustainability 2020, 12, 3022                                                                        2 of 22

among others, for ornamental purposes, and list the use of basalt, gabbro, and gneiss for crushed rock
production [2–4].
      Globally, dimension stones and crushed rocks are considered to be key resources, that is, resources
that enable proper functioning of the economy and satisfy the living standards of the society. Demand
for these rock raw materials, due to their properties being used in the construction industry, including
in building, road and railroad industries, construction, and modernization, is related to the growth of
the economy. Thus, it is essential to ensure sustainable consumption and production patterns of these
natural resources in accordance with the United Nations’ Sustainable Development Goals Agenda,
including goal 12 of responsible consumption and production (www.un.org/sustainabledevelopment)
through responsible territorial development policies. According to the British Geological Survey
study, production of DSCR between 2013 and 2017 increased by 8.6% from 1,110,895.7 thousand Mg
to 1,206,066.4 thousand Mg in European countries [5]. Poland was the seventh largest producer of
dimension stones and crushed rocks in 2017 and the third largest of all aggregates. Despite available
resources of domestic dimension stones and crushed rocks, it is important to ensure that economic use
of these rock raw materials is carried out in a thoughtful and balanced manner and to secure sufficient
supply of these resources that meets the present and provides for future needs [6]. This is due to the fact
that the available deposits of DSCR are distributed irregularly and numerous undeveloped deposits are
located in areas covered by various forms of nature protection that limit or prohibit their use. In Poland,
as a whole, the sufficiency of all types of dimension stones and crushed rock resources is estimated
at approximately 50 years with the current level of mining [7]. Research by Lewicka and Burkowicz
revealed that, depending on the region, between 41% and 62% of undeveloped deposits are located in
protected areas [8]. The Lower Silesia region, because of advantageous geological conditions [8–10],
is the principal source and leading supplier of igneous and metamorphic rock raw materials in Poland.
The production volume of these DSCR in Lower Silesia compared with the rest of Poland, together
with documented geological reserves of these resources, is shown in Figure 1. The size of symbols
used depicts total production in 2018. Lower Silesia is the main contributor supplying between 43%
and 46% of total DSCR production and approximately 90% of igneous and metamorphic DSCR in
the country annually [11]. Therefore, rock raw materials quarrying, and the associated processing
and transport sectors have an important part in the national and regional economies and for local
communities. In turn, increased demand for these materials leads to environmental and social conflicts
of mining and transport.
      The two main goals of this study were to analyze and to assess the most recent spatial and temporal
changes in distribution of quarrying of igneous and metamorphic dimension stones and crushed
rocks in the Lower Silesia region in the 2010–2018 period, as well as to identify areas (communes)
with the greatest potential of using the available rock raw material resources for their economic
benefit with respect to the existing environmental, social, and infrastructure constraints. For this
purpose, the geospatial and descriptive statistics methodology in geographic information systems
(GIS) and multicriteria analytic hierarchy process (AHP) technique were adopted. The present study
is a consequence of research started by Blachowski and reported in [12], and provides information
for regional authorities responsible for spatial development policies. To the best of the authors’
knowledge, it is the first work using this multifaceted approach. Table 1 contains a summary review of
publications focusing on the topic of rational management of rock raw materials (including dimension
stones and crushed rocks), with a list of subjects, methodologies, and resources analyzed in the cited
research. The main and most frequent subjects of investigations have focused on environmental
issues and include valorization and sustainable use of deposits, social and environmental influence of
mining, and management of waste from quarrying of rock raw materials. However, the most common
methodological approaches utilize GIS-based mapping and map overlay, as well as a variety of multi
criteria decision-making methods.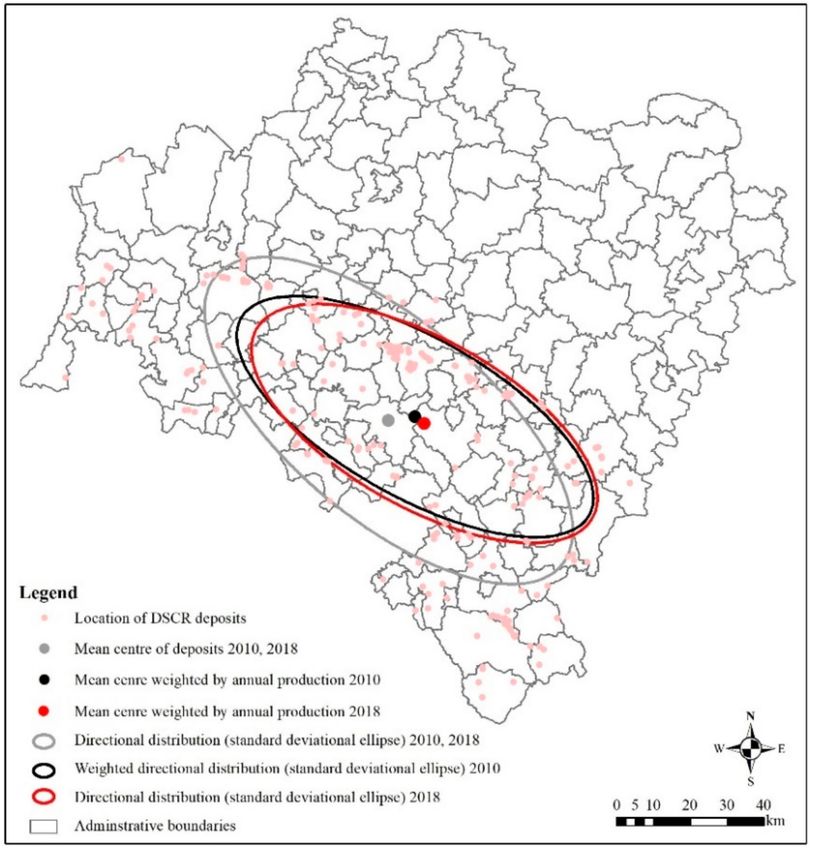
Sustainability 2020, 12, 3022                                                                       3 of 22

      Figure 1. Reserves and production of igneous and metamorphic dimension stones and crushed rocks
      in Lower Silesia and other regions of Poland, based on PGI data [11].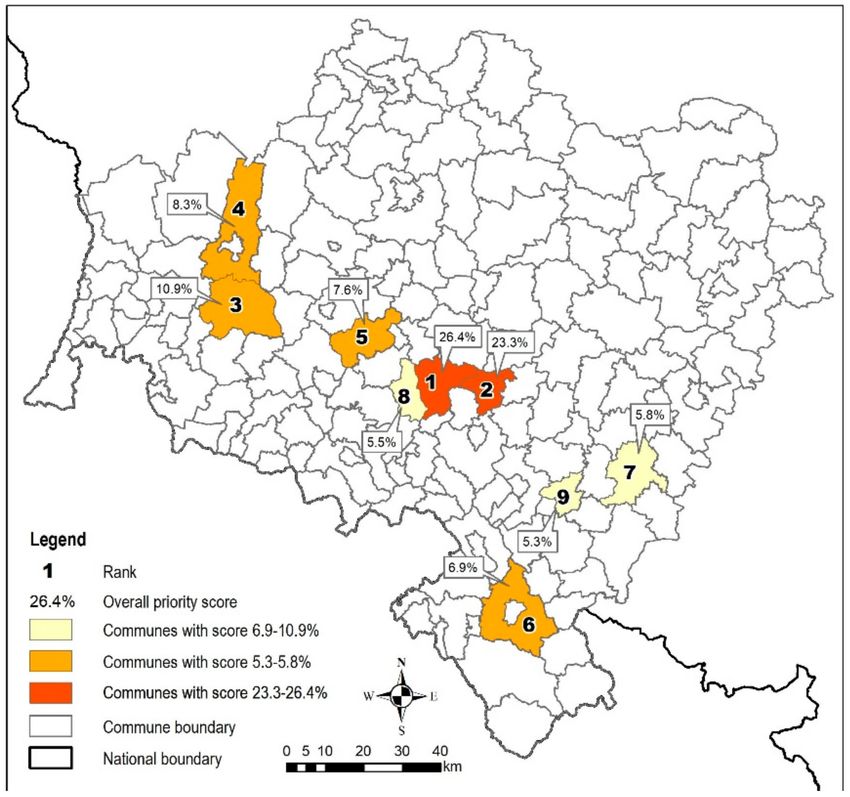
Sustainability 2020, 12, 3022 4 of 22
Table 1. The topic and methodology applied in reviewed studies related to rock raw materials quarrying and management.
Minerals Analyzed
No. Reference Methodology Subject of Research Classification of Research Subject
(Study Location)
Metamorphic rocks GIS-based analysis of cumulative
1. [13] Identification of most suitable quarry sites
(Sri Lanka) weighed indexes
Limestone and dolomite GIS-based weighted criteria Valorization and sustainable use of
2. [14] Classification of potential mining sites
(Morocco) overlay analysis deposits of rock raw materials
Aggregates (New GIS and fuzzy logic overlay of resource
3. [15] Aggregate resource opportunity modelling
Zealand) criteria maps
Limestone and dolomite Suitability of potential crushed rock resource areas
4. [16] GIS vector map overlay
(Greece) for mining
Dimension stones and
5. [17] GIS-based multicriteria analysis Assessment of deposit accessibility for potential use
crushed rocks (Poland)
LCC (Life Cycle Cost) and LCA (Life Best available concept (BAC) model for aggregate
6. [18] Aggregates (Europe)
Cycle Assessment) production and use Sustainable management of rock
Analysis of concentration of crushed raw mineral resources
7. [19] Crushed rocks (Poland) Spatial statistics and interpolation in GIS
rocks quarrying
Descriptive statistics, Monte
8. [20] Sand and gravel (USA) Estimation of regional mineral resources
Carlo simulation
Analysis of spatial distribution of crushed rocks
9. [12] Crushed rocks (Poland) Spatial statistics in GIS Transport of rock raw materials
quarrying and transport
Review of world literature on the
10. [21] Crushed rocks (World) Literature review n/a
rock raw material quarrying
AHP-TOPSIS Safety issues in rock raw
11. [22] Dimension stones (Iran) Safety ranking of quarries
MADM methods and fuzzy logic materials quarrying
Unsupervised classification of remote
12. [23] Sand and gravel (Turkey) Land use change due to open pit mining
sensing data in GIS Social and environmental impact
GIS-based spatial interpolation with Analysis and mapping of acoustic spatial variability associated with the extraction of
13. [24] Limestone (Italy)
ordinary kriging technique generated by quarrying rock raw materials
Quantification of the environmental
14. [25] Limestone (Albania) FOLCHI method
impact of mining
GIS and remote sensing-based rapid Spatial decision support to monitor and evaluate
15 [26] Sand and gravel (Oman)
impact assessment matrix (RIAM) environmental impacts of mining
16. [27] Crushed rocks (Italy) Descriptive statistics Strategies for increase of recycled aggregates use
Management of waste from the
Multi-criteria decision analysis (MCDA) Evaluation of alternative sites for sustainable
17. [28] Marble (Greece) production of rock raw materials
and GIS disposal of mining waste
Rock raw resources Assessment of economic value of active mining
18. [29] Multicriteria analysis with AHP
(Poland) waste sites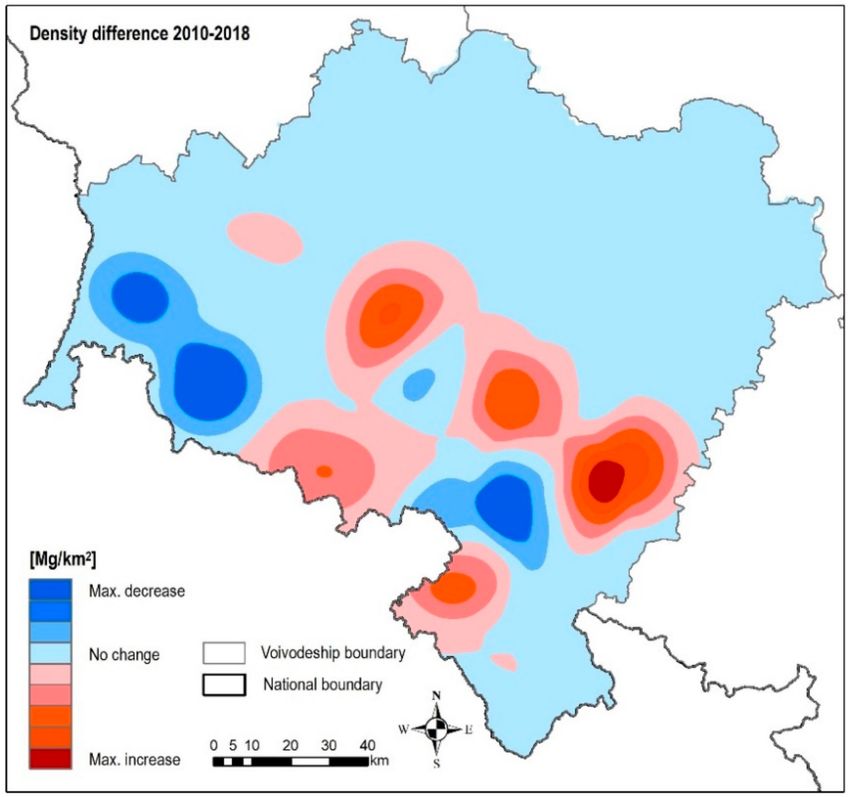
Sustainability 2020, 12, 3022 5 of 22
2. Geology and Mineral Resources of Lower Silesia
The geological structure of Lower Silesia is heterogeneous and varied. This is the result
of polyphasic geological evolution that lasted from the upper Proterozoic up to the Quaternary.
The complicated geological nature is due to the compilation of processes such as volcanism,
block deformations on the foreland of the Alpine orogen, cyclic glaciations, and sea transgressions.
The main geologic-tectonic structures run from the NW to SE and are Fore-Sudetic Monocline (in
the North of the region), Fore-Sudetic Block, and the Sudetes Mountains in the South, which are
separated from the Block with Sudetic Marginal Fault. Some studies also suggest that the latter two
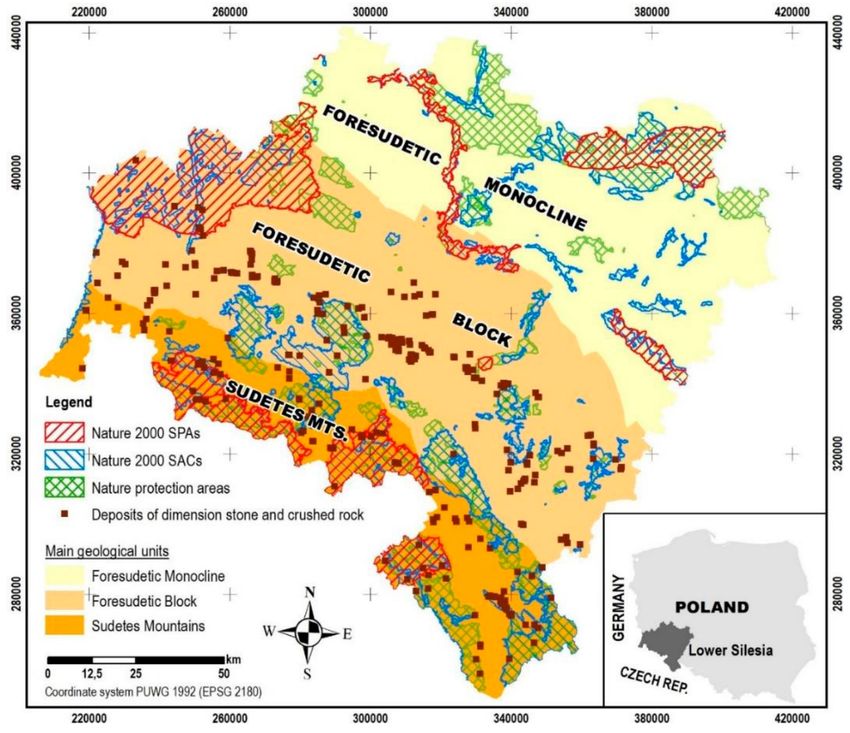
are one structure, the Sudetic Block [30]. Extent of the three main geological units has been shown
in Figure 2, together with areas of nature protection, where the abbreviation SAC stands for special
area of conservation and SPA for special protection areas designated, respectively, under the Habitats
Directive and Birds Directive, making up the network of nature protection areas in the European Union.
Figure 2. Location of dimension stones and crushed rock deposits, main geological units, and nature
protection areas in Lower Silesia. SPA denotes special protection area, SAC denotes special areas
of conservation.
The Sudetes, in terms of geology, are divided into the Eastern and the Western Sudetes.
The structure is composed of various igneous, metamorphic, and sedimentary rocks dating back to the
Precambrian to the Cenozoic. These rocks build numerous smaller tectonic units, separated by faults,
and together form a heterogenous geological surface.
The Fore-Sudetic Block consists of two structural levels. The older one is built of metamorphic
and igneous rocks dating back to the Devonian–Permian period. It is partly covered by deposits
of sedimentary rocks from the Permian to Pleistocene making up the younger structural level [31].
The unit is also characterized by heterogenous composition and numerous, secondary rock types have
been identified there, including gabbro, granite, and serpentinite massifs; metamorphic; and other
structures [32].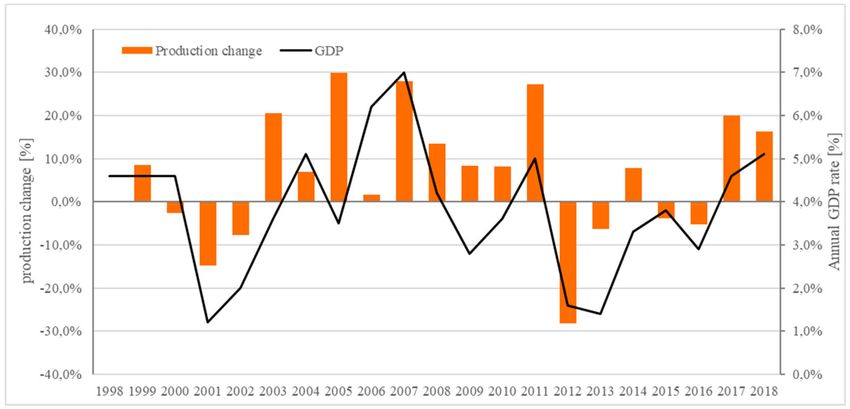
Sustainability 2020, 12, 3022                                                                         6 of 22

     The Fore-Sudetic Monocline is composed of thick layers of Permian–Mesozoic origin lying with
an unconformity on a folded Paleozoic subsurface. The Permian–Mesozoic deposits generally lie at an
angle of several degrees towards the north and northeast.
     This geological context is the reason for the rich and diversified mineral resources documented in
Lower Silesia. These include metallic minerals (e.g., copper and silver ore), energy minerals (e.g., hard
coal and lignite), and various rock minerals [10]. The region is the primary zone of dimension stones
and crushed rock of both igneous and metamorphic origin with 96% of national geological and
economic reserves [11]. The Lower Silesia has most of the national igneous rocks, such as basalt,
granite, melaphyre, and porphyry, as well as the only resources of gabbro and syenite in the country.
The same can be said about metamorphic rocks, such as the most of the amphibolies, serpentine,
hornfels, migmatite, and marble [33]. The most well-known DSCR from Lower Silesia include the
Strzelin and Strzegom granites, as well as white and green Marianna marbles [34]. The basic parameter
that distinguishes between dimension and crushed rocks is blockiness, that is, the divisibility of rocks,
which enables economically justified operation of blocks [35]. Other parameters include, for instance,
durability and the ability of the stone to hold a surface finish [36].
     Out of 231 deposits of igneous and metamorphic stones and crushed rocks in Poland, 204 have
been documented in the Lower Silesia [11]. These are located in the boundaries of Sudetes and
Fore-Sudetic Block; the Fore-Sudetic Monocline has no part in economic reserves of these rock raw
materials. The sedimentary DSCR, whose resources and production constitute 1.75% of all DSCR in
Lower Silesia, have not been focused upon in this study. Detailed statistics on the reserves of dimension
stones and crushed rocks are described in the Results section of this paper.

3. Materials and Methods
      The study utilized analysis of quantitative and spatial data with descriptive and spatial statistics
methods in GIS. For the analysis of the potential of communes for the sustainable development of
the rock raw materials industry, the analytical hierarchy process (AHP) methodology and GIS were
adopted. The analyzed data include: (i) balance sheets or mineral reserves and mineral production
published annually by the Polish Geological Institute [11,37–44], (ii) geospatial datasets with location
and extent of mineral deposits from the Polish Geological Institute database, (iii) geospatial datasets
with boundaries of administrative units from the National Office of Geodesy and Cartography database,
(iv) geospatial datasets with location of transport infrastructure and protected areas of environmental
value taken from the Institute for Territorial Development (Lower Silesia Marshal Office), (v) balance
sheets of taxes paid by mining companies in accordance with the promulgation of the Minister of
Environment regarding mining fee rates [45–51], and (vi) World Bank data on annual rate of gross
domestic product (GDP) [52].

3.1. Analysis of Dimension Stones and Crushed Rocks Production
     Descriptive statistics were used to provide summaries about the production of igneous and
metamorphic DSCR raw materials in the Lower Silesia region for the 2010–2018 period. The quantitative
summaries include tables and summary statistics, Pearson correlation coefficient test statistics, as well
as graphs.

3.2. Analysis of Spatial Distribution of Dimension Stones and Crushed Rock Production
     The methodology involved calculations of the production density, mean center, and standard
deviational ellipse (directional deviation). In the first, density of production was calculated to determine
spatial distribution and concentration of quarrying intensity in the region. The density of DSCR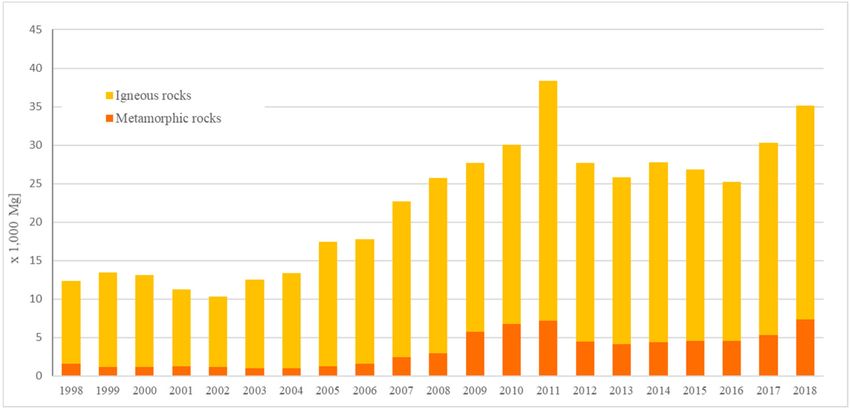
Sustainability 2020, 12, 3022 7 of 22
production was calculated with quadratic Kernel weighting function proposed by [53]. The general
formula of the function is given by Equation (1):
1 X x − xi
fλ (x) = K0 , (1)
nλ λ
where
Ko is the Kernel function;
λ is the bandwidth (smoothing parameter), which determines the width of search neighborhood.
Quadratic form of the Kernel function is given by Equation (2):
0.75 1 − t2 for |t| ≤ 1
K0 (t) = , (2)
0 otherwise
The input parameters include spatial location (x and y coordinates), population field value, and the
search radius [54]. The locations are quarries and the population field are their output (Mg). The search
radius for the size of Lower Silesia was set, as in the previous study [8], to 20,000 m. The function
calculates surface that represents volume of production per unit area (Mg/km sq). The pixel size of
output raster was set to 100 x 100 m [12]. Production density maps for 2010 and 2018 were used to
calculate production density difference with raster calculator function.
Then, primary spatial statistics measures were calculated, such as the mean center and standard
distance ellipse to quantify concentration of dimension stones and crushed rocks quarrying. The
mean center defined the mean x and y coordinates of locations in the study area, whereas standard
deviational ellipse measured the standard deviation of the features from the mean center separately
for x and y coordinates.
The mean center was calculated for two cases. The first case concerned the unweighted location
of all quarries, and the second one weighted location of all quarries, where the weight was defined as
annual production. The following formula was used:
P P
i (wi xi ) i (wi yi )
x = P , y = P (3)
i wi i wi
where
x, y are coordinates of the mean center;
xi , yi are coordinates of a given location i in the dataset;
wi is the weight of a given location (annual production).
The standard deviational ellipse was calculated for the same two cases, that is, unweighted
location of all quarries, and the second one weighted location of all quarries, where the weight was
defined as annual production. The following formula was used [55]:
s s
2
− y)2
P P
i (xi− x) i ( yi
SDx = , SD y = (4)
n n
where
SDx is the standard distance for the x axis;
SD y is the standard distance for the x axis;
n is the number of features (locations).
The weighted standard deviational ellipse was calculated in a similar way, but the squared
difference from the mean for each coordinate was multiplied by the weight value before being summed.
The greater the distance of the axes, the more the features were dispersed around the center.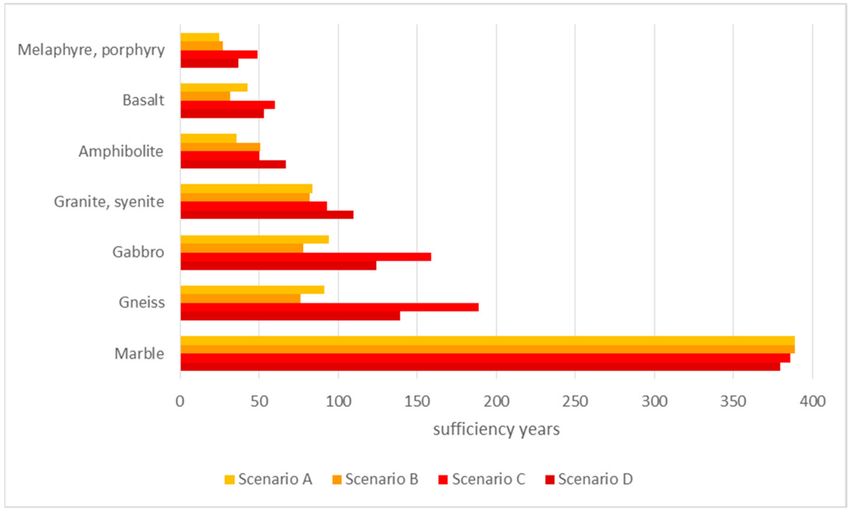
Sustainability 2020, 12, 3022                                                                         8 of 22

3.3. Analysis of Dimension Stone and Crushed Rock Available Reserves
     Available resources (named in the paper as resource sufficiency) were analyzed in the following
way. Total sufficiency for various lithological types of igneous and metamorphic dimension stones
and crushed rocks was calculated for four scenarios named A to D. Scenario A was calculated for the
production levels for last year’s data (2018), scenario B for maximum output, scenario C for minimum
output in the analyzed period, and scenario D for an average production (2010–2018). The following
formula was used to calculate a particular operation life expectancy in scenario B and to calculate
sufficiency of resources for the entire region:

                                                       Rn
                                                St =                                                     (5)
                                                       wn

    where

St is the resource sufficiency in years of the mine, n;
Rn denotes economic reserves—technically and economically extractable part of economic resources of
the mine, n;
wn is the average annual production of the mine, n.

3.4. Analysis of the Commune Potential for DSCR Mining Sector
      The next part of the study was aimed at assessing the potential of communes with DSCR deposits in
the Lower Silesia region to support and develop the rock mining sector of the economy. The selected set
of criteria were (i) undeveloped DSCR deposits, (ii) undeveloped DSCR deposits of regional or national
significance, (iii) current DSCR quarrying operations, (iv) railroad DSCR loading point infrastructure,
(v) revenue from mining taxes, and (vi) potential environmental conflicts (nature protection areas
spatially congruent with documented deposits). The potential was assessed with analytical hierarchy
process (AHP). The criteria and their weights were determined by a reference group consisting of
seven representatives of regional spatial planning (2), science (2), public administration (2), and mining
authority (1). The AHP methodology consists of the following steps [56,57]:

(a)    developing the model;
(b)    deriving weights for the criteria;
(c)    checking the consistency;
(d)    deriving local preferences for the alternatives;
(e)    deriving overall priorities and making the final judgement.

      Step (a) involves constructing a hierarchy to analyze the decision. The AHP decision model for
selecting waste for reuse is structured into a hierarchy of goal, criteria, and alternatives.
      Step (b) consists of deriving weights of the criteria, and the importance of criteria is compared
pairwise with respect to the desired goal to derive their weights.
      In step (c), check of the consistency of judgments is performed; it involves a review of the judgments
in order to ensure a reasonable level of consistency in terms of proportionality and transitivity.
      Step (d) consists of deriving the local preferences for the alternatives. Priorities for alternatives
are derived separately for each criterion following the same method as in step (b). Consistency check
is also carried out.
      In step (e), overall priorities of the alternatives are calculated, that is, the obtained alternative
preferences are combined as a weighted sum to take into account the weight of each criterion. The
alternative with the highest overall priority constitutes the best choice.
      Thus, if n is the number of analyzed criteria, then the AHP comparison procedure is as follows:

-      Constructing a n × n pairwise comparison matrix m for analyzed criteria, where aij denotes entry
       in the i row and the j column of matrix m;
Sustainability 2020, 12, 3022 9 of 22
- aij states the preference score of criterion i to criterion j using the nine-integer value scale suggested
by [58];
- Establishing a normalized pairwise comparison matrix m, the sum of each column must be equal
to 1. This can be obtained using Equation (6) to calculate aij for each entry of matrix m
aij
aij = Pn (6)
i = 1 aij
- Determining the relative weights, that is, the average across rows is computed using Equation (7);
for each element, the relative weight is within the range of 0 to 1 and a higher weight shows a
greater influence of a given element (criterion) [57]:
Pn
i = 1 aij
wi = (7)
n
A test of the degree of consistency of the derived weights was performed to check the consistency
of the experts’ judgements. It involved a calculation of the consistency ratio (CR), which indicates the
probability that the matrix values were randomly generated. According to [57], a matrix that has a
consistency ratio greater than 0.10 should be re-evaluated. The AHP calculations were performed with
the software developed by [59].
4. Results
Results of descriptive statistics regarding DSCR resources and quarrying in Lower Silesia were
compiled in the form of tables and graphs, whereas results of spatial statistics were presented as
maps. The results of multicriteria AHP analysis were presented in tables and on a map to provide the
spatial context.
4.1. Reserves and Production of Dimension Stones and Crushed Rocks
Geological and economic reserves and production of dimension stones and crushed rock raw
materials were analyzed for the 2010–2018 period. These results provide updated and extended
information and insight into the changes that have occurred in the region since the analysis described
in [12]. Table 2 presents changes of geological and economic reserves in Lower Silesian deposits
broken down into the main lithological types of igneous and metamorphic DSCR. In general, available
economic reserves in developed deposits increased in Lower Silesia (+2.7%) and, in consequence,
also in Poland (+2.5%), as the Lower Silesian reserves constitute 96% of the total. The geological
reserves, which also include reserves in currently undeveloped deposits, also increased. However, from
analyzing reserves of particular lithological types of igneous and metamorphic DSCR in Lower Silesia,
we registered a decrease of economic reserves for three groups of these rock raw materials, whereas
reserves of four groups increased. The DSCR groups with increase in economic reserves between
2010 and 2018 were amphibolite (with migmatite and serpentinite) + 59.7%, gneiss +133.7%, marble
+122,7%, and granite with syenite +3.1%. The DSCR groups with decrease of economic reserves were
basalt −8.2%, gabbro −26.9%, and melaphyre and porphyry −59.6%. The decreases indicated depletion
of reserves in operating quarries and potential need to start new mining operations in order to satisfy
demand. The decrease of economic reserves was associated with reduction of geological reserves,
in cases of basalts and melaphyre with porphyry, which indicated the fact that no new resources of
these rock raw materials were documented. In the other groups, new deposits of gneiss and marble
contributed to increasing of their geological and economic reserves, the latter of which was associated
with new quarry operations. The economic reserves of granite, which had the highest share in total
production, remained at a steady level (+3.1%), whereas geological reserves grew by 11.7%. This
subject of sufficiency of reserves is further discussed in the following sections.Sustainability 2020, 12, 3022 10 of 22
Table 2. Geological and economic reserves of igneous and metamorphic dimension stones and crushed
rocks (DSCR) in Lower Silesia and in Poland (2010 to 2018) [11,37–44].
Geological Reserves (×1000 Mg) Economic Reserves (×1000 Mg) Percentage Change (2010–2018)
2010 2018 2010 2018 Geological Economic
POLAND 5,679,273 5,874,542 2,454,688 2,515,837 3.4% 2.5%
LOWER SILESIA 5,369,959 5,592,228 2,349,981 2,413,160 4.1% 2.7%
Basalt 572,594 535,419 366,284 336,189 −6.5% −8.2%
Granite, syenite 1,820,750 2,033,310 970,170 1,000,061 11.7% 3.1%
Gabbro 512,819 527,833 367,034 268,301 2.9% −26.9%
Melaphyre, porphyry 1,083,505 1,054,534 332,090 134,278 −2.7% −59.6%
Amphibolite 1 286,425 296,844 67,258 107,429 3.6% 59.7%
Gneiss 2 667,439 685,369 145,653 340,348 2.7% 133.7%
Marble 426,427 458,919 101,492 226,005 7.6% 122.7%
1—including migmatite, serpentinite, greenstones; 2—including hornfels, metamorphic slate.
In the same period (2010–2018), the total number of documented igneous and metamorphic
DSCR deposits (Table 3) decreased by 18. Thus, the decrease of basalt, as well as melaphyre with
porphyry reserves, was accompanied by the decrease in number of deposits by −11 and −5, respectively.
The number of gabbro deposits remained unchanged, which indicated steady depletion of their
reserves. The growth of amphibolite reserves was associated with documentation of new deposits.
Table 3, in contrast to the previous study that focused on an earlier period [12], does not include
sedimentary rocks.
Table 3. Number of igneous and metamorphic DSCR deposits in Lower Silesia (2010–2018) [11,37–44].
2010 2011 2012 2013 2014 2015 2016 2017 2018 Change 2010–2018
Total 1 222 223 225 224 224 216 203 204 204 −18
Basalt 47 47 46 44 44 39 36 36 36 −11
Granite, syenite 86 86 88 88 88 86 84 85 85 −1
Gabbro 6 6 6 6 6 6 6 6 6 -
Melaphyre, porphyry 26 26 26 26 26 25 21 21 21 −5
Amphibolite 2 13 14 15 16 16 16 16 16 16 +3
Gneis 3 22 22 22 22 22 22 20 20 20 −2
Marble 22 22 22 22 22 22 20 20 20 −2
1—the total number of all DSCR in Lower Silesia in 2018, including sedimentary forms, was 258; 2—including
migmatite, serpentinite, greenstones; 3—including hornfels, metamorphic slate.
As it was mentioned earlier, Lower Silesian igneous and metamorphic dimension stones and
crushed rocks account for over 90% of the total production in Poland. The actual share for particular
lithological groups of these rock raw materials is given in Table 4. The share ranged from 75.9% for
melaphyre and porphyry group to 100% for amphibolite, migmatite, and serpentinite groups. On
the other hand, production of sedimentary DSCR in Lower Silesia accounted for just 1% to 2% of
national supply. This shows that in terms of igneous and metamorphic rock raw materials, the Lower
Silesian resources are critical for the national economy, as well as the fact that consumers have to and
are willing to pay the costs of transport to locations that are at a greater distance from the source
region. This dependence on regional sources is also visible in the time series of annual production
(Figures 3 and 4). For the purpose of this study, annual production levels were traced from as early as
1998, and were plotted together with annual change of national gross domestic product (GDP) [52].
The calculated Pearson correlation coefficient that measures the statistical relationship between two
continuous variables, that is, annual GDP change and annual change of DSCR production, was equal
r = 0.645, which indicates a strong, positive relationship. These results are further discussed later in
this paper.Sustainability 2020, 12, 3022 11 of 22
Table 4. Production of igneous and metamorphic DSCR in Lower Silesia and in Poland (2018) [11,37–44].
Lower Silesia 2018
DSCR Type Poland 2018 (×1000 Mg) Lower Silesia Share
(×1000 Mg)
Basalt 7744 1307 85.6%
Granite, syenite 11,882 184 98.5%
Gabbro 2859 108 96.4%
Melaphyre, porphyry 5291 1681 75.9%
Amphibolite 1 3016 0 100.0%
Gneiss 2 3748 70 98.2%
Marble 581 03 99.5%
Igneous and
35,121 3353 91.3%
metamorphic DSCR
1—including migmatite, serpentinite, greenstones; 2—including hornfels, metamorphic slate.
Figure 3. Production of igneous and metamorphic DSCR in Lower Silesia between 1998 and 2018 [11,37–44].
Figure 4. Year to year change of igneous and metamorphic DSCR production in Lower Silesia between
1998 and 2018 and annual GDP rate.
4.2. Spatial Distribution of Dimension Stone and Crushed Rock Production
GIS spatial statistics were used for analysis of spatial distribution of DSCR production in Lower
Silesia and its change in time allowed for identification of areas of the most intensive DSCR quarrying.
The map of difference of DSCR production density per unit area between 2010 and 2018 calculated
with Kernel density function (Figure 5) indicated areas of intensified DSCR quarrying (red colors)Sustainability 2020, 12, 3022 12 of 22
and areas of quarrying decrease (blue colors). The most intensive quarrying has taken place in the
central and south-east parts of the region, whereas peripherally, in relation to Poland, parts of the
region experienced decline in production. This was determined partly by geology and the location of
exploitable deposits (Figure 2), but the distance to demand areas could have also influenced this trend.
This observation is substantiated by results of spatial statistics calculations, that is, mean center and
standard deviational ellipse statistics (Figure 6). The mean center of quarry locations weighted by their
annual output (2010; black dot) was shifted east in comparison to the unweighted mean center of their
locations (gray dot) by approximately 9900 m, whereas the weighted mean center location of quarries
calculated for their 2018 output (red dot) was shifted further 2500 m eastwards.
Figure 5. Change of the spatial density of dimension stones and crushed rocks production, 2010–2018.
The measure of the standard deviation of the features (quarries) from the mean center, major axis
extending in the northwest–southeast direction and minor axis in the southwest–northeast direction,
is the consequence of geological settings. The change in the shape of the weighted production ellipses
(2010 and 2018) and different shape of the ellipses for the unweighted and weighted data also point
to the slight eastward shift of production and concentration (smaller x and y axes of the 2018 ellipse
compared to the 2010 ellipse) of rock raw material production.Sustainability 2020, 12, 3022 13 of 22
Figure 6. Mean center and standard deviational ellipse spatial statistics for dimension stones and
crushed rock production in Lower Silesia, 2010–2018.
4.3. Sufficiency of Dimension Stones and Crushed Rocks
The results of this analysis indicate approximately how long, in years, the economic reserves of
particular group of igneous and metamorphic rocks will last, as well as how long active quarrying
operations can continue at the output level set for given scenarios. The reserve sufficiency of a
given rock type (e.g., granite) was calculated, taking into account the total economic reserves that
are the technically and economically extractable parts of economic resources according to a national
classification [60]. Sufficiency of DSCR resources was analyzed in seven lithological groups: (1)
basalt; (2) granite, syenite; (3) gabbro; (4) melaphyre, porphyry; (5) amphibolite (including migmatite,
serpentinite and greenstones); (6) gneiss (including hornfels and metamorphic slate); and (7) marble.
The results for the four selected scenarios are presented in Table 5 and are graphically presented
in Appendix A Figure A1. Scenario A was calculated for the production levels of the last available
data (2018), scenario B for maximum recorded output, scenario C for minimum recorded output,
and scenario D for an average production (2010–2018).
Table 5. Sufficiency (in years) of igneous and metamorphic dimension stones and crushed rocks.
Dimension Stones Economic Sufficiency (Years)
and Crushed Rocks Reserves 1 (Mg)
Scenario A Scenario B Scenario C Scenario D
Basalt 336,189 43 32 60 53
Granite, syenite 1,000,061 84 82 93 110
Gabbro 268,301 94 78 159 124
Melaphyre, porphyry 134,278 25 27 49 37
Amphibolite 2 107,429 36 51 50 67
Gneiss 3 340,348 91 76 189 139
Marble 226,005 389 389 386 380
1—sourced from the Polish Geological Institute [7]; 2—including migmatite, serpentinite, greenstones; 3—including
hornfels, metamorphic slate.Sustainability 2020, 12, 3022 14 of 22
4.4. Analysis of the Commune Potential for DSCR Mining Sector
Table 6 presents the results of AHP calculations to determine weights of the six criteria proposed
and compared by the experts.
Table 6. Ranking of criteria based on weights from analytical hierarchy process (AHP) analysis.
Rank Criterion Weight (%)
1. vi. potential environmental conflicts 30.0
2. ii. undeveloped DSCR deposits of regional or national significance 27.4
3. iii. current DSCR quarrying operations 19.9
4. iv. railroad/DSCR loading point infrastructure 8.8
5. i. undeveloped DSCR deposits 7.9
6. v. revenue from mining taxes 6.0
Among these criteria, the lack of environmental conflicts with location of documented DSCR
deposits (meaning better access for development of a mining operation) was considered as the most
important factor (weight of 30.0%), with slightly higher score than the occurrence of undeveloped DSCR
deposits of regional or national significance (weight of 27.4%). Existing DSCR quarrying operations
in the area were also considered to be a strong factor (weight of 19.9%). The remaining three criteria
scored between 6.0% and 8.8%, and were considered of lesser significance by the experts. For six
criteria (n = 6), the random index (RI) was equal to 1.24 [61], and the calculated resulting consistency
ratio (CR) of the comparison matrix was 4.7%, which was below the suggested threshold value of 10%.
Each of the communes in the Lower Silesia region was assigned a value with respect to each of the
six criteria considered. The values were allocated using a 1 to 6 point scale, where 6 meant the most
favorable conditions and 1 the least favorable circumstances. When a given factor was not present in a
commune, such as for undeveloped DSCR deposits or no deposits being available due to environmental
constraints, a score of 0 was assigned and the commune was excluded from further analysis. There
were 29 communes with undeveloped DSCR deposits of national or regional importance identified in
the analysis. When these were considered further, we found that 22 of these communes had at least
1 documented DSCR deposit whose exploitation was not constrained by environmental protections
requirements. The spatial congruence of deposit and nature protection areas (environmental conflict)
was investigated with GIS map overlay analysis. Overall, nine communes meet all of the criteria
and were investigated in full. First, weighted scores for the nine communes in each of the criteria
were calculated, then weights of local preferences with respect to these criteria were determined, in
accordance with the AHP methodology described earlier. The weights of local preferences with respect
to criteria for these communes are presented in Table 7, and results of overall priority calculations
(ranking) are given in Table 8 and in Figure 7. The consistency ratios (CR) for pairwise comparisons
for alternatives with respect to criteria varied from 0.8% to 7.1% and were within the required limits
(≤ 10%). The lowest value (0.8%) was obtained for the undeveloped DSCR deposit criterion, and the
highest (7.1%) was for the railroad/DSCR loading point infrastructure criterion.Sustainability 2020, 12, 3022 15 of 22
Table 7. Weights of local preferences with respect to criteria (i–vi).
Alternatives
i. ii. iii. iv. v. vi.
(Communes)
Strzegom 0.370 0.383 0.054 0.493 0.237 0.206
Żarów 0.105 0.255 0.194 0.161 0.118 0.317
Strzelin 0.105 0.061 0.030 0.083 0.118 0.042
Niemcza 0.105 0.075 0.030 0.044 0.118 0.025
M˛ecinka 0.079 0.045 0.194 0.044 0.118 0.025
Dobromierz 0.059 0.045 0.106 0.044 0.097 0.025
Lwówek Ślaski
˛ 0.059 0.045 0.112 0.044 0.064 0.206
Kłodzko 0.059 0.045 0.026 0.044 0.064 0.129
Bolesławiec 0.059 0.045 0.256 0.044 0.064 0.025
Table 8. Results of overall priority calculations.
Rank Alternatives (Communes) Overall Priority (%)
1. Strzegom 26.4%
2. Żarów 23.3%
3. Lwówek Ślaski
˛ 10.9%
4. Bolesławiec 8.3%
5. M˛ecinka 7.6%
6. Kłodzko 6.9%
7. Strzelin 5.8%
8. Dobromierz 5.5%
9. Niemcza 5.3%
Figure 7. Map of communes with the greatest potential for development of DSCR mining sector.
5. Discussion
There is a limited number of published studies that attempt to measure spatial and temporal
patterns of rock raw material quarrying in the regional (geographical) context and that focus on
sustainable consumption and production patterns of these natural resources. The known research is
predominantly based on analysis that employed standard descriptive statistics. In the case of Lower
Silesia region, such a study has been done by Bem et al., who analyzed temporal changes of productionSustainability 2020, 12, 3022 16 of 22
for the 2009–2014 period [62], as well as by Blachowski [12]. On the other hand, Danielsen and
Kuznetsova performed a study that included statistical analysis of Norwegian aggregate industry in the
European context, for the 2007-2013 period [18]. Balletto et al. worked on strategies to increase recycled
aggregate use in Sardinia, Italy, after investigation of natural and recycled aggregates production with
descriptive statistics. A more advanced approach was used by Bliss et al., who proposed a statistical-
and Monte Carlo-based method to assess potential resources of natural aggregates in Idaho, USA [20].
The spatial context is usually taken into account in valorization of documented dimension stones
and crushed rocks deposits or rock raw materials source areas, and GIS is utilized for map overlay
of geological, social, economic, environmental, and other groups of criteria representing accessibility
and potential of rock source area for development. Such an approach has been presented, for instance,
in [13–17]. In some publications, multicriteria decision methodology is used for determining weights
of particular criteria, such approach has been applied in investigating sites for waste disposal from
rock raw material quarrying and sustainable management of mining waste, for instance, in [28,29]. GIS
has also been used to process remote sensing and field survey data related to assessment of impacts
associated with quarrying of rock raw materials, for instance, in [22–24,26]. Our study presents a
different approach in its attempt to quantify and visualize the potential spatial pattern of dimension
stone and crushed rock production and its change in time, as well as an analysis of the potential of
particular administrative areas for sustainable development of the DSCR mining sector.
5.1. Analysis of Dimension Stone and Crushed Rock Production
The initial part of our research based on the descriptive statistics approach provided information
on the general trend of dimension stone and crushed rock production. An attempt was made to correlate
change in annual production of DSCR with annual GDP rates for Poland. For the 1998–2018 period,
the calculated Pearson’s correlation coefficient (r = 0.645) indicated significant positive correlation.
Graph of annual GDP rate change and year to year production of DSCR change is presented in Figure 4.
This is in accordance with conclusions from other studies that point to direct relationship between
economic growth and demand for dimension stones and crushed rocks, as well as sand and gravel.
This demand is highly variable and correlates with economic situation of particular countries [63,64].
Worldwide demand for all types of rock raw construction materials is estimated to be rising by 4.7%
annually [18]. In the case of Lower Silesia, which is the main region of igneous and metamorphic
rock raw material production in Poland with 89.5% share in case of igneous rocks and 99.0% share of
metamorphic rocks (2018), the demand resulting from the developing economy and construction of new
infrastructure is visible in data presented in Figures 3 and 4. Large quantities of rock raw materials are
demanded by the booming road and building construction, as well as other sectors of economy. Lower
Silesia is the main provider of granite, gabbro, and basalt; practically the sole producer of amphibolite,
gneiss, and marble; and the dominant provider of melaphyre and porphyry. The highest peak in
production (2011) was associated with construction of roads, stadiums, and other infrastructure for the
European Football Championships of 2012. In 2012, a significant drop in production was recorded
(−28.1%) from 38,370 thousand Mg to 27,689 thousand Mg. Steady level of production continued for the
next 4 years, and in the 2 last analyzed years (2017, 2018) production increased year to year by +19.9%
and 16.3%, respectively. It is worth noting that the Lower Silesia share of production of all types of
DSCR raw materials, including sedimentary rocks, oscillates around 45% annually (44.1% in 2018). The
remainder is produced in three other southern regions, namely, Swietokrzyskie with approximately 30%
of production, Malopolskie with approximately 10%, and Slaskie with approximately 5% of production
(sedimentary dimension stones and crushed rocks only). Among these regions, the Swietokrzyskie
noted an increase of production in recent years [65]. Published statistical data indicate that 47.4% of
total aggregate mining in Europe that accounts for 2.7 billion Mg per year is dimension stones and
crushed rocks [64]. Poland is the seventh largest producer of DSCR among the 27 analyzed European
countries, with a 5.6% share in 2017 and 0.4% point increase in the 2013–2017 period [5]. Among theseSustainability 2020, 12, 3022 17 of 22
countries, 20 recorded increases of production occurred, most notably in Germany, Great Britain, Italy,
Norway, Spain, and Sweden.
5.2. Analysis of Spatial Distribution of Dimension Stone and Crushed Rock Production
The spatial statistics calculated in GIS were aimed at identification of potential spatial patterns and
their change in time in the Lower Silesia region. The density of DSCR production analysis, studied in [8]
for an earlier period (2006–2010), was complemented here by mean center and standard deviational
ellipses calculations. Results of both complementing approaches (Figures 5 and 6) indicated that
the weight of production shifted towards the east. The map of the production difference between
2010 and 2018 (Figure 5) showed net increase of production per unit area in DCSR source areas
located in the central and eastern parts of the region, and decrease in the peripheral western and
southern parts, whereas spatial statistics maps (Figure 6) revealed movement of the mean center of
quarry location weighted by their production. The GIS-based approach to analyze DSCR production
allowed for the identification and quantification of a possible general spatial trend, as well as providing
additional insight into the process of quarrying, for regional policy makers and administrators aiming
at sustaining balanced development of these non-renewable resources. One of the reasons for this
spatiotemporal change might be related to the attempt to reduce transport costs of rock raw materials
to other parts of the country (demand areas). Transport costs from source to demand areas are related
directly to the distance and one of the most significant final cost factors [15]. Another explanation
might include the limiting effect of environmental and land use constraints for development of existing
quarries and opening new ones in the southern parts of Lower Silesia that are characterized with a
higher percentage of nature protection sites [8,17,19]. Furthermore, the noted change in spatial pattern
might have a more complicated nature and be related to a greater extent with particular lithological
types of rocks and their source areas.
5.3. Sufficiency of Dimension Stones and Crushed Rocks
According to previous studies carried out in Poland, on the country scale, the indicator of resource
use for dimension stones and crushed rocks is equal to 32%, meaning that static sufficiency or these
resources is approximately 40 years and practical, due to resource loss, might be 20% to 30% lower [56].
On the other hand, Lewicka and Burkowicz estimated economic reserves to last for approximately
50 years at the current levels of production [7].
The share of the domestic production in meeting the demand for these rock raw materials is over
99% [62]. Therefore, in this study several (four) scenarios were analyzed to estimate, in more detail,
sufficiency of igneous and metamorphic DSCR in Lower Silesia for particular rock type groups. For
basalt, the sufficiency ranged from 32 years for peak recorded yearly production to 60 years for lowest
recorded output, with 53 years for an average production level. Sufficiency of granite reserves was
estimated at 82 to 110 years, depending on the scenario; gabbro at 78 to 159 years; and gneiss at 76 to
189 years. The reserves of melaphyre and porphyry will last for just 25 to 49 years, and amphibolite
for 36 to 67 years. Reserves of marble were the largest at the analyzed production levels (380 to
389 years). Considering the average production as the most realistic scenario that takes into account
temporal variation in demand for rock raw materials, economic reserves of one group (melaphyre
and porphyry) were found to be sufficient for less than 50 years, two groups (basalt, amphibolite)
for about 50 years, another two groups (granite, gabbro) for around 100–150 years, and gneiss and
marble rock raw materials for more than 150 years. These results indicate that analyzing sufficiency
of rock raw materials reserves as a whole, as in the above cited studies, does not give the complete
picture, and the availability of resources for the future varies with rock type and production levels
(demand) taken into consideration. For example, comparing these values with the results of the
previous study [12], new assessment indicates decrease in available melaphyre economic reserves
and increase in amphibolite reserves. All of these estimates concern economic reserves in currently
developed deposits and may change if new quarry operations are started. However, development ofSustainability 2020, 12, 3022 18 of 22
new resources may be limited due to spatial constraints [17], and regional spatial development policy
should be aware of the limited supply of these resources and be directed at enlarging the resource
base of developed and valorization of undeveloped deposits because of the role of Lower Silesia in the
supply of DSCR to the market. In addition, following the example of other regions, one should look
towards increasing the share of recycled rock raw materials [18,27] in accordance with the concept
of circular economy model [66]. As of yet, the reuse of DSCR, such as becoming a source of crushed
rocks, is limited.
5.4. Potential for DSCR Mining Sector Development
This aspect of the study was aimed at identifying local communities (commune administrative
level) that are the most recommended in order to sustain and develop the rock raw material mining
sector of the economy. The analysis was based on multicriteria AHP methodology and six criteria listed
in the results section. There were 29 communes investigated, and 9 of them were determined as having
the highest potential. They were located in different parts of the region (Figure 7), but mostly in areas
of high present-day production (Figure 5), such as communes ranked 1, 2, 7, 8, and 9 being associated
mainly with granite and syenite source areas, and communes ranked 3 and 5 with basalt. Among
the nine communes, Strzegom (1) and Żarów (2) have the highest potential for further development
of DSCR quarrying. The ranking arises from high scores obtained in the all but criterion (iii) for the
Strzegom commune and solid scores in all the criteria for the Żarów commune. The values of overall
priority calculations for the remaining seven communes are lower, and among them the following
four communes obtained the highest scores: Lwówek Ślaski, ˛ Bolesławiec, M˛ecinka, and Kłodzko.
These administrative units may also consider DSCR quarrying as a potential sector of the economy.
It must be noted that the lowest values for the cases of Strzelin, Dobromierz, and Niemcza resulted
from comparison with the other six communes and still indicate areas with high potential among the
169 communes in Lower Silesia. It must be noted that these results indicate preferences of a group of
experts representing given specializations, and that a different group could result in other values of
criteria weights and overall priority. However, the construction of AHP analysis attempts to objectify
the preferences, and other scenarios should lead to generally the same results. The CR value indicates
that there were no significant inconsistencies between the experts. It should be emphasized that more
criteria could be considered in further and more detailed analysis, such as type, size, and quality
of the documented DSCR resources. The proposed methodology is a different approach towards
assessing accessibility of rock raw material resources than the weighted criteria map overlay presented
in literature, such as that in [13–17]. These approaches could be used jointly, complementing each
other to provide more reliable identification.
6. Conclusions
The research focused on analysis and assessment of igneous and metamorphic dimension stone
and crushed rock quarrying in the Lower Silesia region, which is the chief supplier of these rock raw
materials in Poland. The share of Lower Silesia production amounted to 89.5% for igneous rocks and
99.0% for metamorphic rocks. Attention was drawn to the spatial and temporal context of DSCR
quarrying. The analyzed period covered 9 years (2010 to 2018). The proposed methodology relied on
spatial statistics measures including density and directional distribution in geographic information
systems to aid descriptive statistics usually used for such purposes. Multicriteria analytical hierarchy
process approach was used for identification of communes prospective for development of quarrying.
The proposed methodology could be used universally for other rock raw material source regions. The
main findings of the research are (i) positive correlation of rock raw material production with annual
GDP rates, and steady level of production following peak of 2011 with return to a growing trend in
2017; (ii) mapped shift of greatest intensity of quarrying in eastern direction, indicated by density
and weighted mean center functions; (iii) estimated sufficiency of seven main lithological rock groups
calculated for four scenarios of production levels that varies from less than 50 years for melaphyreSustainability 2020, 12, 3022 19 of 22
and porphyry (25–49), through approximately 50 years for basalt (32–60) and amphibolite (36–67),
approximately 100 years for granite (82–110), and over 100 year for gabbro (78–159) and gneiss (76–189)
to close to 400 years for marble (386–389); (iv) identification of local communities with greatest potential
for development of the rock raw material industry on the basis of weighted analysis of identified
factors such as occurrence of undeveloped DSCR deposits of regional or national significance, lack of
potential conflicts with environmental protection requirements, tradition of quarrying, existing DSCR
transport infrastructure, and share of mining taxes in local budgets. A multifaceted approach utilizing
descriptive and spatial statistics in GIS, as well as AHP multicriteria analysis, provided additional
insight into the scale and distribution of DSCR quarrying, including capture of the spatial context and
information, upon which sustainable management of regional rock raw materials can be addressed in
spatial policies and strategies.
Author Contributions: Conceptualization, J.B.; methodology, J.B.; software, J.B. and A.B.; validation, J.B.; formal
analysis, J.B. and A.B.; investigation, J.B. and A.B.; resources, A.B.; data curation, A.B.; writing—original draft
preparation, J.B. and A.B.; writing—review and editing, J.B.; visualization, J.B. and A.B.; supervision, J.B.; project
administration, A.B.; funding acquisition, J.B. All authors have read and agreed to the published version of
the manuscript.
Funding: The research has been partly supported by the statutory grant at the Department of Mining and Geodesy,
Faculty of Geoengineering, Mining and Geology, Wroclaw University of Science and Technology.
Acknowledgments: The authors would like to acknowledge the Institute for Territorial Development, Lower
Silesia Marshal Office for their help.
Conflicts of Interest: The authors declare no conflict of interest.
Appendix A
Figure A1. Graphical representation of reserves sufficiency for the analyzed DSCR groups for the four
analyzed scenarios.
References
1. United State Geological Survey. Available online: https://www.usgs.gov/ (accessed on 31 March 2020).
2. Kennedy, B.A. Surface Mining, 2nd ed.; Society for Mining, Metallurgy, and Exploration, Inc.: Littleton, CO,
USA, 1990.
3. Nasir, S.; Sankaran, R.; El Ghali, M.; Hosni, T.; Elzebdeh, K.; Al-Rawas, G. Geotechnical assessment of
dimension stone resources in Oman. Int. J. Chem. Environ. Biol. Sci. 2015, 3, 439–443.
4. Adinkrah-Appiah, K.; Kpamma, E.Z.; Nimo-Boakye, A.N.; Asumadu, K.T.; Obeng-Ankamah, N. Annual
Consumption of Crushed Stone Aggregates in Ghana. J. Civ. Eng. Architect. Res. 2016, 3, 1729–1737.Sustainability 2020, 12, 3022 20 of 22
5. Brown, T.J.; Idoine, N.E.; Raycraft, E.R.; Hobbs, S.F.; Shaw, R.A.; Everett, P.; Kresse, C.; Deady, E.A.; Bide, T.
World Mineral Production 2013-2017. Br. Geol. Surv. 2019.
6. Radwanek-Bak, ˛ B.; Galos, K.; Nieć, M. Pivotal, strategic and critical mineral raw materials for the Polish
economy. Geol. Rev. Przeglad ˛ Geol. 2018, 66, 153–179. (In Polish)
7. Lewicka, E.; Burkowicz, A. Assessment of the current state of coverage of the domestic economy’s demand
for mineral raw materials. Geol. Rev. Przeglad ˛ Geol. 2018, 66, 144–152. (In Polish)
8. Guzik, K.; Kot-Niewiadomska, A. Environmental constraints of dimension stones extraction in the Sudetes
and the Świ˛etokrzyskie Mountains. Bull. Miner. Energy Econ. Res. Inst. Pol. Acad. Sci. 2015, 91, 67–80,
(In Polish with English Summary).
9. Ney, R. Rock Minerals. Aggregates, 2nd ed.; Mineral and Energy Economy Research Institute: Cracow, Poland,
2007. (In Polish)
10. Characteristics of the Geological Structure of Lower Silesia. Polish Geological Institute. Available
online: https://www.pgi.gov.pl/dokumenty-przegladarka/oddzial-dolnoslaski/959-budowa-dolnego-slaska/
file.html (accessed on 21 March 2019).
11. Balance of the Mineral Resources and Underground Waters of Poland (2018). Polish Geological Institute.
Available online: http://geoportal.pgi.gov.pl/surowce (accessed on 11 February 2020).
12. Blachowski, J. Spatial analysis of the mining and transport of rock minerals (aggregates) in the context of
regional development. Environ. Earth Sci. 2014, 71, 1327–1338. [CrossRef]
13. Premasiri, H.M.R.; Dahanayake, T. Development of GIS based model for locating sustainable construction
aggregate mining sites: Case study from Sri Lanka. In Proceedings of the Asian Conference on Remote
Sensing 2018, Kuala Lumpur, Malaysia, 15–19 October 2018.
14. Barakat, A.; Ouargaf, Z.; Touhami, F. Identification of potential areas hosting aggregate resources using GIS
method: A case study of Tadla-Azilal Region, Morocco. Environ. Earth Sci. 2016, 75. [CrossRef]
15. Hill, M.P. Aggregate opportunity modelling: Understanding our resource and planning for the future.
In Proceedings of the AusIMM NZ Branch Conference 2018, Tauranga, New Zealand, 17–18 September 2018.
16. Karakaş, A. Defining the suitability of new crushed rock aggregate source areas in the North of Kocaeli
Province using GIS. Bull. Eng. Geol. Environ. 2013, 73. [CrossRef]
17. Górniak-Zimroz, J.; Pactwa, K. Dimension and crushed stones extraction as a source of social and
environmental conflicts in Poland. Minerals 2018, 8, 453. [CrossRef]
18. Danielsen, S.W.; Kuznetsova, E. Resource management and a Best Available Concept for aggregate
sustainability. Geol. Soc. Lond. Spec. Publ. 2016, 416, 59–70. [CrossRef]
19. Blachowski, J. GIS-based spatial assessment of rock minerals mining -a case study of the Lower Silesia
Region (SW Poland). Min. Sci. Miner. Aggreg. 2015, 22, 7–22.
20. Bliss, J.D.; Moyle, P.R.; Bolm, K.S. Statistical, economic and other tools for assessing natural aggregate.
Eng. Geol. Environ. 2003, 62, 71–75. [CrossRef]
21. Monteneiro, N.; Neto, J.; da Silva, E. Bibliometric study of the crushed stone mining sector. Miner. Process.
Extr. Metall. Rev. 2018, 39, 1–15.
22. Yari, M.; Bagherpour, R.; Almasi, N. An approach to the evaluation and classification of dimensional stone
quarries with an emphasis on safety parameters. Min. Geol. Pet. Eng. Bull. 2016, 31, 15–26. [CrossRef]
23. Ozcan, A.; Musaoglu, N.; Seker, D. Environmental impact analysis of quarrying activities established on and
near a river bed by using remotely sensed data. Fresenius Environ. Bull. 2012, 21, 3147–3153.
24. Lippiello, D.; Degan, G.A.; Pinzari, M. Comparison of Stochastic and Deterministic Methods for Mapping
Environmental Noise from Opencast Quarries. Am. J. Environ. Sci. 2016, 12, 68–76. [CrossRef]
25. Thanas, J.; Bode, A.; Hoxha, E.; Adam, K. Application of the folchi method in the limestone quarry to quantify
the environmental impact: (Case study). Int. J. Sci. Res. 2018, 7, 811–817.
26. Al-Awadhi, T.; Al-Saqri, A.; Amr, E.S. Environmental impact assessment of quarries and crushers in Ali-Abiad
village, Southern Al-Batina Governorate, Sultanate of Oman. In Proceedings of the 34th Asian Conference
on Remote Sensing 2013, Bali, Indonesia, 20–24 October 2013.
27. Balletto, G.; Mei, G.; Garou, C. Relationship between quarry activity and municipal spatial planning:
A possible mediation for the case of Sardinia, Italy. Sustainability 2015, 7, 16148–16163. [CrossRef]
28. Dimopoulou, E.; Tolidis, K.; Orfanoudakis, Y.; Adam, K. Spatial multi-criteria decision analysis for site
selection of sustainable stone waste disposal. Fresenius Environ. Bull. 2013, 22, 2022–2026.You can also read