D2.10 Collection of Environmental Data Report - PowerKite ...
←
→
Page content transcription
If your browser does not render page correctly, please read the page content below
Ref. Ares(2018)3472138 - 29/06/2018

                                      Power Take-Off System for a Subsea Tidal Kite

                                  D2.10
            }Collection of Environmental
                             Data Report

     Deliverable   Lead Beneficiary     Type     Dissemination Due         Delivery
     number                                      level         date        date
     D2.10         QUB                  Other    PU            M30         M30

     Editor        Per Salomonsson
     Authors       Louise Kregting
                   Pal Schmitt
                   Lilian Lieber
                   Ross Culoch
                   Nicholas Horne
                   Dave Smyth

Powerkite                         Horizon 2020/RIA           Contract number: 654438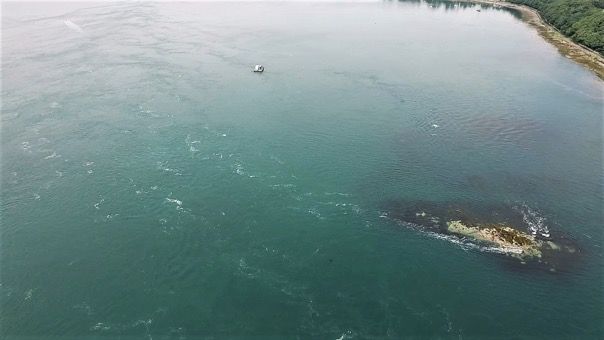
} D2.10         Collection of Environmental Data Report

Document history

    Kregting,   Version Author                    Beneficiary   Date       Comment
    Louise
                1         Kregting, Louise        QUB           2018-06-   Draft 1
                                                                01
                2         Kregting, Louise        QUB           2018-06-   Draft 2
                                                                26
                3         Kregting, Louise        QUB           2018-06-   Final
                                                                29

}                                                                                    1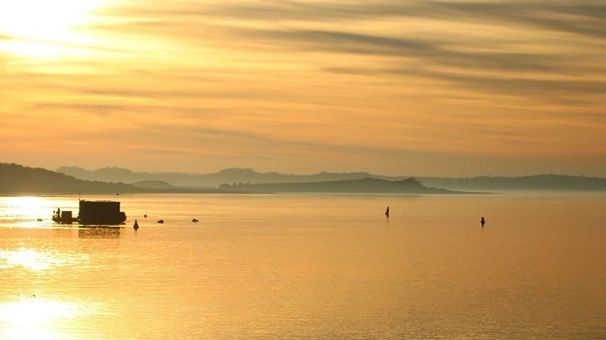
} D2.10               Collection of Environmental Data Report

Content
DOCUMENT HISTORY............................................................................................................................................................... 1
CONTENT .................................................................................................................................................................................. 2
INTERNAL APPROVAL ............................................................................................................................................................... 3
ABBREVIATIONS/ACRONYMS................................................................................................................................................... 4
1. EXECUTIVE SUMMARY ..................................................................................................................................................... 5
2. BACKGROUND AND SCOPE .......................................................................................................................................... 6
3. COLLECTION OF ENVIRONMENTAL DATA .................................................................................................................. 7
  3.1     NOISE MEASUREMENTS ......................................................................................................................................... 7
     3.1.1 ENVIRONMENTAL AMBIENT NOISE ................................................................................................................ 7
     3.1.2 PTO NOISE ....................................................................................................................................................... 9
     3.1.3 NOISE DATA COLLECTION SUMMARY ......................................................................................................... 10
  3.2     COLLISION RISK MODEL (CRM) ....................................................................................................................... 10
     3.2.1 DEVELOPING THE PARAMETERS FOR THE CRM ......................................................................................... 10
     3.2.2 MODEL COMPONENTS FOR POPULATION-LEVEL ASSESSMENT ................................................................. 12
     3.2.3 COLLISION RISK MODEL DEVELOPMENT SUMMARY .................................................................................. 12
  3.3     SONAR SYSTEM DEVELOPMENT ......................................................................................................................... 13
     3.3.1 SONAR SYSTEM DEVELOPMENT SUMMARY .................................................................................................. 17
  3.4     BENTHIC SURVEY ................................................................................................................................................ 17
     3.4.1 METHODS ....................................................................................................................................................... 18
     3.4.2 BENTHIC DATA COLLECTION SUMMARY .................................................................................................... 20
4. CONCLUSION ............................................................................................................................................................... 21
5. REFERENCES................................................................................................................................................................... 22

}                                                                                                                                                                                         2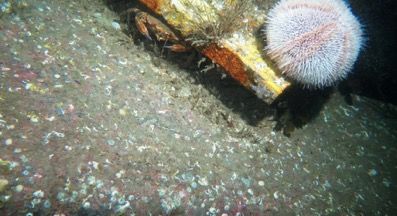
D2.IO     Collection of Environmental Data Report

Coordinator signature
                                  .-
                     Digitalt signerad av Salomonsson,
Salomonsson,         Per
                     DN: cn=Salomonsson, Per,
                     ou=Users
    Per              Datum: 2018.06.29 16:34:11
                     +02'00'
Name                                                     Company   Date

Per Salomonsson                                          Midroc    29/06/2018

Reviewer signature

                                                         Company   Date

Neil Laughlin

 powerki7
                                                                                3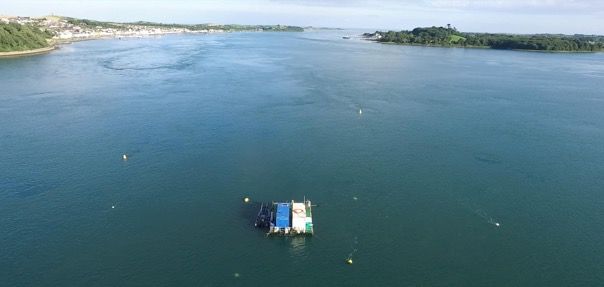
} D2.10   Collection of Environmental Data Report

Abbreviations/Acronyms
ADCP        Acoustic Doppler Current Profiler

CAD         Computer Aided Design

CRM         Collision Risk Model

DAERA       Department of Agriculture, Environment and Rural Affairs

GPS         Global Positioning System

JNCC        Joint Nature Conservation Committee

MMO         Marine Mammal Observer

MRE         Marine Renewable Energy

PTO         Power Take-Off

QUB         Queen’s University Belfast

TEC         Tidal Energy Converter

}                                                                      4
} D2.10      Collection of Environmental Data Report

1. Executive summary
This report is a deliverable of the Powerkite project, a Horizon 2020 project funded by the European Union’s
Horizon 2020 research and innovation programme. The Powerkite project will design, build and deploy a power
take-off system (PTO) for the novel tidal energy concept, Deep Green referred to in this document as the ‘kite’.

The environmental monitoring report is a continuation of D2.4 and describes the methodology of the
environmental data collected during the project. The report details information on the approaches taken to
collect noise data, model the Collision Risk Model (CRM), development of the Sonar System to understand animal
movement as well as carrying out the benthic survey.

Collection of the natural noise data included using two state of the art calibrated high frequency soundtrap
hydrophones deployed next to the Narrows, Strangford Lough, Northern Ireland, for a two weeks during
summer (18th to 29th July 2016) and two weeks during winter (23rd January to 6th February 2017). The noise data
was collected at the two locations in winter and summer in order to capture the seasonal variation in ambient
and anthropogenic noise in the Narrows. To assess the ambient noise and kite noise, a calibrated hydrophone
was connected to a leaded 2m rope that was suspended from a surface buoy, in order to carry out drift profiles.
Sound measurement sampling profiles included:

     •    Drifts throughout the channel with no device (control)
     •    Drifts over the kite flying from the testing platform
     •    Drifts over the kite flying from the seabed

A Collision Risk Model (CRM) has been developed with the initial study using FreeCAD (freecadweb.org), which
has now been translated into alternative software called Blender (blender.org) that will allow for a more robust
approach to running simulations at less computational cost (e.g. angles of approach).

Using three Kongsberg Mesotech M3 multibeam sonar heads, optimisation of this system (mounting
configurations and orientations) was undertaken and documented to evaluate fine-scale (10s of meters)
interactions of seals and other large, mobile marine fauna with the kite. To develop an autonomous observation
system that can eventually detect, track and differentiate marine megafauna from other high-intensity targets in
the water column (e.g. debris, turbulent features), an automated software (M³ Track) is currently being developed
in close collaboration with the sonar manufacturer Kongbserg. While developed/written in the Matlab
(MathWorks) programming environment, this is now a more user-friendly, stand-alone software to be run
alongside the generic M3 software, producing log files of animal two- or three-dimensional positions (x,y,z)
underwater from which tracks, trajectories and relative speeds can be extracted.

Benthic surveys have been undertaken
in order to assess the ecological
composition of the Minesto site and
two controls prior to installation and 5
years later. A compass rose transect
methodology was employed at all sites
and images were analysed using Coral
Point Count© software with the
Microsoft Excel© extension (CPCe©)
where 100 random points were
overlaid onto each individual image
taken underwater. The imagery
overlay points act as non-biased
observation markers from which                                                      Photo credit: Lilian Lieber
quantitative    data     on      benthic
disturbance could be assessed.

This is the final environmental monitoring report due M30 from WP2 with the analysis and final results provided
in the Environmental Impact Report (D6.2) due M36.

}                                                                                                           5
} D2.10      Collection of Environmental Data Report

2. Background and scope
While there is understandably great concern of the environmental impacts of tidal energy converters on marine
life, there are in fact very few field observations of interactions between marine animals and these devices. This
data gap is reflected in the very few full-scale operational turbines currently in existence. The few field-based
quantitative studies available on for example, collision risk, have been on fish and have been for fixed horizontal
axis turbines that were either limited or not in operation at the time of the observations (Broadhurst & Barr
2011, Hammar et al. 2013). Having access to the kite, a quarter-scale prototype tidal energy converter in
Strangford Lough, Northern Ireland has provided us with the opportunity to gather environmental data during
periods where the kite was operational, in order to make predictions on the potential risk that such energy
devices may pose on the environment.

This project therefore provided us with a unique opportunity to gather data from a working prototype tidal
energy converter (TEC) in realistic flow environments and to identify and report on the issues and challenges
associated with collecting data in these highly energetic environments. Monitoring the noise of TECs and gaining
a better understanding of the collision risk posed to marine animals, such as marine mammals, diving seabirds,
basking sharks, turtles or teleost fish with tidal turbine devices is considered one of the key challenges when
determining the potential environmental impacts of marine renewable devices. The challenges arise owing to a
highly dynamic environment in terms of high flow velocities, associated turbulence, and generally low visibility.

Unlike other horizontal axis turbines, the entire kite is ‘dynamic’ as the only static component of the device is
the mooring located near the seabed, with both the tether and kite continuously moving through the water
column (Fig. 1a & b). Any work that is carried out therefore needs to consider the movement of the entire
structure which occupies a volume of water considerably larger than horizontal axis turbines.

The overall objective of the environmental work package is to assess the environmental interactions of the kite.
The aim of D2.10 is to report on the methodology of environmental data collected during the Powerkite project
to M30 and is a continuation from D2.4. This report will be followed up with the final Environmental Impact
Report on the results due in month 36 (D6.2)

    a                                           b

                                                                               Image credit: Minesto

Figure 1. The components of the kite (a) and the figure-of-eight trajectory of the kite underwater(b).

}                                                                                                           6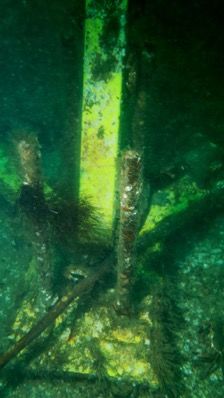
} D2.10      Collection of Environmental Data Report

3. Collection of environmental data
This section focuses on the methodology used to collect the environmental data in order to assess the kite’s
influence on and the interaction with, the marine environment. The particular aspects of the environment that
this work package has focused on include: noise, collision risk of animals with the device and determining the
influence of the kite on benthic communities within the vicinity of the operational area.

                                                                              Photo credit: Alex Nimmo-Smith

Figure 2. Minesto’s site in the Narrows, Strangford Lough, Northern Ireland

3.1 Noise measurements
Two separate noise studies were carried out in order to meet the deliverable aims of D2.10, collection of noise
data for the Powerkite project. The first study investigated the background (ambient) noise in the environment
to provide a baseline to determine the natural variability of noise in an operational flow environment. The second
study carried out was to understand the noise emitted by the PTO system in operating field conditions.

3.1.1           Environmental ambient noise
As pointed out in Annex IV (Copping et al. 2016), sound, including natural variability as well as sound emitted by
the device, in high tidal flow environments has been poorly studied. This simply reflects the difficulty of noise
measurements in highly energetic environments; also owing to the added complexity of noise generated from
the turbulence advected over the hydrophones (often referred to as pseudo-noise), with no suitable solution
found, to date.

Noise in the marine environment in general is a result of numerous physical, biological and anthropogenic sources
such as turbulence, sediment transport and boulder movement, marine organisms and boat traffic. The physical
and biological ‘noises’ may be termed ambient noise which is classified as broadband as it is composed of a range
of frequencies over the entire frequency spectrum. The Narrows (Fig. 3) reaches velocities in excess of 3.5 m/s
(Kregting & Elsaesser 2014) with visible turbulence during ebb and flood tides, and has a highly spatially
heterogeneous flow regime (Savidge et al. 2014). The Narrows is therefore presumed to be a biologically noisy
environment; however, quantification of this noise is still required.

}                                                                                                          7
} D2.10     Collection of Environmental Data Report

                                                                        Narrows

            Narrows

Figure 3. Map of Strangford Lough, Northern Ireland (a) and locations of hydrophone deployments, H1 and H2
(b) located near the main channel of The Narrows and in the vicinity of the kite.

In order to measure ambient noise in The Narrows in the vicinity of the kite, two calibrated high frequency
SoundTrap hydrophones (ST 300 HF, Ocean Instruments New Zealand) were deployed for two weeks during
summer (18th to 29th July 2016) and two weeks during winter (23rd January to 6th February 2017), each with an
acoustic doppler current profiler (2 MHz Nortek Aquadopp® Profiler) (Fig. 4) to record noise (hydrophone) and
flow velocity (Aquadopp) simultaneously to establish the correlation between flow rate and noise. The locations
were selected based on depth (between 10 – 15 m) and flow velocities, which were extracted from the Strangford
Lough model (Kregting & Elsaesser 2014). The prior stipulation was that maximum velocity did not exceed 0.4
m/s during spring tide, so as to reduce noise over the hydrophones, but that the sites were as close to the main
channel of The Narrows as possible. Based on bathymetry and flow velocity data, H1 and H2 were chosen for
the deployment of the hydrophones (Fig. 3).

                                                          Photo credit: Louise Kregting

Figure 4. Frame with 2 MHz Aquadopp® (Nortek) and hydrophone (Ocean Instruments) deployed at H1 (Fig.
3b)

}                                                                                                        8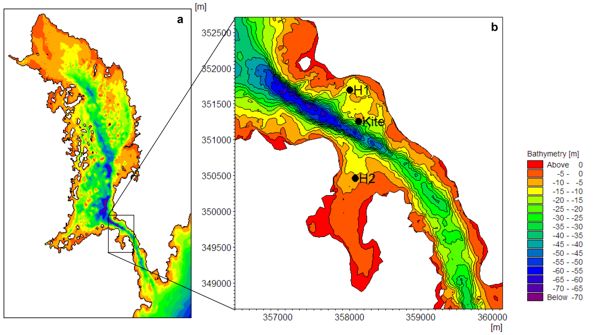
} D2.10      Collection of Environmental Data Report

The instruments were deployed at the two locations in winter and summer in order to capture the seasonal
variation in ambient and anthropogenic noise in The Narrows. It is expected that biological activity from animals
such as fish and shrimps will be maximal in summer, and minimal in winter, when animals migrate to the Irish Sea
outside of the Lough. The same principle is applied to boating activity which is high in the summertime and low
in the winter except for the Strangford Ferry Service which operates daily between 7:30 to 22:45 crossing The
Narrows between Portaferry and Strangford every 15 min, approximately 2 km from the kite.

3.1.2           PTO noise
During the same timeframe as the deployment of the underwater hydrophones in summer and winter, intensive
acoustic monitoring of the kite was carried out. A calibrated SoundTrap hydrophone was also used for the
following measurements. The hydrophone was connected to a leaded 2m rope that was suspended from a surface
buoy, in order to carry out drift profiles.

Sound measurement sampling profiles included:
    • Drifts throughout the channel with no device (control)
    • Drifts over the kite flying from the testing platform
    • Drifts over the kite flying from the seabed

For the control drifts, the hydrophone was placed into the main channel near the location of the kite (Fig. 3b)
and allowed to drift for approximately 2 km with the currents on both ebb and flood tides. This was to (i) assess
the ambient noise (ii) assess the audibility of the Strangford ferry. Analysis of the noise data indicates that during
the ebb tide when Minesto is testing the kite, the ferry noise is not detectable at the location of the kite.

During the kite trials mounted from the testing platform, the hydrophone was placed into the water and allowed
to drift 50 m with the current flow from the testing platform (Fig. 5). This method of deployment was repeated
at different locations across the width of the testing platform to get noise measurements off to the side of the
kite as well as directly above it to allow a controlled positioning of the hydrophone in the proximity of the kite.
In order to assess the noise radiation of the kite during the testing platform mounted kite trials, drift
measurements were collected beginning approximately 1 km upstream of the kite, letting the hydrophone drift
past the testing platform before collecting the hydrophone 1 km downstream of the kite. To determine distances
that the hydrophone travelled, a Global Positioning System (GPS) was fixed on the floating buoy to provide
readings at the start, during, and at the end of each drift.

                                                              Photo credit: Cecilia Zambrano

Figure 5. Hydrophone deployed from the testing platform.

Similar to the testing platform mounted kite trials, when the kite was being flown from the seafloor, the
hydrophone measurement began approximately 1 km upstream of the device and was collected approximately
1 km downstream of the device. Hydrophone positions were again noted using a GPS.

}                                                                                                              9
} D2.10 Collection of Environmental Data Report Each kite trial was never the same owing to changes in factors such as flight path settings, turbine PTO system as well as flow velocities continually changing. Therefore, data from Minesto on the flow velocities and the kite configuration during the noise measurement will be used to assess the noise emitted by the PTO system and how this may change under different environmental conditions and with the different configurations of the PTO system. 3.1.3 Noise data collection summary All data required to carry out the assessment of the noise of the kite and environment has been collected. There are currently two manuscripts in preparation and the results will be highlighted in D6.2 (M36). 3.2 Collision risk model (CRM) Possibly the greatest concern regarding the infrastructure of marine renewable energy (MRE) devices in the environment is the collision risk with an animal and, as a consequence, this is a primary concern for consenting, permitting and licensing of tidal developments (Copping et al. 2016). While there have been no known collisions observed or recorded with the few prototypes currently in existence, there is still a great uncertainty (Hutchison & Copping, 2016). This uncertainty is primarily due to the limitation in research on collision owing to the few working MRE devices in existence or because the device is shutdown during operation if a ‘target’ is observed within the vicinity of the device, as was the case for SeaGen (Royal Haskoning 2012) and is the case for the kite in Strangford Lough under the current license. The concern of an animal colliding with the kite is paramount in Strangford Lough, which is a Special Area of Conservation, with harbour seals (Phoca vitulina) listed as a qualifying feature. Currently, to meet the environmental requirements for field testing the kite in Strangford Lough, Minesto must ensure that marine mammal observations by a trained MMO (marine mammal observer) are undertaken whilst the kite is operational. This is costly and it is widely acknowledged that MMOs can only observe animals that are close to or at the surface. While direct observations of animal movements and behaviour in the vicinity of devices is considered the best method to evaluate the risk (ABPmer 2010), the highly turbid waters make visual observations under the water logistically impossible. Consequently, in an effort to quantify the probability of collision risk in such a challenging environment, the use of CRMs has become commonplace. In order to inform the CRM, a variety of components are required, including: population dynamics, animal movement and specific information on the tidal device (e.g. rotor swept area, rotational speed). The more information used and the more accurate that information is, the better the model will be at predicting collision risk. This section focuses on the development of the CRM for the kite, using the harbour seal as the test case; this is based on the model framework developed by Hammar et al. (2015), which is a generic fault tree based probabilistic model. 3.2.1 Developing the parameters for the CRM CRMs for standard horizontal axis tidal turbines are often based on simplified representations in a two dimensional domain covering the swept area. However, the equivalent model for a subsea kite must take into account the complex interaction between the kite and animal motion in time and space. This has been the starting point for the CRM. A fully three dimensional, transient model of the kite and animal shape has been developed in freeCAD (freecadweb.org), an open-source Computer Aided Design (CAD) engine; full details of the development of the CRM has been published in Schmitt et al. 2017, including the code required to run the CRM. Briefly, the kite follows a prescribed motion (Fig. 6) and objects representing the fauna to be investigated can be released at predefined positions upstream. Simulations are then run and collisions between the kite, tether and animal are recorded (Fig. 6). By varying numerous parameters like animal size, initial position, shape, kite speed and flight trajectory the probability of a collision, and the sensitivity to variation in these parameters, can be assessed. Essentially it is a 4D Model, as time is also incorporated. } 10
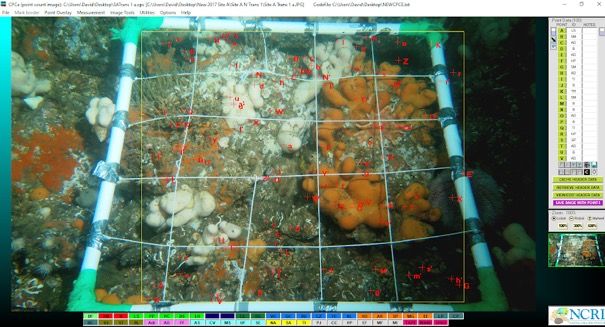
} D2.10      Collection of Environmental Data Report

Figure 6. Schematic illustration of the tidal kite (yellow), tether (green) and flightpath (dashed line) with main
variables as defined in Table 1 and coordinate system as used in the simulations. The grey elliptic symbol
represents the animal under risk of collision. The foundation is located at the origin. From Schmitt et al. 2017.

With initial runs in FreeCAD outputs, flexibility and simulation speeds were limited. Consequently, the
development of the CRM has continued with translation into alternative software, Blender (blender.org), which
can provide additional outputs, such as relative velocity of a collision. This has also improved simulation speeds
(i.e. computational processing time has been greatly reduced). Continued development in this framework will
enable increased flexibility of inputs and outputs.

Empirical data can be easily used within this system to improve the realism of the simulations and we can use
published information and existing data on harbour seal behaviour and ecology, such as seal length, swim speed
and dive profile. For example, from published studies using telemetry devices we know that harbor seals in
Strangford Lough tend to spend less time in the mid-section of the water column, often refered to as a ‘U-shaped’
dive (Fig. 7). Therefore, the probability of collision is not uniform across water depth; this will be factored in to
the CRM. Using these simulated data sets, we will run a large number of iterations to obtain confidence intervals
for collision.

The long-term aims are to create a dynamic and useful tool for use in Environmental Impact Assessments to
improve collision estimates.

}                                                                                                           11
} D2.10                              Collection of Environmental Data Report

                                                                                                         Time Spent (Sec)

                                                                                                0   10   20           30    40   50

                                                                                           0
                                                                                           5
                                     20

                                                                                                                                      Harbour seal dive profile
          Depth from sea floor (m)

                                                                         Water Depth (m)
                                     15

                                                                                           10

                                     10
                                                                                           15

                                      5

                                      0
                                                                                           20

                                          0.0      0.1      0.2    0.3
                                                Proportion of Time

Figure 7. Simulated harbour seal dive profile for Strangford Lough. Several studies have shown that harbour seals
have a ‘U-shaped’ dive profile (Wood et al., 2016; Zydlewski et al., 2016), spending more time closer to the
surface and the sea floor. At the test site in Strangford Lough, the water depth is ca. 20 m.

3.2.2                                     Model components for population-level assessment
Where published studies are extremely useful for providing general aspects of harbour seal ecology and
behaviour, some aspects of the model will benefit greatly from site specific information. In particular, information
on the population dynamics (e.g. numbers, birth rates) is extremely important for informing the CRM and when
extrapolating the model output to the population-level. For example, as a hypotheticalscenario, should the CRM
suggest that one seal per year collides with the device, we need to be able to assess whether or not this will be
detrimental to the population.

The National Trust (UK Conservation Charity) and the Department of Agriculture, Environment and Rural
Affairs (DAERA) of Northern Ireland have conducted seal counts at 26 haul out sites within Strangford Lough at
regular (typically monthly) intervals since 1992. These data include targeted counts during the harbour seal
breeding season and moulting period. Consequently, these data will be extremely valuable for quantifying several
aspects of the population dynamics in relation to the input and output parameters from the CRM. As such, we
are currently working with the National Trust (who, since 2016, are now solely responsible for the seal counts
within Strangford Lough) and DAERA, with the aim of incorporating these data into the final CRM.

3.2.3                                     Collision Risk Model development summary
The development of the CRM will be ongoing to the end of the project, which has been extended to M36. A fully
three dimensional, transient model of the kite and animal shape has been developed and published in Schmitt et
al. 2017. The second publication in preparation will use exising data on harbour seal behaviour and ecology, such
as seal length, swim speed and dive profile of which the results will be highlighted in D6.2 (M36) and the
information has been presented at three conferences (below). It is anticipated that real data on movement
behaviour of animals, such as seals, captured by the three M3 sonar heads can be used to provide Minesto

}                                                                                                                                     12
} D2.10 Collection of Environmental Data Report
information on the collision risk (potential evasion behaviour) of the ¼ scale device and any further ongoing
developments in years to come.
Conference presentations:
Culloch R, Schmitt P, Lieber L, Kregting L. Integrating empirical data with probability distributions from a
numerical 4-D model to assess marine mammal collision risk with a novel marine renewable energy device.
European Cetatcean Society, Denmark, 2017.
Schmitt P, Culloch R, Lieber L, Kregting L. A numerical 4D Collision Risk Model. European Geosciences Union,
Austria, 2017.
Culloch R, Schmitt P, Horne, N, Lieber L, Molander S, Hammar , Kregting L .Integrating empirical data with
probability distributions from a numerical 4-D model to assess marine mammal collision risk with marine
renewable energy devices. Environmental Interactions of Marine Renewables, Orkney, April 2018.
3.3 Sonar system development
Hydroacoustic methods have emerged as a powerful tool for the environmental monitoring of MRE devices.
Using imaging multibeam sonar systems, mobile marine vertebrates (marine mammals, fish and diving seabirds)
can be detected and tracked in real time, allowing for the collection of near-field, ecologically relevant data that
can be used in the CRM. Moving away from manned operations, self-contained high-frequency multibeam sonar
systems allow autonomous, subsurface monitoring of MRE installations for longer time scales (weeks to months)
and can be operated in areas in which traditional boat surveys are less effective (i.e. fast flows). Tidal MRE devices
are naturally installed in extremely energetic, acoustically noisy environments and tidal streams continue to pose
a challenge to meaningful acoustic data collection, analysis and interpretation; i.e. the extraction of biological
targets from turbulence.
Photo credit: Alex Nimmo-Smith
Figure 8. Minesto’s site in The Narrows tidal channel with a M3 multibeam sonar swath set to 50m range mounted
from Minesto’s barge (insert), for scale visualisation of the hydroacoustic monitoring approach.
The specific objective of the sonar development and acoustic monitoring approach undertaken here is to obtain
subsurface data to better understand collision risk between the kite and mobile marine fauna. The overall aim is
} 13} D2.10 Collection of Environmental Data Report
to understand the spatio-temporal variability in seal and fish presence around Minesto’s site (Fig. 8), and how it
corresponds to fine-scale changes in hydrodynamics (e.g. velocity, shear, turbulence, and back-eddies). Near-field
data on animal movement, depth and trajectories, including possible evasive behaviour, can provide site-specific,
ecological data to be used in the CRM (see section 3.2).
Minesto purchased three Kongsberg Mesotech M3 multibeam sonar heads to evaluate fine-scale (10s of meters)
interactions of seals and marine megafauna with the kite (Fig. 9). In order to better understand the hydrodynamic
processes driving seal passes and water column usage at the site, current velocities and tidally driven
oceanographic features are concurrently collated at the same spatio-temporal scale using Acoustic Doppler
current profilers (ADCPs) (Fig. 9).
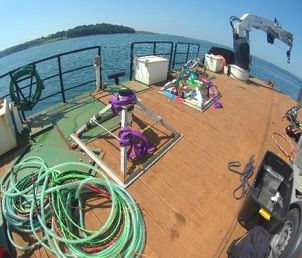
Photo credit: Lilian Lieber
Photo credit: Lilian Lieber
Figure 9. ADCP and sonar frame prior to a seabed deployment (left) and close-up of RDI’s 5-beam sentinel V50
ADCP for long-term deployments (right).
The M3 multibeam sonar operates at a 500kHz frequency and ensonifies a horizontal swath (with up to 256
beams) of either 120° (Imaging mode) or 140° (EIQ; Enhanced Image Quality) with a fan angular resolution of
1.6° (0.95° EIQ mode) and a variable vertical beam width in the Imaging mode (3°, 7°, 15°, 30°). Image update
rates vary with range, with a typical pulse repetition frequency of 2Hz at a 100m range. The range of the M3 can
be adjusted from 0.2 to 150m and all three M3 sonar heads can be ping-synchronized using a custom-made
Kongsberg sync unit. The sync unit has two 7m cables for each sonar head with separate connectors for
Ethernet/power and the sync signal. The M3 data from the sync unit is relayed to the dry-end on the barge via a
standard 85m transducer cable with Ethernet communications and power. The M3 sonar has been chosen for its
variable vertical beam widths, range and high frequency which allows high resolution imaging out of marine
mammal hearing ranges. For instance, at 50m range, a vertical beam opening of 30° will cover 30m of the water
column.
} 14} D2.10 Collection of Environmental Data Report
Figure 10. Successive pings from a forward-facing M3 sonar mounted from the barge with the kite visible as a
moving target while flying from the seafloor (kite object clearly visible between 25 and 45m range).
Initial sonar trials were performed from the barge, imaging the kite while flying in its figure-of-eight
configuration, tethered from the seafloor. The kite could be reliably tracked using one sonar head (Fig.10).
While the sonar was still mounted from the barge, drifting dummy targets where released from the barge to
test the capabilities of the sonar to visualise targets at increasing distances from the sonar head (Fig.11).
Figure 11. Successive pings of a drifting dummy target at increasing ranges recorded from a forward-facing M3
sonar mounted from the barge.
Side view water surface
3rd beam
ADCP
20m
1
3-dimensional
3 target tracking
2
Seabed 30m
Figure 12. Schematic of the side view of the three sonar heads mounted on a seabed frame in August 2017.
A seabed frame capable of mounting all three sonar heads was manufactured by Minesto for the first seabed
deployment trial in August 2017. The seabed frame consisted of three multibeam sonar heads; using two sonar
heads (1&2) in a split-beam configuration, and one head (3) directed towards the kite (see Fig. 12 for sonar head
specifications). The split-beam configuration consisted of one forward-facing sonar (2, with the 120° swath aligned
parallel to the seafloor) and one upward-facing sonar head (1, with the 30° vertical swath aligned parallel to the
seafloor). This enables the collation of both trajectories (xy) and depth (z) information from approaching targets
(targets going with the ebbing tide while the kite is flying). The ADCP frame was installed 30m away from the
sonar frame in line with the main flow direction to quantify concurrent velocities.
This configuration allowed for three-dimensional target tracking through simultaneous collection of approaching
target trajectories and water column depth when objects pass the area covered by the two swaths. The third
sonar head (3) was used to track two-dimensional trajectories across the kite area.
} 15} D2.10 Collection of Environmental Data Report
In February 2018, a second sonar seabed deployment was undertaken using a different sonar head mounting
configuration. For this, the two sonar heads (split-beam) were directed towards the kite area with only one sonar
head covering approaching targets. Further, both horizontal sonar swaths were overlapping to eventually link
target tracks going across both swaths to avoid double-counting targets and obtaining longer tracks.
Photo credit: Lilian Lieber
Figure 13. Seabed deployment in February 2017 with the multibeam frame shown (left), and a schematic
showing two sonar heads (1&2) directed towards the kite area and a third head (3) directed towards
approaching targets (right). Head (2) shows the vertical sonar swath.
To develop an autonomous observation system that can eventually detect and differentiate marine megafauna
from is currently under development. For example debris or turbulent features, as well as to track the movement
of detected objects, automated target detection, classification and tracking algorithms are currently being
developed within the Matlab (MathWorks) programming environment in close collaboration with Kongsberg, the
sonar manufacturer.
} 16} D2.10 Collection of Environmental Data Report Figure 13. Custom-made M3 sonar software (M³Track) interface during the development phase. The target track shown (bottom left) is generated from the drifting dummy target (see Fig. 11). The tracking software (M³Track), was developed in Matlab but is now a stand-alone software (with one instance run per head) that can be run in the background in addition to the generic M3 multibeam software. The software can link multiple objects among the different multibeam swaths and creates log files (with x,y,z positions over time) of the objects tracked and finally, allows for the tracking of multiple objects simultaneously. Classification is still under development but currently relies, for instance, on the movement trajectory of the tracked target, pixel density and intensity. As noted earlier, Minesto’s site licence requires a marine mammal observer (MMO) during hours of operation and the shutdown of the device when a seal or other marine megafauna enter a 50m buffer zone around the device. However, with the kite and its components being fully submerged, the effectiveness of MMOs to assess animal-kite interactions is limited to surface observations. Therefore, when an object with a high probability of being a marine mammal is detected by the sonar tracker software, a warning message indicates the observation along with the range to the sonar to evaluate if the kite operation should be shut down. Pending classification development, it is anticipated that the shut-down of the device and its ‘buffer zone’ will be decreased to eventually observe near-field animal-kite interactions. 3.3.1 Sonar system development summary As multibeam sonar as a tool for environmental monitoring is still under development at various sites globally, there is no single solution yet concerning optimal configurations. Further, machine learning algorithms to detect, track and classify marine life are still immature and far from universal, highlighting the importance of further developing sonar as a monitoring tool at the site. Since the purchase of the sonar system in month 13, and therefore over a year delayed in the project, there has been considerable development of the system as highlighted above, including: sonar trials performed by imaging the kite flying from the barge and tethered from the seafloor, using drifting dummy targets to test the capabilities of the sonar to visualise targets at increasing distances from the sonar head, different seabed frame positions and head configuration optimization. Finally, the on-going development of the more user-friendly, stand-along tracking software has made considerable progress since the initial development in Matlab. The software is now running alongside sonar data recording and can alert the user when objects are approaching the kite area. This work has resulted already in one publication (Lieber et al. 2017) and two conference presentations. It is anticipated with the extension of the project in part because of the delay in acquiring the sonar system, that data on movement behaviour of animals is collected and can be reported in the final deliverable D6.2 in M36. Conference presentations: Lieber L, Nilsen T, Zambrano C, Kregting L. Assessing the effectiveness of multibeam sonar: Marine Life interactions with a subsea kite in a tidal channel. European Cetatcean Society, Denmark, 2017. Lilian L, W. Nimmo-Smith A. M., Waggitt J. J., Nilsen T., Kregting L. Advancing multi-scale hydroacoustic monitoring in highly energetic environments: From fine-scale target tracking to top predator occupancy patterns in a tidal channel. Environmental Interactions of Marine Renewables, Orkney, April 2018 3.4 Benthic Survey There is still relatively few published articles which can be used to assess the environmental impact of operational MRE devices in the environment, primarily because there has only been one ‘full scale’ operational turbine to date, SeaGen (O’Carroll et al. 2017). It can be argued that Minesto and their Deep Green technology (the kite) have only tested scaled turbines in Strangford Lough, Northern Ireland and therefore impact would be minimal. However, the site has had continuous activity over a four-year period and includes infrastructure similar to that which would be required for a ‘full scale’ kite including the foundation, sea-floor cables, daily boating activity and kite induced noise as the kite is flown from the barge or seafloor. In effect the area has been operational since 2012 with the testing of a 3-meter wing device. } 17
} D2.10      Collection of Environmental Data Report

Prior to the installation and operations of the kite in 2013, a benthic survey was undertaken in order to assess
the ecological composition of the proposed site. Three sites were surveyed during July and August 2012 from
which one was chosen for the testing of the kite (Fig. 14). It was proposed to revisit these sites in order to assess
if any changes had taken place to the benthic environment during these operational years. Owing to seasonal
changes in benthic community structure and population dynamics (i.e summer opportunistic species), it was
considered best practice to replicate the survey during the same seasonal months as the previous investigation.
Therefore, work commenced on a post-baseline data benthic impact assessment during July and August 2017.

Here an overview of the data collection from the surveys carried out in 2012 and 2017 at the Minesto site is
provided.

            A                                D

                                         B

Figure 14. Survey sites Ballyhenry Bay (A, B, D) are typified by a mixed shell cobble substrate and with current
speeds of approximately 1.5 m/s on spring tides (site B powerkite take-off installation)

3.4.1           Methods
A compass rose transect methodology was employed at all sites conducted by scientific divers. From each
transect, both video and digital stills of each 0.5 x 0.5 m quadrat placed at 4 m intervals along the transect. During
the survey a total of 32 digital still images per site were collected (Fig. 14: A, B & D).

Images were analysed using Coral Point Count© software with the Microsoft Excel© extension (CPCe©) where
100 random points were overlaid onto each individual image taken underwater (Fig. 16). The imagery overlay
points act as non-biased observation markers from which quantitative data on benthic disturbance could be
assessed.

}                                                                                                            18
} D2.10 Collection of Environmental Data Report
Photo credit: Louise Kregting
Figure 16 CPCe©screen shot of still imagery of benthos randomly positioned data analysis overlay points.
The point markers were examined by a benthic ecologist who assigned the appropriate CPCe© identification
label to different groups e.g. substrate type, epifauna, epiflora or vagile species that were present directly under
the overlay point at the time of image capture (Fig. 16). This methodology for the assessment of survey image
data was adopted from Bento et al. (2016) because of its high analytical soundness.
Each site had a mandatory 3,200 individual observations (io) which culminated in 9,600 (io’s) for all three site
specific imagery data sets for 2017. The image processing protocol was repeated for image captures taken during
the 2012 survey with the total outcome of the two analyses culminating in 19,200 identifications. CPCe©
quantified the epibionts to species level and substrate type (io) to a recognised Joint Nature Conservation
Committee (JNCC) category (Frederiksen et al. 2007) for each (io) collected within an individual quadrat as per
Kohler & Gill (2006). The software then calculated the Shannon Diversity Index for each quadrat, transect and
site.
The recent 2017 subtidal environmental impact survey of the kite site also recorded images of the anchor
foundation footings (Fig. 17). It is evident within the images that the structure has now become integrated and
homogenised into the surrounding environment with no barren species peripheries or boundaries recorded
which would indicate a dead zone.
} 19} D2.10 Collection of Environmental Data Report
Photo credit. Louise Kregting 2017 Photo credit. Dave Smyth 2017
Figure. 17. Sub-sea anchor points for kite mooring N 54 23.06232, W 05 33. 79177. Both images show evidence
of successional colonization of both epifauna and epifloral species. Idicators of a stable and biologically functional
benthos.
3.4.2 Benthic data collection summary
All data required to carry out the assessment of the benthic communities in the vicinity of the kite and control
areas has been collected. There is currently one manuscript in preparation and the results will be highlighted in
D6.2 (M36).
} 20} D2.10 Collection of Environmental Data Report 4. Conclusion This report is a deliverable of the Powerkite project, a Horizon 2020 project funded by the European Union’s Horizon 2020 research and innovation programme. It includes a description of the methodology of the environmental data collected during the Powerkite project over a 30 month period. The report details information on the approaches taken to collect ambient noise and PTO data, development of the CRM for the kite, development of the Sonar System to understand animal movement and carry out the benthic survey. The report has highlighted the challenges in monitoring and mitigating in the near-field of operational tidal MRE devices, which are naturally located/placed in highly energetic environments. Nonetheless, considerable progress has been made in all three of the principle aspects the report has focused on; namely1) assessing and/or monitoring of noise, 2) collision risk and 3) benthic communities. To address these monitoring challenges, , the latest technologies including SoundTrap 300 STD hydrophones and Kongsberg Mesotech M3 multibeam sonar heads, as well as modelling software including Blender and Matlab, have been used. In continuing to develop and evolve these approaches, further progress will be made with respect to presenting the final results, which will be provided in the Environmental Impact Report (D6.2) due M36. } 21
} D2.10     Collection of Environmental Data Report

5. References

ABPmer (ABP Marine Environmental Research Ltd). (2010). Collision Risk of Fish with Wave and Tidal
Devices.Commissioned by RPS Group plc on behalf of the Welsh Assembly Government, R/3836/01. Published
by ABP Marine Environmental Research Ltd, Southampton, UK. Pp. 106.

Bento R., Feary D.A., Hoey A.S., Burt J.A. (2017). Settlement Patterns of Corals and other Benthos on Reefs with
Divergent Environments and Disturbances Histories around the Northeastern Arabian Peninsula, Frontiers in
Marine Science. 4 p. 305 DOI=10.3389/fmars.2017.00305

Bernstein, B. B. (2015), Decision framework for platform decommissioning in California. Integr Environ Assess
Manag, 11: 542–553. doi:10.1002/ieam.1695

Broadhurst M, Barr S. (2011). Short Term Temporal Behavioural Responses in Pollack, Pollachius pollachius to
Marine Tidal Turbine Devices; a Combined Video and ADCP Doppler Approach. Paper Presented at the
European Wave and Tidal Energy Conference, Southampton, United Kingdom.

Connor, D.W., Allen, J.H., Golding, N., Howell, K.L., Lieberknecht, L.M., Northen, K.O., Reker, J.B. (2004). The
Marine Habitat Classification for Britain and Ireland. Version 04.05 JNCC, Peterborough

Copping A, Sather N, Hanna L, Whiting J, Zydlewski G, Staines G, Gill A, Hutchison I, O’Hagan A, Simas T, Bald
J, Sparling C, Wood J and Masden E. (2016). Annex IV 2016 State of the Science Report: Environmental Effects
of Marine Renewable Energy Development around the World.

Frederiksen, M., Mavor, R., & Wanless, S. (2007). Seabirds as environmental indicators: The advantages of
combining     data      sets. Marine Ecology    Progress    Series, 352,  205-212.      Retrieved   from
http://www.jstor.org/stable/24872145

Hammar L, Andersson S, Eggertsen L, Haglund J, Gullström M, et al. (2013). Hydrokinetic Turbine Effects on Fish
Swimming Behaviour. PLoS ONE 8(12): e84141. doi:10.1371/journal.pone.0084141

Hammar L, Eggertsen L, Andersson S, Ehnberg J, Arvidsson R, Gullström M, et al. (2015). A Probabilistic Model
for Hydrokinetic Turbine Collision Risks: Exploring Impacts on Fish. PLoS ONE 10(3): e0117756.
doi:10.1371/journal.pone.0117756

Hutchison I, Copping A. (2016). A Coordinated Action Plan for Addressing Collision Risk for Marine Mammals
and Tidal Turbines. http://tethys.pnnl.gov/events/annex-iv-workshop- collision-risk-marine-mammals-and-tidal-
turbines

Kohler, K. E., and Gill, S. M. (2006) Coral Point Count with Excel extensions (CPCe): A Visual Basic program for
the determination of coral and substrate coverage using random point count methodology. Computers &
Geosciences, 32 (9), 1259-1269.

Kregting L, Elsaesser B. (2014). A hydrodynamic modelling framework for Strangford Lough Part 1: Tidal Model.
Journal of Marine Science and Engineering. 2:46-65.

Kregting L, Elsaesser B, Kennedy R, Smyth D, O’Carroll J, Savidge G. (2016). Do Changes in Current Flow as a
Result of Arrays of Tidal Turbines Have an Effect on Benthic Communities? PLoS ONE 11(8): e0161279.
doi:10.1371/journal.pone.0161279

Lieber L, Nilsen T, Zambrano C, Kregting L. (2017) Optimising multiple multibeam sonars to assess marine life
interactions with an underwater kite. European Wave and Tidal Energy Conference, Cork.

}                                                                                                       22
} D2.10      Collection of Environmental Data Report

Leijon, M., Boström, C., Danielsson, O., Gustafsson, S., Haikonen, K., Langhamer, O., Strömstedt, E., Stålberg,
M., Sundberg, J., Svensson, O., Tyrberg, S. & Waters, R. (2008). Wave Energy from the North Sea: Experiences
from the Lysekil Research Site. Surveys in Geophysics, 29, 221–240.

Newman, S. P., Meesters, E. H., Dryden, C. S., Williams, S. M., Sanchez, C., Mumby, P. J. and Polunin, N. V. C.
(2015). Reef flattening effects on total richness and species responses in the Caribbean. J. of Ani. Ecol. 84, 1678–
1689. doi:10.1111/1365-2656.12429

O’Carroll, J.P.J., Kennedy, R.M., Savidge, G. (2017). Identifying relevant scales of variability for monitoring
epifaunal reef communities at a tidal energy extraction site. Ecological Indicators. 73: 388-397. Royal Haskoning.
2012. SeaGen Environmental Monitoring Programme Final Report. Ref. 9S8562/R/303719/Edin.
http://seageneration.co.uk/files/SeaGen-Environmental-Monitoring-Pro- gramme-Final-Report.pdf

Savidge G, Ainsworth D, Bearhop S, Christen N, Elsäßer B, Fortune F, et al. (2014). Strangford Lough and the
SeaGen tidal turbine. In: Shields MA, Payne AIL, editors. Marine Renewable Energy Technology and Environmental
Interactions, Humanity and the Sea. pp. 153-172.

Schmitt P, Culloch R, Lieber L, Molander S, Hammar L, Kregting L (2017) A tool for simulating collision
probabilities of animals with marine renewable energy devices. PLoS ONE 12 (11): e0188780

Wood J, Joy R, Sparling C. (2016). Harbor Seal - Tidal Turbine Collision Risk Models. An Assessment of
Sensitivities. Report by SMRU Consulting. pp 57

Zydlewski, G., Staines, G,, Sparling, C., Madsen E., Wood, J. (2016) Chapter 3: Collision risk for animals around
tidal turbines. In: Copping A, Sather N, Hanna L, Whiting J, Zydlewski G, Staines G, Gill A, Hutchison I, O’Hagan
A, Simas T, Bald J, Sparling C, Wood J, Masden E. 2016. Annex IV 2016 State of the Science Report: Environmental
Effects of Marine Renewable Energy Development around the World.

}                                                                                                          23
} D2.10     Collection of Environmental Data Report

Information on EU funding / Disclaimer

                    This project has received funding from the European Union’s Horizon 2020 research and
                    innovation programme under grant agreement No 654438.

                    The content of this report reflects only the author’s view and the Agency is not
                    responsible for any use that may be made of the information it contains.

}                                                                                                      24
You can also read