Portable System for Monitoring and Controlling Driver Behavior and the Use of a Mobile Phone While Driving - MDPI
←
→
Page content transcription
If your browser does not render page correctly, please read the page content below
Article

Portable System for Monitoring and Controlling
Driver Behavior and the Use of a Mobile Phone
While Driving
Amith Khandakar 1,*, Muhammad E.H. Chowdhury 1, Rashid Ahmed 2, Ahmed Dhib 1,
Mohammed Mohammed 1, Nasser Ahmed M A Al-Emadi 1 and Dave Michelson 3
 1   Electrical Engineering Department, College of Engineering, Qatar University, Doha-2713, Qatar;
     mchowdhury@qu.edu.qa (M.E.H.C.); ad1404376@student.qu.edu.qa (A.D.);
     mm1207599@student.qu.edu.qa (M.M.); alemadin@qu.edu.qa (N.A.-E.)
 2   Industrial and Mechanical Engineering Department, Qatar University, Doha-2713, Qatar;
     rashid.ahmed@qu.edu.qa (R.A.)
 3   Electrical Engineering Department, University of British Columbia, Vancouver, Canada;
     davem@ece.ubc.ca (D.M.)
 *   Correspondence: amitk@qu.edu.qa; Tel.: +974-403-4235.

  Received: 25 February 2019; Accepted: 28 March 2019; Published: 31 March 2019

 Abstract: There is an utmost requirement for technology to control a driver’s phone while driving,
 which will prevent the driver from being distracted and thus saving the driver’s and passenger’s
 lives. Information from recent studies has shown that 70% of the young and aware drivers are
 used to texting while driving. There are many different technologies used to control mobile
 phones while driving, including electronic device control, global positioning system (GPS), on-
 board diagnostics (OBD)-II-based devices, mobile phone applications or apps, etc. These devices
 acquire the vehicle information such as the car speed and use the information to control the
 driver’s phone such as preventing them from making or receiving calls at specific speed limits.
 The information from the devices is interfaced via Bluetooth and can later be used to control
 mobile phone applications. The main aim of this paper is to propose the design of a portable
 system for monitoring the use of a mobile phone while driving and for controlling a driver’s
 mobile phone, if necessary, when the vehicle reaches a specific speed limit (>10 km/h). A paper-
 based self-reported questionnaire survey was carried out among 600 teenage drivers from
 different nationalities to see the driving behavior of young drivers in Qatar. Finally, a mobile
 application was developed to monitor the mobile usage of a driver and an OBD-II module-based
 portable system was designed to acquire data from the vehicle to identify drivers’ behavior with
 respect to phone usage, sudden lane changes, and abrupt breaking/sharp speeding. This
 information was used in a mobile application to control the driver’s mobile usage as well as to
 report the driving behavior while driving. The application of such a system can significantly
 improve drivers’ behavior all over the world.

 Keywords: driving behavior; real-time monitoring; driver distraction; mobile application;
 portable system

1. Introduction
     Over the last few years, road accident incidents have seen a tremendous increase mainly
associated with driver distraction caused by mobile phone calls. The U.S. federal government has
reported [1,2] that more than 30,000 people are killed on U.S. roads every year in crashes related to

Sensors 2019, 19, 1563; doi:10.3390/s19071563                                     www.mdpi.com/journal/sensors
Sensors 2019, 19, 1563                                                                            2 of 18

distracted driving. Despite knowing the risk of using a mobile phone while driving, 70% of drivers
use a mobile phone during driving. There have been recent studies showing the effect of popular
social networking games, such as Pokémon GO, leading to many accidents, where users play games
while driving [3] The chances of crashing become higher if mobile phones are used because this
reduces driving performance. The control of the sidelong and longitudinal position of the car is one
of the basic needs during safe driving; however, frequent use of mobile phones while driving
results in poorer lane-keeping, slower response time, and more variable speed [4,5]. In addition, the
distance between the driver car and the front car, the fact of wandering out of the driving lane, and
a reduced awareness of surroundings are some factors that lead to frequent road accidents and
mortalities. In order to control the abrupt use of mobiles phones while driving, we need a smart
portable system, which can control and monitor the behavior of a driver whenever the distracted
driving exceeds a threshold and the risk of road crashing becomes imminent.
     The consequences of using a mobile phone during driving are more lethal than communicating
with fellow passenger, and research has shown that drivers busy in discussions over the phone
have missed highway exits four times more frequently than those talking with passengers. The
drivers talking with travelers did not demonstrate any significant differences with the lone drivers
in the simulator environment [6]. The use of cell phones for chatting, messaging, playing media,
web browsing, gaming, using the global positioning system (GPS), or working other telephone
applications or apps is a dangerous act leading to distracted driving and road crashes [6]. This was
evident from a report in 2010 from the U.S. National Highway Traffic Safety Administration
(NHTSA) stating that 995 drivers died only because of distraction caused by the use of phones.
Similarly, another study in March 2011, carried out by a U.S. insurance agency, State Farm
Insurance, declared that 19% of the drivers involved in road accidents were busy talking on a cell
phone while driving [7].
     The tendency of mobile phone use during driving is more frequent in youth, with one of the
studies reporting that more than 90% of college students were involved in initiating, reading, or
replying to messages while driving. Messaging while driving, is considered the most harmful
among all types of distraction using a mobile phone while driving, and it has been reported that
there is a six-fold increase in distraction-related crashes due to text messaging [7]. Mobile phone
texting, using MP3s, and other distractions may hinder the capacity of young drivers to control the
vehicle and their ability to anticipate and manage hazards [8]. However, collision avoidance
systems, electronic stability control, vehicle tracking systems, and intelligent speed adaption may
help to reduce the problem even though technology alone cannot make the young driver safe.
     A study [9] was conducted that was based on a self-reported questionnaire survey carried out
among 242 young drivers in Riyadh, Saudi Arabia to obtain detailed insights into traffic violations
committed by young Saudi drivers. The study showed that excessive speeding, which is mainly
caused due to running late or testing a car’s performance, is the leading cause of traffic accidents
and traffic violations. Moreover, driving very close to the front car, which inhibits the driver to stop
in an emergency, is another significant factor leading to traffic accidents. A study was carried out at
the American University of Beirut (AUB), Lebanon and at George Washington University (GWU),
United States of America to investigate the differences in red-light violations and driving behavior
of drivers in those two countries. It has been reported that AUB students engage more in dangerous
driving behavior than GWU students do, whereas GWU students are prone to violate traffic rules
and red-light signals in the simulator [10]. A study was carried out on 83 new license holder young
drivers in private cars, where the system was acquiring driving performance including secondary
task engagement and driving environment logging. This study showed that teenage drivers are
frequently engaged in secondary tasks and tend to regulate themselves poorly based on the
surrounding environmental conditions. Moreover, the teenagers are greatly influenced by peers
with respect to engaging in secondary tasks [11]. A system was demonstrated in the study [12],
which merged the driver’s background data and driving data to assess the good/bad driving
pattern. The score for driving performance managed through the in-vehicle smart system, which
provided feedback to the drivers to improve their driving, was found to be useful for taxi
Sensors 2019, 19, 1563                                                                            3 of 18

companies. There have also been studies where the authors have tried to detect driver distraction
using semi-supervised machine learning without developing a prototype [13].
      Various technologies and smartphone applications have been developed in recent years in
order to limit the frequent use of mobile phones during driving. One of these is Google Glass, but it
is still not safe to use [14]. In this same vein, a three-axis accelerometer of an Android-based
smartphone was built up with multiple sensors to improve a driver’s awareness to maximize
safety [15]. A hardware device that can detect mobile phone use while driving and later block
mobile communications could be a very fruitful option for monitoring and controlling road
accidents. For example, radio frequency identification (RFID) technology could be used to record
the data and send the vehicle’s plate number to a control center when the driver uses the mobile
phone and a radio frequency (RF) blocker can be used to block the mobile phone. However, the
regulatory commission of some countries does not allow an RF blocker or jammer to be
implemented in the car. The use of smartphone accelerometer sensors is another important
technique to monitor vehicle status that involves the application of a principal component analysis
(PCA) algorithm with time, frequency as well as power spectral density features of the sensor data
to predict the vehicle status. This mobile sensor proved beneficial in identifying driving behavior
using mobile phone applications [16]. However, this requires a high-performance computational
capability in the smartphone application, or the application must be implemented in the cloud. The
low-speed following mode (LSM) uses millimeter wave radar to identify the speeding up,
deceleration, and stopping of the front car to appraise the distance from the front car; in the interim,
the driver likewise controls the brake and the fuel systems to keep up the vehicle distance within
the safety range. When the front car encounters a strange condition, the system produces an alert
sound to warn the driver [17]. However, this assistive technology is implemented in some
expensive cars and is not easy to implement in all available vehicles. The Lane Keeping Assist is a
useful system to monitor the passing or separating lane by using a camera fixed to the front of the
vehicle. The system produces a cautioning signal when the driver crosses or enters the opposite side
of the passing line without using the correct light direction indicator [17]. However, this camera-
assisted system is prone to making mistakes during rough weather conditions and bad road
conditions, and the image processing requires a powerful computer to be installed on board. In a
very recent work [18], a content analysis was conducted on 29 English smartphone applications to
identify the stopping, preventing, or reducing phone use behavior while driving, detected by the
applications. The functionality of these applications was determined based on application–mobile
phone interaction, application–driver interaction, and application–context interaction. Most of these
applications focused on blocking specific phone functions; however, the applications did not focus
on simplifying phone tasks while driving and none of them was designed to study driving
behavior. Another recent work by Delgado et al. [19] showed that the strongest perceived benefit of
cellphone blocking apps was decreasing distraction (86%). The predominant reason among young
drivers for not wanting to use this technology was not wanting parents to monitor their behavior
(60%). This work shows the importance of developing driver-friendly applications while controlling
a driver’s mobile usage. The systems that have been reported so far in the literature did not present
a feasible solution that could acquire the driving behavior from the car and use it to control the
mobile phone automatically.
      In this work, we have proposed a hybrid (hardware and software combined) solution to
monitor driving behavior and keep track of a driver’s mobile phone usage, and to control the
mobile phone call when the car speed reaches a certain threshold. The on-board diagnostics (OBD)-
II port of the vehicle was used to get the vehicle’s real-time data. It was used to obtain the car speed
very accurately, the accelerometer (ACM) sensors were used to identify some aspects of the driving
behavior, and a mobile application written in the Android platform was used to monitor, log, and
report driving behavior and control mobile phone calls. We decided on several driving behaviors to
be studied and monitored in this work, based on an anonymous self-reported survey that was
conducted with 600 male and female teenager drivers belonging to different nationalities. The
survey was done in order to determine the pattern and frequency of mobile phone use while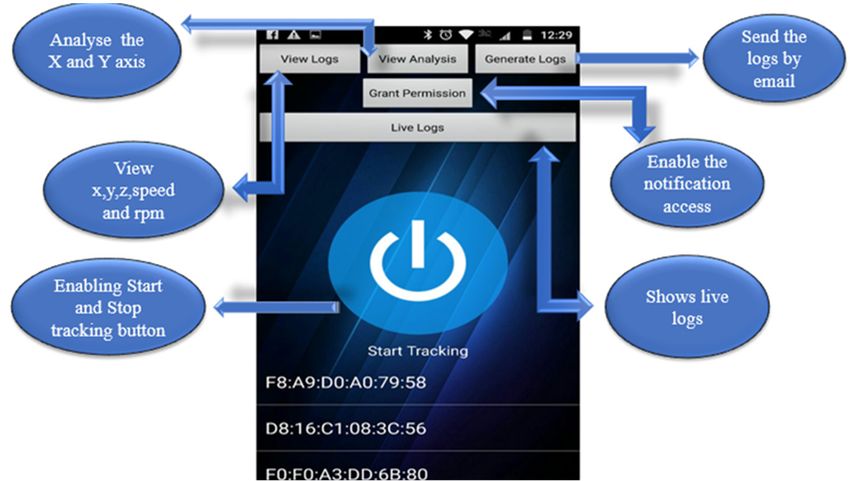
Sensors 2019, 19, 1563                                                                         4 of 18

driving, and to find out about driving behavior, distracted driving due to mobile phones, and
drivers’ level of recommendations regarding the use of technologies to assist drivers or control
mobile phones in Qatar.

2. Experiment Details and Methods
     In this section, we provide the details of the pilot study conducted to gather self-reported
information regarding teenager driving practice in Qatar. Although this survey was conducted for
Qatar, this result should reflect the driving practices of Middle East and North African (MENA)
countries very closely. This section also provides a detailed description of the hardware and
software design of the prototype system used to monitor and control driving behavior.

2.1. Pilot Study
     A self-reported paper-based pilot study was carried out in order to assess the driving behavior
and perception of using a mobile phone while driving in Qatar. Both male and female subjects aged
18 to 26 years belonging to different nationalities were selected and data were collected from a
population of 600 subjects. An approval was obtained from the Qatar University Human Research
Ethics Committee prior to the start of the study. The participants were selected from different
undergraduate classes from the universities of Qatar and were given a paper-based questionnaire to
choose answers anonymously [13–17,20]. The survey was conducted in both an Arabic and an
English version based on the user’s choice (the English version of the survey questionnaire is shown
in the Appendix Figure A1). Instructions were given to the participants that the study was to
determine the perception of teenage drivers in Qatar about the use of mobile phones while driving.
The questionnaire was prepared carefully so that there was no repetitive questions. Additionally,
participants were asked to fill in the questionnaire honestly by circling or ticking the number that
best suited their opinion after going through it carefully. Extreme care was taken to maintain the
anonymity of the study and the confidentiality of the responses by preventing the identification of
data obtained from the participants. Furthermore, the identification of participants was prevented
by analyzing and reporting the data in a cumulative manner. Moreover, the survey was carried out
to address the question of whether the driving behavior played any role based on gender, age
range, and nationality or the car model being driven (expensive or inexpensive).

2.2. Design of Experiments
      A complete block diagram of the prototype is shown in Figure 1. Any vehicle manufactured
after 1996 is equipped with an on-board diagnostics (OBD) II system, which allows access to the
vehicle’s real-time information from its electrical control unit (ECU). The vehicle information from
the OBD-II module was sent to a controller unit (microcontroller) and stored in the secure data (SD)
card and transmitted via Bluetooth to the mobile phone. The hardware module was powered by the
OBD-II module, which took power from the OBD-II port. Therefore, the system only ran while the
vehicle was running and it did not drain the vehicle’s battery. There was a three-degree-of-freedom
(DOF) accelerometer module interfaced with the controller to keep track of the acceleration in the x-
, y-, and z-directions. In the mobile phone, an in-house developed smartphone application made
decisions based on the information received from the controller. The mobile application was
designed to make decisions based on certain set thresholds, which were determined by detailed
experiments on different subjects and will be discussed in the next section.
Sensors 2019, 19, 1563                                                                          5 of 18

                               Figure 1. Complete system block diagram.

2.2.1. Hardware Modules
     Various hardware modules are discussed in detail below.
     OBD-II Module: The OBD-II adapter as displayed in Figure 2 was plugged into the OBD port
of the vehicle to access various data from the car (car speed, engine rpm, battery voltage, etc.). The
data were merged to measure the frequency of sudden breaking-like driving behavior. The
connection of the OBD-II module to the OBD port is shown in Figure 3.

                          Figure 2. Connection diagram for different modules.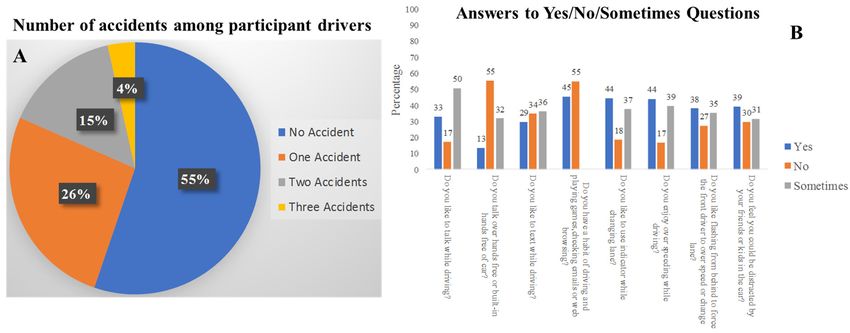
Sensors 2019, 19, 1563                                                                               6 of 18

Figure 3. (A) On-board diagnostics (OBD)-II module, (B) OBD-II port, and (C) OBD-II module connected to the
car’s OBD-II port.

     Controller Module: The OBD-II module was interfaced to an Arduino Nano microcontroller to
gather the information from it. This information was packaged with 3-DOF accelerometer data and
sent to the mobile phone via Bluetooth. The microcontroller and the modules were powered by the
car battery through the OBD-II module. The inter-integrated circuit (I2C) interface was used for
connecting the OBD-II and 3-DOF modules to the microcontroller, whereas the serial peripheral
interface (SPI) was used for connecting the Micro SD card module to the microcontroller.
     3-DOF Accelerometer Module: A 3-DOF accelerometer module (MMA7455) was used to collect
x- (forward-backward), y- (left-right) and z-axis (up-down) acceleration of the vehicle. This was
used to identify normal left-right turning, sudden right-left turning, and U-turn. The MMA7455
module was connected with the Arduino Nano using the I2C interface (Figure 4A).

      Figure 4. Arduino Nano interfacing wiring with (A) MMA7455, (B) Micro SD card module, and
      (C) Bluetooth Low Energy (BLE) module.

     Micro SD Card Module: The information received from the OBD-II and 3-DOF modules was
sent to the mobile phone via Bluetooth and stored in a Micro SD card as a backup. This was to
ensure that if the connection with the mobile phone and the controller disconnected for some
reason, the controller would not lose any data. As soon as the connection was established, the
controller updated the mobile application logger to log the information. The details of the
connection between the microcontroller and the Micro SD module are shown in Figure 4B.
     Bluetooth Low Energy (BLE) Module: The controller was used to gather useful data (x-, y-, and
z-acceleration from the accelerometer and car speed and engine revolution per minute (rpm) from
the OBD-II module) continuously every 50 ms with a sampling frequency at 20 Hz, which was sent
continuously to the mobile phone. An HC-06 Bluetooth module was used for wireless
communication between the controller and the mobile phone. The HC-06 was initially paired with
the mobile phone. The microcontroller received the data and combined them in packets and then
sent the data to the mobile phone using the HC-06 Bluetooth module. The connection diagram of
the microcontroller and the Bluetooth module is shown in Figure 4C.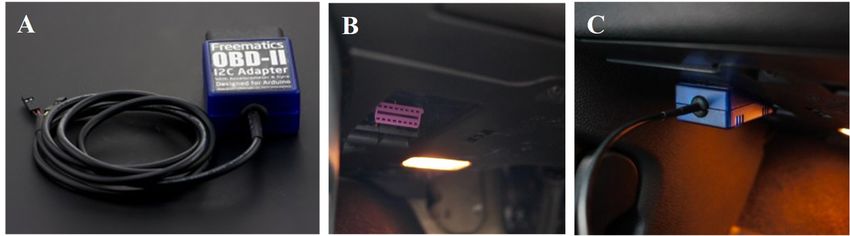
Sensors 2019, 19, 1563                                                                                7 of 18

2.2.2. Android Mobile Application: Track User Notification
     A tracking application in the Android platform was developed to read the data from the
hardware wirelessly, log the data locally for 24 h, and identify the driver’s behavior based on the
logged data and pre-set threshold. The application was designed to monitor car speed and control
the driver’s mobile phone by restricting receiving or generating phone calls and monitoring
behavior while driving if the car speed went above 10 km/h. The application logged only the
driver’s other mobile usage information like texting, browsing, playing, etc. At midnight, the
application automatically sent the obtained information about car speed, sudden lane change
behavior, call blocking, and the driver’s mobile usage to a pre-specified email address. Although
the driver was not allowed to generate or receive calls if the speed was above 10 km/h, they could
receive a call if the speed dropped below that threshold. Different stages of the mobile application’s
workflow are shown in Figure 5.

                         Figure 5. Block diagram to show the stages of the application’s operation.

    BLE Acquisition: The Arduino Nano in the hardware module received the data and combined
them in a packet and sent the data to the mobile phone using the HC-06 Bluetooth module. The
data packet template used for the BLE communication is shown in Error! Reference source not
found.. In the packet template, “E” is a header, “,” is a data separator, and “;” is a data terminator.
As shown in Figure 5, there is a module for Bluetooth data reception, and a call constant function
was developed to check whether Bluetooth was on or not.

                             E       x      ,       y     ,     z      , speed , rpm ;

                                                Figure 6. Data packet template.

      Grant Permission: In order to respect the user’s privacy, the application first asked the user for
permission to access and track by enabling the button during the installation process (Figure 7
(left)). If the permission from the user was enabled and Bluetooth was enabled, the application
continued. If it found either one disabled, it exited instead of continuing the process.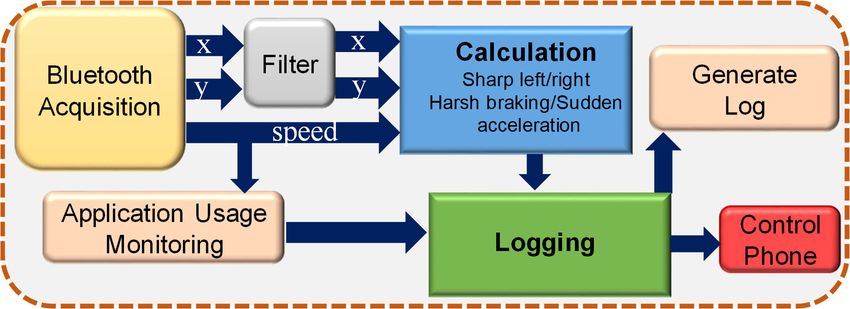
Sensors 2019, 19, 1563                                                                             8 of 18

                         Figure 7. Screen shots of some of the mobile application’s features.

Automatic Tracking: The app was designed so that it started automatically to track the driver’s
mobile phone if the car speed increased above 10 km/h.
Data Logging and Reporting: The user could see the data acquired from the Bluetooth module
using the user interface (Figure 7 (center)). The user could also share the day’s log by email as a text
file or as a portable document format (PDF) file, as shown in Figure 7 (right). However, the log was
reported automatically to a pre-specified email address at midnight.
      The application home interface had five features (and one button for manually starting the
tracking), as shown in Figure 8.

                     Figure 8. User interface of the Track User Notification mobile application.

A set of tests were designed to study the performance of the prototype system.

2.2.3. Study 1: Hardware Module Evaluation using Emulator
          The prototype hardware was initially tested using an emulator before using it on a real car.
Freematics OBD-II Emulator MK2 (Freematics, Wahroonga, New South Wales, Australia) (Figure 9A)
is an OBD-II emulator with controlled area network (CAN) bus simulation that provides a 16-pin
female OBD-II port identical to that of a real car. This device is very useful to get the car’s OBD-II
facility on the desk to simulate the real car behavior.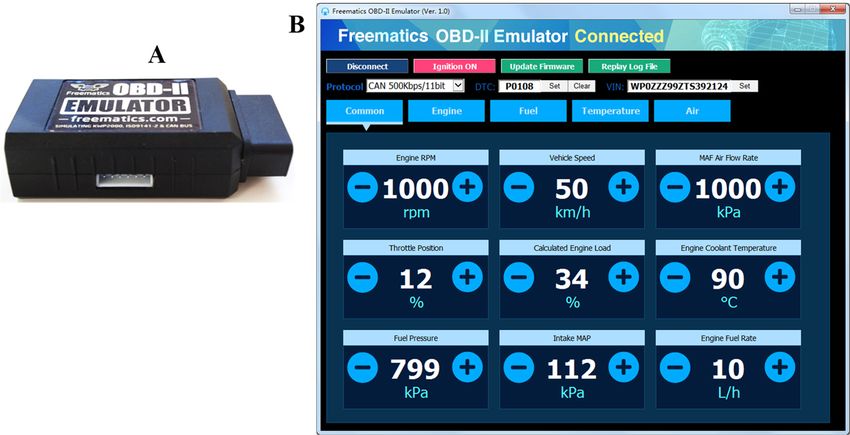
Sensors 2019, 19, 1563                                                                               9 of 18

              Figure 9. Freematics OBD-II Emulator MK2 (A) and Graphical User Interface (GUI) (B).

     An open-source GUI software is available to see the car parameters on screen and vary them to
check the OBD-II device’s performance on the desk. A series of tests were carried out using the
emulator to check the performance of the complete system before testing it on a real-car
environment.
     The performance of the Bluetooth communication between the vehicle and the controller was
evaluated by displaying the received packet from the emulator to the controller (interfaced to a
personal computer over a USB interface), and the performance between the controller and the
mobile phone was evaluated by analyzing the received packet in the mobile phone, comparing it
with the packets sent from the controller.

2.2.4. Study 2: Hardware Module Evaluation in Vehicle Environment
     Experiments were conducted to evaluate the performance of the hardware prototype in
reliably acquiring the vehicle information and driving behavior in the real-car environment. The
speed of the vehicle reported by the OBD-II module was logged and the speed displayed in the
dashboard was recorded synchronously and an off-line comparison was done.

2.2.5. Study 3: Evaluation of Driving Behavior
     This study was designed to obtain the thresholds for lane change and sudden
acceleration/braking behavior of the driver using the data acquired from the OBD-II module and
the accelerometer. These thresholds were used to make decisions about driver behavior, such as
sharp left, sharp right, sudden brake, or sharp acceleration. We asked ten teenage drivers to
perform a series of driving experiments in the pattern listed in Table 1. The OBD-II and
accelerometer data were recorded for the various user trials and the threshold for each case was
calculated.

                         Table 1. Driving pattern for data collection to calculate the thresholds.

                                     Duration                Actions
                                      0s-10s                 Normal
                                      10s-20s                Turn left
                                      20s-30s               Turn right
                                      30s-40s     Sudden change lane toward right
                                      40s-50s      Sudden change lane toward left
                                      50s-60s            U-turn(leftward)
                                      60s-70s          Sudden acceleration
                                        70s                Harsh brake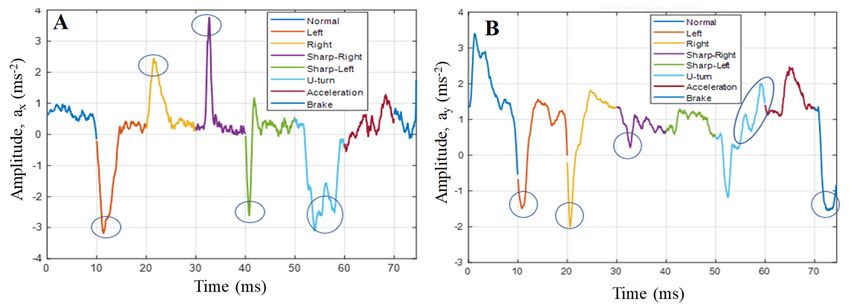
Sensors 2019, 19, 1563                                                                              10 of 18

2.2.6. Study 4: Evaluation of the Phone Control, Data Logging, and Reporting
     Finally, the application was tested to check if it was working with all the log viewing features
and could properly report all the activities through email or not. The initial testing of the
application was accomplished by monitoring and tracking all the tasks performed by the driver
while data were sent from the controller. We evaluated whether the call controlling feature was
activated at 10 km/h or not and whether the user’s activity information (incoming, outgoing,
duration of call, etc.), all push notifications (SMS, social media apps, third party messaging apps,
that is, any conversation, incoming and outgoing, duration of that session of activity) was correctly
logged or not. In addition, we checked whether the app could generate a summary of call activities
and notifications and send it automatically by email or not.

3. Analysis
     In this work, survey data analysis was accomplished in Microsoft Excel 2016 and vehicle data
were initially analyzed in MATLAB 2018 and later (after the development of the mobile application)
done in the mobile phone. Initial development and testing of the smartphone application were
carried out on a Samsung Note 8 mobile phone, which is powered by an Exynos 8895 Octa-core
processor, along with 6 GB of RAM and 64 GB internal memory. The operating system installed on
the phone was Android 7.1.1 (Nougat) and enabled with Bluetooth Low Energy (BLE) 5.0.
However, the smartphone application was tested in several lower-end smartphones in the testing
phase.
     Survey Analysis: Detailed chi square statistics [21] were performed on two major questions,
namely, (i) Is it also a good idea to restrict texting, gaming, or browsing while driving and (ii) Is it a
good idea to restrict phone calls to only emergency family contacts while driving?, to check the
accuracy of the predictions made by the authors based on the literature review. The first question
had the assumption that all participants would state that it was a very good idea. For the second
question, the authors assumed that all participants would state that it was not safe.
     Preliminary Analysis in MATLAB: Initial accelerometer results were smoothened by the
moving average filter in MATLAB and averaged over trials and subjects to calculate the mean of
the x-, y-, and z-axis data (Figure 10). It was observed that, for this work, z-axis data were not useful
and therefore not used for further processing. Moreover, engine rpm had an offset value when the
vehicle was started and changed from that reference and the variation reflected in the engine rpm
was also reflected in the speed and therefore rpm was not used for calculating behavior. The
accelerometer and OBD-II module data were analyzed to see the trend of driver behavior in relation
to the nature of the x and y-axis and speed data.

      Figure 10. Average x and y data to show (A) left/right movements and (B) acceleration/braking of
      the vehicle.
Sensors 2019, 19, 1563 11 of 18
Data Analysis in Mobile Phone: The mobile application used here to collect the vehicle data
from the OBD-II device and to store them temporarily in the mobile memory until they were
processed to make a decision (i.e., the x, y, and speed data) were buffered in the mobile memory.
The buffering duration was kept to 10 s to get enough data to observe the changes while not
cluttering the memory of the mobile phone. The algorithm of real-time peak detection is very robust
because it constructs a separate moving mean and deviation for the buffered data, such that signals
do not corrupt the threshold. Future signals are therefore identified with approximately the same
accuracy, regardless of the number of previous signals. The algorithm takes three inputs: lag
represents the lag of the moving window, threshold represents the z-score at which the algorithm
generates peak, and influence represents the influence (between 0 and 1) of new signals on the
mean and standard deviation. For example, a lag of 5 (moving window) will use the last five
observations to smooth the data. A threshold of 3.5 (estimated from MATLAB study) will signal if a
datapoint is 3.5 standard deviations away from the moving mean. In addition, an influence of 0.5
gives signals half of the influence that normal datapoints have. Likewise, an influence of 0 ignores
signals completely for recalculating the new threshold. An influence of 0 is therefore the most
robust option; putting the influence option at 1 is least robust.
In the mobile application, there were three subclasses: two for x and y data analysis and the
third for the speed data analysis. The subclasses for the x and y data analysis helped to identify the
peak of the x and y movements of the vehicle which, in turn, helped to identify normal and
abnormal behaviors of the driver, whereas the other subclass sent responses based only on speed
data. The filtered speed data were sent to another class, which made a decision based on speed, that
is, the vehicle was either in driving mode or stopped, and sent a callback to this class on the current
status. Based on the status of the vehicle, the control function started tracking or stopped tracking
and the calling function was also deactivated or activated. Figure 11 shows the detailed stages of
how the mobile application was designed to log normal or abnormal behavior.
Figure 11. Flowchart of the mobile application’s decision stages.Sensors 2019, 19, 1563 12 of 18
4. Results and Discussion
The outcomes of the different experiments are summarized in this section.
4.1. Summary of Pilot Study
Some important findings from the survey are presented below, and it is interesting to see that
55% of the survey participants had never had any accidents (from Figure 12A) and thus can be
considered as careful drivers. Their answers to the survey questions provided motivation for this
work and suggestions to improve the cases of accidents due to mobile phone use. Almost half of the
teenage drivers who had received their license within three to six years experienced accidents due
to their use of a mobile phone. It can be seen from the self-reported survey percentages shown in
the bar chart (Figure 12B) that the drivers were occupied with various activities using the mobile
phone during driving. This is one of the primary causes of accidents where the user gets distracted.
From Figure 12B, it is evident that 83% of the teenagers like to talk, while 66% of them like to text to
some extent while driving.
Figure 12. (A) Statistics of number of accidents and (B) results of some yes/no/sometimes questions
among the survey participants.
As shown in Figure 13A, the histogram shows that 100% of respondents believe that restricting
phone calls except for emergency family calls while driving is a very good idea. However, the
restriction of texting, gaming, or browsing was not considered a good idea by all the teenage
drivers, although those activities cause more distraction than calling. This clearly highlights the
driving behavior of the teenagers. In the same manner, Figure 13B shows that the young drivers
mostly do not agree that music can distract the driver, although this point is evident from different
research studies conducted in other regions. However, the majority of them agree that using and
inputting data to the navigator while driving distract the driver.
From Figure 14A, it was found that the majority of the survey participants believe that it is not
safe to drive while using a mobile phone or when sleepy/drowsy. It can be observed from the
self-reported survey percentages shown in the bar chart in Figure 14B that the drivers are occupied
with various dangerous activities during driving.Sensors 2019, 19, 1563 13 of 18
Figure 13. (A) Statistics for the questions on rating of restriction feature of the mobile app and (B)
using mobile phone.
Figure 14. (A) Statistics for the rating of safe to dangerous questions and (B) results for some very
often/never/sometimes questions among the survey participants.
The summary of the chi-squared distribution analysis [19] done on the data is shown in Table
2, where it is observed that such a system is needed for the welfare of drivers and that it is
important to raise awareness among teenage drivers in Qatar.
Table 2. Chi-Squared distribution results for two major survey questions.
Reject or Accept depending on
Question Prediction
Chi-Squared Distribution
Is it a good idea to restrict phone Almost all of them Accept, which is a good
calls to only emergency family should say that it is a motivation to the development of
contacts while driving? very good idea the prototype
Almost all of them Reject which is a good motivation
How safe or dangerous do you feel
should say that it is very to increase awareness about it
using mobile phone while driving?
dangerous among them.
Comparing the predictions with the actual response and then calculating the chi-squared value
of the difference between them and the tabular chi-squared value (for the sample data) for the first
question, it was found that the prediction should not be rejected (as the calculated chi-squared
value was less than the tabular chi-squared value). However, comparing the predictions with the
actual response for question two, it was found that the prediction had to be rejected (as the calculated
chi-squared value was more than the tabular chi-squared value).
4.2. Performance Evaluation of the PrototypeSensors 2019, 19, 1563 14 of 18
4.2.1. Studies 1 and 2
Initial results from the testing of the prototype module using the car emulator along with the
OBD-II module showed that the data packets received in the PC match the data sent from the
emulator without missing any packets. Moreover, the data sent from the controller to the mobile
application were also tested to evaluate their reliability. Figure 15 illustrates the real-car data (x, y,
z, speed, rpm) received reliably on the mobile application using Bluetooth communication.
Figure 15. Sample data packets received in the mobile application from real-car testing.
4.2.2. Study 3: Evaluation of the Driving Behavior
After a series of tests with teenage drivers using the hardware, it was found that there was a
specific threshold of the x data, y data, and x, y data combined from the accelerometer, which can
help in identifying the driving behavior. The application identified the sudden changes of the x
data to classify any changes above the pre-specified threshold to detect “Left”, “Right”, “Sharp
Right”, “Sharp Left”, and “U-Turn”. However, only two classes, namely, “Sharp Right” and “Sharp
Left”, were logged. Moreover, filtered y-axis data helped to classify normal and abnormal
acceleration and braking action. If the positive change exceeded the positive threshold, it was
classified as “Sudden Acceleration”, and if there was any negative change which occurred below
the negative threshold, it was classified as “Sudden Braking” and was logged.
Figure 16. (A) Average speed and (B) engine rpm for speed monitoring.
According to Figure 16, the speed increased over period number 1, whereas for period number
2 there was no significant change in speed and it remained almost stable. However, over period 3
the speed increased rapidly and reached its maximum value (40 km/h). Finally, over period 4 it
decreased sharply to its minimum value (zero km/h). Almost similar information was reflected
from the rpm data. This can be used to track excessive speeding behavior if the application is pre-
loaded with the speed limit of the particular street along with a global positioning system (GPS).Sensors 2019, 19, 1563 15 of 18
4.2.3. Study 4: Evaluation of the Phone Control, Data Logging, and Reporting
Figure 17 shows the Call, Message, Behavior and Application Usage Log Summary while
driving for several trials in a day and logged in the application (Tracking User Notification). For
example, the Call Log Summary notification shows the call type, Count, and Time of Event.
Moreover, the Message Log Summary notification shows the message type (Incoming and
Outgoing), the number of total messages, and the time.
Figure 17. Screenshot of report generated at the end of the day.
The most important implemented feature of the “Track User Application” mobile app is that it
checks the speed of the driver’s vehicle and, if the car speed goes above 10 km/h, it blocks the
mobile phone’s call feature. It blocks both the incoming and outgoing mobile calls. This feature was
tested on the desk using the OBD-II emulator and also during real driving scenarios. It was
observed that in all scenarios, this call blocking feature worked with 100% accuracy. The Call Log
Summary in Figure 17 shows that the user attempted to receive and make calls; however, the
person was not successful in making/receiving calls because of the enabled blocking feature.
However, the mobile application created logs of the incoming/outgoing call attempts in the report.Sensors 2019, 19, 1563 16 of 18
In the report, where the incoming and outgoing call timings were shown, the user was not able to
make/receive calls because of the call blocking feature. The Behavior Log Summary shows a
summary of some of the driving behavior for that particular day which included sudden left turn,
sudden right turn, sudden acceleration, and harsh braking as well as the date and time of the action.
This can clearly reflect driving behavior of a particular driver and can easily be modified to monitor
accidents as well. It is evident that thresholds help to populate driving behavior from the real-time
data. The output from the mobile application was sent to a pre-specified user via email. Moreover,
it shows the timing and use of different applications by the mobile user and, more importantly,
none of the user privacy data were shared.
5. Conclusions
This work proposed a portable solution to gather vehicle details from the ECU of a vehicle
through the OBD-II port and to send data to a mobile phone along with an on-board 3-DOF
accelerometer to detect driving behavior. The results from the test subjects show that this can be
potentially used to identify drivers’ abnormal behaviors. This abnormal driving behavior along
with continuous speed monitoring could be used in the mobile application to make decisions on
controlling mobile phone activity. The literature reviews and the surveys conducted with a group
of teenage drivers in Qatar support the need for such a portable solution. Most of the applications
available on the market share the contents of the text, email, or social media message while logging
the notifications, whereas our portable solution along with the tracking application does not share
any private data in the report, which improves the security of the user. Therefore, the proposed
system can be used as a robust system for monitoring the behavior of drivers and controlling them
to avoid emergencies. It is clear from the literature and the results of the conducted survey in this
work that teenage drivers are willing to stop using their mobile phone while driving. However,
incoming messages and calls encourage the user to respond in most of the scenarios and this was
observed in the behavior report from the proposed system. The authors therefore consider that
significant media awareness through different forms of social media activities along with
government and law enforcement involvement (e.g., seat-belt usage enforcement) should be put in
place to avoid the life-threatening use of mobile phones while driving. In the future, we plan to add
collision detection based on the accelerometer data and the enforcement of Bluetooth for the mobile
phone turning-on feature. The system can be modified to allow the user to drive only when
Bluetooth is on, thereby enabling the tracking. Further investigation is needed for real-time
monitoring of driving behavior, where the system is deployed in several vehicles and monitored for
a longer duration to truly benefit from this research.
Author Contributions: Experiments were designed by A.K., M.C.; Experiments were performed by
A.D.,M.M.; Results were analyzed by A.K.,M.C.,R.D.,N.E. and D.M.; All authors were involved in
interpretation of data and paper writing.
Funding: The publication of this article was funded by the Qatar National Library.
Conflicts of Interest: The authors declare no conflict of interest. The funders had no role in the
design of the study; in the collection, analyses, or interpretation of data; in the writing of the
manuscript, or in the decision to publish the results
Appendix ASensors 2019, 19, 1563 17 of 18
Figure A1. Survey questionnaire.
References
1. Shabeer, H.A.; Banu, R.W.; Zubar, H.A. Technology to prevent mobile phone accidents. Int. J. Enterp.
Netw. Manag. 2012, 5, 144–155.
2. Guo, F.; Klauer, S.G.; Fang, Y.; Hankey, J.M.; Antin, J.F.; Perez, M.A.; Lee, S.E.; Dingus, T.A. The effects of
age on crash risk associated with driver distraction. Int. J. Epidemiol. 2017, 46, 258–265.
3. Ayers, J.W.; Leas, E.C.; Dredze, M.; Allem, J.-P.; Grabowski, J.G.; Hill, L. Pokémon GO—A new
distraction for drivers and pedestrians. JAMA Intern. Med. 2016, 176, 1865–1866.Sensors 2019, 19, 1563 18 of 18
4. Burns, P.; Parkes, A.; Burton, S.; Smith, R.; Burch, D. How Dangerous Is Driving with a Mobile Phone?:
Benchmarking the Impairment to Alcohol; TRL: Wokingham, UK, 2002; Volume 547.
5. Oviedo-Trespalacios, O.; Haque, M.M.; King, M.; Washington, S. Understanding the impacts of mobile
phone distraction on driving performance: A systematic review. Transp. Res. Part C Emerg. Technol. 2016,
72, 360–380.
6. Coxon, K.; Keay, L. Behind the wheel: Community consultation informs adaptation of safe-transport
program for older drivers. BMC Res. Notes 2015, 8, 764.
7. Drews, F.A.; Pasupathi, M.; Strayer, D.L. Passenger and cell phone conversations in simulated driving.
J. Exp. Psychol. Appl. 2008, 14, 392.
8. Lee, J.D. Technology and teen drivers. J. Saf. Res. 2007, 38, 203–213.
9. Hassan, H.M. Investigation of the self-reported aberrant driving behavior of young male Saudi drivers: A
survey-based study. J. Transp. Saf. Secur. 2016, 8, 113–128.
10. Danaf, M.; Hamdar, S.H.; Abou-Zeid, M.; Kaysi, I. Comparative assessment of driving behavior at
signalized intersections using driving simulators. J. Transp. Saf. Secur. 2018, 10, 124–158.
11. Gershon, P.; Zhu, C.; Klauer, S.G.; Dingus, T.; Simons-Morton, B. Teens’ distracted driving behavior:
Prevalence and predictors. J. Saf. Res. 2017, 63, 157–161.
12. Cen, J.; Wang, Z.; Wang, C.; Liu, F. A System Design for Driving Behavior Analysis and Assessment. In
Proceedings of the 2016 IEEE International Conference on Internet of Things (iThings) and IEEE Green
Computing and Communications (GreenCom) and IEEE Cyber, Physical and Social Computing
(CPSCom) and IEEE Smart Data (SmartData), Chengdu, China, 15–18 December 2016; pp. 882–887.
13. Liu, T.; Yang, Y.; Huang, G.-B.; Yeo, Y.K.; Lin, Z. Driver distraction detection using semi-supervised
machine learning. IEEE Trans. Intell. Transp. Syst. 2016, 17, 1108–1120.
14. He, J.; Choi, W.; McCarley, J.S.; Chaparro, B.S.; Wang, C. Texting while driving using Google Glass™:
Promising but not distraction-free. Accid. Anal. Prev. 2015, 81, 218–229.
15. Fazeen, M.; Gozick, B.; Dantu, R.; Bhukhiya, M.; González, M.C. Safe driving using mobile phones. IEEE
Trans. Intell. Transp. Syst. 2012, 13, 1462–1468.
16. Lu, D.-N.; Nguyen, D.-N.; Nguyen, T.-H.; Nguyen, H.-N. A Novel Mobile Online Vehicle Status
Awareness Method Using Smartphone Sensors. In Information Science and Applications; Springer:
Singapore,2017;pp. 30–37.
17. Lu, S.-N.; Tseng, H.-W.; Lee, Y.-H.; Jan, Y.-G.; Lee, W.-C. Intelligent safety warning and alert system for
car driving. Tamkang J. Sci. Eng. 2010, 13, 395–404.
18. Oviedo-Trespalacios, O.; King, M.; Vaezipour, A.; Truelove, V. Can our phones keep us safe? A content
analysis of smartphone applications to prevent mobile phone distracted driving. Transp. Res. Part F Traffic
Psychol. Behav. 2019, 60, 657–668.
19. Delgado, M.K.; McDonald, C.C.; Winston, F.K.; Halpern, S.D.; Buttenheim, A.M.; Setubal, C.; Huang, Y.;
Saulsgiver, K.A.; Lee, Y.C. Attitudes on technological, social, and behavioral economic strategies to
reduce cellphone use among teens while driving. Traffic Inj. Prev. 2018, 19, 569–576.
20. Ajzen, I. Constructing a TPB questionnaire: Conceptual and methodological considerations. 2002.
Available online: http://chuang.epage.au.edu.tw/ezfiles/168/1168/attach/20/pta_41176_7688352_57138.pdf
(accessed on 28 March 2019).
21. Lancaster, H.O.; Seneta, E. Chi-square distribution. Encycl. Biostzatistics 2005, 2,
doi:10.1002/0470011815.b2a15018.
© 2019 by the authors. Licensee MDPI, Basel, Switzerland. This article is an open access
article distributed under the terms and conditions of the Creative Commons Attribution
(CC BY) license (http://creativecommons.org/licenses/by/4.0/).You can also read