INVESTMENT THESIS FOR MICRON TECHNOLOGY, INC (NASDAQ: MU) - Studies in Applied Finance
←
→
Page content transcription
If your browser does not render page correctly, please read the page content below
SAF/No.25/June 2018

          Studies in Applied Finance

         INVESTMENT THESIS FOR
        MICRON TECHNOLOGY, INC
              (NASDAQ: MU)

                           Kenneth-Von Blackmon

Johns Hopkins Institute for Applied Economics,
   Global Health, and the Study of Business
                  Enterprise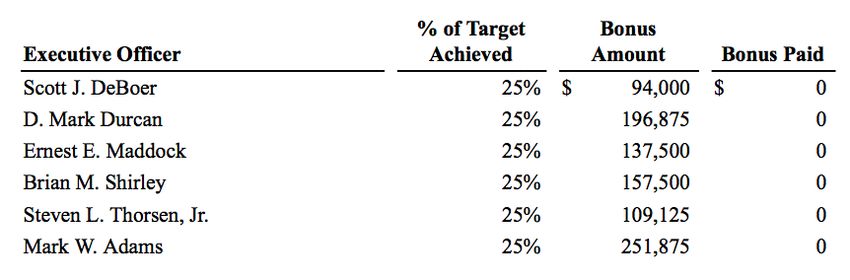
Investment Thesis for Micron Technology, Inc.
                      (NASDAQ: MU)
                                  By Kenneth-Von Blackmon

Disclaimer: These research reports are primarily student reports for academic purposes and are
not specific recommendation to buy or sell a stock. Potential investors should consult a
qualified investment advisor before making any investment. This study was completed on
October 5, 2017.

                                         About the Series
The Studies in Applied Finance series is under the general direction of Professor Steve H. Hanke
(hanke@jhu.edu), Co-Director of The Johns Hopkins Institute of Applied Economics, Global
Health, and the Study of Business Enterprise, and Dr. Chris Culp (christopher.culp@jhu.edu) and
Dr. Hesam Motlagh (hnekoor1@jhu.edu), Fellows at the Institute for Applied Economics, Global
Health, and the Study of Business Enterprise.

This working paper is one in a series on Applied Financial Economics, which focuses on
company valuations. The authors are mainly students at The Johns Hopkins University in
Baltimore who have conducted their work at the Institute as undergraduate equity researcher
analysts.

                                            Author
Kenneth-Von Blackmon (kennethlblackmon@gmail.com) is an undergraduate of The Johns
Hopkins University with a major in Economics and a minor Accounting & Financial
Management. He conducted the research for this paper while serving as an undergraduate
equity research analyst at The Johns Hopkins Institute for Applied Economics, Global Health,
and the Study of Business Enterprise during the Fall of 2017.

                                     Acknowledgements
Many thanks to Prof. Steve H. Hanke and Dr. Hesam Motlagh for his guidance and draft
comments. A special thanks to Shiv Krishnan for his inspiration.

Keywords: MU, Micron, Technologies, Semi-Conductors, Discounted Cash Flow, Free Cash Flow,
Monte-Carlo Simulations, Investment Thesis, Compensation.
Investment Thesis for Micron Technology, Inc. (NASDAQ: MU) by Kenneth-Von Blackmon

     Rating: BUY – Average Free Cash Flow per Share $63.83:

              Company Name                            Micron Technology, Inc.
              Date                                             10/5/17
              Fiscal year ends (current period)      08/2017 (Q4 - Ends 8/2017)
              Current Price                                     $39.37
              52 week high (date)                         $40.54 (10/03/17)
              52-week low (date)                          $16.17 (10/13/16)
              Market Cap                                     $ 43,860 M
              Enterprise Value                                $49,798 M
              Total Debt                                     $ 11,134 M
              Cash                                            $ 6,045 M
              Total Debt/Enterprise Value                      22.36%
              Dividend                            Cash Dividend Discontinued (1996)
              Shares Outstanding/Float                   1,114.1 M/1,063.5M
              Current P/E                                        8.70x
              2019 P/E (EPS)                                6.17x ($6.38)*
              2018 P/E (EPS)                                5.31x ($7.42)*
              2017 P/E (EPS)                                8.31x ($4.74)*
              2016 EPS                                         $0.06**
              2015 EPS                                         $2.72**
              2014 EPS                                         $2.52**
                              *Consensus Estimates as of 10/5/2017
                              ** Comparable Actual from Bloomberg

                                                                                      1
Investment Thesis for Micron Technology, Inc. (NASDAQ: MU) by Kenneth-Von Blackmon
Table of Contents
Rating: BUY – Average Free Cash Flow per Share $63.83: .......................................................... 1
Executive Summary.................................................................................................................... 3
Catalysts and Risks ..................................................................................................................... 3
Catalysts ............................................................................................................................................. 3
Risks ................................................................................................................................................... 3
Company Description and Historical Performance .................................................................... 4
History of Innovation .......................................................................................................................... 4
Micron’s Business Segments ............................................................................................................... 5
Historical Stock Price Performance ..................................................................................................... 7
Model Assumptions ................................................................................................................. 10
Balance Sheet and Income Statement Trends and Highlights ........................................................... 10
The Balance Sheet ........................................................................................................................ 10
Micron’s Debt Outlook .................................................................................................................. 11
The Income Statement .................................................................................................................. 14
Value Drivers (P-DCF) Tab................................................................................................................. 15
Model Results .......................................................................................................................... 17
Proxy Findings .......................................................................................................................... 19
Executive Management (the “Named Executive Officers”)............................................................... 19
Management Compensation ............................................................................................................ 19
Outlook of Management Compensation ....................................................................................... 19
Base Compensation (Salary) .......................................................................................................... 20
Short-Term Incentives................................................................................................................... 21
Long-Term Incentives.................................................................................................................... 22
Compensation Peer Group ............................................................................................................ 23
Dividends.......................................................................................................................................... 24
Holders ............................................................................................................................................. 24
Insiders Transactions ........................................................................................................................ 25
Conclusions .............................................................................................................................. 26
General References .................................................................................................................. 27
2Investment Thesis for Micron Technology, Inc. (NASDAQ: MU) by Kenneth-Von Blackmon
Executive Summary
Micron Technology, Inc. (NASDAQ: MU) is a producer of semiconductors based out of Boise,
Idaho. With its focus on innovative dynamic random-access memory (DRAM) and non-volatile
flash storage (NAND or NOR) products, Micron has been instrumental in developing today’s
technological age. Although innovative in its production of memory solutions, Micron has
struggled to maintain its growth and market share as compared to its competitors. With
Micron’s recent acquisitions and the currently tight semiconductor market, we believe the
company has turned a new leaf in its market positioning. In an effort to analyze the outcome
and longevity of Micron’s innovation and expansion, we have evaluated the Company’s
historical financials by studying the most recent 10-K report of September 2016, DEF 14A of
January 2016, 10-Q of June 2017, and Q4 2017 Earnings Call of September 2017. Using a
Probabilistic Discounted Cash Flow (PDCF) Model coupled with Monte Carlo simulations, we
determined the fundamental value for Micron. Through our analysis, we have concluded that
Micron’s discounted cash flow value is $63.83—a 62% upside against Micron’s currently trading
share price of $39.37. Therefore, we have rated MU a BUY.
Catalysts and Risks
Catalysts
• At present, the semiconductor market is tight, with demand outpacing industry
supply, and average selling prices per bit rising
• Micron’s acquisitions will aid in manufacturing and guaranteeing supplies of
semiconductor memory solutions to its clients
• The growing multitude of market demand for memory and flash storage, especially
within next generation technology, will result in larger contracts within Micron’s
smaller business segments
Risks
• Future declines in the average product sales prices for the semiconductor market
could negatively affect Micron’s gross margins
• Failure to maintain DRAM and NAND production due to restructuring after
acquisitions could hinder Micron’s growth and negatively affect its ability to meet
supply obligations
• Debt obligations could adversely affect the financial outlook of Micron if they are not
able to generate sufficient cash flows on a long-term basis to pay down debt, finance
operations, and continue their capital investments
3Investment Thesis for Micron Technology, Inc. (NASDAQ: MU) by Kenneth-Von Blackmon
Company Description and Historical Performance
History of Innovation
In 1978, Micron, the brainchild of Ward Parkinson, Joe Parkinson, Dennis Wilson, and Doug
Pitman, was founded in the basement of a dental office in Boise, Idaho. Originally a
semiconductor design consulting group, in 1979 it tasked its engineers to develop a smaller,
faster 64K DRAM, that would beat out existing industry products. With its innovation of the 64K
DRAM design, Micron transitioned from a consulting company to a manufacturer. In 1981,
Micron produced its first 64K DRAM product, found in many of the first mass-produced
personal computers of the decade.
Making a splash in the industry, Micron did not stop there with its innovative efforts: in 1984,
Micron developed the world’s smallest 256K DRAM chip, and in 1988 brought 1Mb DRAM to
market.1 Coming out of 1999, Micron set the standard for data, producing the industry’s first
double data rate (DDR) chipset.
Approaching the 2000s, Micron continued to push industry standards while expanding the
application of its technology. With its unveiling of pseudo-static SRAM in 2004 (the basis for
today’s DRAM products featured in many mobile devices), 16GB DDR2 in 2006 (the world’s
highest-density server memory module), Micron Ships RealSSD™ C300 in 2009 (the industry’s
fastest client SSD for notebooks and desktop computers), and 16nm NAND flash device in 2013
(with a single 300mm wafer delivering almost 6TB of storage), Micron has grown leaps and
bounds since its semiconductor consulting days.2 For over 35 years, Micron has been a leader in
the industry’s significant technological advancements.
At present, Micron is confident in its combined efforts with Intel to revolutionize the industry
again with its innovative 3D NAND and 3D XPoint technology. This next generation tech
promises non-volatile memory storage 1,000 times faster than conventional NAND with 1,000
times greater endurance. 3
Micron is one of the world’s leading manufacturers of cutting-edge semiconductor
technologies, with operations in 18 countries and over 26,000 patents. Holding the industry’s
broadest memory solutions portfolio, Micron continues to expand the application of its
products further by offering memory solutions for the latest innovative technologies, “bringing
new life to data, and bringing new data to life.”4
1
Micron’s 1Mb DRAM became the staple for main PC memory and graphics cards during through the 1990s.
2
Micron Technology, Inc. (2017). History of Innovation. Retrieved September 28, 2017, from
https://www.micron.com/about/our-innovation
3
Micron Technology, Inc. (2017). History of Innovation. Retrieved September 28, 2017
4
Micron Technology, Inc. (2017). About. Retrieved September 28, 2017, from https://www.micron.com/about
4Investment Thesis for Micron Technology, Inc. (NASDAQ: MU) by Kenneth-Von Blackmon
Micron’s Business Segments
Although the business itself has two overarching product segments, dynamic random-access
memory (DRAM) and non-volatile flash storage (NAND and NOR), Micron reports in five
business segments reflecting different end-markets:
1. Compute and Networking Business Unit (“CNBU”):
a. Products: DRAM and NOR Flash
b. Market Application and Sales: Compute, Networking, Graphics, and Cloud Server
c. Accounted for 36.5% of Micron’s Revenues in 2016
2. Storage Business Unit (“SBU”):
a. Products: NAND Flash components and SSDs
b. Market Application and Sales: Enterprise and Client Storage, Cloud Storage, and
Removable Storage
c. Accounted for 26.31% of Micron’s Revenues in 2016
3. Mobile Business Unit (“MBU”):
a. Products: DRAM, NAND Flash, and NOR Flash
b. Market Application and Sales: Smartphone, Feature Phone and Tablet Mobile-
Device Market
c. Accounted for 20.72% of Micron’s Revenues in 2016
4. Embedded Business Unit (“EBU”):
a. Products: DRAM, NAND Flash and NOR Flash
b. Market Application and Sales: Automotive, Industrial, Home and Consumer
Electronics
c. Accounted for 15.64% of Micron’s Revenues in 2016
5. Other
a. Accounted for 0.81% of Micron’s Revenues in 2016
An inspection of the Company’s revenue generation by segment reveals that most segments
have grown (see Table 1). But what is not immediately evident is that some of Micron’s organic
growth potential has been stunted by increasing manufacturing costs and declining average
sales prices per gigabyte leading into 2016. Continuing its mission to provide innovative
memory solutions, Micron has had to replace fabrication machinery, restructure manufacturing
facilities, and increase its investment in Research and Development—all key components of
growth required in the already extremely capital-intensive business of semiconductor
manufacturing. Not surprisingly, Micron has doubled down and enhanced its ability to grow by
engaging in acquisitions.
5Investment Thesis for Micron Technology, Inc. (NASDAQ: MU) by Kenneth-Von Blackmon
Table 1: Micron’s Revenue Mix and Segment Growth
Fiscal Year 2012 2013 2014 2015 2016
Net Sales by Business Unit (USD ($) in Millions)
Compute and Networking Business Unit ("CNBU") 2,667 3,462 7,333 6,725 4,529
Revenue Growth Rate (%) 29.81% 111.81% -8.29% -32.65%
Margin on Net Sales 32.39% 38.16% 44.83% 41.53% 36.53%
Storage Business Unit ("SBU") 2,842 2,824 3,480 3,687 3,262
Revenue Growth Rate (%) -0.63% 23.23% 5.95% -11.53%
Margin on Net Sales 34.52% 31.13% 21.27% 22.77% 26.31%
Mobile Business Unit("MBU") 1,176 1,214 3,627 3,692 2,569
Revenue Growth Rate (%) 3.23% 198.76% 1.79% -30.42%
Margin on Net Sales 14.28% 13.38% 22.17% 22.80% 20.72%
Embedded Business Unit ("EBU") 1,097 1,275 1,774 1,999 1,939
Revenue Growth Rate (%) 16.23% 39.14% 12.68% -3.00%
Margin on Net Sales 13.32% 14.05% 10.84% 12.35% 15.64%
All Other 452 298 144 89 100
Revenue Growth Rate (%) -34.07% -51.68% -38.19% 12.36%
Margin on Net Sales 5.49% 3.28% 0.88% 0.55% 0.81%
Total Net Sales 8,234 9,073 16,358 16,192 12,399
Calculated Growth Rate (%) 10.19% 80.29% -1.01% -23.43%
The following table is meant to show the uneven and at times augmented growth Micron has experienced due to its
acquisitions of the Elpida Memory, Inc. and controlling interest in Rexchip (completed in 2013), now known as
Micron Memory Japan (MMJ), and most recently Inotera Memories, Inc. in 2016.
Source: Micron’s SEC-10K
The positive growth impact on Micron’s revenues as a result of the acquisitions of Elpida
Memory Inc. and controlling interest of Rexchip (now known as “Micron Memory Japan” or
“MMJ”) can be seen in Table 1. Revenue growth skyrocketed in 2014 after the completion of
the MMJ acquisition in the year before due to greater manufacturing capabilities and higher
gross margins. But, this augmented growth could not be sustained in 2015, as the
semiconductor market experienced a dive in average sales prices per gigabyte and slowing
personal computer (PC) sales that heavily impacted the Company’s gross margins.5 As a result,
in the midst of restructuring and implemented cost cutting efforts, Micron produced miniscule
results in 2016 across all segments. Yet, within the same year, the Company announced the
acquisition of its 7 year-long partner, Inotera.
It is important to note that Micron’s business segments do not directly compete with one
another. As defined in the business segment breakdown, Micron produces DRAM, NAND, and
NOR memory solutions that although similar in fabrication, whether for enterprise or consumer
intended use, are applicable to many different technologies available on the market. As such,
Micron’s segmentation is meant not only to delineate each aspect of revenue generation but
5
Zacks (2015). “AMD Slumps as Micron Results Show Weakness in PC Market,” Retrieved on September 28, 2017
from https://www.zacks.com/stock/news/180011/amd-slumps-as-micron-results-show-weakness-in-pc-market
6Investment Thesis for Micron Technology, Inc. (NASDAQ: MU) by Kenneth-Von Blackmon
also to describe the current market for the Company’s semiconductor products and their
applicable usage.
Historical Stock Price Performance
Over the past 5 years, Micron’s stock performance has been anything but steady, reflecting the
cyclical nature of the business. Figure 1 compares Micron against the S&P 500, showing the
Company’s unsteady and dismal performance through 2015.
Figure 1: Micron’s Stock Price vs. S&P 500 Index
From December 5, 2014, to May 5, 2015, Micron’s share price fell 73.8%. At present, MU is trading at $39.56, and
has made a comeback from its 2015 slump.
Source: Bloomberg Terminal, Command: , Accessed 10/05/2017
Reaping the benefits of its 2013 acquisition of Elpida Memory, Inc. and controlling interest in
Rexchip (now known as MMJ), Micron was able to drive their share price up to $36.49 (as of
December 5, 2014). This $949 million-dollar cash acquisition (excluding Micron’s assumption
and reorganization plan of MMJ’s debt obligations exceeding 200 billion yen, roughly $1.7
billion U.S. Dollars) provided a short-term growth spurt followed by high reorganization and
restructuring costs. Micron experienced a doubling in net sales generated from its Compute and
Networking business unit and a tripling of net sales in its Mobile business unit, but the
7Investment Thesis for Micron Technology, Inc. (NASDAQ: MU) by Kenneth-Von Blackmon
Company was unequipped to maintain such growth. Coupled with the personal computer (PC)
slump of 2015 and price wars with competing firms, Micron proved unable to lower
manufacturing costs quick enough as compared to its competitors, leading to a 73.8% drop in
its share price.6
On December 14, 2015, with shares at $13.66 after closing, Micron announced its acquisition of
Inotera, its partner for seven years, for approximately $3.2 billion.7 Although Micron’s share
price would continue to fall 5 months after the acquisition announcement, Micron’s actions
coupled with the development of its 3D NAND and 3D XPoint technology in 2015 would turn a
new leaf; the impact of DRAM output, acquired fabrication facilities, and frontier technology
allowed the Company to pull itself out of its slump and raise its share price significantly.
Micron is currently trading at $39.56, aided by strong industry growth. Overall, the
semiconductor industry grew by 6.1% in the second quarter of 2017, with the memory
solutions market growing by 10.7% within the same period. Reaching a new high of $30.2 billion
attributable to the rise in DRAM (at 14% growth) and NOR flash memory (at 12.3% growth), the
growth within the memory solutions has propelled the semiconductor industry.8 With average
selling prices on the rise with market supply and demand remaining tight, Micron, by way of
acquisitions and manufacturing growth, has positioned itself to make a splash in fiscal 2018.
The company beat expectations in fourth quarter earnings released September 26, 2017,
posting $2.02 EPS against the expected $1.83 EPS.9 The present analyst recommendations (see
Figure 2) have an average twelve-month target market price of $49.06, representing the bullish
sentiment of the market.
6
Micron Technology, Inc. (2016). 2016 Form 10-K. Retrieved September 28, 2017 from
https://www.sec.gov/Archives/edgar/data/723125/000072312516000269/a2016q4.htm
7
Micron Technology, Inc. (2017). Micron Technology Agrees to Acquire Remaining Interest in Inotera Memories of
Taiwan. Retrieved September 28, 2017, from http://investors.micron.com/releasedetail.cfm?releaseid=946777
8
EPS News (2017). “Semiconductor Sales Hit Record Growth,” Retrieved October 4, 2017 from
https://epsnews.com/2017/09/15/semiconductor-sales-hit-record-growth-q2/
9
CNBC News (2017). “Micron shares rise after earnings beat,” Retrieved October 5, 2017 from
https://www.cnbc.com/2017/09/26/micron-earnings-q4-2017.html
8Investment Thesis for Micron Technology, Inc. (NASDAQ: MU) by Kenneth-Von Blackmon
Figure 2: Analyst Recommendations for Micron
Source: Bloomberg Terminal, Command: , Accessed 10/05/2017
9Investment Thesis for Micron Technology, Inc. (NASDAQ: MU) by Kenneth-Von Blackmon
Model Assumptions
In an effort to determine the fundamental value of Micron, we incorporated our industry
discussion with a Probabilistic Discounted Cash Flow (PDCF) Model, which forecasts the cash
flows explicitly for the next 10 years. Our PDCF is based on historic averages for revenue
growth, cost structure, working capital, and capital expenditures. Our assumptions deviated
from historical averages when these averages failed to account for heavy swings in revenues or
costs, or when management provided guidance that explicitly delineated the path of Micron’s
future expenditures.
For Micron, the delineated business segments were used as the basis for forecasting revenue
growth while taking into the account the market climate and management guidance.
Balance Sheet and Income Statement Trends and Highlights
Full results are contained in the ‘Balance Sheet’ and ‘Income Statement’ tabs of the
accompanying spreadsheet.
The Balance Sheet
Figure 3: Micron’s Consolidated Balance Sheet – Assets
5-Years of 10-K's
Consolidated Balance Sheets - USD ($) $ in Millions Aug. 30, 2012 Aug. 29, 2013 Aug. 28, 2014 Sep. 03, 2015 Sep. 01, 2016
Assets
Current Assets:
Cash and equivalents $2,459 $2,880 $ 4,150 $ 2,287 $ 4,140
Short-term investments 100 221 384 1,234 258
Receivables 1,289 2,329 2,906 2,507 2,068
Inventories 1,812 2,649 2,455 2,340 2,889
Restricted Cash 0 556 0 0 0
Other current assets 98 276 350 228 140
Total Current Assets 5,758 8,911 10,245 8,596 9,495
Long-Term Assets:
Long-term marketable investments 374 499 819 2,113 414
Property, plant, and equipment, net 7,103 7,626 8,682 10,554 14,686
Equity method investments 389 396 971 1,379 1,364
Intangible assets, net 371 386 468 449 464
Deferred tax assets 47 861 816 597 657
Goodwill 0 0 0 0 104
Other noncurrent assets 286 439 415 455 356
Total Long-Term Assets 8,570 10,207 12,171 15,547 18,045
Total Assets 14,328 19,118 22,416 24,143 27,540
Source: Micron’s 10-K Consolidated Financial Statements
Upon reviewing the balance sheet there is clear evidence of Micron’s recent acquisitions and
increase in debt in 2014 (see Figure 3 & 4). With uneven cash and cash equivalents from 2013
through 2016, Micron recorded $4 billion in cash and equivalents in 2014 as a result of sales
growth through the acquisition of DRAM and NAND from Elpida Memory, Inc., and controlling
interest in Rexchip (collectively now known as MMJ). Micron notes in its 2014 10-K that its
stated increase in cash and equivalents was placed towards investments in an effort to mitigate
credit risks associated with foreign subsidiaries and their holdings of cash and cash equivalents
in both USD and foreign currency.
10Investment Thesis for Micron Technology, Inc. (NASDAQ: MU) by Kenneth-Von Blackmon
Figure 4: Micron’s Consolidated Balance Sheet – Liabilities & Equity
5-Years of 10-K's
Consolidated Balance Sheets - USD ($) $ in Millions Aug. 30, 2012 Aug. 29, 2013 Aug. 28, 2014 Sep. 03, 2015 Sep. 01, 2016
Liabilities
Current Liabilities:
Accounts payable and accrued expenses 1,641 2,115 2,864 2,611 3,879
Deferred income 248 243 309 205 200
Equipment purchase contracts 130 182 0 0 0
Current debt (Current portion of long-term debt - 2013
224 1,585 1,618 1,089 756
last)
Total Current Liabilities 2,243 4,125 4,791 3,905 4,835
Long-term Liabilities:
Long-term debt 3,038 4,452 4,893 6,252 9,154
Other noncurrent liabilities 630 535 1,102 698 623
Total Long-Term Liabilities 3,668 4,987 5,995 6,950 9,777
Total liabilities 5,911 9,112 10,786 10,855 14,612
Shareholders’ Equity
Redeemable convertible notes $0 $0 $ 68 $ 49 $0
Common stock, $0.10 par value, 3,000 shares authorized,
1,094 shares issued and outstanding (1,084 as of September 102 104 107 108 109
3, 2015)
Additional capital 8,920 9,187 7,868 7,474 7,736
Retained earnings (/Accumulated Deficit) (1,402) (212) 2,729 5,588 5,299
Treasury stock, 4 shares held (54 as of September 1, 2016) 0 0 0 (881) (1,029)
Accumulated other comprehensive income (loss) 80 63 56 13 (35)
Total Micron shareholders' equity 7,700 9,142 10,760 12,302 12,080
Non-controlling interests in subsidiaries 717 864 802 937 848
Total equity 8,417 10,006 11,562 13,239 12,928
Total liabilities and equity 14,328 19,118 22,416 24,143 27,540
Source: Micron’s 10-K Consolidated Financial Statements
In lock step with the influx of cash and investments, Property, Plant and Equipment over past
five years grew steadily at average rate of 20%. Further down the statement, long-term debt
also grows at an average of 33% to keep up with acquisition costs and set Micron on the course
for further growth as seen in 2014 and at the present time.
Micron’s Debt Outlook
With our evaluation and focus on probability of return on our investment, we believe it is
important to review Micron’s debt schedule (see Figure 5) and credit rating (see Figure 6), as
their inability to make principal and interest payments on the debt could adversely affect
operations of the business and drive a decline in share price.
11Investment Thesis for Micron Technology, Inc. (NASDAQ: MU) by Kenneth-Von Blackmon
Figure 5: Micron’s Debt Outlook
Source: Bloomberg Terminal, Command: , Accessed 10/05/2017
Looking at the total outstanding debt to date, we see that Micron is expected to pay down over
$12 billion in debt over a weighted average of the next 8 years (see Figure 5). Financing its
acquisitive growth by bond issuances and cash payments, the Company has grown its
outstanding debt balance of the last five years. In 2016 alone, Micron issued $1.25 billion in
2023 Secured Notes and $750 million of its 2022 Term Loan B in order to help facilitate the
payments of what was then the proposed acquisition of Inotera. Along with foreign debt,
including a loan of up to $80 billion New Taiwan Dollars (equivalent to roughly $2.5 billion U.S.
dollars) under a single draw term loan facility held by Nanya Technology (former co-owner of
Inotera), Micron is well under pressure to meet its debt obligations.
Reviewing the Company’s credit history, we find that Micron has by-in-large been rated below
investment grade (see Figure 6). But, recent company earnings as well as management
guidance towards a lowering debt to $8 or $9 billion during fiscal 2018 has spurred some
positive outlook on Micron’s rating. Moody’s, in particular, affirmed its positive outlook mid-
September, citing management’s debt reduction plans and Micron’s “strong market position in
12Investment Thesis for Micron Technology, Inc. (NASDAQ: MU) by Kenneth-Von Blackmon
the memory business, low debt to EBITDA (Moody's adjusted), and large cash and marketable
investments balances” as motivation.10
Figure 6: Micron’s Credit Rating
Source: Bloomberg Terminal, Command: , Accessed 10/05/2017
In accordance with our projected Free Cash Flows (FCF) and management’s guidance towards
delevering the company, we believe Micron’s debt outlook and credit rating should not be of
immediate concern to potential investors. Based on our findings, Micron will generate enough
free cash flow in fiscal 2018 to pay down its debts in accordance with Management’s guidance,
and should be able refinance its debt obligations in the near future if necessary. But, we do
caution that if the company were to continue financing its acquisitions and operations by way
of debt issuances into the long-term, Micron could face debt obligations greater than their FCF.
Indeed, if a large share of Micron’s debt fell on a year with performance results similar to 2016
(which is possible within the volatile and cyclical semiconductor market), Micron would face a
harsher reality than just necessitated cost cutting measures, restructuring, and missed earnings.
10
Moody’s Investor Services (2017). “Rating Action: Moody’s affirms Microns Ba2 CFR; outlook positive,” retrieved
October 5, 2017 from https://www.moodys.com/research/Moodys-affirms-Microns-Ba2-CFR-outlook-positive--
PR_372639
13Investment Thesis for Micron Technology, Inc. (NASDAQ: MU) by Kenneth-Von Blackmon
The Income Statement
Upon reviewing the Income statement, we see further evidence of Micron’s growth (see Figure
7). Again, after the acquisition of Elpida Memory, Inc., and controlling interest in Rexchip,
collectively now known as MMJ, Micron experienced an augmented result in net sales to the
tune of $16 billion in 2014, and carried a similar result into 2015. Notes within the 2016 10-K
include that Micron had acquired 2 wafer fabrication facilities focused on mobile DRAM and
computing DRAM, and an additional assembly and testing facility, which aided Micron’s output
for boosting sales in 2014 and 2015. But, what must be kept in mind are the restructuring costs
associated with newly acquired facilities. Indeed, one of Micron’s greatest risks in its acquisition
process are the costs associated with restructuring, an action Micron is not new to.11
Figure 7: Micron’s Income Statement
Consolidated Statements of Operations - USD ($) $ in Millions, except share data
5-Years of 10-K's
Sep. 03,
Sep. 01, 2016
Income Statement [Abstract] Aug. 30, 2012 Aug. 29, 2013 Aug. 28, 2014 2015
Revenue:
Net sales $8,234 $9,073 $ 16,358 $ 16,192 $ 12,399
Cost of goods sold 7,266 7,226 10,921 10,977 9,894
Total Revenue (Gross margin) $968 $1,847 $5,437 $5,215 $2,505
Operating Expenses:
Selling, general, and administrative 620 562 707 719 659
Research and development 918 931 1,371 1,540 1,617
Restructure and asset impairments 10 126 40 3 67
Other operating (income) expense, net 32 (8) 232 (45) (6)
Operating income (loss) (612) 236 3,087 2,998 168
Other Income:
Gain on MMJ Acquisition 0 1,484 0 0 0
Interest income 8 14 23 35 42
Interest expense (179) (231) (352) (371) (437)
Other non-operating income (expense), net 29 (218) (25) (53) (54)
Income (loss) before income taxes, net income (loss)
attributable to non-controlling interests, and equity in (754) 1,285 2,733 2,609 (281)
net income (loss) of equity method investees
Income tax (provision) benefit 17 -8 (128) (157) (19)
Equity in net income (loss) of equity method investees -294 -83 474 447 25
Net income (loss) (1,031) 1,194 3,079 2,899 (275)
Net income (loss) attributable to non-controlling interests (1) (4) (34) 0 (1)
Net income (loss) attributable to Micron (1,032) 1,190 3,045 2,899 (276)
Source: Micron’s 10-K Consolidated Financial Statements
11
CNBC New (2016). “Micron stock sinks amid company restructuring,” Retrieved October 5, 2017, from
https://www.cnbc.com/2016/07/01/micron-stock-sinks-amid-company-restructuring.html
14Investment Thesis for Micron Technology, Inc. (NASDAQ: MU) by Kenneth-Von Blackmon
Value Drivers (P-DCF) Tab
These results are contained in the “Value Drivers” and “P-DCF TUNED” tabs of the
accompanying spreadsheet.
To determine Micron’s historical performance, we derived the historical margins for Micron
and determined drivers of value within the company. We noted points of Micron’s efficiencies
and followed management’s guidance towards the outlook of the semiconductor industry.
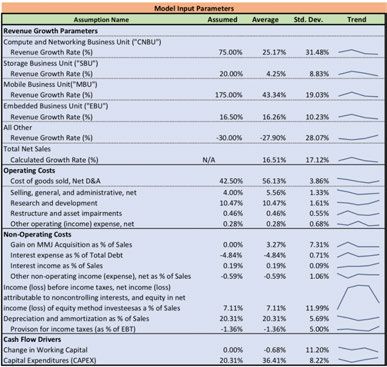
Figure 8: Micron P-DCF Assumptions
In our projections of future revenue and segment growth, the augmented effects of the MMJ
acquisition were taken into consideration as well as the predicted growth in segments as a
result of Micron’s most recent acquisition of Inotera. To reflect such growth rates, assumed
values were selected well above average for 2017 (see initial assumptions in Figure 8), but were
tapered to at or below historically average growth rates in the years to follow.
With cost synergies associated with the acquisitions of MMJ and Inotera, we noted that there
would be a continued downward trend in production costs and costs associated with Micron’s
operations. From our projection of Micron’s 2017 financial performance using quarterly data,
we assumed costs well below average for the duration of the model cycle. With this we
predicted that Micron would be able to generate steady revenue growth in the future with its
newly acquired fabrication facilities, testing and assembling sites, and DRAM or NAND
production focused on Micron’s key business units. These assumptions along with our
takeaways from management guidance allowed us to formulate our model’s strong growth
15Investment Thesis for Micron Technology, Inc. (NASDAQ: MU) by Kenneth-Von Blackmon
output. Placed upon the backdrop of the semiconductor industry, with higher average sales
prices, tightening between demand and supply, and overall industry growth, our model
indicated that Micron would have healthy growth in each business segment for the forecasted
future.
One noteworthy adjustment was made to the historical standard deviations as featured in the
“Value Drivers” tab which translated over to our P-DCF. Due to the large standard deviations
caused by our selection of the past five years of financial 10-K data, the growth effects in
business segment revenue caused by the MMJ acquisition that impacted 2014 were removed in
order to calculate standard deviations against our assumptions that were on par with Micron’s
historical trends. These adjusted standard deviations also shown in Figure 8 beside our growth
assumptions.
(At this point, please refer to the accompanying spreadsheet under “Value Drivers” and P-DCF.)
16Investment Thesis for Micron Technology, Inc. (NASDAQ: MU) by Kenneth-Von Blackmon
Model Results
Please reference the “P-DCF” in our accompanying spreadsheet for the full results of our
Monte Carlo
Figure 9: Micron’s Model Valuation Output
Given our assumptions and management guidance, the input values of the P-DCF model yielded
a probable average free cash flow per share value of $63.83 against the current share price of
$39.37 (see Figure 9). With these values, we predicted a 62% upside to Micron’s share price and
a strong forward outlook as compared to Wall Street estimates past fiscal 2017 and 2018.
Although our assumptions were at odds with our historical values, and derived historical
standard deviations were adjusted for more conservative values, we believe that Micron is a
company with driven value that warrants our buy rating.
Figure 10 & 11: Sensitivity Analysis for Micron P-DCF Model
Before Float After Float
Figure 10 Figure 11
Our model was found to be most sensitive in period 10 with regard to assumptions in working
capital and capital expenditure (cells L105 and L107 in Figure 10). Figures 11 shows the result of
floating working capital and capital expenditure in the 10th period, which removed assumptions
of 0.00% and 20.81% of sales (respectively). As a result of their removal from the Monte Carlo
simulation, a more refined result and tighter distribution was generated for our final analysis.
17Investment Thesis for Micron Technology, Inc. (NASDAQ: MU) by Kenneth-Von Blackmon
Figure 12 shows the third and final iteration of the Monte Carlo simulation’s results. Based on
our model valuation output, the current share price of $39.37 was found to provide a 92.76%
chance of upside from our subjective distribution.
Figure 12: Monte Carlo Simulation Results for Micron P-DCF model
Figure 12 presents the result of a 100,000 Monte-Carlo simulation trials of our Micron P-DCF model. This plot shows
the probability of possible free cash flows per share value along with the model’s entire distribution of results. The
blue indicates possible free cash flows per share above today’s share price. We found that today’s share price of
$39.37 exists with 92.76% certainty within our model.
We speculated that Micron’s acquisition of Inotera would result in similar, if not better,
revenue growth than had been generated as a result of the MMJ acquisition. This was reflected
in our fiscal 2017 assumptions, which were rather conservative in comparison to previous years
of expansive revenue growth. Taking our 2017 expectations into account and our assumed
historical growth rates thereafter, our analysis proves that the company will be able to
generate sufficient free cash flow. Likewise, Micron will have no problem in meeting debt
obligations while sustaining capital expenditure, research and development, and, possibly, its
most recent acquisition habits.
18Investment Thesis for Micron Technology, Inc. (NASDAQ: MU) by Kenneth-Von Blackmon
Proxy Findings
Due to the fact that management has the authority and discretion to allocate capital, we have
conducted a compensation analysis based on Micron’s latest DEF 14A of January 2016 to see if
management has been incentivized to pursue short-term returns or long-term value growth.
Executive Management (the “Named Executive Officers”)
Chief Executive Officer – Sanjay Mehrotra
Chief Executive Officer (former) – D. Mark Durcan (retired May 2017)
Chief Financial Officer – Ernest E. Maddock
Vice President, Memory Solutions – Brian M. Shirley
Vice President, Technology Department -- Scott J. DeBoer
Vice President, Worldwide Sales – Steven L. Thorsen
President (former – resigned February 1, 2016) – Mark W. Adams
Management Compensation
Outlook of Management Compensation
Micron offers ‘reasonable’ and ‘competitive’ compensation in order to attract the best talent,
retain and reward qualified individuals, and drive the corporate objective of creating superior
value for shareholders. The Compensation Committee, working in conjunction with Mark
Durcan, employs Mercer in their annual executive compensation review, using peer group
comparison, Market Data, historical pay-for-performance and risk compensation assessment to
review compensation mix metrics and incentives.
Reasonable
The Compensation Committee focuses on the Market Data median to offer the “reasonable”
range of competitiveness aspect to their compensation mix in comparison to its peer group.
Due to the high volatility of the semiconductor industry, Micron holds that its compensation
packages marked at the median can land higher or lower in range of competitiveness
depending on the year. These shifts can be accounted for in the varying executive
compensation as approved by the Compensation Committee in lieu of the volatile market.
Competitive
In order to provide the “competitive” aspect of compensation, the Compensation Committee
has devised a mixed compensation plan that provides a fixed compensation foundation and a
variable performance-based compensation found in their Executive Officer Performance
19Investment Thesis for Micron Technology, Inc. (NASDAQ: MU) by Kenneth-Von Blackmon
Incentive Plan (“EIP”). The Committee believes in tying a large portion of variable-based
compensation to performance in order to align the interests of management with those of
shareholders. However, although the Committee reviews total direct compensation annually, it
does not impose a fixed goal for total direct compensation.
Per Micron’s 2016 proxy statement, the elements of executive compensation are as follows:
1. Base Compensation (Salary)
2. Short-term Incentive Opportunities (cash bonus programs)
3. Long-term Incentive Opportunities (25% Stock Options, 45% Time-Based Stock and
30% Performance-Based Restricted Stock Units)
Chart 1: Executive Compensation Mix
Source: Micron’s DEF 14A, Proxy Statement
Base Compensation (Salary)
The base compensation, or base salary, serves as the foundation of Micron’s executive
compensation mix and is targeted approximately to the Market Data median as reported by
Mercer. At close of fiscal 2015, Market Data revealed that the Named Executive Officers, with
respect to their position or rank, were receiving salaries below the 50th percentile. There was
no change to base salaries for executives from fiscal 2015 to 2016 except a requested
temporary 50% decrease in base salary from Mark Durcan, aligning his interest with the
Company’s efforts to reduce expenses. Granted, he was the only executive to make this
request.
20Investment Thesis for Micron Technology, Inc. (NASDAQ: MU) by Kenneth-Von Blackmon
Table 2: Breakdown of Named Executive Officers’ Base Salary
Source: Micron’s DEF 14A, Proxy Statement
Short-Term Incentives
Short-term incentive compensation, or cash reward, is awarded for the completion and
achievement of financial, operational, and strategic objectives as reviewed and accepted by the
Compensation Committee on an annual basis. Micron uses these incentives as the “pay for
performance” aspect of its compensation mix, deriving its short-term cash bonuses from the
Executive Officer Performance Incentive Plan (“EIP”). The EIP, meant to attract seasoned
executives who provide value to the company and produce results, provides cash incentives for
performance at all levels of the business (individual, business-unit, company-wide, etc.).
In planning for fiscal 2016, the following goals as described directly from form DEF 14A were
established:
• Profitability – achieving targeted levels of net income,
• Technology Enablement – executing on DRAM & NAND Technology road maps,
• Product Qualifications – achieving target product milestones,
• Customer Review – achieving customer feedback targets,
• 20nm DRAM – achieving manufacturing targets, and
• 3D NAND – achieving manufacturing targets.
In measuring execution, Micron’s Compensation Committee holds the Named Executive
Officers to levels of achievement that determine short-term incentive payouts as a percentage
of each executive’s base salary. Levels of achievement and payouts are determined as follows:
threshold (50% payout), target (100% payout), and maximum (200% payout). Target
achievements for the Named Executive Officers are shown in Table 3 (unchanged from fiscal
2015 to 2016).
21Investment Thesis for Micron Technology, Inc. (NASDAQ: MU) by Kenneth-Von Blackmon
Table 3: Target Short-term Incentive Awards
Source: Micron’s DEF 14A, Proxy Statement
The EIP, although last approved January 2015, was suspended May 2016 due to prevailing
market conditions. New established performance goals were set for fiscal 2016 that the
Committee determined would guide executive performance and promote the growth of long-
term value and success. No other specifics were given for 2016’s selected metrics after the
suspension of the EIP, although the delineation of 2016’s accrued incentives were provided:
Table 4: Short-term Incentives Accrued Prior to Suspension of EIP
Source: Micron’s DEF 14A, Proxy Statement
Long-Term Incentives
Long-term incentives, comprised of 25% Stock Options, 45% Time-Based Stock and 30%
Performance-Based Restricted Stock Units, serve as the largest portion of Micron’s executive
compensation mix and are intended to align the interest of management with the shareholders.
Micron focuses on driving shareholder value upwards and ties a majority of their long-term
incentives, being the stock option and performance-based restricted stock unit awards, to the
performance of their stock price. For retention insurance and as a diversification of the long-
term incentives, stock options are also awarded, with shares vesting in one-fourth of the total
amounts awarded on each anniversary date of the initial grant.
22Investment Thesis for Micron Technology, Inc. (NASDAQ: MU) by Kenneth-Von Blackmon
Micron has worked with Mercer to establish a balance between performance- and time-based
incentives that are granted each fiscal year. The percentages initially mentioned with regards to
stock options, time-based stock, and performance based RSUs were unchanged from fiscal
2015. For fiscal 2016, the Committee assigned return on assets (“ROA”) and a relative total
shareholder return (“TSR”) as the metrics for performance-based RSUs and had determined
that a three-year measurement period rather than year over year basis provides a better
measure of performance due to business volatility and, as a result, stock price fluctuations.
Chart 2: Total Shareholder Return (“TSR”)
Source: Micron’s DEF 14A, Proxy Statement
Compensation Peer Group
As defined by the compensation consultant for Micron, Mercer has identified the following
companies as part of Micron’s Compensation Peer Group:
Table 5: Micron’s Compensation Peer Group
Source: Micron’s DEF 14A, Proxy Statement
23Investment Thesis for Micron Technology, Inc. (NASDAQ: MU) by Kenneth-Von Blackmon
Dividends
Micron has not declared or paid cash dividends since 1996 and does not intend to do so in the
foreseeable future.
Holders
With our focus on deriving free cash flow per share value, we felt it was important to review
the Institutional holders of Micron and their most recent actions. Top holders include The
Vanguard Group, Blackrock, Primecap Management, and Nanya Technology (acquired through
Micron’s single draw term loan facility held with Nanya). With a greater number of shares
bought than sold, we believe investors showed confidence in management’s forward guidance
after Microns Q3’s Earnings Call of June 30th (see Figure 13). Going forward, and after
yesterday’s strong earnings report for Q4, we expect strong, positive movement within the
holders of Micron as the share price appreciates with growth.
Figure 13: Microns Holders:
Source: Bloomberg Terminal, Command: , Accessed 10/05/2017
24Investment Thesis for Micron Technology, Inc. (NASDAQ: MU) by Kenneth-Von Blackmon
Insiders Transactions
We reviewed the actions of Micron’s insiders to get any indication if management is buying into
their own growth prospects and believes the company will meet expectations. Although we do
not speculate the reasoning for sells of shares, we do take note to any purchases and their
timing relative to company growth (in retrospect). As we can see in Figure 14, there was one
purchase by management in 2016, but the last largest purchase was made back in 2015 by
Ernest Maddock. Although infrequent buying is not out of the norm due to shares being a
component of management compensation, this can indicate that management is not willing to
take on extra risk by taking a larger position in the company than required.
Figure 14: Microns Insider Transactions
Source: Bloomberg Terminal, Command: , Accessed 10/05/2017
25Investment Thesis for Micron Technology, Inc. (NASDAQ: MU) by Kenneth-Von Blackmon
Conclusions
Based on our findings, the outlook for Micron’s share price is optimistic. With current memory
solution demand not being met by major holders of market share and consumer demand
growing for next generation technology, the market appears to be primed for Micron’s taking.
Sanjay Mehrotra (CEO) and Ernie Maddock (CFO) provided positive guidance about the future
expectations for Micron during their 4th quarter 2017 earnings call of September 26th.
Reporting upon the tight market for DRAM and NAND memory solutions, rising average sales
prices, and declining cost of sales, Mr. Mehrotra guided that the current market climate would
allow Micron to continue its cost cutting and restructuring efforts, while positioning the
company for growth in manufacturing output. Mr. Mehrotra also affirmed that Micron would
be adjusting its focus towards higher-value added solutions, moving away from reporting
growth in costs per bit and moving towards individual product offerings.
With innovation and development at its forefront, Micron holds a unique position in the tight
semiconductor market. We believe if Micron can secure long-term, designer contracts as an
innovative and cost-effective memory solutions company, then the Company will be a
dominant player in the future of memory solutions.
As a result, we affirm our model valuation results. Our P-DCF implies a stock price of $63.83,
providing a 62% upside based on what we consider to be fair and empirical growth estimates.
We believe based on management and industry outlook, more upside may be derived with far
more bullish assumptions. Therefore, we rate Micron Technology, Inc. (NASDAQ: MU) a BUY,
with confidence that Micron will provide a return on investment into the foreseeable future.
26Investment Thesis for Micron Technology, Inc. (NASDAQ: MU) by Kenneth-Von Blackmon
General References
Micron Technology, Inc. (2017). About. Retrieved September 28, 2017, from
https://www.micron.com/about
Micron Technology, Inc. (2016). 2016 Form 10-K. Retrieved September 28, 2017 from
https://www.sec.gov/Archives/edgar/data/723125/000072312516000269/a2016q4.ht
m
Micron Technology, Inc. (2016). 2016 Form DEF-14A. Retrieved September 28, 2017 from
https://www.sec.gov/Archives/edgar/data/723125/000072312516000296/a2016definit
iveproxy.htm
Micron Technology, Inc. (2017). 2016 Form 10-Q Q3. Retrieved September 28, 2017 from
https://www.sec.gov/Archives/edgar/data/723125/000072312517000085/a2017q3.ht
m
Seeking Alpha (2017). “Micron Technology (MU) CEO Sanjay Mehrotra on Q4 2017 Results –
Earnings Call Transcript,” Retrieved September 27, 2017 from
https://seekingalpha.com/article/4109703-micron-technologys-mu-ceo-sanjay-
mehrotra-q4-2017-results-earnings-call-transcript
27You can also read