IMPORTANT NOTICE: Fitch Group
←
→
Page content transcription
If your browser does not render page correctly, please read the page content below
IMPORTANT NOTICE:

The information in this PDF file is subject to Business Monitor International Ltd’s full copyright
and entitlements as defined and protected by international law. The contents of the file are for
the sole use of the addressee. All content in this file is owned and operated by Business
Monitor International Ltd, and the copying or distribution of this file, internally or externally, is
strictly prohibited without the prior written permission and consent of Business Monitor
International Ltd. If you wish to distribute the file, please email the Subscriptions Department at
subs@bmiresearch.com, providing details of your subscription and the number of recipients
you wish to forward or distribute this information to.

                                                   DISCLAIMER
      All information contained in this publication has been researched and compiled from sources believed
      to be accurate and reliable at the time of publishing. However, in view of the natural scope for human
      and/or mechanical error, either at source or during production, Business Monitor International Ltd
      accepts no liability whatsoever for any loss or damage resulting from errors, inaccuracies or omissions
      affecting any part of the publication. All information is provided without warranty, and Business Monitor
      International Ltd makes no representation of warranty of any kind as to the accuracy or completeness
      of any information hereto contained.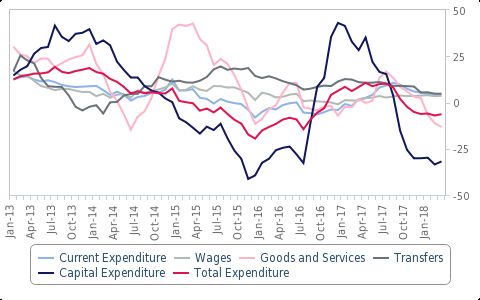
ISSN: 0265-9093
September 2018 Contents
Vol 35 Issue 9
Latin America Monitor
Venezuela: Bolívar To Continue
Depreciating 3
Colombia: Fiscal Deficit Will
Andean Narrow Following Presidential
Transition 6
Venezuela: Economic Recovery Unlikely Ecuador: Economy Undermined
Until 2020 By Spending Cuts 9
BMI View: Venezuela remains in the midst of a protracted economic decline, due to
collapsing oil production, deep import cuts and hyperinflation. While we maintain our Bolivia: Foreign Investment To
view that the economy will recover following a political transition, we now expect this Spur Growth In Bolivia 11
to occur in 2020, given that the timetable for such a recovery in 2019 has become in-
creasingly unrealistic. Economic changes made after a transition will see extremely high
real GDP growth in the short term due to base effects, though the country's long-term
outlook is less positive.
Forecast Changes
• We have downwardly revised our forecast for real GDP growth in 2018 and 2019
to contractions of 12.6% and 10.1% respectively, from 9.1% and 4.8% contractions
previously. This follows an estimated 10.6% contraction in 2017.
Venezuela remains in a deep depression. The oil sector has effectively collapsed following Copy Deadline: 21 July 2018
years of mismanagement and underinvestment. We forecast production of crude oil and
Analysts: Lee Sutton, Andrew Trahan and
natural gas to tumble to 1.49mn barrels per day (b/d) in 2018, down 28.1% from 2017 and Jesse Wheeler
42.4% from 2011. Due to severe hard currency shortages, imports have plummeted, falling
Editor: Katherine Weber
...continued on page 2
Sub-Editor: Margeaux Erasmus
Subscriptions Manager: Lyan Chan
Colombia: Economic Rebound To Continue 5
Colombia's real GDP growth will accelerate in the coming quarters, as private consumption Marketing Manager: Julia Consuegra
picks up. Higher oil prices and the inauguration of president-elect Iván Duque will alleviate
Production: Neeraj Kumar
uncertainty and bolster investment.
Peru: President Vizcarra On Firmer Footing 8
Peruvian President Martin Vizcarra will likely serve out the remainder of the current
presidential term, after finding firmer ground four months into his presidency following the
resignation of former President Pedro Pablo Kuczynski. Broad congressional support for
Vizcarra's administration will support improved policy formation in the coming quarters.
Head Office
REGIONAL INDICATORS
Andean 2016 2017e 2018f 2019f 30 North Colonnade, London
Nominal GDP, USDbn 626.0 686.1 729.3 772.0 E14 5GN, UK
Population, mn 139.3 140.9 142.5 144.0
GDP per capita, USD 4,494.9 4,869.9 5,118.8 5,359.5
Real GDP growth, % 1.7 2.0 2.6 2.9
Company Locations
Inflation, % 5.0 3.0 2.3 3.0
Goods Exports, USDbn 122.8 144.1 153.8 168.9 London | New York | Singapore
Goods Imports, USDbn 119.9 123.8 131.4 145.6 Hong Kong | Dubai | Pretoria
Notes: e/f = BMI estimate/forecast. Andean = Bolivia, Colombia, Ecuador, Peru, Venezuela. Weighted by nominal GDP.
Source: BMI
Subscriptions Contact:
© 2018 Business Monitor International Ltd. All rights reserved.
All information, analysis, forecasts and data provided by Business Monitor International Ltd is for the exclusive use of subscribing persons or
organisations (including those using the service on a trial basis). All such content is copyrighted in the name of Business Monitor International Tel: +44 (0)20 7248 0468
Ltd, and as such no part of this content may be reproduced, repackaged, copied or redistributed without the express consent of Business Monitor
International Ltd.
All content, including forecasts, analysis and opinion, has been based on information and sources believed to be accurate and reliable at the Fax: +44 (0)20 7248 0467
time of publishing. Business Monitor International Ltd makes no representation of warranty of any kind as to the accuracy or completeness of
any information provided, and accepts no liability whatsoever for any loss or damage resulting from opinion, errors, inaccuracies or omissions
affecting any part of the content. email: subs@bmiresearch.comAndean | September 2018
ANDEAN RISK INDEX
BMI's Country Risk Index scores countries on a 0-100 scale, evaluating short-term and long-term political stability, short-term economic
outlook, long-term economic potential and operational barriers to doing business. For a detailed methodology, visit bmiresearch.com or
contact us using the details on page 1.
RISK INDEX TABLE
Short Term Long Term Operational Country
Political Economic Political Economic Risk Risk
Peru 58.8 70.2 62.5 67.0 50.2 59.6
Colombia 64.4 64.2 60.4 64.1 49.0 58.5
Ecuador 51.3 57.5 49.1 58.6 46.3 51.8
Bolivia 51.5 56.0 50.0 63.3 35.8 48.7
Venezuela 36.0 22.7 44.8 29.9 29.3 32.2
Regional Average 52.1 54.1 53.4 56.6 42.1 50.2
Global Average 63.2 53.1 62.1 53.6 49.7 55.3
Note: Scores out of 100; higher scores indicate lower risk. Source: BMI
VENEZUELA – ECONOMIC OUTLOOK
...continued from front page
80.0% since 2012. In addition to an extremely challenging regulatory environment, this has Deep Contractions Will Be Followed
hollowed out the non-oil sector, with most major industries effectively paralysed. Driven By Economic Rebound
Venezuela – Real GDP Growth, % y-o-y
by shortages of goods and the accelerating expansion of the money supply, hyperinflation
has decimated household purchasing power and rendered the banking system unable
to function (see 'Banking Sector: Reforms Desperately Needed', December 6 2017). We
estimate that the US dollar value of all cash in circulation fell to USD0.36/capita in July 2018,
illustrating the depth of the challenge to commerce.
We expect these dynamics to intensify over the second half of 2018. Oil production
will continue to fall, further reducing hard currency inflows and perpetuating the
decline. National oil company PdVSA is largely unable to invest in rapidly deteriorating
infrastructure or pay oil field services providers or much of its workforce, which has been e/f = BMI estimate/forecast. Source: BCV, UN, BMI
hit by mass resignations in recent months. Recently announced investments from China
will offer some support to the sector, but we do not believe that these will be sufficient to
stem the decline over the near term (see 'Quick View: China's Cash Boost Insufficient To
Halt Venezuela's Crude Woes', July 5). While the non-oil sector has benefited from a slight
uptick in imports following the government's decision to default on some of its debts in
November 2017 (see 'Quick View: Officially In Default, Creditor Action Not Yet Imminent',
November 14 2017), this is unlikely to be maintained as oil revenues continue to fall. Purchasing Power Plummets
As Hyperinflation Takes Hold
Venezuela – Cash Per Capita, USD
We have pushed back our forecasted recovery in the Venezuelan economy until 2020,
from 2019 previously. Our forecast had been based on our view that creditor action in 2018
would cut Venezuela off from its ability to export oil, fracturing the patronage networks
that have kept the PSUV in power thus far. This would then lead to a political transition and,
likely after several quarters, sufficient economic policy changes to see growth recover (see
'Venezuela's Political Crisis: Four Scenarios', May 22). However, creditors have been slower
to act than we anticipated, allowing the Maduro regime to continue to entrench itself in
power following May's presidential election (see 'Maduro Wins, Pushing Political Crisis Into
A New Phase', May 21). As a result, a recovery in 2019 has become unrealistic and we have
pushed back our forecasts by one year. Source: BCV, UN, DolarToday, BMI
www.bmiresearch.com Page 2Andean | September 2018
Creditor action remains the most likely path to regime change, and thus economic recovery. Short-Term Import Boost Unlikely To Last
Venezuela – Imports From The US, USDmn
While we will address Venezuela's debt situation in greater depth in the coming weeks, we
maintain our view that creditors are likely to move to seize Venezuela's oil shipments and
overseas assets, including US-based subsidiary Citgo, in the quarters ahead. Given the
disruption in PdVSA's operations caused by ConocoPhillips' recent attempts to seize
assets in the Caribbean (see 'Risk Of Asset Seizures Will Weigh On Oil Exports', May 11), a full-
scale effort from multiple creditors would effectively cut Venezuela off from hard currency
inflows. Without hard currency, imports would come to a standstill and the resulting political
unrest will most likely culminate in a political transition, though we note a high degree of
risk around this view (see 'Alternate Scenario: How Does Maduro Remain In Power For The
Long-Term?', April 26). Note: US accounts for roughly 40% of Venezuela's imports.
Source: US Census Bureau, Trade Map, BMI
Economic policy changes made in the wake of a political transition will lead to rapid real
GDP growth in the short term. Given the extent of the decline in Venezuela's economy
in recent years, orthodox macroeconomic reforms would likely see a sharp jump in real
GDP growth within several quarters of a transition (see 'Next Government Will Implement
Drastic Reforms', June 1). However, the long-term outlook for the country remains relatively
poor. Numerous structural weaknesses, particularly in the oil sector, present significant
headwinds to the economy (see 'Structural Weaknesses Underpin Poor Long-Term Growth
Outlook', May 30), which will likely keep the total size of the economy below its 2013 peak
in real terms at the end of our 10-year forecast period. From a high of USD380.8bn in 2012,
we currently forecast the economy to equal USD175.0bn in 2027.
VENEZUELA – ECONOMIC OUTLOOK
Venezuelan Bolívar To Continue Depreciating
BMI View: The Venezuelan bolívar will continue to depreciate in 2018 and 2019, due to collapsing confidence driven by money
supply growth and currency controls. The ruling PSUV will maintain an overvalued official exchange rate and will not be able to halt
depreciatory pressures. In the long term, an economic recovery and changes to exchange rate policies will likely see the unit regain
some of its value. We cannot rule out eventual dollarisation or a currency board, though for the time being we are not factoring this
into our forecasts.
Forecast Changes
• We forecast Venezuela's exchange rate to average VEF60,839,482/USD in 2018 and Parallel Dollar In Free Fall
Venezuela – Parallel Market Exchange Rate, VEF/USD
VEF164,266,606/USD in 2019, from VEF21,311/USD in 2017. We use a weighted
exchange rate which incorporates both the official and parallel market rates.
Little has changed in our outlook for the bolívar in the short term. Confidence in the unit
has been shattered by runaway money supply growth and restrictive currency controls,
causing it to depreciate at a rapid pace. While the black market value of the unit varies
depending on the source, all show a massive depreciation beginning in April. For example,
the site DolarToday has the unit falling from VEF235,998/USD on April 1, to VEF3,418,605/
USD on July 16, a 93.1% devaluation. Our forecasts assume that the unit continues to rapidly
depreciate over the remainder of the year, given our view that Venezuela is firmly in the grip Source: DolarToday, Monitor Dolar Ve, BMI
of hyperinflation (see 'Price Growth Shows No Sign Of Slowing', May 1).
www.bmiresearch.com Page 3Andean | September 2018
The PSUV will not act to alleviate the downward pressures on the unit. The official Dicom rate stood at VEF119,938/USD as of July 13,
compared to black market rates in excess of VEF3,000,000/USD. While the Dicom rate has steadily depreciated over recent months, it is
far from reflecting market supply and demand from the currency. This is unlikely to change given that the party has long underpinned its
control on power via providing privileged access to the subsidised rate. The PSUV continues to rapidly expand the money supply, while
falling oil production cuts into dollar inflows, suggesting that the bolívar will continue to devalue rapidly.
In the long term, we expect that a recovery in the Venezuelan economy and major policy changes will allow the bolívar to regain some
purchasing power. In particular, this means lifting currency controls and slowing the pace of money printing, which will combine with a
gradual recovery in economic productivity to see the bolívar appreciate. We currently forecast this recovery to begin in 2020, though we
note that this is contingent on highly uncertain political developments (see 'Venezuela's Political Crisis: Four Scenarios', May 22). That
said, dollarisation is also a potential outcome of a political transition. Leading opposition economists and political leaders have embraced
dollarisation as a means of halting hyperinflation.
VENEZUELA – DATA & FORECASTS
2014 2015 2016 2017e 2018f 2019f 2020f
Population, mn 30.74 31.16 31.57 31.98 32.38 32.78 33.17
Nominal GDP, USDbn 481.7 957.6 19.0 31.2 17.7 17.1 15.2
GDP per capita, USD 15,672 30,736 600.0 975.0 546.0 520.0 459.0
Real GDP growth, % y-o-y -3.9 -6.2 -16.5 -10.6 -12.6 -10.1 8.2
Consumer price inflation, % y-o-y, ave 61.8 116.2 219.5 1,243 105,809 200.0 35.0
Consumer price inflation, % y-o-y, eop 68.5 180.9 376.0 3,979 539,800 50.0 20.0
Exchange rate VEF/USD, ave 6.29 6.29 1,252 21,311 60,839,481.60 164,266,606 147,839,945
Exchange rate VEF/USD, eop 6.29 6.29 11,281 30,430,396 112,553,043 156,053,276 140,447,948
Budget balance, VEFbn -373.7 -853.9 -3,336 -69,254 -137,896,569 -261,359,114 -170,270,671
Budget balance, % of GDP -12.3 -13.1 -17.1 -15.8 -14.5 -10.1 -7.8
Goods and services exports, USDbn 76.6 38.8 29.2 33.3 31.7 36.4 37.7
Goods and services imports, USDbn 64.4 50.8 24.8 20.1 18.9 24 30.7
Current account balance, USDbn 3.6 -20.4 1.2 4.3 1.5 1.6 1.0
Current account balance, % of GDP 0.7 -2 7.7 20.8 9.8 10.3 9.6
Foreign reserves ex gold, USDbn 22.1 16.4 11.0 5.0 8.0 11.0 14.0
Import cover, months 4.1 3.9 5.3 3.0 5.1 5.5 5.5
Total external debt stock, USDbn 161.2 175.1 184.7 116.4 105.2 87.2 76.8
Total external debt stock, % of GDP 33.5 16.9 1,182.70 566.1 689.4 571.1 764.8
Crude, NGPL & other liquids prod, 000b/d 2,548 2,536 2,337 2,074 1,491 1,377 1,313
Total net oil exports (crude & products), 000b/d 1,894 1,951 1,836 1,659 1,157 1,067 1,009
Dry natural gas production, bcm 21.1 22.1 22.6 23.3 23.7 24.6 25.3
Dry natural gas consumption, bcm 14.3 16.7 14.5 13.3 12.5 12.3 12.6
e/f = BMI estimate/forecast. Source: National sources, BMI
www.bmiresearch.com Page 4Andean | September 2018
COLOMBIA – ECONOMIC OUTLOOK
Colombian Economic Rebound To Continue
BMI View: Colombia's real GDP growth will accelerate in the coming quarters, as private consumption picks up. Higher oil prices and
the inauguration of president-elect Iván Duque will alleviate uncertainty and bolster investment.
• Private consumption will be the main driver of economic growth in the coming quarters Consumption Recovering From 2017 Downturn
Colombia – Consumer Confidence & Retail Sales
as borrowing costs and inflation remain low.
• The incoming administration of president-elect Iván Duque of the centre-right Centro
Democrático party will support investment and business activity.
• We forecast real GDP growth of 2.6% in 2018 and 3.2% in 2019, up from 1.8% in 2017.
Private consumption will pace economic activity. A combination of low interest rates and
inflation underpins our view that private consumption will rebound throughout 2018.
Private consumption accounted for 62.7% of GDP in 2017. The Banco de la República
(BanRep) has lowered its policy interest rate to 4.25% – the lowest since July 2014 – in
an attempt to stimulate the economy (see 'BanRep To Extend Rate Cuts In 2018', March Source: Fedesarrollo, Bloomberg, BMI
27). In addition, we forecast inflation to average 3.4% in 2018, increasing real earnings and
supporting household purchases. After retail sales declined throughout much of 2017,
high-frequency data indicate that sales growth averaged 5.6% in January-April 2018, with
significant increases in automobile and motorcycle sales.
The oil and gas sector will be a major pillar of growth. Higher oil prices, which we forecast to
average USD75.0/bbl in 2018, will stoke investment into the Colombian upstream business.
Ending two years of investment cutbacks, state oil company Ecopetrol and its foreign
partners announced they would invest USD8.5bn in upstream operations in 2018 (see
'Crude Production Will Remain In Decline In 2018', May 22). This will boost oil production,
which has declined by 14.8% since 2015. Higher oil prices have also helped strengthen
the Colombian peso and boosted purchasing power in recent months, which will funnel
through to private consumption.
Real GDP Growth Will Continue Its Upwards Trend
Investment will pick up in Colombia with the conclusion of the presidential election, as Colombia – Real GDP Growth, % y-o-y
Duque pursues pro-business policies and policy uncertainty dissipates. Duque emerged
as the most investor-friendly candidate during the campaign as he promised to lower
corporate taxes and ease regulations. Our Oil & Gas and Mining teams forecast that Duque's
support for offshore drilling and mining sector reform will bolster foreign investment into
Colombia's extractive sector (see 'Duque Win Will Support Heavy Industry', May 18).
However, we are less bullish on Colombia's infrastructure sector following weak
investment data from Q118. Our Infrastructure team lowered the 2018 growth
forecast for the construction sector to 0.4% y-o-y as construction contracted in Q118.
The downturn can likely be attributed to uncertainty brought on by the presidential f = BMI forecast. Source: National sources, BMI
candidacy of leftist Gustavo Petro, who vowed to increase the government's involvement
in infrastructure development and raise taxes on land and real estate holdings (see
'Colombia Infrastructure: Uncertainty To Delay Recovery', June 25). However, Petro's
defeat and the likely continuation of orthodox economic policies under Duque will help
unlock private funding for infrastructure investment.
www.bmiresearch.com Page 5Andean | September 2018
COLOMBIA – ECONOMIC OUTLOOK
Colombia's Fiscal Deficit Will Narrow Following Presidential Transition
BMI View: Colombia's fiscal deficit will narrow in the coming quarters as stronger economic growth filters through to support govern-
ment revenues. The incoming government of Iván Duque will likely maintain fiscal consolidation measures that fall in line with the
country's fiscal rule.
• Higher oil prices and stronger real GDP growth will generate higher government Deficits To Persist Even As Revenues Pick Up
Colombia – Fiscal Balance, % Of GDP
revenues in the coming quarters, narrowing Colombia's fiscal deficit.
• President-elect Iván Duque of the centre-right Centro Democrático will broadly maintain
the fiscal policies of his predecessor, Juan Manuel Santos.
• In the longer term, Duque's proposed corporate tax cuts and continued spending on
Venezuelan refugees could put strain on the fiscal account.
Forecast Changes
• We have revised down our fiscal deficit forecast for 2019 to 2.8% of GDP, from
2.7% previously, as we expect expenditures will modestly exceed those in our
previous forecast. e/f = BMI estimate/forecast. Source: BanRep, BMI
• We maintain our current fiscal deficit forecast for 2018 of 3.1% of GDP.
The fiscal deficit will narrow in the coming quarters as revenues pick up. Stronger private
consumption and higher oil prices will both contribute to significant revenue gains. Low
inflation and borrowing costs will spur consumption, which will offer greater government tax
receipts as the 2017 implementation of tax reform increased the value added tax from 16%
to 19% (see 'Colombian Economic Rebound To Continue', June 27). Furthermore, higher
oil prices will offer a fiscal windfall. Oil royalties had consisted of approximately one-fifth of
government revenues prior to the 2016 collapse in prices. Our Oil & Gas team forecasts that
Brent oil prices will average USD75.0/bbl in 2018 and USD80.0/bbl in 2019.
We expect that Duque's administration will maintain the fiscal consolidation measures
implemented by the Santos government. Duque will likely keep fiscal spending modest,
adhering to the fiscal rule and looking to the private sector to drive investment (see 'Election
Preview: Duque Likely To Win Presidency After Run-Off', May 11). The fiscal rule offers
targets for narrowing Colombia's structural deficit to 1.0% of GDP by 2022, while allowing
for some cyclical flexibility. Duque, who has been a vocal critic of the 2016 peace deal
with the Fuerzas Armadas Revolucionarias de Colombia (FARC) insurgent group, may cut
spending further if he chooses not to fully implement the government-funded provisions
of the peace deal, which include education programmes, vocational training and stipends
for former FARC members.
However, Duque has proposed cutting Colombia's corporate tax rates, from the current
33.0% rate to one closer to the OECD average of 21.9%. Duque has not offered a
comprehensive plan to replace the lost revenues aside from improving tax collection and
cracking down on tax evasion. However, we do not believe that these gains will be enough to
offset the lost corporate tax revenues. This poses a downside risk to our revenue forecasts
if the next Colombian government is able to pass tax cuts.
www.bmiresearch.com Page 6Andean | September 2018
Elevated spending on social services for Venezuelan immigrants will put downside pressure Revenues Closely Track Brent Prices
Government Revenues & Brent Price, USD
on Colombia's fiscal account. According to some estimates, Colombia has received over one
million Venezuelans fleeing their country's economic collapse (see 'Migrant Crisis Raising
Risks Across Latin America', May 17). Should Venezuela's downward spiral continue, we
expect a greater inflow of migrants, which will add additional strain to Colombia's hospitals,
schools and shelters. While we expect that Colombia will appeal for additional humanitarian
aid from multilateral organisations, the migrant crisis will constrain Colombia's fiscal
flexibility as it must spend state resources to house and feed the migrants, increase border
security, or both.
e/f = BMI estimate/forecast. Source: National sources, BMI
COLOMBIA – DATA & FORECASTS
2014 2015 2016 2017e 2018f 2019f 2020f
Population, mn 47.79 48.23 48.65 49.07 49.46 49.85 50.22
Nominal GDP, USDbn 378.3 291.1 282.5 311.1 339.5 356.0 376.1
GDP per capita, USD 7,914 6,035 5,806 6,340 6,864 7,141 7,489
Real GDP growth, % y-o-y 4.4 3.1 2.0 1.8 2.6 3.2 3.6
Industrial production, % y-o-y, ave 1.5 -25.3 3.3 5.3 5.5 5.3 5.0
Consumer price inflation, % y-o-y, ave 2.9 5.0 7.5 4.3 3.4 3.5 3.3
Consumer price inflation, % y-o-y, eop 3.2 6.8 5.7 4.1 3.7 3.3 3.5
Central bank policy rate, % eop 4.50 5.75 7.50 4.75 4.25 5.00 5.50
Exchange rate COP/USD, ave 2,002 2,745 3,053 2,952 2,870 2,924 2,959
Exchange rate COP/USD, eop 2,376 3,174 3,002 2,937 2,910 2,939 2,980
Budget balance, COPbn -19,844 -27,079 -34,925 -33,636 -30,443 -28,801 -23,908
Budget balance, % of GDP -2.6 -3.4 -4.0 -3.7 -3.1 -2.8 -2.1
Goods and services exports, USDbn 63.8 45.7 41.4 47.8 51.3 54.1 58.0
Goods and services imports, USDbn 75.1 64.2 54.4 56.7 58.9 62.2 65.4
Current account balance, USDbn -19.6 -18.6 -12.2 -10.4 -8.9 -8.4 -6.7
Current account balance, % of GDP -5.2 -6.4 -4.3 -3.3 -2.6 -2.4 -1.8
Foreign reserves ex gold, USDbn 47.3 46.7 46.7 47.6 49.1 50.5 52.1
Import cover, months 7.6 8.7 10.3 10.1 10.0 9.8 9.5
Total external debt stock, USDbn 101.4 110.9 120.3 123.8 126.7 127.9 130.3
Total external debt stock, % of GDP 26.8 38.1 42.6 39.8 37.3 35.9 34.6
Crude, NGPL & other liquids prod, 000b/d 1,008.0 1,026.0 906.3 874.1 867.0 857.5 853.1
Total net oil exports (crude & products), 000b/d 681.7 692.7 569.1 530.6 514.2 494.1 479.5
Dry natural gas production, bcm 9.6 9.8 9.9 9.6 9.5 9.5 9.5
Dry natural gas consumption, bcm 10.9 10.5 10.9 11.1 11.2 11.4 11.6
e/f = BMI estimate/forecast. Source: National sources, BMI
www.bmiresearch.com Page 7Andean | September 2018
PERU – POLITICAL OUTLOOK
Peruvian President Vizcarra On Firmer Footing
BMI View: Peruvian President Martin Vizcarra will likely serve out the remainder of the current presidential term, after finding firmer
ground four months into his presidency following the resignation of former President Pedro Pablo Kuczynski. Broad congressional
support for Vizcarra's administration will support improved policy formation in the coming quarters. However, the Fujimori siblings,
especially Keiko at the head of the Fuerza Popular, will continue to play a key role in politics, as a shift in their support for Vizcarra
would potentially destabilise his administration.
Forecast Changes
• We have moderately lifted Peru's score in our Short-Term Political Risk Index to 58.8, Political Risks Dissipating Somewhat
Peru – Short-Term Political Risk Index
from 57.1 previously, reflecting an improving assessment of the policymaking process.
Vizcarra will likely serve out the remainder of the current presidential term through
to 2021. Following the resignation of his predecessor Pedro Pablo Kuczynski amid
allegations of corruption and vote-buying (see 'Quick View: Kuczynski Resignation Opens
Door For Early Elections', March 22), Vizcarra took office on March 23. In the turmoil
following the resignation, it seemed that the Fuerza Popular (FP) might push for new
presidential elections, as they had previously forced Vizcarra from his position as Minister
of Transportation.
Note: Scores out of 100; higher score = lower risk. Source: BMI
However, political infighting within the FP likely precluded any serious effort towards snap
elections, and four months into his presidency, Vizcarra is on firmer footing. Vizcarra has
begun his term by jump-starting reconstruction efforts in areas hit by last year's flooding
and by combatting corruption. However, the latter of these endeavours was dealt a blow
by the resignation of Justice Minister Salvador Heresi on July 13 after he was implicated in
the corruption scandal surrounding Supreme Court Judge Cesar Hinostroza that prompted
Vizcarra's promise for sweeping judicial reform the week prior.
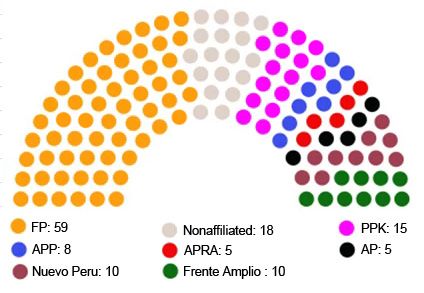
Relatively strong congressional support for Vizcarra will improve policy formation. Political FP Remains Largest Bloc In Congress
Peru – Congressional Seats By Party, Out Of 130
gridlock plagued Kuczynski's presidency as Keiko Fujimori's FP, whom he narrowly defeated
in the 2016 presidential race, used its majority in the legislature to obstruct his agenda.
However, we expect a moderate improvement in policy formation in the coming quarters, as
the party-less Vizcarra benefits from explicit support from a wide range of Peruvian political
parities, including the FP. On June 20, the legislature granted Vizcarra 60-day temporary
legislative powers to combat corruption and boost the economy, a clear gauge of broad
Congressional support for the new president.
FP infighting will likely benefit Vizcarra. While the FP still controls the largest bloc in Congress
with 59 of 130 seats, it lost its absolute majority following a rift between the party's sibling Source: Local sources, Congreso del Peru, BMI
leaders Keiko and Kenji who led to a number of expulsions and resignations in late 2017
and early 2018. This diminished position, and continued political infighting, will likely limit
attacks and political intransigence towards the Vizcarra administration.
However, the political climate remains volatile. A shift in support from the FP away from
Vizcarra could usher in a return to political gridlock. While the diminished FP does not have
the votes to pursue Vizcarra's ouster, it could effectively hold up the president's agenda
with a just a few additional outside votes. We note that the FP has previously clashed with
www.bmiresearch.com Page 8Andean | September 2018
Vizcarra, driving him to resign from his position of Transport Minister in 2017. Falling public approval for Vizcarra, which has dropped to
29% in July, may precipitate Congressional opposition.
PERU – DATA & FORECASTS
2014 2015 2016 2017e 2018f 2019f 2020f
Population, mn 30.97 31.38 31.77 32.17 32.55 32.93 33.31
Nominal GDP, USDbn 203.1 192.4 195.4 215.2 230.5 251.1 277.7
GDP per capita, USD 6,556 6,131 6,150 6,690 7,080 7,623 8,335
Real GDP growth, % y-o-y 2.4 3.3 4.0 2.5 3.9 3.7 3.8
Industrial production, % y-o-y, ave 3.8 3.6 3.5 2.4 2.6 2.8 2.8
Consumer price inflation, % y-o-y, ave 3.2 3.5 3.6 2.8 1.5 2.8 3.4
Consumer price inflation, % y-o-y, eop 3.2 4.4 3.2 1.4 2.2 3.2 3.5
Central bank policy rate, % eop 3.50 3.75 4.25 3.25 2.75 3.50 4.25
Exchange rate PEN/USD, ave 2.84 3.18 3.38 3.26 3.23 3.19 3.12
Exchange rate PEN/USD, eop 2.98 3.41 3.36 3.24 3.20 3.18 3.06
Budget balance, PENbn -1.9 -12.6 -16.9 -22.8 -25.3 -24.2 -22.7
Budget balance, % of GDP -0.3 -2.1 -2.6 -3.2 -3.4 -3.0 -2.6
Goods and services exports, USDbn 45.5 40.7 43.3 52.3 58.4 64.1 69.9
Goods and services imports, USDbn 48.9 45.6 43.4 47.5 52.1 56.6 61.1
Current account balance, USDbn -8.4 -9.2 -5.3 -2.7 -2.4 -2.2 -1.7
Current account balance, % of GDP -4.1 -4.8 -2.7 -1.3 -1.0 -0.9 -0.6
Foreign reserves ex gold, USDbn 62.3 61.5 61.7 62.4 65.0 69.0 73.0
Import cover, months 15.3 16.2 17.0 15.8 15.0 14.6 14.3
Total external debt stock, USDbn 61.3 65.9 69.5 69.9 78.6 83.1 85.5
Total external debt stock, % of GDP 30.2 34.3 35.6 32.5 34.1 33.1 30.8
Crude, NGPL & other liquids prod, 000b/d 175.0 151.9 136.3 136.6 138.2 139.7 141.4
Total net oil exports (crude & products), 000b/d -38.2 -77.5 -106.9 -114.6 -125.7 -133.6 -139.9
Dry natural gas production, bcm 12.9 12.5 13.8 12.8 13.2 13.7 14.2
Dry natural gas consumption, bcm 5.5 5.5 6.0 6.2 6.5 6.7 7.3
e/f = BMI estimate/forecast. Source: National Sources, BMI
ECUADOR – ECONOMIC OUTLOOK
Ecuadorian Economy Undermined By Spending Cuts
BMI View: Ecuadorian real GDP growth will decelerate in 2018 and 2019 amid public sector spending cuts. Import duties and weak-
ening sentiment will weigh on private consumption and investment. Over the longer term we expect a gradual acceleration in growth
from 2020, as rising oil prices support exports.
Forecasts Changes
• We maintain our forecast for real GDP growth in 2018 at 1.4%. Muted Growth Ahead
Ecuador – Real GDP, % y-o-y
• We have revised down our forecast for 2019 and 2020 to 1.2% and 1.8%, from 1.5% and
2.1% previously, due to anticipated austerity measures.
Economic growth will decelerate in the coming quarters, as a fragile economic recovery
is undermined by public spending cuts. Average monthly expenditures contracted 6.3%
y-o-y in Q417 and Q118, as the government of President Lenín Moreno cut public spending
in an effort to narrow a large fiscal deficit (see 'Economic Plan Unlikely To Cure Fiscal Woes',
April 25). Capital expenditure cuts were the most heavily impacted, falling 31.9%. In the
coming months, we expect further cuts to public spending, as the government struggles
to rein in a deficit of 5.3% of GDP in 2017 and rising yields on government debt make f = BMI estimate. Source: BCE, BMI
additional borrowing increasingly expensive. We also note the possibility for a financing
agreement with the IMF in the coming months, which would likely invoke additional
austerity measures.
Import duties will weigh on the service sector. In 2017, commerce was a key driver of
overall economic growth, expanding by 5.5% in real terms after the government removed
a number of 'safeguard' duties on imports (see 'Import Restrictions Will Safeguard
www.bmiresearch.com Page 9Andean | September 2018
External Balance', December 21 2017). However, this pace of growth will be short-lived, Spending Cuts Will Weigh On Growth
Ecuador – Government Expenditures, % y-o-y 6mma
as modest wage growth and new import restrictions have weakened demand. While a
'customs fee' in place since November 2017 will likely be removed in the coming weeks in
accordance with a ruling by the Andean Community, other tariffs remain elevated and we
expect the Moreno government will likely raise additional tariffs to WTO ceilings should
Ecuador's current account begin to slip into deficit (see 'Rising Oil Prices Will Support
Current Account', June 20).
Investment will likely remain weak. While the government's new economic plan will provide
tailwinds via new tax breaks, we expect that investment growth will only reach 1.0% and
1.5% in 2018 and 2019 in real terms. Investor sentiment towards Ecuador remains weak Source: BCE, BMI
after a decade of leftist-nationalist economic policies under Moreno's predecessor Rafael
Correa. Concerns over security and the rule of law also add to operational risks. As such,
foreign direct investment will remain modest, at around 1.0% of GDP in the coming years,
limited mainly to the primary sector. Additionally, in June, the central bank reportedly
siphoned USD450mn from state-owned utilities Celec and CNEL to cover near-term
obligations, which will likely erode those firms' capital expenditures in the coming quarters.
A recovering oil sector will underpin modest growth over the longer term. Our Oil & Gas
team forecasts WTI benchmark oil prices to average 34.7% higher in 2018, and average
6.4% annual increases from 2019 to 2021. This will support exports and production growth
over the medium term as the government returns to production-sharing contracts
with international oil field service providers (see 'OFS Return Will Revive Mature Field
Development', August 2 2017). The rise in exports will support hard currency inflows and
government receipts, helping to limit the depth of government cuts and import-restricting
'safeguards' over the medium-to-long term. However, we note that production will be
capped in the near term by OPEC agreements.
ECUADOR – DATA & FORECASTS
2014 2015 2016 2017e 2018f 2019f 2020f
Population, mn 15.90 16.14 16.39 16.62 16.86 17.10 17.34
Nominal GDP, USDbn 101.7 99.3 98.6 103.1 106.9 111.5 118.1
GDP per capita, USD 6,396 6,150 6,018 6,198 6,341 6,520 6,813
Real GDP growth, % y-o-y 3.8 0.1 -1.6 3.0 1.4 1.2 1.8
Consumer price inflation, % y-o-y, ave 3.6 4.0 1.7 0.4 0.7 2.3 3.5
Consumer price inflation, % y-o-y, eop 3.7 3.4 1.1 -0.1 1.5 3.0 3.9
Exchange rate USD/USD, ave 1.00 1.00 1.00 1.00 1.00 1.00 1.00
Exchange rate USD/USD, eop 1.00 1.00 1.00 1.00 1.00 1.00 1.00
Budget balance, USDbn -5.3 -5.1 -7.3 -5.5 -4.5 -4.3 -4.4
Budget balance, % of GDP -5.2 -5.1 -7.4 -5.3 -4.2 -3.9 -3.7
Goods and services exports, USDbn 28.9 21.4 19.6 21.9 24.5 26.9 28.4
Goods and services imports, USDbn 30.2 23.9 19.1 22.6 24.8 27.1 28.9
Current account balance, USDbn -0.5 -2.1 1.4 -0.3 0.1 0.3 -0.1
Current account balance, % of GDP -0.5 -2.1 1.5 -0.2 0.1 0.2 -0.1
Foreign reserves ex gold, USDbn 3.9 2.5 4.3 2.5 2.2 3.0 3.0
Import cover, months 1.6 1.3 2.7 1.3 1.1 1.3 1.2
Total external debt stock, USDbn 24.2 27.3 34.1 37.4 40.8 44.4 48.4
Total external debt stock, % of GDP 23.7 27.5 34.6 36.3 38.2 39.9 41.0
Crude, NGPL & other liquids prod, 000b/d 557.1 544.1 549.1 532.1 521.0 530.3 540.9
Total net oil exports (crude & products), 000b/d 271.8 297.3 313.9 299.7 284.9 289.5 294.1
Dry natural gas production, bcm 0.6 0.5 0.5 0.5 0.5 0.5 0.5
Dry natural gas consumption, bcm 0.6 0.5 0.5 0.5 0.5 0.5 0.5
e/f = BMI estimate/forecast. Source: National sources, BMI
www.bmiresearch.com Page 10Andean | September 2018
BOLIVIA – ECONOMIC OUTLOOK
Foreign Investment To Spur Growth In Bolivia
BMI View: Bolivia will see real GDP growth remain robust in the coming quarters as private consumption strengthens amid low infla-
tion and rising remittances. Sustained high energy prices will support foreign investment in the natural gas sector. Public spending
will also support economic activity as President Evo Morales looks to boost his political support ahead of the 2019 elections.
Forecast Changes
• We have revised up our 2019 real GDP growth forecast to 3.6%, from 3.4% previously, as Growth Likely To Outpace Regional Average
Bolivia & Latin America (Region) – Real GDP Growth,
we expect structurally higher energy prices to support investment and consumption in % y-o-y
the coming quarters. Our 2018 real GDP forecast of 3.7% remains unchanged.
Private consumption will drive growth over the coming quarters. Private consumption will
continue to benefit from low inflation and strong remittance inflows, boosting purchasing
power. We forecast that inflation will remain historically low in 2018, averaging 3.0% y-o-y
before picking up slightly in 2019. In addition, incoming remittances increased by 10.6% in
the year through April 2018, with noted growth from Bolivians working in Spain and the US.
With robust growth expected in both Spain and the US in the coming quarters, remittance
inflows will spur additional consumption and economic activity.
e/f = BMI estimate/forecast. Source: National sources, BMI
Higher global energy prices will drive an increase in foreign direct investment (FDI).
Overall investment is closely tied to energy prices, which affect the attractiveness of
Bolivia's natural gas sector. Boosted by higher prices, FDI increased by 70.8% y-o-y in
Q118. Russian energy firm Gazprom announced a USD1.2bn investment into exploration
and production, while Shell and several other energy firms have also signalled plans
to ramp up investment. Our Oil & Gas team forecasts that WTI oil prices – from which
Bolivia benchmarks its gas contracts – will average USD75.0 per barrel (/bbl) in 2018
and USD80.0/bbl in 2019. Sustained price strength will support investment and boost
revenues for Bolivia's state energy company Yacimientos Petrolíferos Fiscales
Bolivianos in the coming quarters.
BOLIVIA – DATA & FORECASTS
2014 2015 2016 2017e 2018f 2019f 2020f
Population, mn 10.56 10.72 10.89 11.05 11.22 11.38 11.54
Nominal GDP, USDbn 33.0 33.0 33.8 37.5 38.4 39.5 40.5
GDP per capita, USD 3,123 3,079 3,106 3,392 3,423 3,474 3,512
Real GDP growth, % y-o-y 5.5 4.9 4.3 4.2 3.7 3.6 3.6
Consumer price inflation, % y-o-y, ave 5.8 4.1 3.6 2.8 3.0 3.1 3.1
Consumer price inflation, % y-o-y, eop 5.3 3.0 4.0 2.7 2.9 3.2 3.0
Exchange rate BOB/USD, ave 6.91 6.90 6.91 6.91 7.20 7.50 7.80
Exchange rate BOB/USD, eop 6.91 6.90 6.93 6.91 7.20 7.50 7.80
Budget balance, BOBbn -7.7 -15.7 -15.4 -16.5 -16.4 -13.9 -11.5
Budget balance, % of GDP -3.4 -6.9 -6.6 -6.4 -5.9 -4.7 -3.6
Goods and services exports, USDbn 14.0 9.9 8.2 9.1 10.1 11.2 12.3
Goods and services imports, USDbn 12.9 11.9 10.7 11.6 12.6 13.4 14.6
Current account balance, USDbn 0.6 -1.9 -1.9 -2.4 -1.9 -1.6 -1.6
Current account balance, % of GDP 1.7 -5.9 -5.7 -6.3 -5.0 -4.2 -3.9
Foreign reserves ex gold, USDbn 13.5 11.6 8.5 8.5 8.7 9.0 9.3
Import cover, months 16.4 15.3 12.9 11.8 11.1 10.5 10.0
Total external debt stock, USDbn 8.9 9.9 11.0 12.0 12.4 14.2 15.0
Total external debt stock, % of GDP 27.0 30.0 32.6 32.0 32.4 35.9 37.1
Crude, NGPL & other liquids prod, 000b/d 66.0 72.9 67.2 71.2 73.1 74.8 75.7
Total net oil exports (crude & products), 000b/d -14.9 -9.1 -15.9 -13.0 -12.4 -11.8 -12.4
Dry natural gas production, bcm 21.8 22.2 21.4 20.8 20.6 20.9 21.3
Dry natural gas consumption, bcm 4.2 4.3 4.8 5.1 5.4 5.6 5.8
e/f = BMI estimate/forecast. Source: National sources, BMI
www.bmiresearch.com Page 11Andean | September 2018
Government spending will offer tailwinds to consumption and investment. We expect Investment Will Continue To Follow Energy Prices
Bolivia – Inbound FDI & WTI
government spending on education, public infrastructure and health care – a pillar of
President Evo Morales's political agenda – will pick up in H218 (see 'Elevated Spending To
Keep Fiscal Deficit Wide', May 24). In recent quarters the Morales government has rolled
back many of the austerity measures imposed after the 2015-2016 collapse in government
revenues, aiding growth in the infrastructure and services sector. The government will keep
spending elevated in the next 12 months prior to the 2019 presidential election, in which
Morales will likely face a more challenging contest after a favourable court ruling will allow
him to disregard a previous law that set a two-term limit (see 'Morales Will Struggle To Win
Re-Election In 2019', April 20).
Source: World Bank, BMI
www.bmiresearch.com Page 12You can also read


