Cromwell Property Group (ASX:CMW) HY20 Results Presentation
←
→
Page content transcription
If your browser does not render page correctly, please read the page content below

Thursday 27 February 2020

ASX Market Announcements Office
Exchange Centre
20 Bridge Street
SYDNEY NSW 2000

Dear Sir/Madam

Cromwell Property Group (ASX:CMW)
HY20 Results Presentation
Attached is a copy of Cromwell Property Group’s HY20 Results Presentation.
Yours faithfully
CROMWELL PROPERTY GROUP

LUCY LAAKSO
COMPANY SECRETARY
Authorised for lodgement by Lucy Laakso (Company Secretary) and Paul Weightman (Chief Executive
Officer).

Media Enquiries:
Honner Media
Paul Cheal / Jessica Effeney
+61 (0) 427 755 296 / +61 (0) 400 998 373
paul@honner.com.au / jessica@honner.com.au

ABOUT CROMWELL PROPERTY GROUP

Cromwell Property Group (ASX:CMW) is a diversified real estate investor and manager with
operations on three continents and a global investor base. As at 31 December 2019, Cromwell had a
market capitalisation of $3.1 billion, a direct property investment portfolio valued at $3.2 billion and
total assets under management of $11.9 billion across Australia, New Zealand and Europe.
HY20 Results
Presentation
27 February 2020

                   CROMWELL PROPERTY GROUP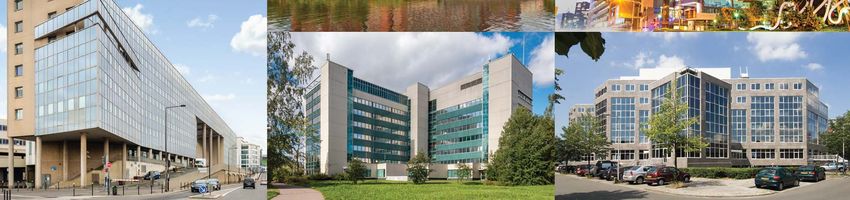
Important Information & Disclaimer
This    presentation     including     its  appendices       advice as they deem necessary or                  consider     777 AFSL 333214 (CFM) is the responsible entity of,
(Presentation) is dated 27 February 2020 and has             appropriate for their particular jurisdiction.                 and the issuer of units in the Cromwell Australian
been prepared by Cromwell Property Group, which                                                                             Property Fund ARSN 153 092 516 (APF), Cromwell
                                                             Cromwell Property Group does not guarantee any
comprises Cromwell Corporation Limited (ACN 001                                                                             Direct Property Fund ARSN 165 011 905 (DPF),
                                                             particular rate of return or the performance of an
056 980) and the Cromwell Diversified Property Trust                                                                        Cromwell Ipswich City Heart Trust ARSN 154 498 923
                                                             investment in Cromwell Property Group nor do they
(ARSN 102 982 598) (the responsible entity of which                                                                         (ICH), Cromwell Phoenix Core Listed Property Fund
                                                             guarantee the repayment of capital from any such
is Cromwell Property Securities Limited (ACN 079 147                                                                        ARSN 604 286 071 (PCF), Cromwell Phoenix
                                                             investment or any particular tax treatment. Past
809; AFSL 238052)). Shares in Cromwell Corporation                                                                          Opportunities Fund ARSN 602 776 536 (POF),
                                                             performance is not a reliable indicator of future
Limited are stapled to units in the Cromwell Diversified                                                                    Cromwell Phoenix Property Securities Fund ARSN
                                                             performance. Any “forward-looking” statements are
Property Trust. The stapled securities are listed on the                                                                    129 580 267 (PSF), Cromwell Property Trust 12
                                                             based on assumptions and contingencies which are
ASX (ASX Code: CMW).                                                                                                        ARSN 166 216 995 (C12) and Cromwell Riverpark
                                                             subject to change without notice. Any forward-looking
                                                                                                                            Trust ARSN 135 002 336 (CRT) (the funds). In making
This Presentation contains summary information about         statements are provided as a general guide only and
                                                                                                                            an investment decision in relation to one or more of
Cromwell Property Group as at 31 December 2019.              should not be relied upon as an indication or
                                                                                                                            the funds, it is important that you read the product
Statutory financial information has been reviewed by         guarantee of future performance.
                                                                                                                            disclosure statement for the fund. The PDS for each
Cromwell Property Group’s auditors. Operating
                                                             The information in this Presentation has been                  fund is issued by CFM and is available from
financial information has not been subjected to audit
                                                             obtained from or based on sources believed by                  www.cromwell.com.au or by calling Cromwell on 1300
review. All financial information is in Australian dollars
                                                             Cromwell Property Group to be reliable. To the                 268 078. POF, PCF, ICH, C12 and CRT are not open
and all statistics are as at 31 December 2019 unless
                                                             maximum extent permitted by law, Cromwell Property             for investment. Applications for units in APF, DPF and
otherwise stated.
                                                             Group, their officers, employees, agents and advisors          PSF can only be made on the application form
The information in this Presentation is subject to           do not make any warranty, expressed or implied, as to          accompanying the relevant PDS.
change without notice and does not purport to be             the currency, accuracy, reliability or completeness of
                                                                                                                            This Presentation is for information purposes only and
complete or comprehensive. It should be read in              the information in this Presentation and disclaim all
                                                                                                                            does not constitute an offer to sell, or the solicitation of
conjunction with Cromwell Property Group’s other             responsibility and liability for the information (including,
                                                                                                                            an offer to buy, any securities or any other financial
periodic and continuous disclosure announcements             without limitation, liability for negligence).
                                                                                                                            products in any jurisdiction and is not a prospectus,
available at www.asx.com.au.
                                                             To the extent that any general financial product advice        product disclosure statement or other document under
The information in this Presentation does not take into      in respect of Cromwell Property Group stapled                  Australian law or any other law.
account your individual objectives, financial situation      securities is provided in this Presentation, it is
or needs. Before making an investment decision,              provided by Cromwell Property Securities Limited.
investors should consider, with or without a financial or    Cromwell Property Securities Limited and its related           © 2020. Cromwell Property Group. All rights reserved
taxation adviser, all relevant information (including the    bodies corporate, and their associates, will not receive
information in this Presentation) having regard to their     any remuneration or benefits in connection with that
own objectives, financial situation and needs.               advice.
Investors should also seek such financial, legal or tax
                                                             Cromwell Funds Management Limited ACN 114 782

                                                                                                                                           CROMWELL PROPERTY GROUP                         2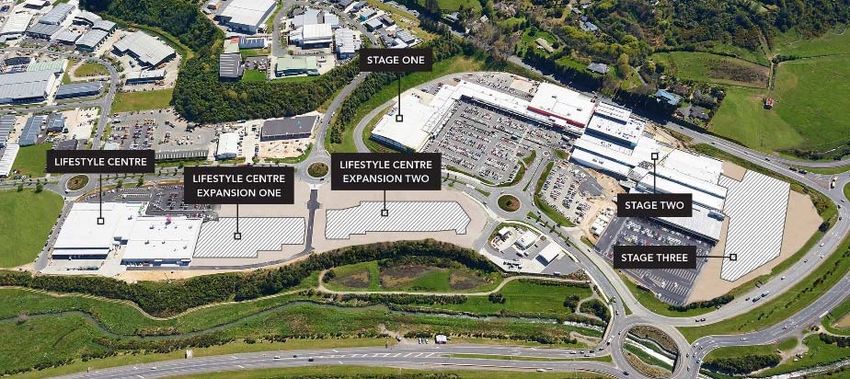
Cromwell Property Group Overview
Cromwell is a real estate investor and manager operating on three continents with a global investor base
Cromwell maintains a strong and secure balance sheet and long-dated direct property portfolio which enables it
to recycle assets and reinvest into its indirect property investment and funds management businesses
Securityholders benefit from stable long term cash flows, demonstrated asset enhancement capabilities and
transactional profits, and low risk exposure to Asian capital flows and European commercial real estate markets
CROMWELL PROPERTY GROUP 3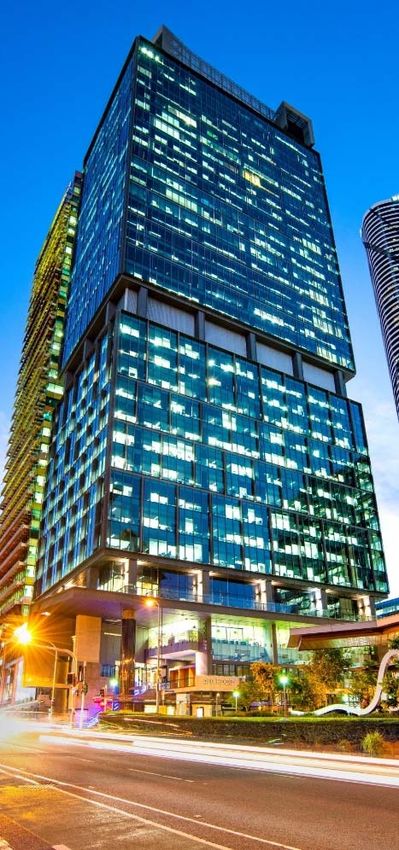
HY20 Summary Results
& Strategy Update

                       CROMWELL PROPERTY GROUP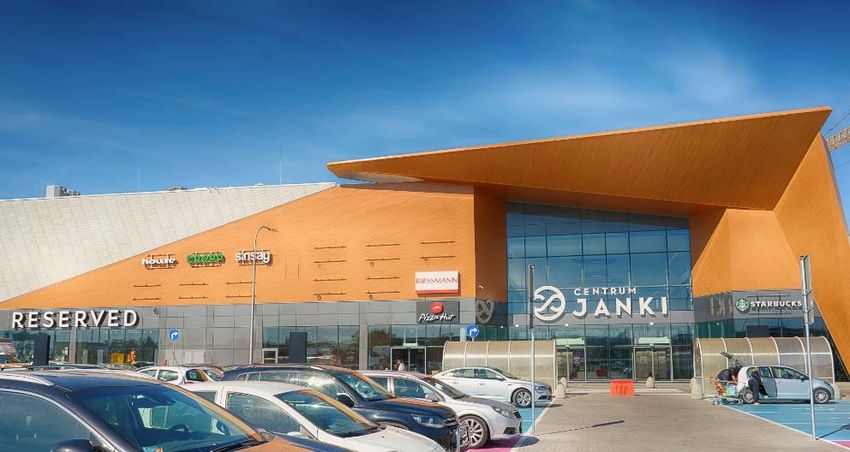
HY20 Summary Results & Strategy Update

                                                                   Statutory profit                                        Statutory profit per security
59%                                                                $227.3 million                                          8.78 cps
increase in statutory                                              up 105% compared to prior                               up 59% on prior comparable
profit per security                                                corresponding period                                    period (HY19 5.52 cps)
                                                                   (HY19 $111.1 million)

26%                                                                Underlying operating profit

                                                                   $134.1 million
                                                                                                                           Operating profit per security

                                                                                                                           5.18 cps
increase in
operating profit per                                               up 62% compared to the prior                            26% ahead of prior
                                                                   corresponding period                                    corresponding period
security
                                                                   (HY19 $82.6 million)                                    (HY19 4.10 cps)

                                                      NTA per unit                         WALE                     Group Gearing        Debt tenor
Well positioned
property portfolio                                    $1.04                                6.1 years                41%                  4.2 years
and balance sheet                                     (FY19 0.99)                          (DPT)                    (pro-forma   39%)1

1.   See Appendix for further details of segment results, operating profit and reconciliation to statutory profit
2.   Post completion of sale of 50% of 475 Victoria Avenue, Chatswood

                                                                                                                                    CROMWELL PROPERTY GROUP   5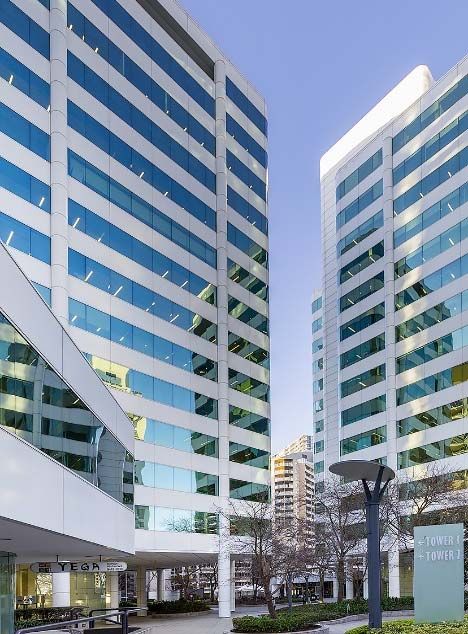
HY20 Summary Results & Strategy Update
400 George Street Brisbane Property Overview
Site Area 2,902 sqm
Acquired for $524.75 million, currently
NLA 43,978 sqm
investigating a range of future options for asset
Occupancy 99.6%
Occupancy rate of 99.6% underpinned by blue- WALE 4.7 years
NABERS Energy 5.5 Star
chip corporate and State and Commonwealth
NABERS Water 4.0 Star
Government tenants
Expiry Profile NLA
Asset has development upside with 35 levels, a
ground level foyer, a mezzanine food court and
30 levels of office above
5.5 Star NABERS Energy, 4.0 Star NABERS
Water and 5.0 Star NABERS Indoor
Environment Ratings as well as a 5.0 Star
Green Star As-Built Rating Income source
CROMWELL PROPERTY GROUP 6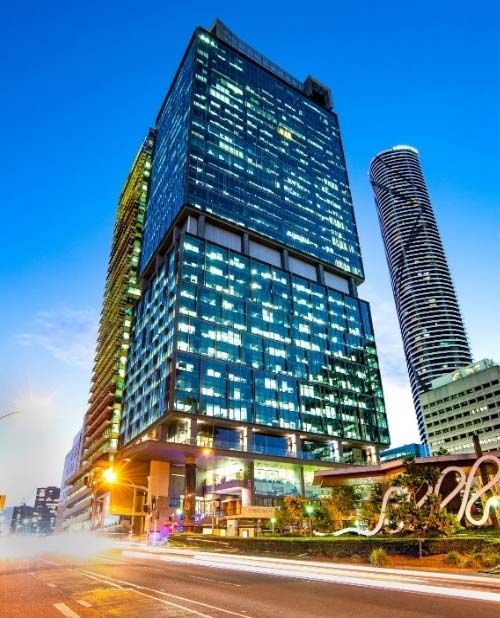
HY20 Summary Results & Strategy Update
Current Value Cap Occupancy
Cromwell Polish Retail Fund Restructure Underway City Class ($M) Rate % by NLA WALE
Centre
Janki Warsaw Retail 389.6 5.50% 91.6% 5.7 years
Cromwell is temporarily warehousing assets
acquired as part of ‘Invest to Manage’ strategy Korona Wroclaw Retail 147.3 6.50% 99.2% 5.4 years
Ster Szczecin Retail 95.5 7.00% 88.8% 3.7 years
CPRF is to be restructured as an EU alternative Rondo Bydgoszcz Retail 91.2 6.75% 96.7% 5.3 years
investment fund (AIF) and managed by Tulipan Lodz Retail 25.6 7.00% 100.0% 6.6 years
Cromwell's Luxembourg regulated manager Kometa Torun Retail 21.8 7.00% 100.0% 7.2 years
Fund restructure to complete end of March, sell- Total 771.0 6.10% 94.9% 5.4 years
down will then commence, targeting an eventual Ursynow2 Warsaw Retail 86.4 89.7% 4.8 years
long-term co-investment stake of 20% – 30%
(similar to CEREIT)
Cromwell has 40 people in Poland. The team
have managed the assets for >10 years
Poland remains Europe’s success story with 5
year average GDP growth figures of 3.4% p.a.
Retail rents and volume of retail space both
remain well below those seen in Western Europe
1. Source: Oxford Economics. 5 year figures 2018 – 2022.
2. Ownership 50%
Centrum Handlowe Janki, Poland
CROMWELL PROPERTY GROUP 7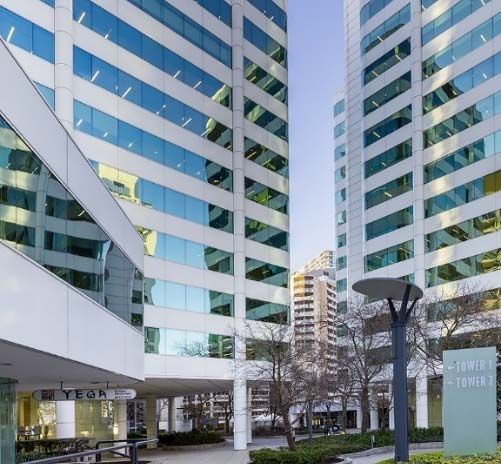
HY20 Results & Strategy Update
475 Victoria Avenue, Chatswood Property Overview
A private fund managed by BlackRock Real Site Area 6,030 sqm
Estate will acquire a 50% stake in the asset for NLA 24,812 sqm
$120 million Occupancy 92.2%
WALE 3.0 years
Cromwell will enter into a joint venture
NABERS Energy 5.0 Star
relationship with BlackRock for the expansion of
NABERS Water 3.0 Star
the asset
Cromwell and Blackrock will explore new ways
to further increase value
Towers originally acquired in March 2006 with
refurbishment and modernisation works
undertaken since acquisition
Recent lease deals include Reed Elsevier
Australia renewing 4,580 sqm across five levels
for a further five years
CROMWELL PROPERTY GROUP 8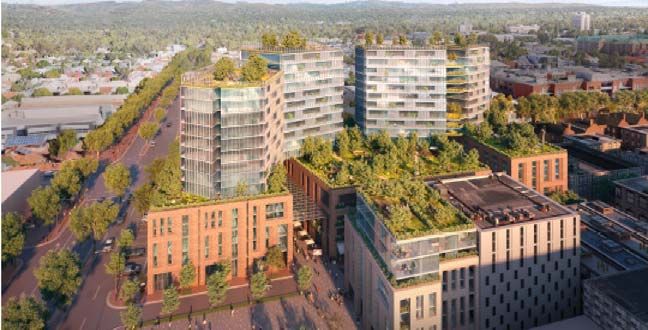
Financial and Capital
Management Update

                        CROMWELL PROPERTY GROUP
HY20 Headline Results1
Financial and Capital Management Update
HY20 Commentary HY20 Performance Versus PCP
Statutory profit was $227.3 million, up 105% HY20 HY19 Change
compared to prior corresponding period (HY19
$111.1 million) Statutory profit ($M) 227.3 111.1 104.6%
Statutory profit per security was 8.78 cps, up 59% Statutory profit
on prior comparable period (HY19 5.52 cps) 8.78 5.52 59.1%
(cents per security)
Underlying operating profit of $134.1 million, up
62% compared to the prior corresponding period Operating profit ($M)1 134.1 82.6 62.4%
(HY19 $82.6 million)
Operating profit
Operating profit was 5.18 cps, 26% ahead of prior 5.18 4.10 26.4%
(cents per security)
corresponding period (HY19 4.10 cps)
Distributions of $97.5 million up 27% on the prior Distributions ($M) 97.5 76.5 27.5%
corresponding period ($76.5 million)
Distributions
Distributions per security of 3.75 cps, on track for 3.75 3.63 3.3%
(cents per security)
full year guidance of 7.50 cps
Payout ratio 72.7% 92.6% (21.5%)
1. See Appendix for further details of segment results, operating profit and reconciliation to statutory profit
CROMWELL PROPERTY GROUP 10HY20 Segment Results1
Financial and Capital Management Update
HY20 Commentary HY20 Segment Profit Versus PCP
Direct property investment segment profit was HY20 HY19
$105.7 million, strongly up 68.6% on the prior ($M) ($M) Change
period, driven by strong like-for-like NOI growth Direct property investment 105.7 62.7 68.6%
Indirect property investment segment profit, Indirect property investment 25.8 19.4 33.0%
primarily represented by Cromwell’s stake in
CEREIT was up 33.0% from $19.4 million to $25.8 Funds and asset management 31.1 18.6 67.2%
million Total segment results 162.6 100.7 61.5%
Funds and asset management segment profit was
$31.1 million, up 67.2% from $18.6 million Finance income 2.9 3.2 (9.4%)
Corporate costs2 (21.1) (19.5) 8.2%
Corporate costs up $1.6 million led by increased
insurance premiums Income tax expense (10.3) (1.8) 472%
Development profit booked from the sale of
Northpoint Tower of $32 million (pre-tax) Operating profit 134.1 82.6 62.4%
1. See Appendix for further details of segment results, operating profit and reconciliation to statutory profit
2. Includes non-segment specific corporate costs pertaining to Group level functions such as finance and Operating profit (cents per security) 5.18 4.10 26.3%
tax, legal, risk and compliance, corporate secretarial and marketing and other corporate services
CROMWELL PROPERTY GROUP 11Balance Sheet
Financial and Capital Management Update
HY20 FY19
Balance Sheet Liquid and Well Positioned ($M) ($M)
Cash and cash equivalents 186.8 101.6
Cash and cash equivalents of $186.8 million, up Investment property 3,926.7 2,520.9
83.9% or $85.2 million from 30 June 2019 Equity accounted investments 708.4 814.5
Receivables 286.6 194.2
Cromwell’s 30.4% stake in CEREIT of $637 million Intangibles 6.6 4.5
was recorded as an equity accounted investment
Investments at fair value 19.3 22.6
Total assets increased by $1,494 million as the Other assets 55.1 37.4
balance sheet expanded on the back of Invest to Total assets 5,189.5 3,695.7
manage strategy
Interest bearing liabilities (2,232.0) (1,356.4)
Net Tangible Assets (NTA) up to $1.04 per security Derivative financial instruments (40.6) (37.1)
compared to $0.99 per security FY19 Distribution payable (48.9) (40.5)
Payables (123.9) (60.3)
Total number of securities on issue as at 31 Other liabilities (39.3) (18.4)
December 2019 was 2,606.6 million (2,236.6 million Total liabilities (2,484.7) (1,512.7)
30 June 2019) Net assets 2,704.8 2,183.0
Securities on issue 2,606.6 2,236.6
NTA per security (excl. interest rate swaps) $1.04 $0.99
1
1. Gearing calculated as (total borrowings less cash)/(total tangible assets less cash). Look through gearing
Gearing 40.8% 35.0%
adjusts for 30.4% of CEREIT and 50% in LDK Joint Venture Gearing (look-through) 1
45.1% 42.3%
CROMWELL PROPERTY GROUP 12Capital Position
Financial and Capital Management Update
Strong Debt Profile, Gearing1 Within Target Range Group Gearing (2009 to 2019)
55.00
Target ‘through the cycle’ gearing of 30% – 40%
with leverage capacity to be used on a short term 50.00
basis to execute the ‘Invest to Manage’ strategy 45.00
40.00
HY20 gearing was 0.8% above target range, but on
35.00
a pro-forma basis has dropped to 39%, within range
and prior to the planned sell down of CPRF 30.00
Target Gearing Range CMW Gearing
25.00
Weighted average debt expiry was 4.2 years,
diversified across 21 domestic and international
lenders and two Convertible Bond issues (2020 Debt Expiry Profile
bond issue was repaid February 2020)
$ 1,400 M
$ 1,300 M
68.2% of balance sheet hedged with a weighted $ 1,200 M
$ 1,100 M
average hedge term of 2.0 years
Debt Balance ($M)
$ 1,000 M
$ 900 M
$ 800 M
Forward exposures remain actively managed $ 700 M
$ 600 M
against an annually agreed target to ensure the $ 500 M
$ 400 M
best possible protection $ 300 M
$ 200 M
$ 100 M
$0M
FY 2020 FY 2021 FY 2022 FY 2023 FY 2024 FY 2025 FY 2026
1. Gearing calculated as (total borrowings less cash)/(total tangible assets less cash). Look through gearing Australian Major Banks $ 0.0 M $ 0.0 M $ 0.0 M $ 500.0 M $ 0.0 M $ 0.0 M $ 0.0 M
adjusts for 30.4% of CEREIT and 50% in LDK Joint Venture International Banks $ 0.0 M $ 180.6 M $ 7.5 M $ 849.5 M $ 200.0 M $ 0.0 M $ 60.0 M
Convertible Bond $ 87.5 M $ 0.0 M $ 0.0 M $ 0.0 M $ 0.0 M $ 350.3 M $ 0.0 M
CROMWELL PROPERTY GROUP 13Direct Property
Investment
Segment
CROMWELL PROPERTY GROUPProperty Portfolio Snapshot (DPT properties only)
Direct Property Investment Segment
75% 23% 2%
Core Portfolio Core+ Portfolio Active Portfolio
Wale: 7.9 years Wale: 3.2 years Wale: 0.1 years
Occupancy: 99.7% Occupancy: 96.2% Occupancy: 48.8%
NOI growth: 3.4% NOI growth: 2.1% NOI growth: 64.8%
3 QANTAS GLOBAL HQ TUGGERANONG CAR PARK
Mascot, NSW 207 KENT STREET Greenway, ACT
Sydney, NSW
MCKELL BUILDING LOVETT TOWER
475 VICTORIA AVENUE
8 Sydney, NSW
Chatswood, NSW
Woden, ACT
1 STATION STREET
7 Penrith, NSW REGENT CINEMA CENTRE BORROWDALE HOUSE
Albury, NSW Woden, ACT
2 CROWN STREET
ORACLE BUILDING 19 NATIONAL CIRCUIT
Wollongong, NSW
Lyneham, ACT Barton, ACT
BULL STREET
TGA COMPLEX WAKEFIELD STREET
Newcastle, NSW
Key Portfolio Metrics Symonston, ACT Adelaide, SA
700 COLLINS STREET
200 MARY STREET
No. properties on balance sheet 21 Docklands, VIC
Brisbane, QLD
VILLAGE CINEMAS
Value A$3.2bn Geelong, VIC
WACR 5.63% 400 GEORGE STREET
Brisbane, QLD
Occupancy by NLA 92.5% HQ NORTH TOWER
Fortitude Valley, QLD
WALE 6.1 yrs
SOWARD WAY
Greenway, ACT
CROMWELL PROPERTY GROUP 15Portfolio Valuation Continues to Improve
Direct Property Investment Segment
Eleven assets were externally revalued in the period representing approximately half of the portfolio by value
Fair value increase in investment property of $110.1 million net of property improvements, lease costs and incentives
Portfolio quality continues to improve, Weighted Average Cap Rate tightened by 0.10% to 5.63%
FY19 Weighted Average Cap Rate Change Historic Weighted Average Cap Rate
9.00%
8.50%
0.08%
5.73% 8.00%
-0.02% 5.63% 7.50%
-0.16% 7.00%
6.50%
6.00%
5.50%
5.00%
Jun-2009
Dec-2009
Jun-2010
Dec-2010
Jun-2011
Dec-2011
Jun-2012
Dec-2012
Jun-2013
Dec-2013
Jun-2014
Dec-2014
Jun-2015
Dec-2015
Jun-2016
Dec-2016
Jun-2017
Dec-2017
Jun-2018
Dec-2018
Jun-2019
Acquisitions
CROMWELL PROPERTY GROUP 16Tenant Customer Profile Remains Robust
Direct Property Investment Segment
Geographic Diversification1 Sector Diversification1 Tenant Classification1
7.2% 1.4%
13.9% ACT
9.0% 7.2%
26.7%
NSW Government Authority
2
Office 40.2%
QLD Healthcare Listed Company/Subsidary
29.0% VIC Retail
40.9% Private Company
SA
91.4% 33.1%
% of Gross
Tenant profile remains consistent and of high quality
Top Tenants1 Income Cumulative % Credit Rating3
Top 4 tenants account for 53.8% of income 21.1% 21.1%
Federal Government AAA
Government2 contributes just over 40% of income 13.7% 34.8%
Qantas Baa2
More than 40% of the portfolio is in NSW and benefitting 11.0% 45.8%
from strong leasing conditions, increase in QLD post NSW State Government AAA
acquisition of 400 George street, ACT next largest at 13.9% QLD State Government 8.0% 53.8% AA+
TOTAL 53.8%
1. By gross passing income
2. Includes Government owned and funded entities
3. S&P/Moodys Ratings as at 26 February 2020
CROMWELL PROPERTY GROUP 17Favourable Lease Expiry Profile
Direct Property Investment Segment
The majority of vacancy is contained in the active portfolio Lease Expiry Profile % Gross Income3
within properties which are earmarked for redevelopment
Average fixed review in next three years 70.0%
3.50% over 26% of portfolio in FY20 4 60.0% 58.1%
3.05% over 65% of portfolio in FY21
3.67% over 58% of portfolio in FY22 50.0%
40.0%
Next Review Type2,3 30.0%
100% 5%
90% 14% 20.0%
80% 30% 11.4%
8.4%
70% 28% 10.0% 5.8% 5.4% 6.7%
63% 4.2%
No review
60%
50% Market 0.0%
1
Vacant 2020 2021 2022 2023 2024 Thereafter
40% CPI
30% 11% 65%
58% Fixed
20%
10% 26%
NSW:2% NSW:17% NSW:52% NSW:18% NSW:63% NSW: 84% NSW:48%
QLD: 25% QLD: 52% QLD:41% QLD: 48% QLD: 30% QLD: 11% QLD: 27%
0% ACT: 73% VIC: 29% ACT: 7% VIC: 1% ACT: 6% ACT: 5% VIC: 13%
FY20 4 FY21 FY22 ACT: 2% ACT: 33% ACT: 12%
1. Includes vacancy, holdover, casual
2. Includes CPI reviews with a fixed minimum amount
3. Calculated on current gross passing income, subject to review and rounding
4. FY20 reviews are for the remaining 6 months (1-Jan-20 to 30-Jun-20) only
CROMWELL PROPERTY GROUP 18Core and Core+ portfolio 98.75% Occupied
Direct Property Investment Segment
Leasing update
64 lease transactions, for a total of 83,775 sqm, in HY20
Core portfolio is 99.7% leased with the Core+ portfolio at 96.2% which equates to a
98.75% occupancy rate by NLA
Major transactions
Reed Elsevier renewed five levels for a further five years for a total of 4,580 sqm at
Victoria Avenue, Chatswood
1,686 sqm of leasing transactions at 200 Mary Street, Brisbane which brings the
occupancy for the asset up to 98.5% Victoria Avenue, Chatswood
10 year renewal of the lease for the Albury cinema
2,017 sqm of leasing transactions at 207 Kent Street, Sydney
1,906 sqm of leasing at 400 George Street, Brisbane
Major lease expiries >1% of gross income
1. Active Asset - Wakefield Street where Calvary Healthcare Adelaide occupied 17,881
sqm. This property is now vacant and earmarked for redevelopment with master planning
for the site underway
2. Active Asset – Centenary House where the Commonwealth Government tenancy
expired at 31 December 2019. This property is earmarked to be demolished and a new
c. 18,000 sqm building is to be constructed, with the DA to be submitted next month
400 George Street, Brisbane
CROMWELL PROPERTY GROUP 19Development Pipeline Grows to >$1.2 billion
Direct Property Investment Segment
Asset recycling strategy ongoing since 2010 with over $488 million of assets sold in 24 months to 31 December 2019
Proceeds have facilitated creation of a >$1.2 billion pipeline of value add development opportunities
Victoria Avenue, 700 Collins Street, Centenary House,
Greenway Views, ACT1 Confidential Projects
Chatswood NSW Melbourne VIC ACT
Construction has
DA to be reviewed and DA submitted July 2019 Asset to be knocked
commenced converting Negotiations on
potentially resubmitted for an additional 13,000 down and replaced with
office buildings to redevelopment of existing
Description mid year for larger office sqm of office, 182 room a brand new 18,000
Seniors Living, with assets with new and
tower on site. Response hotel and c.280 residential sqm A-Grade office
35,000sqm capacity for existing tenants
expected early 2021 accommodation units. building
further development
Existing DA to be Awaiting DA Approval
Status Ongoing DA submitted New
reviewed (expected mid 2020)
Development cost
>$150 million c.$100 million c.$350 million c.$85 million >$500 million
(estimated)
Proposed timing FY19-21 FY22-23 FY22-24 FY21+ FY21+
1. Cromwell has a 50% ownership interest in LDK Healthcare, the operator of a planned Seniors Living community at Greenway, ACT
CROMWELL PROPERTY GROUP 20Masterplan of 300 Wakefield Street, Adelaide
Direct Property Investment Segment
Asset became vacant in February 2020
Site covers 8,725 sqm located on the western edge of the
Adelaide CBD near Hutt Street dining precinct
The current masterplan concept integrates a number of
proposed uses into an aging in place development that is
complementary to its location, future Adelaide precinct vision
and Cromwell’s desired outcomes
Masterplan incorporates mixed use ‘Health Precinct’ concept
including retail, allied health and rehabilitation, childcare,
residential and / or seniors living accommodation with a
ground floor ‘village square’ with a mix of public and private
uses
Cromwell is currently considering the feasibility of the
concepts and masterplan
Artist Impressions, indicative only
CROMWELL PROPERTY GROUP 21Indirect Property
Investment
Segment
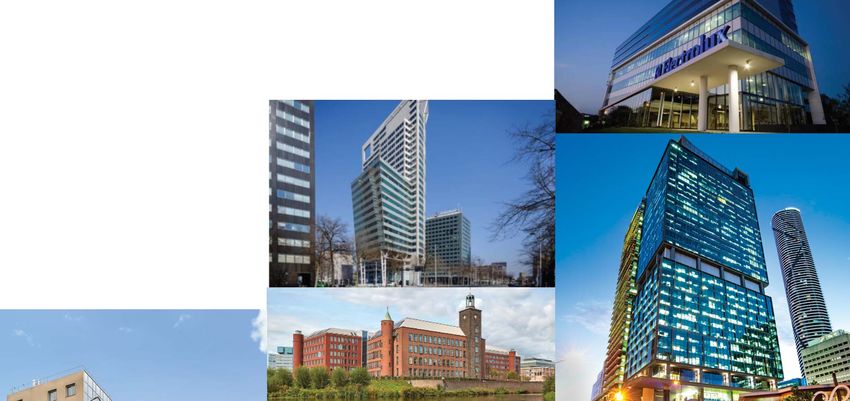
CROMWELL PROPERTY GROUPSegment Results Driven by CEREIT Success
Indirect Property Investment Segment
Operating profit for the segment was $25.8 million up 33%
from $19.4 million in the prior comparable period (HY19)
This was mostly due to CEREIT, which announced 2019
results to the Singapore Exchange Securities Trading
Limited on 25 February 20191
CEREIT has delivered consistently above the IPO Bretten Parc Des Grésillons Green Office
Pforzheim, Germany Paris, France Krakow, Poland
Forecast since listing and reported net Property Income of
€116.1 million
CEREIT FY2019 distributions per unit, of 4.08 Euro cents
were up 8.8% year on year and above IPO forecast
CEREIT’s portfolio value has grown by >55% in two
years2
Central Plaza Koningskade Plaza Forte
Cromwell’s 30.4% equity accounted share of CEREIT’s Rotterdam, The Netherlands The Hague, The Netherlands Helsinki, Finland
profit was $22.8 million (HY19: $25.3 million) and the
stake is now valued at over €400 million ($637 million)
1. For the Financial Period, which refers to the financial period from 30 November 2017 to 31 December 2019
2. €1,354 million at IPO versus €2,103 million upon successful completion of the sale of Parc d’Osny. Milano Piazza Affari Herstedvang 2-4 Paryseine
Milan, Italy Copenhagen, Denmark Paris, France
CROMWELL PROPERTY GROUP 23CEREIT Portfolio Now 103 Properties
Indirect Property Investment Segment
Properties 103 Finland
Occupancy Rate (by lettable area) 93.2% Properties 11
Lettable Area (sq m) 61,977
Valuation (€)1 2,103 million
Valuation (€ million) 115.5
WALE / WALB2 4.4 years / 3.5 years % of Portfolio 5.5%
% Freehold3 91.6% Average Reversionary Yield 7.8%
Average Reversionary Yield4 6.7% Germany
Denmark Properties 11
Properties 13 Lettable Area (sq m) 166,456
Lettable Area (sq m) 151,489 Valuation (€ million) 120.0
Valuation (€ million) 83.7 % of Portfolio 5.7%
% of Portfolio 4.0% Average Reversionary Yield 7.0%
Average Reversionary Yield 7.9%
The Netherlands Poland
Properties 17 Properties 6
Lettable Area (sq m) 260,205 Lettable Area (sq m) 111,101
Valuation (€ million) 243.9
Valuation (€ million) 636.1
% of Portfolio 11.6%
% of Portfolio 30.2%
Average Reversionary Yield 7.9%
Average Reversionary Yield 5.7%
Italy France
Properties 18 Properties 27
Lettable Area (sq m) 348,196 Lettable Area (sq m) 363,577
Valuation (€ million) 476.7 Valuation (€ million) 427.6
% of Portfolio 22.7% % of Portfolio 20.3%
Average Reversionary Yield 6.0% Average Reversionary Yield 7.8%
1. Valuations as at 31 December 2019 except 12 properties exchanged for sale in December are recorded at sale price
2. WALE and WALB as at 31 December 2019. WALE is defined as weighted average lease expiry by headline rent based on the final termination date of the agreement (assuming the tenant-customer does not terminate the lease on any of the permissible break
date(s), if applicable); WALB is defined as the weighted average lease break by headline rent based on the earlier of the next permissible break date at the tenant’s election or the expiry of the lease
3. % freehold and continuing / perpetual leasehold by value
4. A proxy to present cap rate. Reversionary Yield is the net market rental value per annum (net of non-recoverable running costs and ground rent) expressed as a percentage of the net capital value. The reversionary yield for the portfolio and sub portfolios is the
average reversionary yield weighted by the valuation
CROMWELL PROPERTY GROUP 24430 LDK Apartments Operational End April
Indirect Property Investment Segment
Seniors Living opportunity
Cromwell has a 50% ownership interest in LDK Healthcare (LDK)
LDK has one operational village in North Sydney and one in
Greenway, ACT which accepted its first residents this month
Ongoing discussions with interested capital partners to scale-up
and establish a sizeable business over the medium term
Additional sites already identified
The Landings
The Landings, a 220 home Seniors village on the Upper North
Shore Sydney was acquired for $60 million early in 2019
Successful conversion of 97.3% of existing residents to LDK Greenway Views, ACT
model means capital appreciation of underlying assets expected
Greenway Views
Adaptive re-use of Tuggeranong Office Park to a planned >390
apartment, 500 seniors living village continues
First block (of five) complete, two currently underway to complete
by April, meaning 210 apartments then operational
Sales progressing well, first residents have moved in with care
and meals being delivered
Greenway Views, ACT
CROMWELL PROPERTY GROUP 25Funds and Asset
Management
Segment
CROMWELL PROPERTY GROUPFoundations For Growth Locked In
Funds and Asset Management
Segment Overview Cromwell Funds Under Management
Total Funds and Asset management segment profit
was up 67% to $31.1 million (HY19 $18.6 million)
Total segment FUM was $8.3 billion split between $2.2
billion of retail FUM and $6.1 billion of wholesale FUM
European Funds Management Update
FUM within Europe was steady at €3.8 billion ($6.1
billion) but there was again substantial transactional
activity of c.€1.0 billion (excl. CPRF) Path to Securing European FUM
This included the managed sell-down of the German € 9.0 € 8.0
Portfolio within the Cromwell European Diversified € 8.0
Fund generating an IRR of 19% for investors € 7.0
75%
€ 6.0
FY20 represents the last major year of sell-downs
€ 5.0
relating to historically acquired funds € 3.4
€ 3.9 € 3.8 € 3.8
€ 4.0
Post completion of recent CEREIT acquisitions and € 3.0 72%
investor interests in Cromwell Polish Retail Fund € 2.0 49%
36%
recurring income has increased to 72% € 1.0
0%
Platform is ready to scale with medium term target of €-
Jun-17 Jun-18 Jun-19 Dec-19 Medium term
€8 billion and 75% of earnings from recurring income target
European FUM ($B) % recurring FUM
CROMWELL PROPERTY GROUP 27High Level of Activity To Peak 2019/20
Funds and Asset Management
Key activity in Europe European FUM by Region
€ 1.2 € 1.1
449,712 sqm of leases signed in 602 transactions, 12 leases
per week, every week, for the year € 1.0 € 0.9
Czech Republic: Sold Galerie Butovice shopping centre in € 0.8
Billion
western Prague for a price in excess of €80 million € 0.6
€ 0.6
Denmark: 9 new leases, in total 1,545 sqm was signed in € 0.4 € 0.4
€ 0.4
the last quarter with an additional 2,335 sqm in Q1 2020 € 0.2
€ 0.2
€ 0.2
France: Resumed leasing Parc des Docks, leasing 11,227
sqm in 1H 2019, and another 3,500 sqm of in 4Q 2019 €-
Italy UK Benelux Nordics CEE Germany France
Germany: Stone portfolio of three industrial assets acquired
on behalf of CEREIT in Pforzheim, near Stuttgart Change in FY19 European FUM
Netherlands: Extended lease with the anchor tenant at € 3.8 € 3.8
€ 0.3
Haagse Port for c.16.000 sqm, additional requirements of € 0.4
6,000 sqm also incorporated into lease
Netherlands: Completed the sale of The Mark, a prominent -€ 0.7
22,795 sqm office building located in Rotterdam
Poland: Acquired Poznan’s Business Garden business park
for €88.8 and two office buildings in Krakow for €80 million
on behalf of CEREIT
Poland: Completed major €65 million expansion and
refurbishment of Janki shopping centre adding 21,000 sqm
CROMWELL PROPERTY GROUP 28DPF Inflows Strengthen
Funds and Asset Management
Cromwell Direct Property Fund (DPF) Phoenix Portfolios – Property Securities Fund (PSF)
DPF purchased its seventh direct asset, located at 11 Farrer The Fund is the only property securities fund in Australia
Place, Queanbeyan for $35 million in October 2019 that currently has a highly recommended rating from
Inflows >$112 million in the six months to 31 December 2019 independent research houses Lonsec and Zenith
Gross assets now in excess of $457 million and performance Inflows in excess of $39 million in the six months to 31
since inception (August 2013) is 10.2% annualised (31 December 2019
December 2019) Assets in excess of $300 million and performance since
DPF has low gearing, a highly recommended rating from inception (April 2008) is 9.7% annualised (31 December
independent research house Lonsec and a distribution yield 2019), outperforming the AREIT 300 Accumulation index
of 5.8% by 4.4% per annum
Altitude Corporate Centre, Mascot
CROMWELL PROPERTY GROUP 29Oyster Continues Growth
Funds and Asset Management
AUM at Oyster Group in New Zealand (50% interest)
was up slightly to NZ$1.8 billion (FY19 NZ$1.7 billion)
Key activity during the half
Oyster formed a limited partnership to acquire a 60%
ownership share in Tauranga Crossing Shopping Centre,
Lifestyle Centre, and development land
Tauranga Crossing Shopping Centre
The resulting investment opportunity will be marketed to
institutional investors in 2020
Oyster Industrial Limited closed fully subscribed in October
just two weeks after opening. The fund is underpinned by two
newly developed properties in South Auckland’s sought-after
Wiri industrial precinct, supported by long-term leases and
fixed rental growth
The $17.9 million raise attracted strong demand from investors
and is forecast to provide annual pre-tax cash returns of 5.25%
101 McLaughlins Road and 12 Harbour Ridge Drive Wiri, Auckland
CROMWELL PROPERTY GROUP 30Outlook and
Guidance
CROMWELL PROPERTY GROUPEconomic Growth To Slow
Outlook and Guidance
2020 was seen as a ‘go slow’ year with global GDP 2020 Forecast (Select) Global GDP Growth Rates
growth, before the Coronavirus, forecast to be 2.5%
6.00%
G7 major economies at 1.2%, China and India at 6.0% 5.00%
Australian GDP growth of 2.1% under global average of 4.00%
2.5% and now expected to slow considerably due to 3.00%
natural disasters and impact of Coronavirus 2.00%
The Eurozone economy is also slow, 2020 GDP growth 1.00%
across the EU27 was forecast to be 1.0% picking up to 0.00%
1.3% in 2021
Central European countries (e.g. Poland, Czech
Republic) are expected to continue to out-perform their Australian Quarterly GDP Growth Rate
western counterparts
Eurozone data indicates a struggling manufacturing
sector is being offset by strong domestic demand
underpinned by unemployment at a decade low of 7.5%
Source: Trading Economics.com, Australian Bureau of statistics
CROMWELL PROPERTY GROUP 32Australian Real Estate Snapshot
Outlook and Guidance
Australian CBD vacancy is essentially unchanged during Total Australian CBD Office Vacancy (%)
the half at 8.0% (7.9% FY19), with non-CBD vacancy
20.0% 17.6%
slightly higher at 9.1%
14.0%
15.0% 12.7%
Sydney and Melbourne CBDs continue to be the tightest 10.3%
markets with cyclical low CBD office vacancy rates (3.9% 10.0% 8.0%
and 3.2% respectively) 3.9%
5.0% 3.2%
Both of these markets are in development phase with 1.56
0.0%
million sqm of new stock in pipeline in CBDs, nearly half Sydney Melbourne Canberra Brisbane Perth CBD Adelaide Australian
CBD CBD CBD CBD CBD Office
(47%) of this is in Melbourne with a further 25% in Sydney
Source: PCA
Ongoing demand means office and industrial / logistics
Future Supply of CBD Markets
sector yields continue to tighten, retail remains out of
800,000
favour 2020 2021 2022+
700,000
Investor demand continues to slowly recede from record 600,000
500,000
levels in 2018 but offshore capital continues to look for
SQM
400,000
opportunities given yield discrepancies with other 300,000
international markets 200,000
100,000
0
Melbourne Sydney Brisbane Canberra Adelaide Perth CBD
CBD CBD CBD CBD
Source: PCA
CROMWELL PROPERTY GROUP 33European Real Estate Snapshot
Outlook and Guidance
Europe’s commercial real estate markets are in relatively good Investment by Sector1
health despite a slowing economy and investment volumes
which are slightly below the peak in 2018 Office
2%4%
Capital inflows are still robust (with cross border capital Industrial
accounting for 48% of all European transactions) 19%
Retail
42%
Investor appetite for the office sector continues, accounting for Hotel
42% of trading volumes. Apartments (residential) came a 8%
Apartment
surprising second (19%), followed by retail (13%) and industrial
13% Seniors Housing & Care
sectors (12%), similar to the previous year 12%
Higher levels of activity recorded in ‘non-traditional’ sectors Dev Site
such as hotels and seniors housing & care
The current low-interest rate environment is helping to attract Top 10 European Destinations (€ million)1
capital offsetting, to some extent, the weaknesses caused by
external geopolitical and economic headwinds Germany (76,425)
Germany again surpassed the UK in volume terms but both 3%2%2% UK (58,692)
4%
markets continue to take the majority of investment. France 25% France (41,622)
5%
The Netherlands (22,046)
also had a strong year with The Netherlands and Spain 6% Sweden (18,309)
rounding out the top 5 positions Spain (16,310)
7%
Italy (11,843)
Poland (7,808)
14% 19%
Ireland (7,609)
Finland (6,794)
Sources:
2020 Real Capital Analytics. 12 months to December 2019.
CROMWELL PROPERTY GROUP 34Guidance Affirmed, Strategic Review Underway
Outlook and Guidance
FY20 Guidance Affirmed For further information please contact:
Business well-positioned to meet possible risks, strong balance sheet with
liquidity, proforma gearing in target range, long debt tenor and long WALE Paul Weightman
Focus on continued successful execution of ‘Invest To Manage’ strategy CEO / Managing Director
paul.weightman@cromwell.com.au
FY20 operating profit affirmed at 8.30 cps with FY20 distribution Phone: +61 7 3225 7720
guidance affirmed at 7.50 cps, representing an operating profit yield of
7.03% and a distribution yield of 6.36% respectively1
Michael Wilde
Chief Financial Officer
michael.wilde@cromwell.com.au
Strategic Review Underway
Phone: +61 7 3225 7729
Cromwell is currently undertaking a Strategic Review, in conjunction with its
advisers UBS and Goldman Sachs
Ross McGlade
Review will examine all aspects of the business, assess the current ‘Invest to Investor Relations Manager
Manage’ strategy and Cromwell welcomes input from all securityholders ross.mcglade@cromwell.com.au
All options to maximise securityholder value will be considered including a Phone: +61 2 8278 3613
formal sale process of the Group or parts of the Group and the capital levels
required to execute the Groups strategy
Conclusion of Strategic Review is expected prior to FY20 results
Investor Services Brisbane Office Sydney Office London Office Auckland Office Singapore Office
1300 276 693 Level 19, Level 14 7 Seymour Street Oyster Property Group 50 Collyer Quay
invest@cromwell.com.au 200 Mary Street 167 Macquarie Street London, W1H 7JW Level 2, 14 Normanby Road, #07-02 OUE Bayfront Singapore
www.cromwell.com.au Brisbane QLD 4000 Sydney NSW 2000 UK Auckland, New Zealand 049321
1) Based on CMW closing share price of $1.18 as at 26 February 2020
CROMWELL PROPERTY GROUP 35Additional
Information
CROMWELL PROPERTY GROUPAppendices
Contents
38 Cromwell Property Group Statistics
39 Local European Footprint
40 HY20 Operating and Statutory Profit - Reconciliation
41 Segment Result - Operating Earnings Detail
42 Property Portfolio - Top 10 Assets
43 Property Portfolio - Top 20 Leases
44-46 Property Portfolio - Net Property Income
47 Property Portfolio - Movement in Book Value
48 Property Portfolio - Debt Platform Facility Details
CROMWELL PROPERTY GROUP 37Cromwell Property Group Statistics
All group statistics as at 31 December 2019
Portfolio
Broad and Deep Property Platform Geographic and Culturally Diverse Team Global Portfolio by Sector and Geography
AUM by Sector
$ 11.9bn 3.4%
AUM
420+
3.4%
12.7% Office
people Retail
$11.9bn Industrial / Logistics
254
15.8%
64.7% Property Securities
properties Other
14
countries
AUM by Geography
3.6m+ 7.2%
sqm
29 Europe
offices
$11.9bn 51.2% Australia
3,585
41.6%
New Zealand
tenant
customers
CROMWELL PROPERTY GROUP 38Local European Footprint
19 regional offices providing on the ground local market knowledge and expertise
Office Locations European Portfolio by Geography
5%
5%
UK
30% 10%
Germany
Nordics
€3.8bn 12% France
Italy
Benelux
23% 15%
CEE
European Portfolio by Sector
5%
22% Office
€3.8bn
Retail
51%
Industrial/Logistics
Other
22%
CROMWELL PROPERTY GROUP 39HY20 Operating and Statutory Profit Reconciliation
HY20 ($M) HY19 ($M)
Profit from operations 134.1 82.6
Operating EPS (cents per security) 5.18 cps 4.10 cps
Gain on sale of investment properties 2.9 -
Loss on disposal of other assets (2.8) -
Operating lease costs 1.8 -
Other transaction costs (17.2) -
Fair value net gains / (write-downs) Investment properties 110.1 44.4
Derivative financial instruments (3.8) 16.1
Recievables at fair value through profit or loss 18.7
Investments at fair value through profit or loss 1.5 (2.0)
Non-cash property investment income / (expense) Straight-line lease income 5.5 6.1
Lease incentive amortisation (11.8) (9.3)
Lease cost amortisation (2.2) (0.8)
Other non-cash expenses: Amortisation of finance costs (5.1) (3.9)
Finance costs attributable to lease incentives (0.3) -
Relating to equity accounted investments 1 (4.6) 2.6
Decrease in recoverable amounts - (0.2)
Amortisation and depreciation 2 (3.5) (1.1)
Net exchange / (loss) on foreign currency borrowings 9.8 (12.2)
Net foreign exchange losses - (3.9)
Net tax losses utilised 3 (5.8) (7.3)
Profit for the year 227.3 111.1
Statutory EPS (cents per security) 8.78 cps 5.52 cps
1. Comprises fair value adjustments and other non-operating items included in share of profit of equity accounted entities
2. Comprises depreciation of plant and equipment and right-of-use assets and amortisation of intangible assets
3. Comprises tax expense attributable to changes in deferred tax assets recognised as a result of carried forward tax losses and other relevant tax-related adjustments
CROMWELL PROPERTY GROUP 40Segment Result – Operating Earnings Detail
Direct Property Indirect Property Funds And Asset
Full Year ending 31 December 2019 Investment Investment Management
($M) ($M) ($M) HY20
Segment revenue
Rental income and recoverable outgoings 114.1 11.5 - 125.6
Operating profits of equity accounted investments - 26.0 0.9 26.9
Development sales and fees1 32.0 - - 32.0
Funds and asset management fees - - 82.1 82.1
Distributions - 1.4 - 1.4
Total segment revenue and other income 146.1 38.9 83.0 268.0
Segment expenses
Property expenses (20.8) (5.7) - (26.5)
Funds and asset management direct costs - (0.7) (42.4) (43.1)
Other expenses (0.7) (2.1) (6.5) (9.3)
Total segment expenses (21.5) (8.5) (48.9) (78.9)
EBITDA 124.6 30.4 34.1 189.1
Finance costs (18.9) (4.6) (3.0) (26.5)
Segment profit after finance costs 105.7 25.8 31.1 162.6
Unallocated items
Finance income 2.9
Corporate costs2 (21.1)
Income tax expense (10.3)
Segment profit 134.1
Weighted Average Securities on Issue ('000) 2,589.9
1. In accordance with the relevant accounting policy, the development revenue of $32.0 million has been recognized due to the performance obligations inherent in the relevant contract being fully satisfied during the period
2. Includes non-segment specific corporate costs pertaining to Group level functions such as finance and tax, legal, risk and compliance, corporate secretarial, marketing and other corporate services
CROMWELL PROPERTY GROUP 41Top 10 Assets1
Property Portfolio
Current
Market Value Occupancy %
Asset State Class ($M) Cap Rate by NLA WALE Major Tenants
Qantas HQ NSW Office 535.0 5.00% 100.0% 11.8 years Qantas Airways Limited
400 George Street QLD Office 524.8 5.50% 99.6% 4.8 years QLD Government, Federal Government
700 Collins Street VIC Office 337.0 5.00% 99.8% 5.7 years Bureau of Meteorology, Metro Trains
Kent Street, Sydney NSW Office 305.0 6.25% 100.0% 3.8 years Symantec, Mann Judd, Hajoti
McKell Building NSW Office 300.0 5.00% 100.0% 8.5 years NSW State Government
Soward Way ACT Office 280.7 5.25% 100.0% 12.7 years Federal Government
HQ North Tower QLD Office 242.1 6.00% 98.5% 5.0 years AECOM, TechnologyOne, CS Energy
Victoria Avenue NSW Office 238.0 5.75% 92.2% 3.0 years Reed Elsevier, Leighton Contractors, Ventia
200 Mary Street QLD Office 100.0 6.25% 98.5% 2.1 years Secure Parking, Cromwell, Logicamms
Station Street, Penrith NSW Office 49.0 6.50% 100.0% 8.5 years NSW State Government
Total Top 10 Assets 2,911.6 5.46% 99.0% 6.8 years
Balance of Portfolio 244.5 7.21% 74.2% 2.7 years
Total 3,156.1 5.63% 92.5% 6.1 years
1. Relating to Australian balance sheet properties only
CROMWELL PROPERTY GROUP 42Top 20 Leases1
Property Portfolio
Tenant Tenant Classification Expiry Date % of Portfolio Rental Income
Qantas Airways Limited Listed Company/Subsidiary Dec-32 13.7%
Commonwealth of Australia (Dept of Social Services) Government Authority Sep-32 7.6%
Calvary Healthcare Adelaide PTY LTD Private Company Feb-20 7.2%
QLD State Government Government Authority Dec-26 7.1%
Government Property NSW Government Authority Jun-28 6.7%
Bureau of Meteorology Government Authority Jul-26 3.8%
Therapeutic Goods Administration Government Authority Jun-22 3.5%
Commonwealth of Australia (Dept of Human Services) Government Authority Sep-21 3.4%
AECOM Australia Pty Ltd Listed Company/Subsidiary Sep-25 3.1%
TechnologyOne Limited Listed Company/Subsidiary Apr-25 2.9%
Metro Trains Melbourne Pty Ltd Private Company Feb-25 2.6%
Symantec (Australia) Pty Ltd Listed Company/Subsidiary Jul-21 2.1%
Government Property NSW Government Authority Jun-28 1.7%
CGW Nominees Private Company Sep-24 1.6%
Government Property NSW Government Authority Jun-28 1.5%
Reed Elsevier Australia Pty Limited Listed Company/Subsidiary Dec-25 1.2%
Commonwealth of Australia (ANAO) Government Authority Jan-20 1.2%
Reed Elsevier Australia Pty Limited 1 Listed Company/Subsidiary Dec-20 1.2%
Government Property NSW Government Authority Jun-28 1.1%
Ventia Pty Ltd Private Company Feb-23 1.1%
74.3%
1. Relating to Australian balance sheet properties only
CROMWELL PROPERTY GROUP 43Net Property Income1
Property Portfolio
HY20 ($M) HY19 ($M) Variance ($M) Variance (%)
Station Street, Penrith 1,521,197 1,272,650 248,547 19.5%
McKell Building 6,898,711 5,840,275 1,058,436 18.1%
Crown Street, Wollongong 1,472,851 1,374,103 98,748 7.2%
Bull Street, Newcastle 904,424 863,759 40,665 4.7%
Qantas HQ 14,873,893 14,327,854 546,039 3.8%
Village Cinema Geelong 758,414 744,450 13,964 1.9%
700 Collins Street 8,283,913 8,206,470 77,443 0.9%
Soward Way, Greenway 7,595,928 7,682,017 (86,089) (1.1%)
HQ North Tower 8,147,699 8,481,241 (333,542) (3.9%)
Core Total 50,457,030 48,792,819 1,664,211 3.4%
HY20 ($M) HY19 ($M) Variance ($M) Variance (%)
Oracle Building 1,234,942 1,024,888 210,054 20.5%
200 Mary Street 3,782,440 3,416,156 366,284 10.7%
TGA Complex 3,718,470 3,595,890 122,580 3.4%
Kent Street, Sydney 8,200,769 7,962,523 238,246 3.0%
Regent Cinema 676,614 664,072 12,542 1.9%
Victoria Avenue 6,267,289 6,735,373 (468,084) (6.9%)
Core+ Total 23,880,524 23,398,902 481,622 2.1%
1. Includes only Australian balance sheet properties held for all of HY20 and HY19.
CROMWELL PROPERTY GROUP 44Net Property Income1
Property Portfolio
HY20 ($M) HY19 ($M) Variance ($M) Variance (%)
Wakefield St, Adelaide 8,699,613 3,526,674 5,172,939 146.7%
Borrowdale House (50,056) (51,945) 1,889 (3.6%)
Tuggeranong Office Park - Car Park (347,973) (389,434) 41,461 (10.6%)
19 National Circuit 1,097,927 1,365,955 (268,028) (19.6%)
Lovett Tower (283,518) 1,078,929 (1,362,447) (126.3%)
Active Total 9,115,993 5,530,179 3,585,814 64.8%
TOTAL HELD PROPERTIES 83,453,546 77,721,900 5,731,647 7.4%
ACQUISITIONS / DISPOSALS
Cromwell Polish Retail Fund 5,771,943 - 5,771,943 N/A
George Street, Brisbane 9,305,289 - 9,305,289 N/A
Farrer Place, Queanbeyan 730,500 1,002,696 (272,196) (27.1%)
Sturton Rd, Edinburgh Park (60) (3,711) 3,651 (98.4%)
Tuggeranong Office Park - 764,477 (764,477) (100.0%)
ADJUSTMENTS
Car Parking / Mary St Hub 372,035 346,000 26,035 7.5%
Consolidation adjustments / eliminations 3,083,180 2,465,652 617,528 25.0%
TOTAL NET PROPERTY INCOME 102,716,434 82,297,014 20,419,420 24.8%
1. Includes only Australian balance sheet properties held for all of HY20 and HY19.
CROMWELL PROPERTY GROUP 45Movement In Book Value
Property Portfolio
Strategy of continuously improving portfolio through acquisitions since 2010
Recycling of capital means disposing of assets before asset has large capex requirements
In-sourced facilities management model also lowers lifecycle capex
HY20 FY19 FY18 FY17 FY16 FY15 FY14 FY13 FY12 FY11 FY10
($M) ($M) ($M) ($M) ($M) ($M) ($M) ($M) ($M) ($M) ($M)
Opening balance 2,520.9 2,451.1 2,357.8 2,274.0 2,101.0 2,249.5 2,396.0 1,724.4 1,444.9 1,064.1 1,117.2
Acquisitions1 1,275.9 - 51.8 - - 8.0 - 661.3 263.4 322.4 -
Construction costs - - 13.6 92.3 47.2 - - - - - -
Finance costs capitalised - - 1.1 4.4 - - - - - - -
Property Improvements 7.7 21.9 6.7 9.2 2.1 16.5 44.5 76.3 50.2 40.4 1.3
Lifecycle Capex 2.6 1.9 2.5 3.0 2.6 6.8 6.8 6.3 2.6 3.0 2.2
Disposals (32.0) (54.5) (89.3) (87.1) (150.9) (205.8) (250.0) (42.4) (39.3) (33.7) (22.1)
Transferred to held for sale - - (0.9) (69.5) - (36.6) - - - - -
Straight line lease income 5.5 9.3 27.8 3.6 2.3 5.5 5.6 6.0 6.9 4.9 0.8
Lease costs and incentives 50.1 25.6 22.1 22.8 21.7 37.7 11.9 29.3 15.8 15.9 2.2
Amortisation of leasing costs and
incentives (14.0) (20.8) (19.5) (19.9) (15.2) (13.0) (11.6) (9.5) (7.7) (5.8) (5.4)
Net gain/(loss) from fair value adjustments 110.1 86.4 77.4 125.0 263.2 32.4 46.3 (55.7) (12.4) 33.7 (32.1)
Net foreign exchange loss (0.1)
Closing Balance 3,926.7 2,520.9 2,451.1 2,357.8 2,274.0 2,101.0 2,249.5 2,396.0 1,724.4 1,444.9 1,064.1
Lifecycle Capex as a % on average
assets 0.08% 0.08% 0.10% 0.13% 0.12% 0.31% 0.29% 0.31% 0.16% 0.24% 0.20%
1. Includes CPRF
CROMWELL PROPERTY GROUP 46Balance Sheet Debt Details
Property Portfolio
Drawn Commitment Maturity Fin Yr Years
Facility Covenants
(AUD $M) (AUD $M) Date Expiry Remaining
Jun-2023
Bank 1 - 5 Year Facility 100.0 100.0 2023 3.5
Bank 2 - 5 Year Facility 250.0 250.0 Jun-2023 2023 3.5
Bank 3 - 5 Year Facility 250.0 250.0 Jun-2023 2023 3.5
Bank 4 - 5 Year Facility - 150.0 Jun-2023 2023 3.5 LVR 60%
Bank 5 - 5 Year Facility 200.0 200.0 Jun-2024 2024 4.5 ICR 2.0 x
Bank 6 - 5 Year Facility 100.0 100.0 Jun-2023 2023 3.5 WALE 3.0 yrs
Bank 7 - 5 Year Facility 75.0 75.0 Jun-2023 2023 3.5
Bank 8 - 5 Year Facility - 50.0 Jun-2023 2023 3.5
Bank 9 - 5 Year Facility 87.0 125.0 Jun-2023 2023 3.5
Bank 10 - 7 Year Facility 60.0 60.0 Jun-2026 2026 6.5
Syndicated Debt Platform 1,122.0 1,360.0 3.8 yrs
Euro Syndicated Facility 309.1 359.8 Sept-2022 2023 2.7 yrs Gearing ratio 65%; ICR 2.0 x
Projected ICR 130%, Projected Debt Cover
International Bank 180.6 186.3 Feb-2021 2021 1.2 120%; Historical Debt Cover 130%; LTV 75%
International Bank 178.4 178.4 Feb-2-23 2023 3.1 LTV 60%; DSCR 220%
CPRF Facilities 359.0 364. 7 2.1 yrs
Euro - 3 Year Facility 7.5 7.5 May 2022 2022 2.4 yrs LVR 60%; ICR 2.0 x; LTC 50% until PC
2020 Convertible Bond 87.5 87.5 Feb-2020 2020 0.1 yrs
2025 Convertible Bond 350.3 350.3 Mar-2025 2025 5.2 yrs
Lease liabilities 14.0 14.0 Various Various
TOTAL 2,249.4 2,543.8 4.2 yrs
CROMWELL PROPERTY GROUP 47CROMWELL PROPERTY GROUP
You can also read


